Embed Size (px)
Citation preview
12 July 2018
British Social Attitudes Survey 2017: Public attitudes towards transport
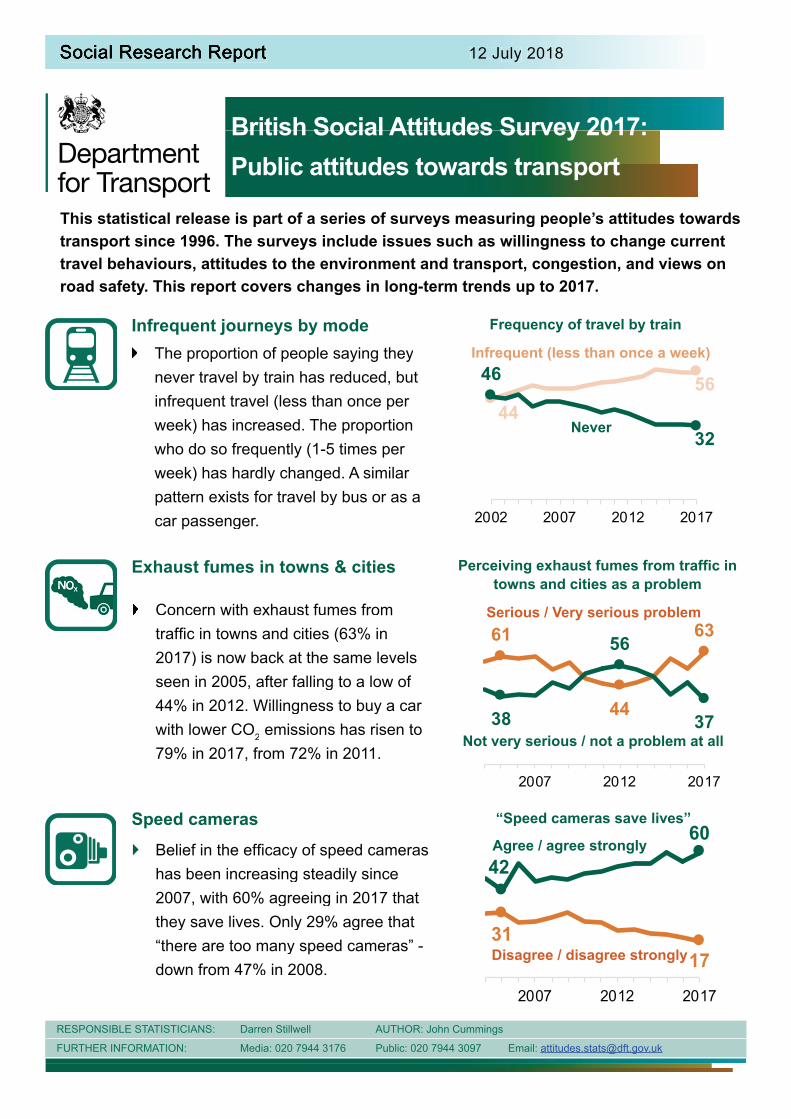
This statistical release is part of a series of surveys measuring people’s attitudes towards transport since 1996. The surveys include issues such as willingness to change current travel behaviours, attitudes to the environment and transport, congestion, and views on road safety. This report covers changes in long-term trends up to 2017.
Infrequent journeys by modeThe proportion of people saying they never travel by train has reduced, but infrequent travel (less than once per week) has increased. The proportion who do so frequently (1-5 times per week) has hardly changed. A similar pattern exists for travel by bus or as a car passenger.
Frequency of travel by train
445646
32
2002 2007 2012 2017
Exhaust fumes in towns & cities
Concern with exhaust fumes from
2017) is now back at the same levelsseen in 2005, after falling to a low of 44% in 2012. Willingness to buy a car with lower CO2 emissions has risen to79% in 2017, from 72% in 2011.
towns and cities as a problem
61
44
63
38
56
37
2007 2012 2017
Speed cameras
has been increasing steadily since 2007, with 60% agreeing in 2017 that they save lives. Only 29% agree that “there are too many speed cameras” - down from 47% in 2008.
42
60
3117
2007 2012 2017
Disagree / disagree strongly
RESPONSIBLE STATISTICIANS: Darren Stillwell AUTHOR: John Cummings
FURTHER INFORMATION: Media: 020 7944 3176 Public: 020 7944 3097 Email: [email protected]
Infrequent (less than once a week)
Never
Serious / Very serious problem
Not very serious / not a problem at all
“Speed cameras save lives”
Agree / agree strongly
British Social Attitudes Survey 2017: Public attitudes to transport - Page 2
Section 1: Current travel behaviours and willingness to change p. 3
Current travel behaviours: how do people travel?
Willingness to switch to more sustainable modes of transport
Opinions on cycling safety
Section 2: Attitudes to transport and the environment p. 5
Transport and climate change
Willingness to change travel behaviour for the environment
Opinions on the environment and plane travel
Section 3: Cars: environment, congestion, road building, exhaust fumes p. 8
Opinions on the environment and car travel
Opinions on congestion
Opinions on road building
Opinions on exhaust fumes
Section 4: Attitudes to road safety p.10
Opinions on road safety and drink driving
Opinions on road safety and mobile phone use
Opinions on road safety and speed cameras
Opinions on residential streets
Background information p. 13
Conten s
About these statistics
The British Social Attitudes Survey (BSA) is conducted by the National Centre for Social Research and includes questions on attitudes towards transport sponsored by the Department for Transport. It is a representative survey of adults aged 18 and over in Great Britain, collecting data through a combination of face-to-face interviews and self-completion questionnaires. Thelatest data for this report was collected in 2017. Some attitudes change very slowly; a relatively small sample means that other responses show yearly change due to sampling variability, which
British Social Attitudes Survey 2017: Public attitudes to transport - Page 3
Current travel behaviours and willingness to change
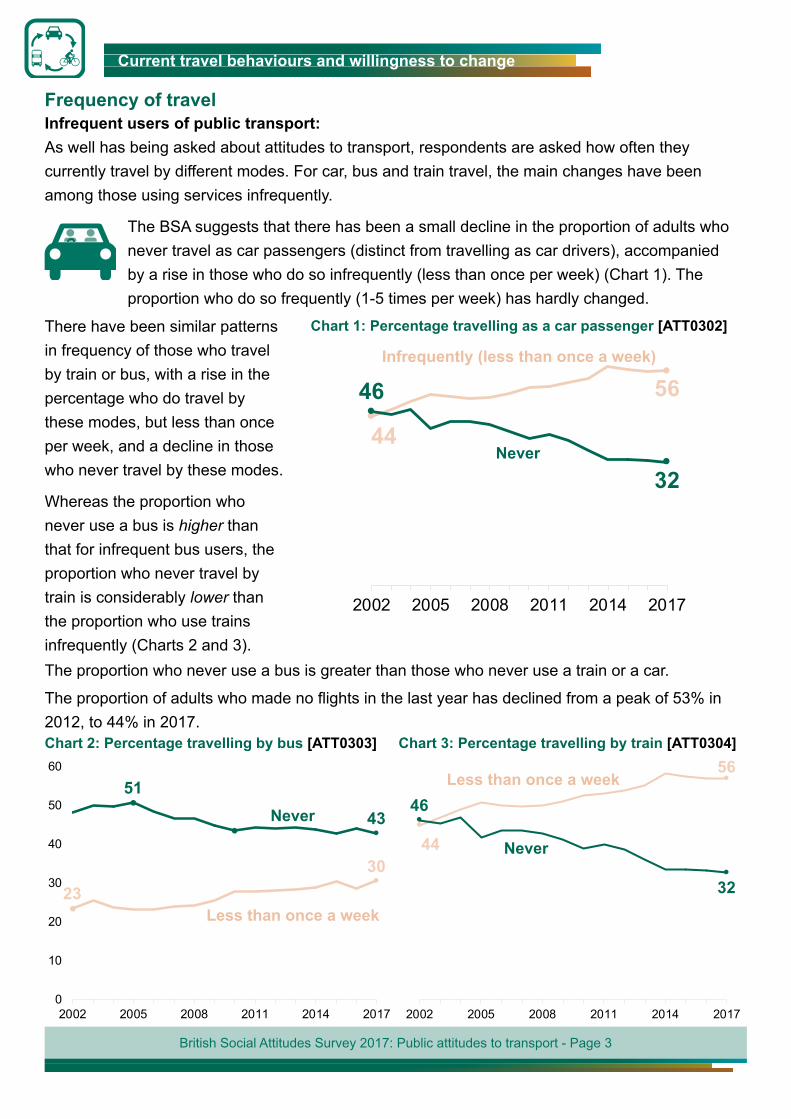
Frequency of travelInfrequent users of public transport: As well has being asked about attitudes to transport, respondents are asked how often they currently travel by different modes. For car, bus and train travel, the main changes have been among those using services infrequently.
The BSA suggests that there has been a small decline in the proportion of adults who never travel as car passengers (distinct from travelling as car drivers), accompanied by a rise in those who do so infrequently (less than once per week) (Chart 1). The proportion who do so frequently (1-5 times per week) has hardly changed.
There have been similar patterns in frequency of those who travel by train or bus, with a rise in the percentage who do travel by these modes, but less than once per week, and a decline in those who never travel by these modes.
Whereas the proportion who never use a bus is higher than that for infrequent bus users, the proportion who never travel by train is considerably lower than the proportion who use trains infrequently (Charts 2 and 3).
Chart 1: Percentage travelling as a car passenger [ATT0302]
44
5646
32
2002 2005 2008 2011 2014 2017
The proportion who never use a bus is greater than those who never use a train or a car.
The proportion of adults who made no flights in the last year has declined from a peak of 53% in 2012, to 44% in 2017.Chart 2: Percentage travelling by bus [ATT0303] Chart 3: Percentage travelling by train [ATT0304]
51
43
2330
0
10
20
30
40
50
60
2002 2005 2008 2011 2014 2017
44
56
46
32
2002 2005 2008 2011 2014 2017
Less than once a week
Never
Less than once a week
Never
Infrequently (less than once a week)
Never
British Social Attitudes Survey 2017: Public attitudes to transport - Page 4
Current travel behaviours and willingness to change
Willingness to change
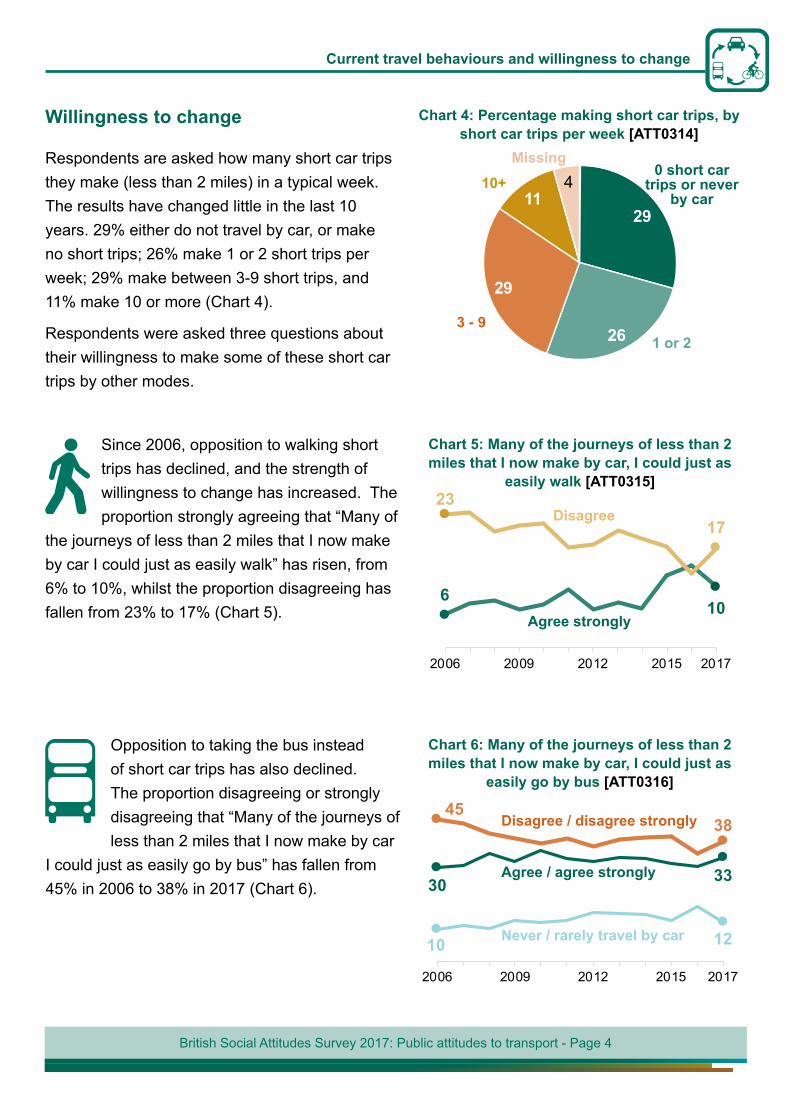
Respondents are asked how many short car trips they make (less than 2 miles) in a typical week. The results have changed little in the last 10 years. 29% either do not travel by car, or make no short trips; 26% make 1 or 2 short trips per week; 29% make between 3-9 short trips, and 11% make 10 or more (Chart 4).
Respondents were asked three questions about their willingness to make some of these short car trips by other modes.
Chart 4: Percentage making short car trips, by short car trips per week [ATT0314]
29
26
29
114
0 short car trips or never
by car
1 or 23 - 9
10+Missing
Since 2006, opposition to walking short trips has declined, and the strength of willingness to change has increased. The proportion strongly agreeing that “Many of
the journeys of less than 2 miles that I now make by car I could just as easily walk” has risen, from 6% to 10%, whilst the proportion disagreeing has fallen from 23% to 17% (Chart 5).
Chart 5: Many of the journeys of less than 2 miles that I now make by car, I could just as
easily walk [ATT0315]
Disagree
Agree strongly
610
2317
2006 2009 2012 2015 2017
Opposition to taking the bus instead of short car trips has also declined. The proportion disagreeing or strongly disagreeing that “Many of the journeys of less than 2 miles that I now make by car
I could just as easily go by bus” has fallen from 45% in 2006 to 38% in 2017 (Chart 6).
Chart 6: Many of the journeys of less than 2 miles that I now make by car, I could just as
easily go by bus [ATT0316]
4538
30 33
10 12
2006 2009 2012 2015 2017
Disagree / disagree strongly
Agree / agree strongly
Never / rarely travel by car
British Social Attitudes Survey 2017: Public attitudes to transport - Page 5
Current travel behaviours and willingness to change
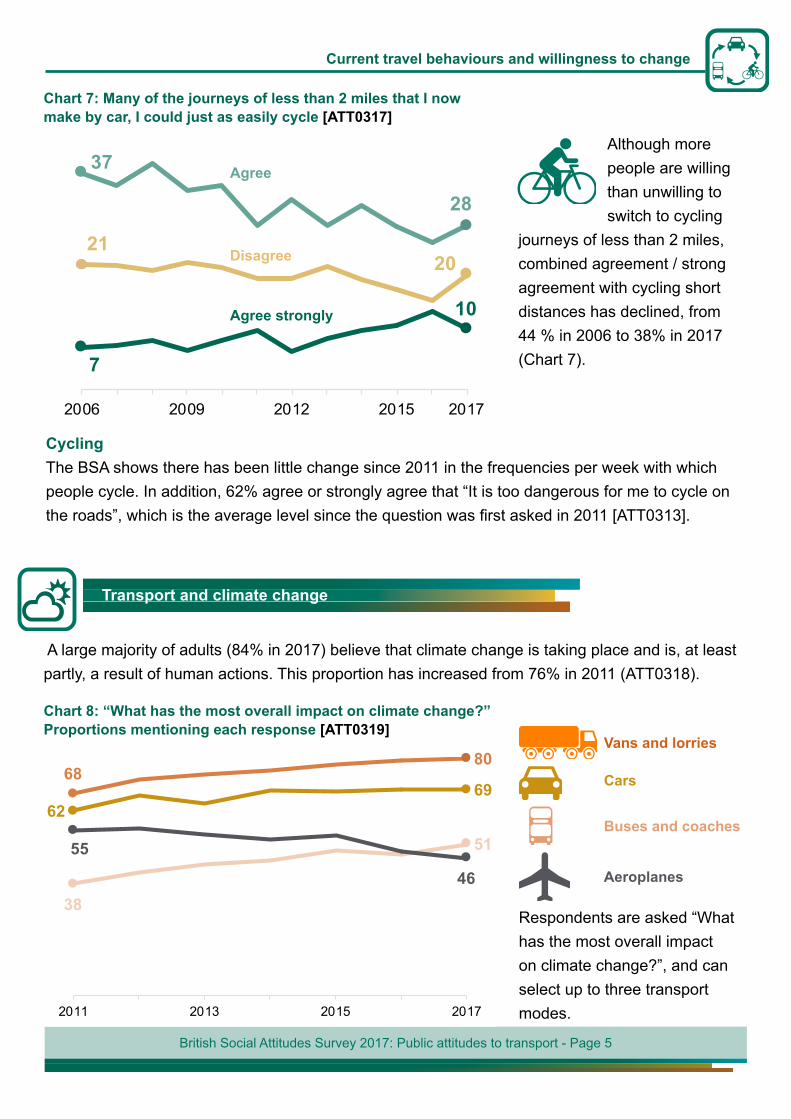
Although more people are willing than unwilling to switch to cycling
journeys of less than 2 miles, combined agreement / strong agreement with cycling short distances has declined, from 44 % in 2006 to 38% in 2017 (Chart 7).
Chart 7: Many of the journeys of less than 2 miles that I now make by car, I could just as easily cycle [ATT0317]
7
10
37
28
2120
2006 2009 2012 2015 2017
CyclingThe BSA shows there has been little change since 2011 in the frequencies per week with which people cycle. In addition, 62% agree or strongly agree that “It is too dangerous for me to cycle on the roads”, which is the average level since the question was first asked in 2011 [ATT0313].
Transport and climate change
A large majority of adults (84% in 2017) believe that climate change is taking place and is, at least partly, a result of human actions. This proportion has increased from 76% in 2011 (ATT0318).
Respondents are asked “What has the most overall impact on climate change?”, and can select up to three transport modes.
Chart 8: “What has the most overall impact on climate change?” Proportions mentioning each response [ATT0319]
6269
38
51
6880
55
46
2011 2013 2015 2017
Vans and lorries
Cars
Buses and coaches
Aeroplanes
Agree strongly
Disagree
Agree
British Social Attitudes Survey 2017: Public attitudes to transport - Page 6
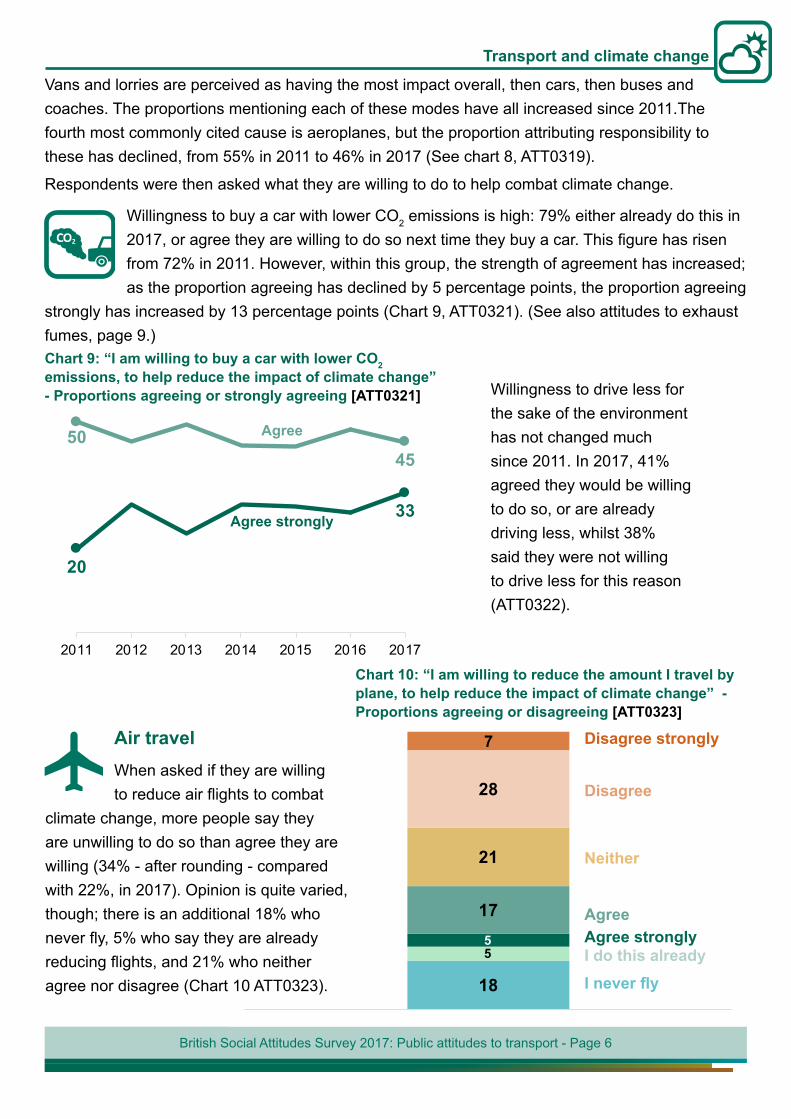
Vans and lorries are perceived as having the most impact overall, then cars, then buses and coaches. The proportions mentioning each of these modes have all increased since 2011.The fourth most commonly cited cause is aeroplanes, but the proportion attributing responsibility to these has declined, from 55% in 2011 to 46% in 2017 (See chart 8, ATT0319).
Respondents were then asked what they are willing to do to help combat climate change.
Willingness to buy a car with lower CO2 emissions is high: 79% either already do this in 2017, or agree they are willing to do so next time they buy a car. This figure has risen from 72% in 2011. However, within this group, the strength of agreement has increased; as the proportion agreeing has declined by 5 percentage points, the proportion agreeing
strongly has increased by 13 percentage points (Chart 9, ATT0321). (See also attitudes to exhaust fumes, page 9.)
Transport and climate change
Chart 9: “I am willing to buy a car with lower CO2 emissions, to help reduce the impact of climate change” - Proportions agreeing or strongly agreeing [ATT0321]
5045
20
33
2011 2012 2013 2014 2015 2016 2017
Willingness to drive less for the sake of the environment has not changed much since 2011. In 2017, 41% agreed they would be willing to do so, or are already driving less, whilst 38% said they were not willing to drive less for this reason (ATT0322).
Air travel
Agree strongly
Agree
18
55
17
21
28
7
When asked if they are willing to reduce air flights to combat
climate change, more people say they are unwilling to do so than agree they are willing (34% - after rounding - compared with 22%, in 2017). Opinion is quite varied, though; there is an additional 18% who never fly, 5% who say they are already reducing flights, and 21% who neither agree nor disagree (Chart 10 ATT0323).
Chart 10: “I am willing to reduce the amount I travel by plane, to help reduce the impact of climate change” - Proportions agreeing or disagreeing [ATT0323]
Disagree
Neither
Agree Agree strongly I do this already I never fly
Disagree strongly
British Social Attitudes Survey 2017: Public attitudes to transport - Page 7
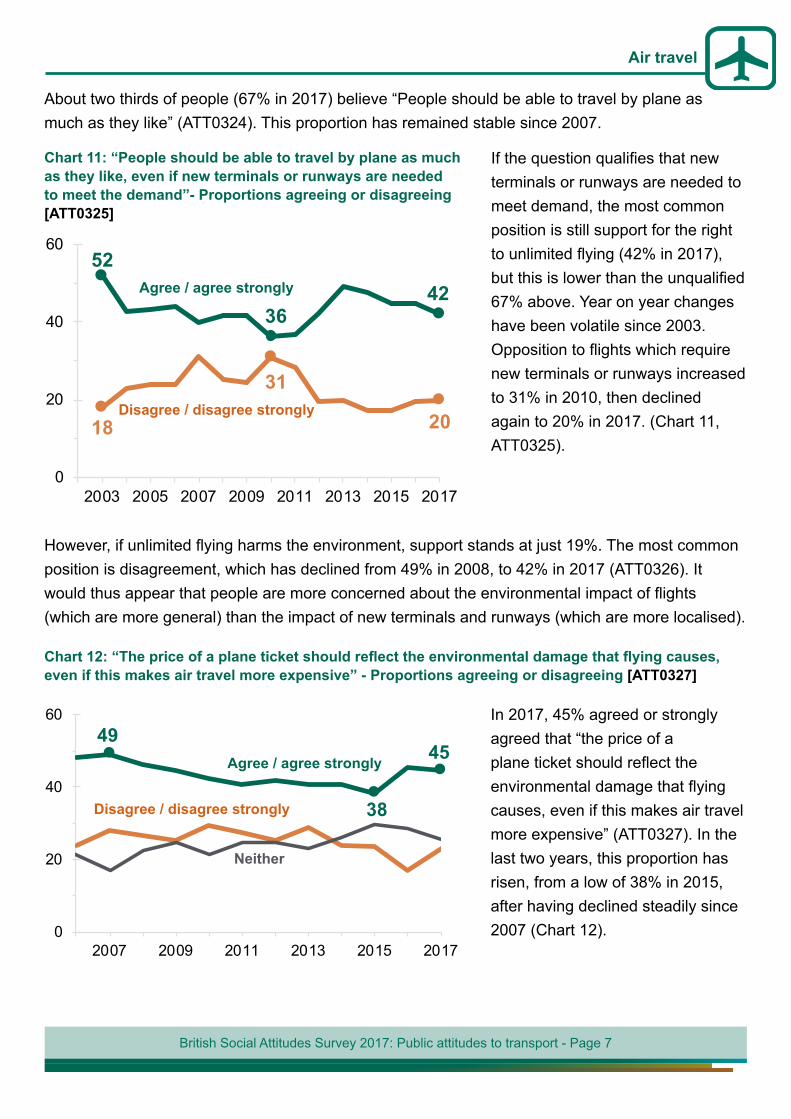
About two thirds of people (67% in 2017) believe “People should be able to travel by plane as much as they like” (ATT0324). This proportion has remained stable since 2007.
Chart 11: “People should be able to travel by plane as much as they like, even if new terminals or runways are needed to meet the demand”- Proportions agreeing or disagreeing [ATT0325]
Air travel
52
3642
18
31
20
0
20
40
60
2003 2005 2007 2009 2011 2013 2015 2017
If the question qualifies that new terminals or runways are needed to meet demand, the most common position is still support for the right to unlimited flying (42% in 2017), but this is lower than the unqualified 67% above. Year on year changes have been volatile since 2003. Opposition to flights which require new terminals or runways increased to 31% in 2010, then declined again to 20% in 2017. (Chart 11, ATT0325).
However, if unlimited flying harms the environment, support stands at just 19%. The most common position is disagreement, which has declined from 49% in 2008, to 42% in 2017 (ATT0326). It would thus appear that people are more concerned about the environmental impact of flights (which are more general) than the impact of new terminals and runways (which are more localised).
Chart 12: “The price of a plane ticket should reflect the environmental damage that flying causes, even if this makes air travel more expensive” - Proportions agreeing or disagreeing [ATT0327]
In 2017, 45% agreed or strongly agreed that “the price of a plane ticket should reflect the environmental damage that flying causes, even if this makes air travel more expensive” (ATT0327). In the last two years, this proportion has risen, from a low of 38% in 2015, after having declined steadily since 2007 (Chart 12).
49
38
45
0
20
40
60
2007 2009 2011 2013 2015 2017
Disagree / disagree strongly
Agree / agree strongly
Neither
Disagree / disagree strongly
Agree / agree strongly
British Social Attitudes Survey 2017: Public attitudes to transport - Page 8
Cars: Environment, congestion, roads
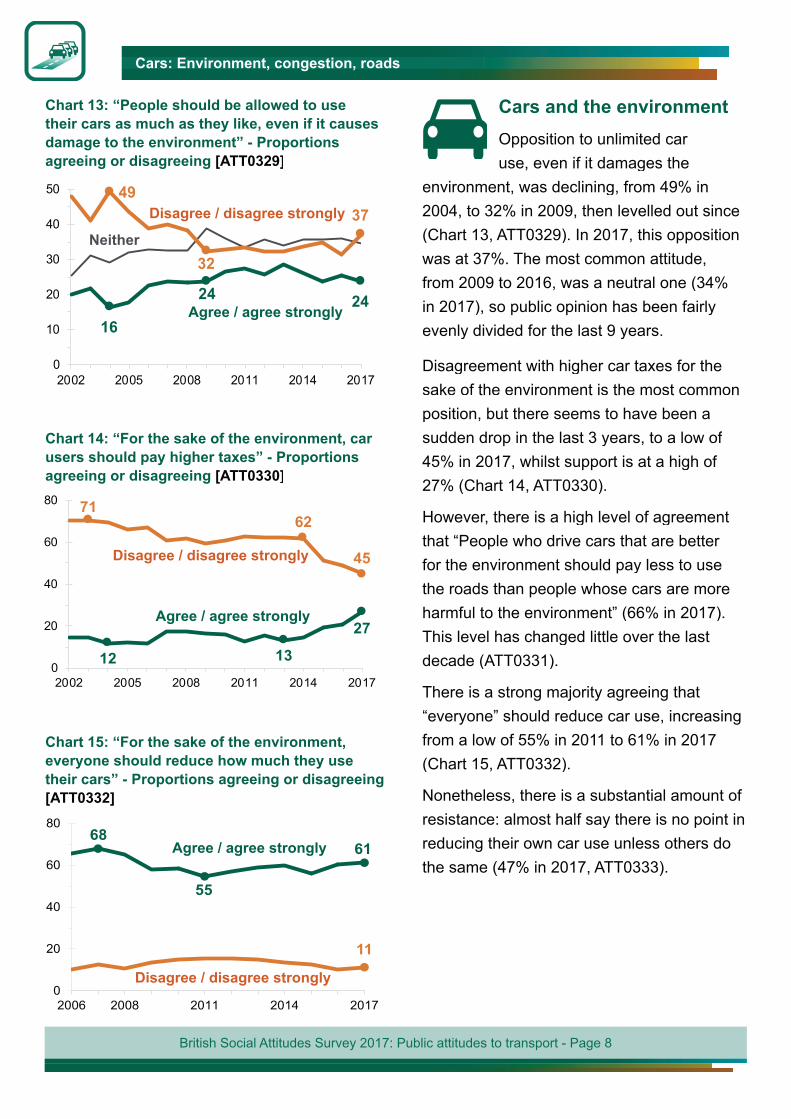
Cars and the environmentOpposition to unlimited car use, even if it damages the
environment, was declining, from 49% in2004, to 32% in 2009, then levelled out since(Chart 13, ATT0329). In 2017, this oppositionwas at 37%. The most common attitude,from 2009 to 2016, was a neutral one (34%in 2017), so public opinion has been fairlyevenly divided for the last 9 years.
Disagreement with higher car taxes for thesake of the environment is the most commonposition, but there seems to have been asudden drop in the last 3 years, to a low of 45% in 2017, whilst support is at a high of 27% (Chart 14, ATT0330).
However, there is a high level of agreementthat “People who drive cars that are better for the environment should pay less to use the roads than people whose cars are moreharmful to the environment” (66% in 2017). This level has changed little over the lastdecade (ATT0331).
There is a strong majority agreeing that“everyone” should reduce car use, increasingfrom a low of 55% in 2011 to 61% in 2017(Chart 15, ATT0332).
Nonetheless, there is a substantial amount of resistance: almost half say there is no point inreducing their own car use unless others dothe same (47% in 2017, ATT0333).
Chart 13: “People should be allowed to use their cars as much as they like, even if it causes damage to the environment” - Proportions agreeing or disagreeing [ATT0329]
49
32
37
16
24 24
0
10
20
30
40
50
2002 2005 2008 2011 2014 2017
Chart 14: “For the sake of the environment, car users should pay higher taxes” - Proportions agreeing or disagreeing [ATT0330]
7162
45
12 13
27
0
20
40
60
80
2002 2005 2008 2011 2014 2017
Disagree / disagree strongly
Agree / agree strongly
Chart 15: “For the sake of the environment, everyone should reduce how much they use their cars” - Proportions agreeing or disagreeing[ATT0332]AA
68
55
61
11
0
20
40
60
80
2006 2008 2011 2014 2017
Disagree / disagree strongly
Agree / agree strongly
Disagree / disagree strongly
Neither
Agree / agree strongly
British Social Attitudes Survey 2017: Public attitudes to transport - Page 9
Cars: Environment, congestion, roads
CongestionChart 16: Proportions perceiving motorway congestion as a problem [ATT0334]
22
37
7762
0
20
40
60
80
2005 2007 2009 2011 2013 2015 2017
Chart 17: Proportions perceiving congestion in towns and cities as a problem [ATT0335]
39
5661
44
0
20
40
60
80
2003 2005 2007 2009 2011 2013 2015 2017
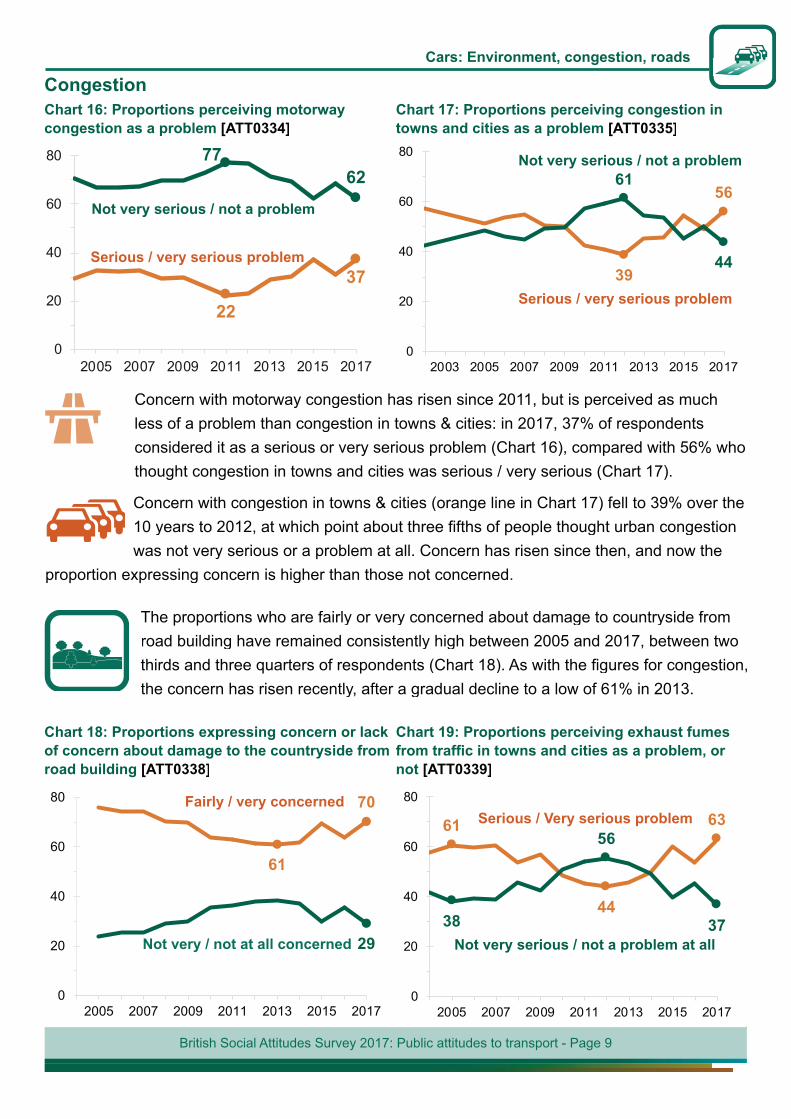
Concern with motorway congestion has risen since 2011, but is perceived as muchless of a problem than congestion in towns & cities: in 2017, 37% of respondentsconsidered it as a serious or very serious problem (Chart 16), compared with 56% whothought congestion in towns and cities was serious / very serious (Chart 17).
Concern with congestion in towns & cities (orange line in Chart 17) fell to 39% over the
was not very serious or a problem at all. Concern has risen since then, and now theproportion expressing concern is higher than those not concerned.
The proportions who are fairly or very concerned about damage to countryside fromroad building have remained consistently high between 2005 and 2017, between two
the concern has risen recently, after a gradual decline to a low of 61% in 2013.
Serious / very serious problem
Not very serious / not a problem
Chart 18: Proportions expressing concern or lack of concern about damage to the countryside from road building [ATT0338]
61
70
29
0
20
40
60
80
2005 2007 2009 2011 2013 2015 2017
Serious / very serious problem
Chart 19: Proportions perceiving exhaust fumes
not [ATT0339]
61
44
63
38
56
37
0
20
40
60
80
2005 2007 2009 2011 2013 2015 2017
Serious / Very serious problem
Not very serious / not a problem at allNot very / not at all concerned
Fairly / very concerned
Not very serious / not a problem
British Social Attitudes Survey 2017: Public attitudes to transport - Page 10
adults in 2005 who said it was serious, to a low of 44% in 2012—by which point, 56%said it was not serious. Since then, the proportions expressing concern have risen again,to 63% in 2017, so the proportions are similar to what they were in 2005 (Chart 19).
The results for 2015 and 2016 were both broadly consistent with this latest 5-year trend, but thesurvey suggested a sharper rise in concern in 2015, followed by a slight decline in 2016. It is
brought the question of air quality to greater public attention:
• In April, the UK Supreme Court ruled that the proportion of NO2 in the air breached EUlegislation
• In July, researchers at King’s College London published a report1 on the health impacts ofparticulates and NO2 from diesel fumes
• In September, the United States Environmental Protection Agency (EPA) issued a notice ofviolation of the Clean Air Act to the Volkswagen Group, which affected people’s perception ofthe impact of diesel fuel on NOX
• In July 2016, the mayor of London initiated a public consultation on a new Toxicity Charge forLondon, which came into effect in February 2017
How far any of these events actually affected public opinion on exhaust fumes is not clear,however.
Road safety: Alcohol, mobile phones, speed, residential streets
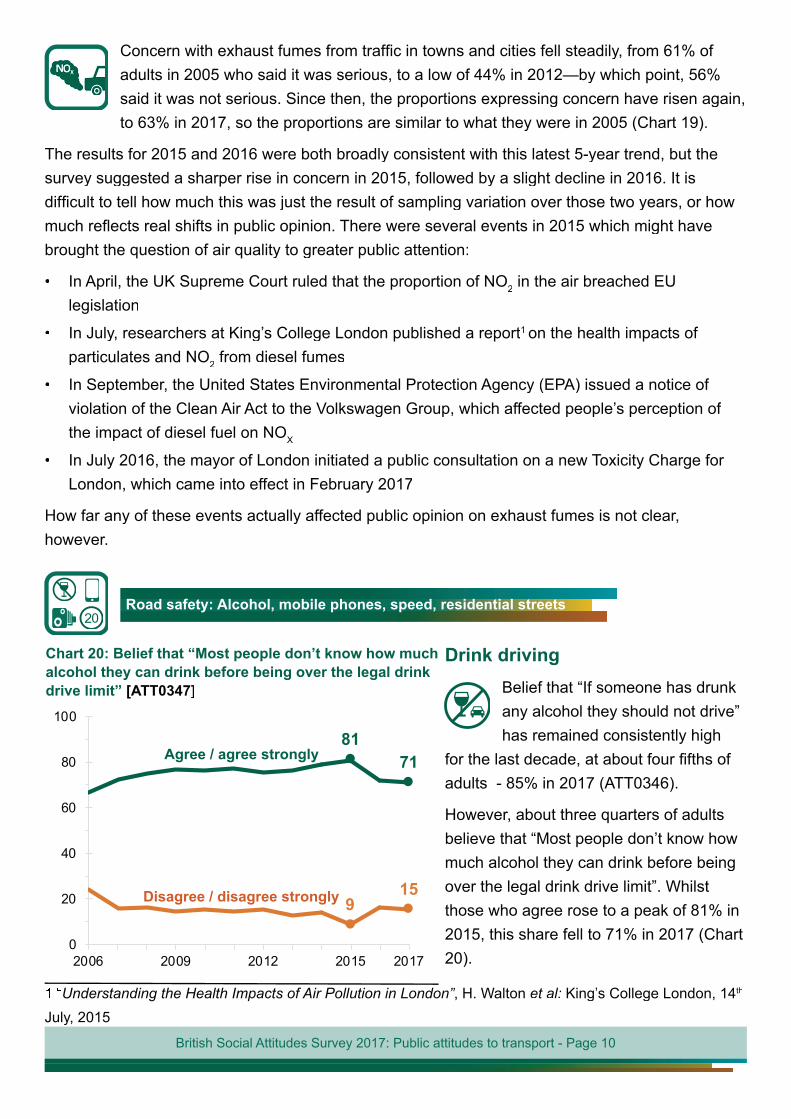
Drink drivingBelief that “If someone has drunkany alcohol they should not drive”has remained consistently high
adults - 85% in 2017 (ATT0346).
However, about three quarters of adults believe that “Most people don’t know howmuch alcohol they can drink before beingover the legal drink drive limit”. Whilst those who agree rose to a peak of 81% in2015, this share fell to 71% in 2017 (Chart20).
Chart 20: Belief that “Most people don’t know how much alcohol they can drink before being over the legal drink drive limit” [ATT0347]
8171
915
0
20
40
60
80
100
2006 2009 2012 2015 2017
Disagree / disagree strongly
Agree / agree strongly
Understanding the Health Impacts of Air Pollution in London”, H. Walton et al: King’s College London, 14th
July, 2015
British Social Attitudes Survey 2017: Public attitudes to transport - Page 11
Road safety: Alcohol, mobile phones, speed, residential streets
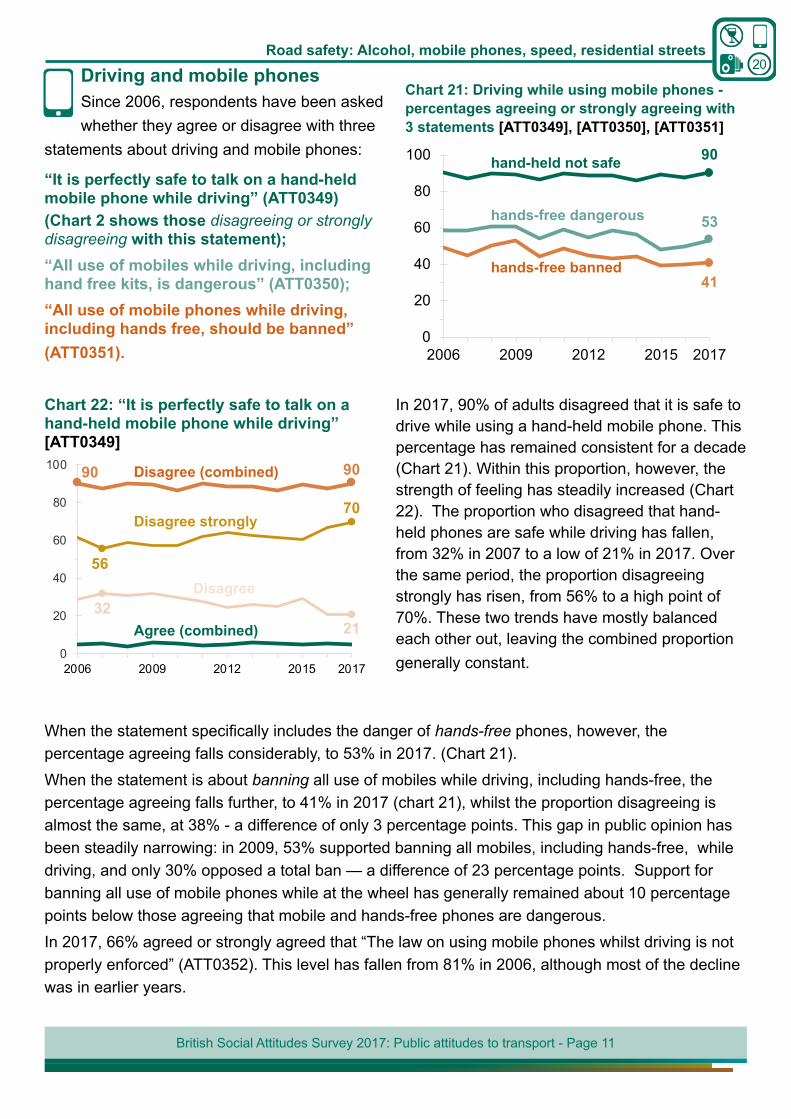
Driving and mobile phonesSince 2006, respondents have been asked whether they agree or disagree with three
statements about driving and mobile phones:
“It is perfectly safe to talk on a hand-held mobile phone while driving” (ATT0349)(Chart 2 shows those disagreeing or strongly disagreeing with this statement);“All use of mobiles while driving, including hand free kits, is dangerous” (ATT0350);“All use of mobile phones while driving, including hands free, should be banned” (ATT0351).
Chart 21: Driving while using mobile phones - percentages agreeing or strongly agreeing with 3 statements [ATT0349], [ATT0350], [ATT0351]
90
53
41
0
20
40
60
80
100
2006 2009 2012 2015 2017
hands-free banned
hands-free dangerous
hand-held not safe
In 2017, 90% of adults disagreed that it is safe to drive while using a hand-held mobile phone. This percentage has remained consistent for a decade (Chart 21). Within this proportion, however, the strength of feeling has steadily increased (Chart 22). The proportion who disagreed that hand-held phones are safe while driving has fallen, from 32% in 2007 to a low of 21% in 2017. Over the same period, the proportion disagreeing strongly has risen, from 56% to a high point of 70%. These two trends have mostly balanced each other out, leaving the combined proportion generally constant.
Chart 22: “It is perfectly safe to talk on a hand-held mobile phone while driving” [ATT0349]
90 90
56
70
3221
0
20
40
60
80
100
2006 2009 2012 2015 2017
Agree (combined)
Disagree (combined)
Disagree
Disagree strongly
When the statement specifically includes the danger of hands-free phones, however, the percentage agreeing falls considerably, to 53% in 2017. (Chart 21). When the statement is about banning all use of mobiles while driving, including hands-free, the percentage agreeing falls further, to 41% in 2017 (chart 21), whilst the proportion disagreeing is almost the same, at 38% - a difference of only 3 percentage points. This gap in public opinion has been steadily narrowing: in 2009, 53% supported banning all mobiles, including hands-free, while driving, and only 30% opposed a total ban — a difference of 23 percentage points. Support for banning all use of mobile phones while at the wheel has generally remained about 10 percentage points below those agreeing that mobile and hands-free phones are dangerous.In 2017, 66% agreed or strongly agreed that “The law on using mobile phones whilst driving is not properly enforced” (ATT0352). This level has fallen from 81% in 2006, although most of the decline was in earlier years.
British Social Attitudes Survey 2017: Public attitudes to transport - Page 12
Road safety: Alcohol, mobile phones, speed, residential streets
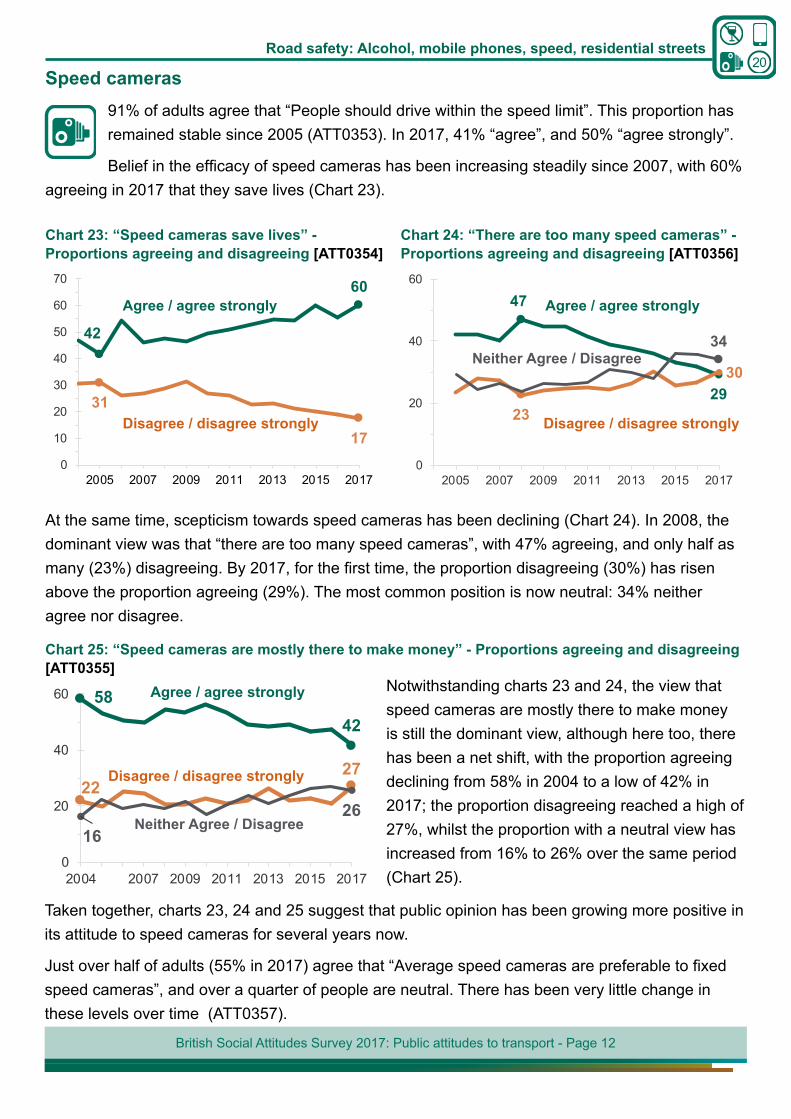
Speed cameras91% of adults agree that “People should drive within the speed limit”. This proportion has remained stable since 2005 (ATT0353). In 2017, 41% “agree”, and 50% “agree strongly”.
Belief in the efficacy of speed cameras has been increasing steadily since 2007, with 60% agreeing in 2017 that they save lives (Chart 23).
Chart 23: “Speed cameras save lives” - Proportions agreeing and disagreeing [ATT0354]
42
60
31
170
10
20
30
40
50
60
70
2005 2007 2009 2011 2013 2015 2017
Chart 24: “There are too many speed cameras” - Proportions agreeing and disagreeing [ATT0356]
47
2923
30
34
0
20
40
60
2005 2007 2009 2011 2013 2015 2017
Neither Agree / Disagree
Agree / agree strongly
Disagree / disagree strongly
At the same time, scepticism towards speed cameras has been declining (Chart 24). In 2008, the dominant view was that “there are too many speed cameras”, with 47% agreeing, and only half as many (23%) disagreeing. By 2017, for the first time, the proportion disagreeing (30%) has risen above the proportion agreeing (29%). The most common position is now neutral: 34% neither agree nor disagree.
Chart 25: “Speed cameras are mostly there to make money” - Proportions agreeing and disagreeing [ATT0355]
5842
2227
1626
0
20
40
60
2004 2007 2009 2011 2013 2015 2017
Notwithstanding charts 23 and 24, the view that speed cameras are mostly there to make money is still the dominant view, although here too, there has been a net shift, with the proportion agreeing declining from 58% in 2004 to a low of 42% in 2017; the proportion disagreeing reached a high of 27%, whilst the proportion with a neutral view has increased from 16% to 26% over the same period (Chart 25).
Taken together, charts 23, 24 and 25 suggest that public opinion has been growing more positive in its attitude to speed cameras for several years now.
Just over half of adults (55% in 2017) agree that “Average speed cameras are preferable to fixed speed cameras”, and over a quarter of people are neutral. There has been very little change in these levels over time (ATT0357).
Agree / agree strongly
Disagree / disagree strongly
Neither Agree / Disagree
Disagree / disagree strongly
Agree / agree strongly
British Social Attitudes Survey 2017: Public attitudes to transport - Page 13
Road safety: Alcohol, mobile phones, speed, residential streets
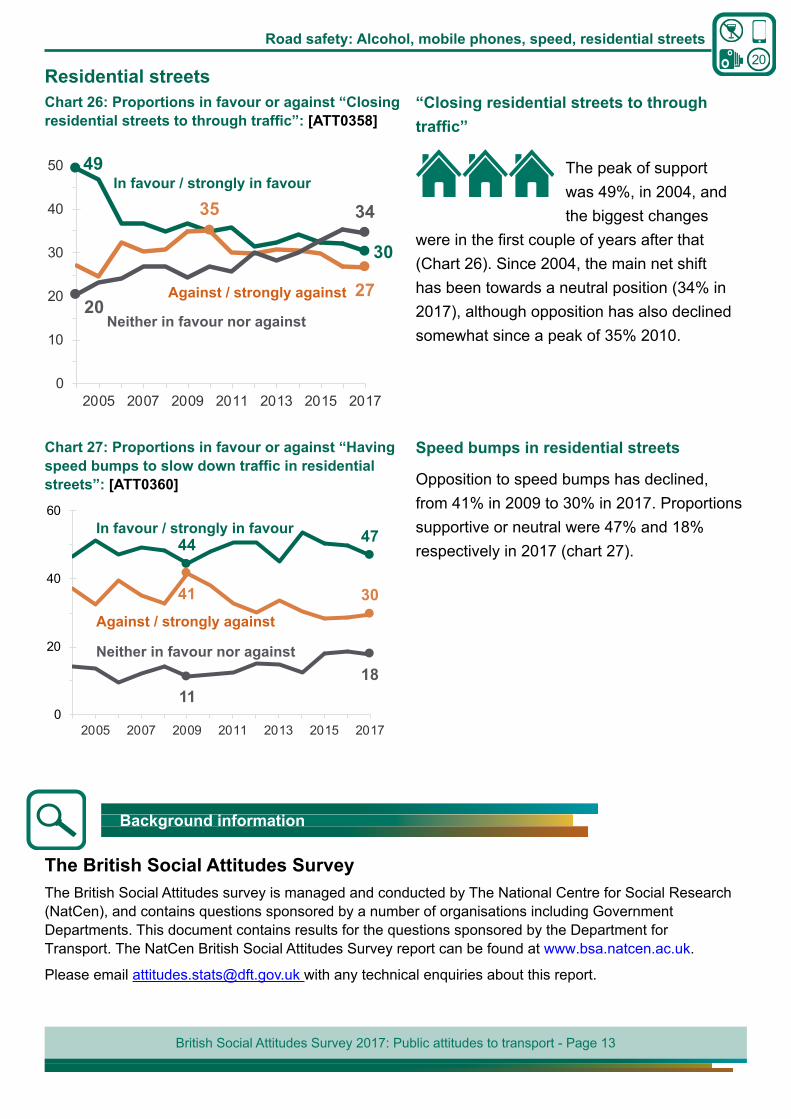
Residential streets“Closing residential streets to through traffic”
The peak of support was 49%, in 2004, and the biggest changes
were in the first couple of years after that (Chart 26). Since 2004, the main net shift has been towards a neutral position (34% in 2017), although opposition has also declined somewhat since a peak of 35% 2010.
Chart 26: Proportions in favour or against “Closing residential streets to through traffic”: [ATT0358]
49
30
35
2720
34
0
10
20
30
40
50
2005 2007 2009 2011 2013 2015 2017
Speed bumps in residential streets
Opposition to speed bumps has declined, from 41% in 2009 to 30% in 2017. Proportions supportive or neutral were 47% and 18% respectively in 2017 (chart 27).
Chart 27: Proportions in favour or against “Having speed bumps to slow down traffic in residential streets”: [ATT0360]
44 47
41 30
1118
0
20
40
60
2005 2007 2009 2011 2013 2015 2017
Neither in favour nor against
Against / strongly against
In favour / strongly in favour
The British Social Attitudes SurveyThe British Social Attitudes survey is managed and conducted by The National Centre for Social Research (NatCen), and contains questions sponsored by a number of organisations including Government Departments. This document contains results for the questions sponsored by the Department for Transport. The NatCen British Social Attitudes Survey report can be found at www.bsa.natcen.ac.uk.
Please email [email protected] with any technical enquiries about this report.
Background information
In favour / strongly in favour
Neither in favour nor against
Against / strongly against
British Social Attitudes Survey 2017: Public attitudes to transport - Page 14
Background information
Detailed statistical tables
Excel tables ATT0301 - ATT0360 containing the results discussed in this report can be found on the Government website at https://www.gov.uk/government/statistics/british-social-attitudes-survey-2017
Detailed analysis of long term trends may be found in Trends in Attitudes to Transport, 1990 to 2009. Tables on public attitudes towards other aspects of transport are available here, although for varying years, as the surveys are not annual:https://www.gov.uk/government/collections/statistics-on-public-attitudes-to-transport
These include: ATT01 Public attitudes to buses, ATT02 Attitudes and behaviour to climate change, ATT04 attitudes to train services, ATT05 Public attitudes towards electric vehicles. The site also has reports on public attitudes to air travel, and towards mobility scooters.
Methodology
The sampling frame is the Postcode Address File (PAF) and is limited to those living in private households. The sampling method uses a multi-stage design with three separate stages selecting postcode sectors, addresses and individuals. The survey is weighted to correct for the unequal selection of addresses, dwelling units and individuals and biases caused by differential non-response.
In 2017, respondents were randomly allocated to one of three versions of the self-completion questionnaire (A, C, and D). Thus the sample size for certain questions varies depending on which version(s) they featured in. There were no transport-related questions in version B.
Fieldwork was mainly carried out between July and October 2017.
Further information
The achieved sample size for the 2017 face-to-face interviews was 2,963 respondents. This equates to a response rate of 46%. Of the 2,963 face to face survey respondents, 1,002 completed self-completion version A, 977 completed self-completion version C and 984 completed self-completion version D. All results presented here are weighted and any differences in results between 2016 and 2017 marked as statistically significant are at the ninety five per cent level of confidence, using an estimated design factor (DEFT) of 1.2.
Future developments
In 2018, just nine key questions from the transport module of the BSA questionnaire will be retained on the standard British Social Attitudes survey, asked across 3 modules. The full set of transport questions, as asked in recent years, will be asked using the NTS Panel Survey, set up by the DfT and the National Centre for Social Research. This panel consists of people who have already answered the National Travel Survey (NTS), and agreed to be recontacted for further transport-related research. The panel questions will be self-completed online, with telephone follow-up for those unable to access the online questionnaire. The effect of this change will be to increase the sample size, compared with the standard BSA survey, and will also enable comparison between respondents’ attitudes and their travel behaviour, as recorded in the NTS. Because it will be possible to recontact the same individuals on the panel, it will also make it possible to track changes in attitudes over time at the individual level, not just in net aggregate.