Embed Size (px)
Citation preview

All figures and growth rates quoted above are based on adjusted results 1
BRITISH SKY BROADCASTING GROUP PLC
Results for the twelve months ended 30 June 2013
RECORD RESULTS. STRONG PLANS FOR 2013/14
Adjusted results Reported results
Twelve months to 30 June 2012/13 2011/12 Variance 2012/13 2011/12 Variance
Revenue £7,235m £6,791m +7% £7,235m £6,791m +7%
EBITDA £1,692m £1,567m +8% £1,669m £1,587m +5%
Operating profit £1,330m £1,223m +9% £1,291m £1,243m +4%
Earnings per share (basic) 60.0p 50.8p +18% 60.7p 52.6p +15%
Record financial and operational performance on the back of strong demand
Paid-for subscription product growth of 3.3 million to a total of 31.6 million
Revenue of £7,235 million, up 7%
EBITDA of £1,692 million, up 8% and operating profit of £1,330 million, up 9%
Basic earnings per share of 60.0p, up 18%
Free cash flow in excess of £1 billion
ARPU of £577, up £29 year on year
New services resonating strongly with customers
170% growth in internet-connected Sky+HD boxes to 2.7 million
19% increase in Sky Go users to 3.3 million
Fivefold increase in On Demand downloads
200% growth in Sky Store video rentals
Strong set of plans for 2013/14
Extending leadership in core areas:
o New slate of original British drama and outstanding year for Sky Sports
o Offer best quality and value in broadband
o Build advantage in customer service
Investing to accelerate growth and returns from new services:
o Accelerate roll-out of connected boxes
o Extend leadership in mobile video
o Build market-leading on demand service
o Volume-driven impact of £60 million to £70 million expected on operating profit in
2013/14 with rapid returns from accelerated take-up and usage of new services
Growing returns to shareholders
18% increase in full year dividend to 30.0p per share, ninth consecutive year of growth
£500 million capital return to shareholders via share buy-back

2
Jeremy Darroch, Chief Executive, commented:
“We have had another very good year of growth, with revenues up 7%, operating profit up 9% and
earnings per share up 18%. The strength of our financial performance is a result of our successful
transition to more broadly-based growth and sustained investment to create a better service and
wider range of products for customers.
“On the back of this performance, we are increasing returns to shareholders with the ninth
consecutive rise in the ordinary dividend and we intend to seek approval for a further £500 million
of share repurchases.
“Over the course of the year, we added more than three million new paid-for subscription products.
We finished the year strongly with 11% organic growth in product sales for the fourth quarter,
reflecting good demand in all areas. It was a particularly significant quarter for home
communications as good organic growth, combined with the consolidation of the consumer
broadband and fixed-line telephony business acquired from O2, delivered well over a million
product additions.
“In our television business, there has been an excellent response from customers to our new
services. We’ve seen an explosion in on-demand and mobile viewing as more people connect their
Sky boxes to broadband and watch TV on laptops and mobile devices with Sky Go. Sky Go Extra, our
new subscription service, has already attracted more than 150,000 customers in just five months.
Customers tell us they get huge value from these services. The benefits to our business are equally
strong through take-up of higher-tier packages, expanded revenue opportunities and improved
customer satisfaction. We see an exciting opportunity for future growth in this area and we intend
to increase investment over the next year to accelerate growth and returns from these new
services.
“We expect the consumer environment to remain challenging over the coming twelve months.
Against that backdrop, we have a strong set of plans that will extend our leadership in core areas –
on screen, in home communications and in front-line service delivery; accelerate growth in new
services; and improve efficiency to build a bigger, more profitable business for shareholders.”

3
Results highlights
Customer Metrics (unaudited)
Consolidated for the acquisition of O2’s consumer broadband and fixed-line telephony business
As at
30-Jun-13
As at
30-Jun-12
Annual
growth
Quarterly
Growth to
30-Jun-13
Paid-for subscription products (‘000s) 31,634 28,365 +3,269 +1,406
TV 10,422 10,288 +134 +34
HD 4,786 4,343 +443 +117
Multiroom 2,489 2,402 +87 +13
Sky Go Extra 166 - +166 +122
Broadband 4,906 4,001 +905 +519
Telephony 4,501 3,768 +733 +293
Line rental 4,364 3,563 +801 +308
Paid-for products per retail customer 2.8 2.7
New connected TV services (‘000s)
Internet-connected Sky+HD boxes 2,709 995 +1,714 +425
Sky Go unique users 3,257 2,740 +517 -5
Other metrics
Total customers (‘000s) 14,830 14,278 +552 +217
Retail customers 11,153 10,606 +547 +341
Wholesale customers (4)
3,677 3,672 +5 -124
ARPU (2) (5)
£577 £548 +£29
Triple-play(5)
35% 32% +3%
Churn (2)
(5)
10.9% 9.9% +1.0%
Additional KPI summary tables containing further detailed disclosure, including the effect of the O2
consolidation in the fourth quarter may be found at Schedules 1 and 2.
Business Performance (1)
(unaudited) 12 months to
30-Jun-13
12 months to
30-Jun-12
Movement
Revenue £7,235m £6,791m +7%
Adjusted EBITDA £1,692m £1,567m +8%
% Adjusted EBITDA profit margin 23.4% 23.1% +30bps
Adjusted operating profit £1,330m £1,223m +9%
Adjusted profit before tax £1,264m £1,148m +10%
Adjusted basic earnings per share (3)
60.0p 50.8p +18%
Adjusted free cash flow £1,028m £910m +13%
Net debt as at the end of the period £1,183m £876m
1 A reconciliation of adjusted operating profit, adjusted EBITDA and adjusted PBT to reported measures as well as cash generated from
operations to adjusted free cash flow and net debt is set out in Appendix 2. 2
Quarterly annualised. 3 Adjusted basic EPS is calculated from adjusted profit for the period. A reconciliation of reported profit to adjusted profit is set out in
note 6 to the consolidated financial information. 4
Wholesale customers taking at least one paid for Sky channel. The customer numbers are as reported to us at May 2013. 5
Other metrics to include O2 broadband and fixed-line telephony customers from Q1 2013/14 onwards.

4
SUMMARY OF OPERATIONAL AND FINANCIAL PERFORMANCE
We delivered a very strong performance for the year with good operating growth translating
into another record set of financial results. A 7% increase in revenues, combined with a
continued focus on cost efficiency, led to an 8% increase in adjusted EBITDA and an 18%
growth in adjusted basic earnings per share to 60.0p, more than double the level of five
years ago. The full year dividend of 30.0 pence per share is 18% higher year on year, the ninth
consecutive year of growth.
Our successful transition to more broadly-based growth, combined with the acquisition of
O2’s consumer broadband and fixed-line telephony business (“O2”), delivered an increase of
1.4 million subscription products in the fourth quarter. We grew subscription products by
700,000 organically, with a further 706,000 as a result of the acquisition of the O2 business.
In all, we added 3.3 million subscription products over the year to reach 31.6 million, more
than double the level of five years ago. Customers now take an average of 2.8 paid-for
products from Sky.
We closed the quarter with 11.2 million retail customers, an increase of 341,000 in the
quarter. Of these, after reflecting overlap of the two customer bases, 290,000 joined Sky
through our purchase of the O2 business.
ARPU continued to rise to £577, up £29 on last year. Quarterly annualised churn was 10.9%.
We saw good growth in the quarter across all products adding another 117,000 HD
customers and 122,000 Sky Go Extra customers. In all, Sky Go Extra, our new paid-for mobile
TV service, had a total of 166,000 paying customers at year end, just five months after
launch. The transactional element of NOW TV, the sports day pass, got off to a good start as
more than 50,000 individual users purchased day passes in the first three months. We
continue to roll-out NOW TV across multiple platforms having launched on PS3, and this
week concluded an exclusive agreement with LG by which they will make NOW TV available
on their Smart TVs.
Home communications also had a very good quarter on the back of our broadband value
campaign. Before accounting for the acquisition of O2, we added 119,000 customers in
broadband, 140,000 in telephony and 155,000 in line rental. The acquisition of O2 added a
further 400,000 broadband subscribers and 153,000 each of telephony and line rental. In
all, 35% of our customer base now take all three of TV, broadband and telephony from Sky,
up from 32% last year.
STRONG SET OF PLANS FOR 2013/14
We enter the new financial year in a strong position to continue to grow our business and
create value. Our plan for 2013/14 will focus on two broad areas: firstly, extending leadership
in our core areas of strength, on screen, in home communications and in our front-line
customer service delivery; and secondly, accelerating the take-up and usage of new services
where we are already seeing a very strong response from customers.

5
Products
Our focus on providing customers with more ways to watch TV is delivering good results with
strong momentum in the take-up and usage of our connected TV services.
More than 2.7 million customers, one quarter of our TV base, have now connected their
Sky+HD boxes to broadband, a rise of 170% on last year. Combined with an expanded range
of content available on demand, this led to a fivefold increase in the number of average
weekly On Demand downloads over the year. Meanwhile, our mobile video service Sky Go
continues to perform well with quarterly users up 19% to 3.3 million, 166,000 of whom are
now paying £5 a month for our new subscription service Sky Go Extra. Our transactional
movie rental service, Sky Store, also grew strongly, with the number of films rented up
threefold on last year.
With the momentum that we have established, we will push harder in 2013/14 to bring
forward both growth and returns for the business.
There are three key elements to our plan: first, we will step up the roll-out of connected
boxes across our base by offering a low-cost wireless connector to customers that have a
Sky+HD box but haven’t yet connected it to broadband. We will also launch a new WiFi-
enabled Sky+HD box as standard from September, rolling it out to targeted groups of
customers who don’t yet have Sky+HD boxes. This acceleration of our connected Sky+HD
platform will open up access to the full range of On Demand services, increasing the value we
deliver to customers and providing an important platform from which to grow new revenue
streams.
Additionally, we plan to extend our reach into new segments of the market with the launch
of a NOW TV IP streaming box. This will be available from today for just £9.99 and will provide
an attractive new way for customers to access our content via NOW TV.
Second, we are going to extend the leadership that we have established in mobile TV with
Sky Go. We will add more than ten new channels to the service next year and continue to
improve functionality. On the back of this, we will increase our marketing to drive greater
usage and upsell to our new subscription service Sky Go Extra. For £5 a month, this lets
customers register up to four devices per account and download movies and TV shows to
watch offline.
Third, we are going to enhance our market-leading on demand service. We plan to add more
than 20 new channels to our Catch Up TV service and develop the quality of our Box Sets,
increasing the hours of content available by around 50% in the next year. Both initiatives are
aimed at driving on-demand usage and reinforcing our platform superiority. We will
monetise this usage with the new Entertainment Extra+ bundle. In addition, we will expand
Sky Store, our movie rental service offering customers the choice of thousands of
blockbuster movies.

6
Investment in these three areas will enable us to meet the growing customer demand for
new services and drive greater returns from increased take-up of higher-tier packages;
higher transactional revenues; increased penetration of NOW TV; and higher levels of
customer satisfaction and advocacy.
Overall, we expect accelerating the take-up and usage of new services to have an impact of
between £60 million and £70 million on operating profit in 2013/14. The majority of the
investment will be in hardware and largely volume-driven. We expect the aggregate effect of
investment and higher revenue to be broadly neutral in 2014/15 and to increase our profits
in 2015/16 and thereafter.
Content
In 2013/14, we will continue to improve the quality of our on-screen offering building on the
progress we have made in the past year.
In sport, the summer got off to a great start with the Lions Tour to Australia attracting
record audiences for Rugby Union on Sky, with figures for the Test series up 85% on 2009.
Meanwhile, coverage of the Ashes started well this month, with the average audience to the
first test up almost 20% on the last English Ashes series. The coverage benefited from
having its own channel for the first time following the temporary rebrand of Sky Sports 2 HD
as Sky Sports Ashes HD.
We continue to expand the breadth of our offering in sport having secured a number of key
rights agreements in the year. These include live rights to all Home Nations and Republic of
Ireland qualification matches for UEFA Euro 2016 and 2018 FIFA World Cup and a new three-
year broadcasting agreement with the Football League. Starting in August 2015, this will give
us 148 live games each season from the Football League, Capital One Cup and Johnstone’s
Paint Trophy.
Elsewhere, we have continued to strengthen our entertainment offering with a good
response from customers. An Idiot Abroad 3 on Sky 1 delivered the highest weekly audience
ever in the channel’s history, taking account of live, On Demand and time-shifted viewing. US
acquisitions also performed strongly across the portfolio. Arrow on Sky 1 was the most
successful US drama in pay TV history averaging 1.5 million viewers per episode; The
Following was the highest-rating series ever on Sky Atlantic; while Elementary has become
the highest-rating series ever on Sky Living. Meanwhile, season 3 of Game of Thrones broke
new records for On Demand viewing across all platforms including more than 1 million On
Demand downloads through the set-top box and 2.3 million views over Sky Go.
In all, the number of entertainment shows attracting an audience of more than 1 million rose
200% in the last two years to 122.
Looking ahead, we are taking our next big step in original British content this year with a big
step up in commissioned drama across the portfolio. We currently have close to 90 hours in
production with highlights including The Tunnel, a ten-part crime drama, based on the
format of The Bridge and co-produced with Canal+ and Fleming, a new four-part drama
about the life of the celebrated James Bond creator, Ian Fleming.

7
Service
In an environment where customers are taking a broader set of products and services from
us, customer service is an increasingly important differentiator. Sky has consistently been
top of Ofcom’s Customer Satisfaction survey in all three categories of TV, broadband and
telephony.
We know that efficient service is better service. We aim to achieve further improvements in
service quality this year by rolling out our ‘One Service’ pilot. We have been testing One
Service for a number of months with the aim of providing customers with a more joined-up
service experience. As part of this, we are bringing around 700 engineers from our outsource
partner AVC in house in October to help achieve better coordination between the customer
call centres and engineers in the field. Results from the pilot have been excellent with first-
time resolution scores up 10% and our net promoter score, a key measure of customer
advocacy, three times higher than previously.
BROADER CONTRIBUTION
Our partnership with British Cycling delivered further success this month with Chris
Froome's victory in the Tour de France, the 100th anniversary year of the event and the
second consecutive win for Team Sky. This is a great success story for British sport that we
hope will deliver another boost to grassroots cycling and inspire even more people to get
out and ride their bikes.
This year marked the tenth anniversary of Sky Sports Living for Sport, our programme to
help the confidence and life skills of young people using the power of sport. During the
quarter, we reached our target of one third of all UK secondary schools participating in the
scheme. With 1,500 schools now taking part, we have doubled the size of the initiative in the
past year, growing it tenfold in the last four years. In May, we expanded the programme to
Ireland where we aim to engage a third of all schools within three years. Additionally, we
announced a long-term partnership with David Beckham who will support the Sky Sports
Living For Sport programme as a Sky ambassador.
In the arts, our second Sky Arts Ignition project, where we collaborate with major arts
organisations and artists to create new works, opened at the V&A in London. Memory Palace
opened in June, the result of a collaboration between Sky Arts and the V&A to bring an
original work of fiction by Hari Kunzru, Memory Palace, to life.
DETAILED FINANCIAL PERFORMANCE
Unless otherwise stated, all figures and growth rates included below exclude exceptional
items. Adjusting items are detailed on page 10 and in Appendix 2.
As we consistently executed our strategy throughout the year, we delivered excellent
growth in each of revenue, EBITDA, earnings and free cash flow. For the twelve months ended
30 June 2013, revenue growth of 7% combined with our continued focus on operating
efficiency to deliver growth in profit before tax of 10% and earnings per share of 60.0p, up
18%.

8
Revenue
Group revenue increased by 7% to £7,235 million (2012: £6,791 million), with good growth in
both retail and wholesale operations and improvement in the more cyclical operations in
advertising and Sky Business (pubs and clubs).
Retail subscription revenue grew by 6% to £5,951 million (2012: £5,593 million), reflecting
continued product and customer growth and the benefit of the price rise which came into
effect in September 2012. Sky Business returned to growth in the second half to achieve
revenue growth of 1% for the full year.
We delivered a strong performance in wholesale subscription revenue which increased by
13% to £396 million (2012: £351 million). Although the volume of wholesale subscribers was
flat year on year, we continue to benefit from greater take-up of Sky premium channels on
other platforms.
Advertising revenue was flat year on year at £440 million (2012: £440 million), despite the
impact of the Olympics in our first quarter. Sky Media gained market share across the year
to reach 22.2%, with the majority of this growth underpinned by increased ratings for our
media partner channels with whom we share revenue upside. AdSmart, our tailored
advertising product, is on track to launch this summer with good interest from potential
advertisers.
Installation, hardware and service revenue of £87 million was lower year on year (2012: £98
million) driven by improved product reliability, an increased number of customer self-
installations, and higher right-first-time engineer visits.
Other revenue increased by 17% to £361 million (2012: £309 million) due to continued strong
performance from Sky Bet which saw an increase in unique users in the year, and growth in
international programme sales due to more original commissions.
Direct Costs
Programming costs increased by 8% to £2,486 million (2012: £2,298 million) in line with our
expectations. Sports accounted for the majority of the absolute increase due to the
inclusion of Formula 1, Ryder Cup and Lions costs not in the prior year. Movie costs increased
and included investment in expanded rights agreements to support new product offerings
such as Sky Go Extra and NOW TV. Entertainment costs saw the largest percentage increase
(+15% year on year) as we continued to invest in new and exclusive UK-commissioned
content across our channel portfolio.
Our work on network efficiency within our communications operations resulted in excellent
operating leverage in direct network costs, up only 6% to £715 million (2012: £676 million)
despite a 15% increase in organic home communications product volumes.

9
Other Operating Costs
We continued to focus on costs and once again delivered a strong performance, with other
operating costs reducing as a percentage of sales by 80 basis points. Within other operating
costs, every cost line reduced as a percentage of sales year on year, continuing our approach
of seeking efficiency in our cost base to improve margins and reinvestment where
customers see value.
Marketing costs of £1,116 million (2012: £1,064 million) reduced by 30 basis points as a
percentage of sales. Lower cost route-to-market sales and lower acquisition volumes helped
to offset additional advertising spend to support the launch of NOW TV and a national
broadband campaign which included the launch of fibre in the second half of the year.
Subscriber management and supply chain costs were up 4% at £647 million (2012: £621
million) driven largely by higher volume of set-top box sales to Sky Italia and our own higher
broadband volumes.
Transmission, technology and fixed network costs increased by a net 2% to £401 million
(2012: £395 million) due to the increased transmission of additional content from the
Formula 1 channel, Sky Go, NOW TV and On Demand largely offset by continued efficiencies.
Administration costs were up 5% at £540 million (2012: £514 million) reflecting the biennial
phasing of our share incentive plans. Excluding this, administration expenses would have
been flat on last year.
Profits and Earnings
EBITDA of £1,692 million was up strongly at 8%. Depreciation and amortisation of £362
million increased 5% year on year, largely due to new products being depreciated for the first
time and a higher proportion of intangible capital expenditure on assets with shorter
economic lives. Operating profit of £1,330 million was up 9%.
Profit before tax was £1,264 million (2012: £1,148 million), which included the Group’s share of
joint ventures and associates’ profits of £37 million (2012: £32 million) and a net interest
charge of £103 million (2012: £107 million). Taxation for the period was £295 million (2012:
£273 million). Our adjusted effective tax rate was 23% (2012: 24%), benefiting from the
reduction in the rate of UK corporation tax on 1 April 2012 from 26% to 24% and 1 April 2013
to 23%.
Profit after tax for the year was £969 million (2012: £875 million), generating earnings per
share of 60.0 pence (2012: 50.8 pence). Over the year the weighted average number of
shares excluding those held by the Employee Share Ownership Plan (‘ESOP’) for the
settlement of employee share awards was 1,614 million (2012: 1,721 million). The number of
shares, excluding the ESOP shares, at the end of the year was 1,573 million (2012: 1,658
million).

10
Adjusting Items
Reported profit after tax of £979 million (2012: £906 million) includes a net exceptional gain
of £10 million. In addition to the gain of £26 million recognised in previous quarters, we
incurred a £15 million charge related to the acquisition of O2’s consumer broadband and
fixed-line telephony business, and £33 million from a corporate efficiency programme
including the redundancy of approximately 250 head office employees. Other adjusting
items were a £23 million gain relating to mark to market values of derivative financial
instruments and a £17 million gain relating to the tax exceptionals and the tax effect on all
adjusting items. Full details of all of these items are set out in Appendix 2.
Cash Flow & Financial Position
Adjusted free cash flow was 13% higher at £1,028 million (2012: £910 million) reflecting
strong growth in adjusted EBITDA, a positive working capital movement, lower interest and
capital expenditure.
Capital expenditure of £454 million (2012: £457 million) was slightly lower than last year.
Phasing of spend throughout the year picked up in the fourth quarter as we started the
construction of a new building on our main site and commenced the integration of O2
broadband customers.
Net debt increased to £1,183 million (2012: £876 million) primarily as a result of the share
buy-back and dividend growth. Gross debt was £2,593 million, with £1,410 million of cash and
equivalents at 30 June 2013. The Group’s liquidity and headroom remain comfortable.
Uses of Capital and Distributions to Shareholders
Our policy on use of capital continues to focus on four consistent areas: organic growth,
regular dividends, acquisitions and share repurchases. We are a growth company and our
first priority is investing in areas in which we see the opportunity to add revenues and grow
earnings. Today's investment of around £60 million to £70 million in organic growth during
2013/14 is a good example of such an opportunity.
At the same time, we understand the value our shareholders place on a growing regular
return and have once again increased our ordinary dividend in line with earnings growth,
maintaining a sector-leading payout ratio of fifty per cent. The Directors’ proposed final
dividend of 19.0 pence per share takes the total dividend payable in respect of the financial
year to 30.0 pence per share, an increase of 18% over prior year and almost double the level
of six years ago. We have shown through our past successful investments in both
Broadband and HD that our financial flexibility enables us to balance both investment in
growth and cash returns to shareholders. Consequently, looking to the year ahead we
anticipate continued growth in the ordinary dividend.
The ex-dividend date will be 13 November 2013 and, subject to shareholder approval at the
Annual General Meeting to be held on 22 November 2013, the final dividend of 19.0 pence will
be paid on 6 December 2013 to shareholders appearing on the register at the close of
business on 15 November 2013.
11
Finally, we will continue to look to deploy our balance sheet strength in a disciplined way to
enhance returns for shareholders via acquisitions, should attractive opportunities present
themselves, or share repurchases. To this end, we intend to seek shareholder approval at
the Company's AGM for a further £500 million of share repurchases.
As with the current share repurchase programme, we have entered into an agreement with
Twenty-First Century Fox, Inc. (formerly known as News Corporation) (and others) under
which, following any market purchases of shares by the Company, Twenty-First Century Fox,
Inc. will sell to the Company sufficient shares to maintain its percentage shareholding at the
same level as applied prior to those market purchases, ensuring that there will be no change
in Twenty-First Century Fox, Inc.’s economic or voting interests in the Company as a result of
the share buy-back programme. The agreement is conditional on the appropriate
shareholder approvals being granted.

12
Schedule 1 – KPI Summary
All figures (000) FY10/11 FY11/12 FY12/13
unless stated
Q4 Q1 Q2 Q3 Q4 Q1 Q2 Q3 Q4
Total paid-for
subscription products 25,375 26,058 26,830 27,734 28,365 28,898 29,513 30,228 31,634
TV 10,187 10,213 10,253 10,268 10,288 10,308 10,358 10,388 10,422
Sky+HD 3,822 3,925 4,063 4,222 4,343 4,468 4,561 4,669 4,786
Multiroom 2,250 2,295 2,350 2,378 2,402 2,423 2,467 2,476 2,489
Sky Go Extra - - - - - - - 44 166
Broadband 3,335 3,485 3,651 3,863 4,001 4,103 4,235 4,387 4,906
Telephony 3,101 3,248 3,407 3,627 3,768 3,888 4,022 4,208 4,501
Line Rental 2,680 2,892 3,106 3,376 3,563 3,708 3,870 4,056 4,364
New connected TV
services - 1,829 2,549 3,211 3,735 4,023 4,781 5,546 5,966
Connected HD boxes - 204 442 604 995 1,255 1,715 2,284 2,709
Sky Go unique users - 1,625 2,107 2,607 2,740 2,768 3,066 3,262 3,257
Total products and
services 25,375 27,887 29,379 30,945 32,100 32,921 34,294 35,774 37,600
Other metrics:
Retail customers 10,294 10,371 10,471 10,549 10,606 10,654 10,742 10,812 11,153
Wholesale customers 3,522 3,569 3,629 3,657 3,672 3,714 3,751 3,801 3,677
Total customers 13,816 13,940 14,100 14,206 14,278 14,368 14,493 14,613 14,830
ARPU (£) £538 £535 £544 £546 £548 £550 £568 £576 £577
Triple-play % 27% 28% 29% 31% 32% 33% 33% 34% 35%
Churn 10.4% 11.1% 9.6% 10.1% 9.9% 10.9% 10.3% 10.8% 10.9%
Fixed Network Metrics
On-net base 3,045 3,205 3,403 3,636 3,778 3,882 4,031 4,190 4,696
MPF base 1,686 1,869 2,146 2,423 2,588 2,762 2,926 3,159 3,359
SMPF base 1,359 1,336 1,257 1,213 1,190 1,120 1,105 1,031 1,337
MPF % 55% 58% 63% 67% 69% 71% 73% 75% 72%
SMPF % 45% 42% 37% 33% 31% 29% 27% 25% 28%
Off-net base 290 280 248 227 223 221 204 197 210
Total Broadband 3,335 3,485 3,651 3,863 4,001 4,103 4,235 4,387 4,906
On-net % 91% 92% 93% 94% 94% 95% 95% 96% 96%
Total no. of LLU
exchanges 1,577 1,732 1,907 1,964 1,965 2,036 2,108 2,202 2,323

13
Schedule 2 – Impact of O2 consumer broadband and fixed-line telephony acquisition
All figures (000) FY12/13
unless stated
Q4
opening
Q4 organic
growth
Q4 acquired
growth (O2)
Q4
closing
Total paid-for subscription products 30,228 700 706 31,634
TV 10,388 34 10,422
Sky+HD 4,669 117 - 4,786
Multiroom 2,476 13 - 2,489
Sky Go Extra 44 122 - 166
Broadband 4,387 119 400 4,906
Telephony 4,208 140 153 4,501
Line Rental 4,056 155 153 4,364
New connected TV services 5,546 420 - 5,966
Connected HD boxes 2,284 425 - 2,709
Sky Go unique users 3,262 -5 - 3,257
Total products and services 35,774 1,120 706 37,600
Customers
Retail customers 10,812 51 290 11,153
Wholesale customers 3,801 -124 - 3,677
Total customers 14,613 -73 290 14,830

14
Enquiries:
Analysts/Investors:
Edward Steel Tel: 020 7032 2093
Lang Messer Tel: 020 7032 2657
E-mail: [email protected]
Press:
Alice Macandrew Tel: 020 7705 3000
Stephen Gaynor Tel: 020 7705 3000
E-mail: [email protected]
There will be a presentation for analysts and investors at 9.00 a.m (BST) at Allen & Overy,
One Bishops Square, London, E1 6AD. CEO, Jeremy Darroch and CFO, Andrew Griffith, will
present. Participants should register by contacting Camilla Regan on +44 20 7251 3801 or at
There will be a separate conference call for US analysts and investors at 10.00 a.m. (EDT). To
register for this please contact Dana Diver at Taylor Rafferty on +1 212 889 4350.
Alternatively you may register online by using the following link
http://invite.taylor-rafferty.com/_bskyb/2013Q2CC/Default.htm .
A live webcast of the UK and US call will be available to analysts and investors via the BSkyB
website at http://www.sky.com/corporate. Replays will be subsequently available.

15
Use of measures not defined under IFRS
This press release contains certain information on the Group’s financial position, results and cash flows that have been derived
from measures calculated in accordance with IFRS. This information should not be read in isolation from the related IFRS
measures.
Forward looking statements
This document contains certain forward looking statements with respect to the Group’s financial condition, results of
operations and business and management’s strategy, plans and objectives for the Group. These statements include, without
limitation, those that express forecasts, expectations and projections, such as forecasts, expectations and projections in
relation to new products and services, the potential for growth of free-to-air and pay television, fixed-line telephony,
broadband and bandwidth requirements, advertising growth, DTH and OTT customer growth, Multiroom, On Demand, NOW TV,
Sky Go, Sky Go Extra, Sky+HD and other services, revenue, administration costs and other costs, advertising growth, churn,
profit, cash flow, product penetration, our broadband network footprint, content, wholesale, marketing and capital
expenditure and proposals for returning capital to shareholders.
Although the Company believes that the expectations reflected in such forward looking statements are reasonable, these
statements are not guarantees of future performance and are subject to risks, uncertainties and other factors, some of which
are beyond our control, are difficult to predict and could cause actual results to differ materially from those expressed or
implied or forecast in the forward looking statements. Information on the significant risks and uncertainties are described in
the "Principal risks and uncertainties" section of Sky's Annual Report for the full year ended 30 June 2012 (as updated in Sky’s
results for the six months ended 31 December 2012). Copies of the Annual Report and 31 December 2012 results are available
from the British Sky Broadcasting Group plc web page at www.sky.com/corporate.
All forward looking statements in this document are based on information known to the Group on the date hereof. The Group
undertakes no obligation publicly to update or revise any forward looking statements, whether as a result of new information,
future events or otherwise.
Glossary of Terms
A glossary of terms is included within the Annual Report and on our corporate investor relations web page at
http://corporate.sky.com/investors/glossary .

16
Appendix 1 – Consolidated Financial Information
Consolidated Income Statement for the year ended 30 June 2013
2013 2012
Notes £m £m
Revenue 2 7,235 6,791
Operating expense 3 (5,944) (5,548)
EBITDA 1,669 1,587
Depreciation and amortisation (378) (344)
Operating profit 1,291 1,243
Share of results of joint ventures and associates 11 46 39
Investment income 4 28 18
Finance costs 4 (108) (111)
Profit before tax 1,257 1,189
Taxation 5 (278) (283)
Profit for the year attributable to equity shareholders of the parent company 979 906
Earnings per share from profit for the year (in pence)
Basic 6 60.7p 52.6p
Diluted 6 59.7p 52.2p
Adjusted earnings per share from adjusted profit for the year (in pence)
Basic 6 60.0p 50.8p
Diluted 6 59.1p 50.4p
Consolidated Statement of Comprehensive Income for the year ended 30 June 2013
2013 2012
£m £m
Profit for the year attributable to equity shareholders of the parent company 979 906
Other comprehensive income
Amounts recognised directly in equity
Exchange differences on translation of foreign operations - 2
Gain on revaluation of available-for-sale investments 186 8
(Loss) gain on cash flow hedges (27) 99
Tax on cash flow hedges 7 (23)
166 86
Amounts reclassified and reported in the income statement
Loss on cash flow hedges (48) (29)
Tax on cash flow hedges 11 7
(37) (22)
Other comprehensive income for the year (net of tax) 129 64
Total comprehensive income for the year attributable to equity shareholders of the parent company 1,108 970

17
Consolidated Balance Sheet as at 30 June 2013
2013 2012
Notes £m £m
Non-current assets
Goodwill 8 999 956
Intangible assets 9 718 523
Property, plant and equipment 10 1,041 948
Investments in joint ventures and associates 11 164 156
Available-for-sale investments 12 422 228
Deferred tax assets 13 38 16
Programme distribution rights 14 17 -
Trade and other receivables 15 17 17
Derivative financial assets 360 390
3,776 3,234
Current assets
Inventories 14 548 456
Trade and other receivables 15 591 621
Short-term deposits 595 710
Cash and cash equivalents 815 464
Derivative financial assets 20 24
2,569 2,275
Total assets 6,345 5,509
Current liabilities
Borrowings 18 11 8
Trade and other payables 16 2,023 1,855
Current tax liabilities 176 189
Provisions 17 94 43
Derivative financial liabilities 13 3
2,317 2,098
Non-current liabilities
Borrowings 18 2,909 2,398
Trade and other payables 16 63 27
Provisions 17 14 12
Derivative financial liabilities 29 29
Deferred tax liabilities 13 1 1
3,016 2,467
Total liabilities 5,333 4,565
Share capital 19 797 837
Share premium 1,437 1,437
Reserves (1,222) (1,330)
Total equity attributable to equity shareholders of the parent company 1,012 944
Total liabilities and shareholders’ equity 6,345 5,509
18
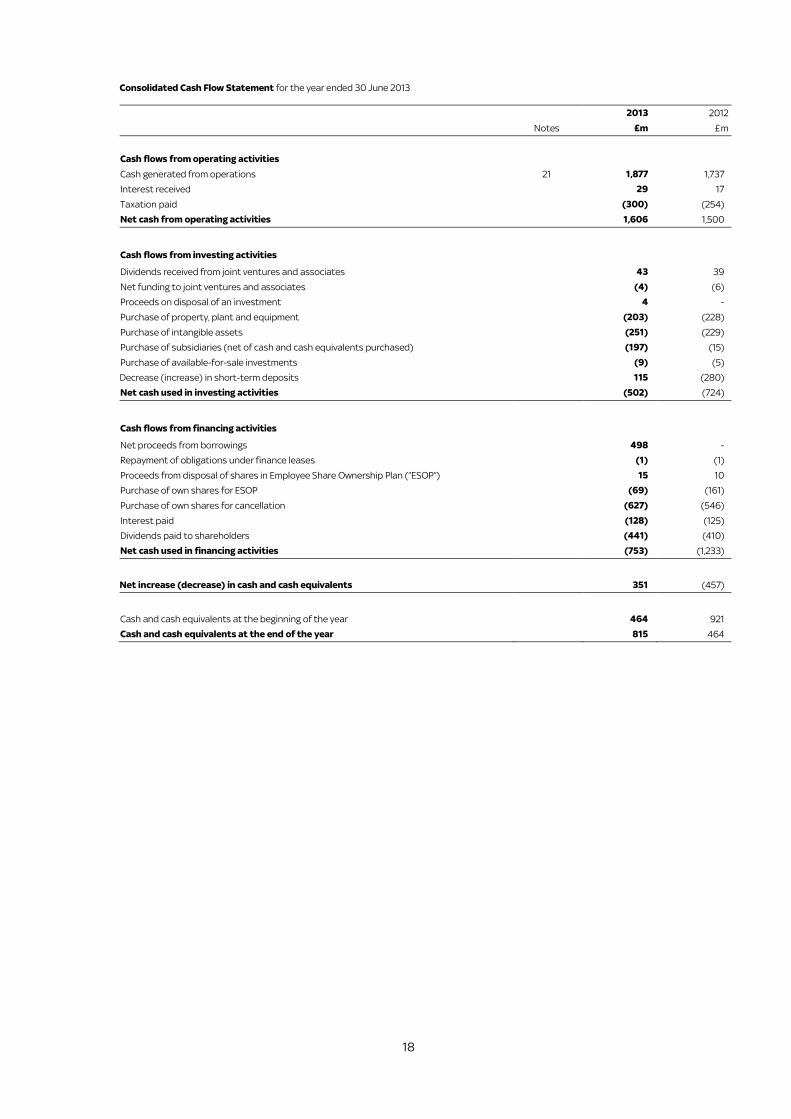
Consolidated Cash Flow Statement for the year ended 30 June 2013
2013 2012
Notes £m £m
Cash flows from operating activities
Cash generated from operations 21 1,877 1,737
Interest received 29 17
Taxation paid (300) (254)
Net cash from operating activities 1,606 1,500
Cash flows from investing activities
Dividends received from joint ventures and associates 43 39
Net funding to joint ventures and associates (4) (6)
Proceeds on disposal of an investment 4 -
Purchase of property, plant and equipment (203) (228)
Purchase of intangible assets (251) (229)
Purchase of subsidiaries (net of cash and cash equivalents purchased) (197) (15)
Purchase of available-for-sale investments (9) (5)
Decrease (increase) in short-term deposits 115 (280)
Net cash used in investing activities (502) (724)
Cash flows from financing activities
Net proceeds from borrowings 498 -
Repayment of obligations under finance leases (1) (1)
Proceeds from disposal of shares in Employee Share Ownership Plan (“ESOP”) 15 10
Purchase of own shares for ESOP (69) (161)
Purchase of own shares for cancellation (627) (546)
Interest paid (128) (125)
Dividends paid to shareholders (441) (410)
Net cash used in financing activities (753) (1,233)
Net increase (decrease) in cash and cash equivalents 351 (457)
Cash and cash equivalents at the beginning of the year 464 921
Cash and cash equivalents at the end of the year 815 464

19
Consolidated Statement of Changes in Equity for the year ended 30 June 2013
Share capital
Share premium
ESOP reserve
Hedging reserve
Available- for-sale reserve
Other reserves
Retained earnings
Total shareholders’
equity
£m £m £m £m £m £m £m £m
At 1 July 2011 876 1,437 (107) 14 157 358 (1,700) 1,035
Profit for the year - - - - - - 906 906
Exchange differences on translation of foreign operations
- - - - - 2 - 2
Revaluation of available-for-sale investments - - - - 8 - - 8
Recognition and transfer of cash flow hedges - - - 70 - - - 70
Tax on items taken directly to equity - - - (16) - - - (16)
Total comprehensive income for the year - - - 54 8 2 906 970
Share-based payment - - (5) - - - (80) (85)
Tax on items taken directly to equity - - - - - - (10) (10)
Share buy-back programme (see note 20):
- Purchase of own shares for cancellation (39) - - - - 39 (546) (546)
- Financial liability for close period purchases - - - - - - (10) (10)
Dividends - - - - - - (410) (410)
At 30 June 2012 837 1,437 (112) 68 165 399 (1,850) 944
Profit for the year - - - - - - 979 979
Revaluation of available-for-sale investments - - - - 186 - - 186
Recognition and transfer of cash flow hedges - - - (75) - - - (75)
Tax on items taken directly to equity - - - 18 - - - 18
Total comprehensive income for the year - - - (57) 186 - 979 1,108
Share-based payment - - (35) - - - 61 26
Tax on items taken directly to equity - - - - - - 8 8
Share buy-back programme (see note 20):
- Purchase of own shares for cancellation (40) - - - - 40 (617) (617)
- Financial liability for close period purchases - - - - - - (16) (16)
Dividends - - - - - - (441) (441)
At 30 June 2013 797 1,437 (147) 11 351 439 (1,876) 1,012

20
Notes to the consolidated financial statements
1 Basis of Preparation
The financial information set out in this preliminary announcement does not constitute statutory financial statements for the years ended
30 June 2013 or 2012, for the purpose of the Companies Act 2006, but is derived from those financial statements. Statutory financial
statements for 2013, on which the Group’s auditors have given an unqualified report which does not contain statements under s. 498(2) or
(3) of the Companies Act 2006, will be filed with the Registrar of Companies by 31 December 2013. Statutory financial statements for 2012
have been filed with the Registrar of Companies. The Group’s auditors have reported on those accounts; their reports were unqualified and
did not contain statements under s. 498(2) or (3) of the Companies Act 2006.
Whilst the financial information included in this press release has been prepared in accordance with International Financial Reporting
Standards (“IFRS”) as adopted for use in the European Union and as issued by the International Accounting Standards Board, this
announcement does not itself contain sufficient information to comply with IFRS. The accounting policies applied in preparing this financial
information are consistent with the Group’s financial statements for the year ended 30 June 2012 except in relation to the mandatory
adoption of new accounting standards and revisions and amendments to existing accounting standards, none of which had any significant
impact on the Group’s results or financial position.
The Group maintains a 52 or 53 week fiscal year ending on the Sunday nearest to 30 June in each year. In fiscal year 2013, this date was 30
June 2013, this being a 52 week year (fiscal year 2012: 1 July 2012, 52 week year). For convenience purposes, the Group continues to date its
consolidated financial statements as at 30 June and to refer to the accounting period as a “year” for reporting purposes.
2 Revenue
2013 2012
£m £m
Retail subscription 5,951 5,593
Wholesale subscription 396 351
Advertising 440 440
Installation, hardware and service 87 98
Other 361 309
7,235 6,791
3 Operating expense
2013 2012
£m £m
Programming 2,487 2,298
Direct networks 686 676
Marketing 1,117 1,064
Subscriber management and supply chain 673 621
Transmission, technology and fixed networks 405 395
Administration
576 494
5,944 5,548

21
4 Investment income and finance costs
2013 2012
£m £m
Investment income
Interest on cash, cash equivalents and short-term deposits 9 14
Dividends received from available-for-sale investments 19 4
28 18
2013 2012
£m £m
Finance costs
– Interest payable and similar charges
£743 million/£750 million Revolving Credit Facilities (“RCF”) (i)
(2) (8)
Guaranteed Notes (122) (115)
Finance lease interest (7) (7)
(131) (130)
– Other finance income (expense)
Remeasurement of borrowings and borrowings-related derivative financial instruments(ii)
22 20
Remeasurement of other derivative financial instruments (ii)
(1) -
(Loss) gain arising on derivatives in a designated fair value hedge accounting relationship (34) 47
Gain (loss) arising on adjustment for hedged item in a designated fair value hedge
accounting relationship 36 (48)
23 19
(108) (111)
(i) Included in RCF costs for the year ended 30 June 2012 is a write-off of £5 million relating to the facility fee on the £750 million RCF
which has now been replaced with the £743 million RCF.
(ii) Not qualifying for hedge accounting.
5 Taxation
Taxation recognised in the income statement
2013 2012
£m £m
Current tax expense
Current year 332 303
Adjustment in respect of prior years (44) (33)
Total current tax charge 288 270
Deferred tax expense
Origination and reversal of temporary differences (20) 6
Adjustment in respect of prior years 10 7
Total deferred tax (credit) charge (10) 13
Taxation 278 283
Taxation relates to a £275 million UK corporation tax charge (2012: £280 million) and £3 million overseas corporation tax charge (2012: £3
million).
22
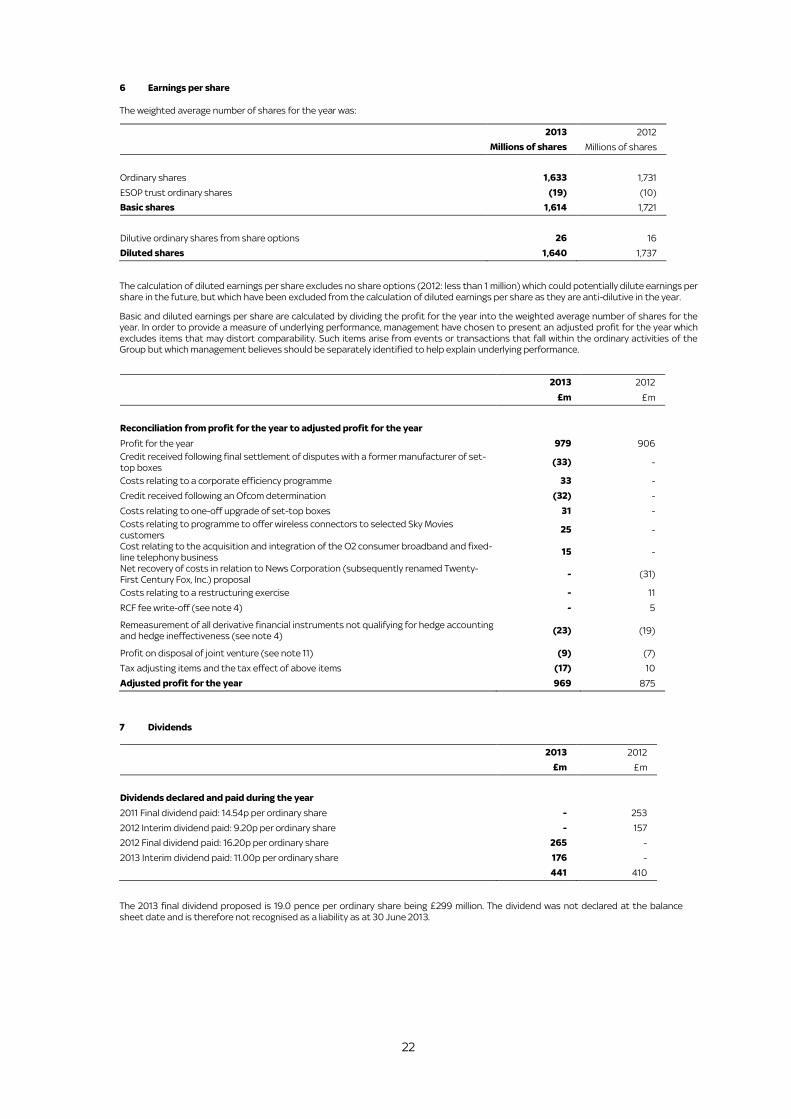
6 Earnings per share
The weighted average number of shares for the year was:
2013 2012
Millions of shares Millions of shares
Ordinary shares 1,633 1,731
ESOP trust ordinary shares (19) (10)
Basic shares 1,614 1,721
Dilutive ordinary shares from share options 26 16
Diluted shares 1,640 1,737
The calculation of diluted earnings per share excludes no share options (2012: less than 1 million) which could potentially dilute earnings per
share in the future, but which have been excluded from the calculation of diluted earnings per share as they are anti-dilutive in the year.
Basic and diluted earnings per share are calculated by dividing the profit for the year into the weighted average number of shares for the
year. In order to provide a measure of underlying performance, management have chosen to present an adjusted profit for the year which
excludes items that may distort comparability. Such items arise from events or transactions that fall within the ordinary activities of the
Group but which management believes should be separately identified to help explain underlying performance.
2013 2012
£m £m
Reconciliation from profit for the year to adjusted profit for the year
Profit for the year 979 906
Credit received following final settlement of disputes with a former manufacturer of set-
top boxes (33) -
Costs relating to a corporate efficiency programme 33 -
Credit received following an Ofcom determination (32) -
Costs relating to one-off upgrade of set-top boxes 31 -
Costs relating to programme to offer wireless connectors to selected Sky Movies
customers 25 -
Cost relating to the acquisition and integration of the O2 consumer broadband and fixed-
line telephony business 15 -
Net recovery of costs in relation to News Corporation (subsequently renamed Twenty-
First Century Fox, Inc.) proposal - (31)
Costs relating to a restructuring exercise - 11
RCF fee write-off (see note 4) - 5
Remeasurement of all derivative financial instruments not qualifying for hedge accounting
and hedge ineffectiveness (see note 4) (23) (19)
Profit on disposal of joint venture (see note 11) (9) (7)
Tax adjusting items and the tax effect of above items (17) 10
Adjusted profit for the year 969 875
7 Dividends
2013 2012
£m £m
Dividends declared and paid during the year
2011 Final dividend paid: 14.54p per ordinary share - 253
2012 Interim dividend paid: 9.20p per ordinary share - 157
2012 Final dividend paid: 16.20p per ordinary share 265 -
2013 Interim dividend paid: 11.00p per ordinary share 176 -
441 410
The 2013 final dividend proposed is 19.0 pence per ordinary share being £299 million. The dividend was not declared at the balance
sheet date and is therefore not recognised as a liability as at 30 June 2013.

23
8 Goodwill
2013 2012
£m £m
Carrying value 999 956
During the year, the Group completed the acquisition of the O2 consumer broadband and fixed-line telephony business which resulted
in additional goodwill of £49 million.
9 Intangible assets
Internally
generated
intangible
assets
Software
development
(external) and
software
licences
Customer
contracts
and related
customer
relationships
Other
intangible
assets
Internally
generated
intangible
assets not
yet available
for use
Acquired
intangible
assets not
yet
available
for use Total
£m £m £m £m £m £m £m
Cost
At 1 July 2012 252 427 60 224 54 103 1,120
Additions from
business combinations - - 137 2 - - 139
Additions 102 45 - 66 25 20 258
Disposals (15) (6) - - (2) (7) (30)
Transfers 47 59 - - (47) (59) -
At 30 June 2013 386 525 197 292 30 57 1,487
Amortisation
At 1 July 2012 122 308 9 158 - - 597
Amortisation 72 55 7 57 - - 191
Disposals (15) (6) - - (2) (7) (30)
Impairments 2 - - - 2 7 11
At 30 June 2013 181 357 16 215 - - 769
Carrying amounts
At 1 July 2012 130 119 51 66 54 103 523
At 30 June 2013 205 168 181 77 30 57 718
In order to improve the presentation of the Group’s intangible assets “Customer contracts and related customer relationships” have been
disaggregated from the “Other intangible assets” category and “Software licences” have been aggregated with the “Software development
(external)” category. The prior year categories have been re-presented accordingly.

24
10 Property, plant and equipment
Freehold land
and buildings
Leasehold
improvements
Equipment,
furniture and
fixtures
Assets not
yet available
for use Total
£m £m £m £m £m
Cost
At 1 July 2012 333 59 1,210 27 1,629
Additions from business combinations - - 25 - 25
Additions 1 1 194 48 244
Disposals - (2) (64) - (66)
Transfers - - 22 (22) -
At 30 June 2013 334 58 1,387 53 1,832
Depreciation
At 1 July 2012 40 27 614 - 681
Depreciation 6 8 160 - 174
Disposals - (2) (64) - (66)
Impairments - 1 1 - 2
At 30 June 2013 46 34 711 - 791
Carrying amounts
At 1 July 2012 293 32 596 27 948
At 30 June 2013 288 24 676 53 1,041
11 Investments in joint ventures and associates
The movement in joint ventures and associates during the year was as follows:
2013 2012
£m £m
Share of net assets
At 1 July 156 151
Movement in net assets
– Funding, net of repayments 4 6
– Dividends received(i)
(43) (39)
– Share of profits(i)
46 39
- Disposal of joint venture(i)
(1) (3)
– Exchange differences on translation of foreign joint ventures and associates 2 2
At 30 June 164 156
(i) During the year, the Group disposed of its interest in MUTV Limited. Included in share of profits for the year is a profit on disposal
of £9 million. Consideration received on the sale of £10 million is included within dividends received. During the prior year, the Group
disposed of its interest in Chelsea Digital Media Limited. Included in share of profits for the year is a profit on disposal of £7 million.
Consideration received on the sale to date of £6 million is included within dividends received.
12 Available-for-sale investments
2013 2012
£m £m
Fair value of ITV investment 409 223
Other investments at cost 13 5
422 228
25
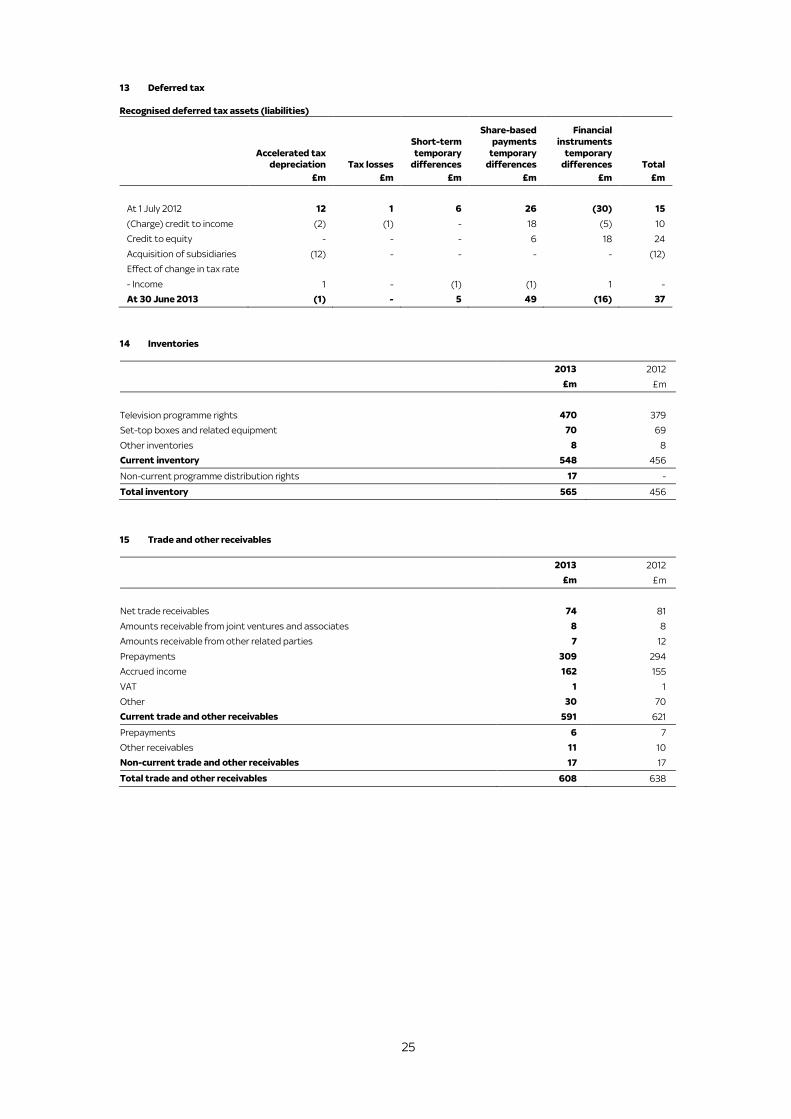
13 Deferred tax
Recognised deferred tax assets (liabilities)
Accelerated tax
depreciation
Tax losses
Short-term
temporary
differences
Share-based
payments
temporary
differences
Financial
instruments
temporary
differences
Total
£m £m £m £m £m £m
At 1 July 2012 12 1 6 26 (30) 15
(Charge) credit to income (2) (1) - 18 (5) 10
Credit to equity - - - 6 18 24
Acquisition of subsidiaries (12) - - - - (12)
Effect of change in tax rate
- Income 1 - (1) (1) 1 -
At 30 June 2013 (1) - 5 49 (16) 37
14 Inventories
2013 2012
£m £m
Television programme rights 470 379
Set-top boxes and related equipment 70 69
Other inventories 8 8
Current inventory 548 456
Non-current programme distribution rights 17 -
Total inventory 565 456
15 Trade and other receivables
2013 2012
£m £m
Net trade receivables 74 81
Amounts receivable from joint ventures and associates 8 8
Amounts receivable from other related parties 7 12
Prepayments 309 294
Accrued income 162 155
VAT 1 1
Other 30 70
Current trade and other receivables 591 621
Prepayments 6 7
Other receivables 11 10
Non-current trade and other receivables 17 17
Total trade and other receivables 608 638
26
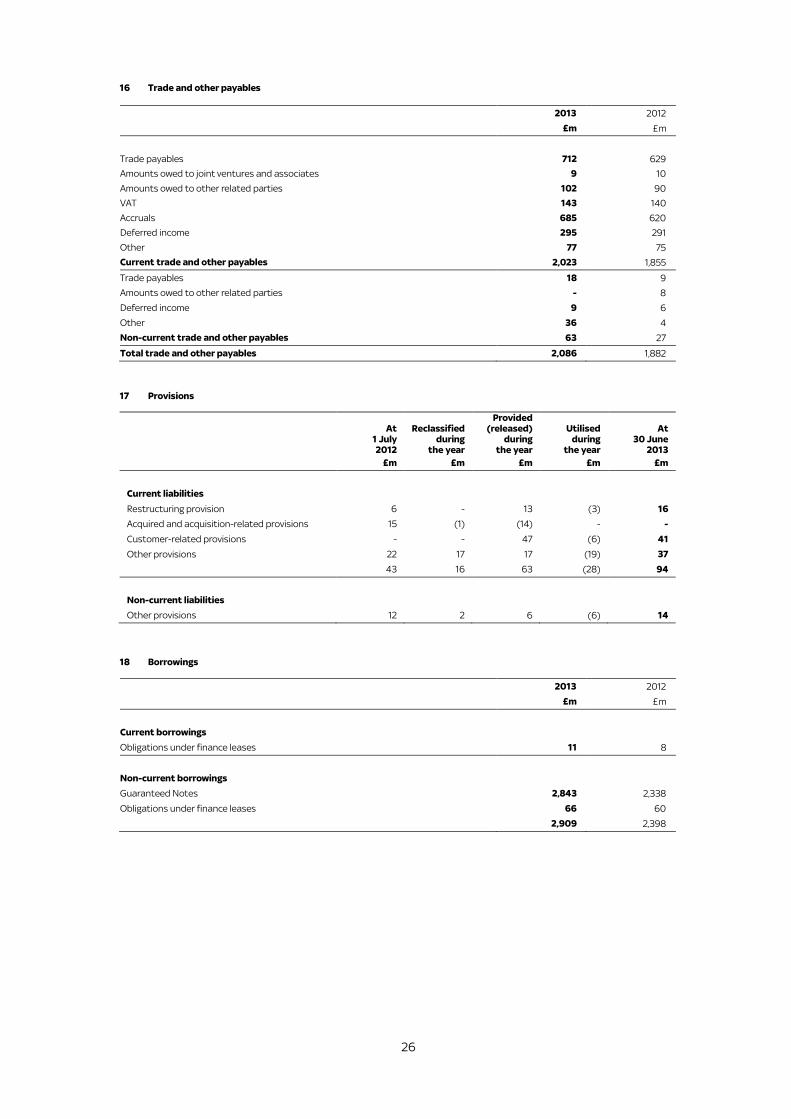
16 Trade and other payables
2013 2012
£m £m
Trade payables 712 629
Amounts owed to joint ventures and associates 9 10
Amounts owed to other related parties 102 90
VAT 143 140
Accruals 685 620
Deferred income 295 291
Other 77 75
Current trade and other payables 2,023 1,855
Trade payables 18 9
Amounts owed to other related parties - 8
Deferred income 9 6
Other 36 4
Non-current trade and other payables 63 27
Total trade and other payables 2,086 1,882
17 Provisions
At 1 July 2012
Reclassified during
the year
Provided (released)
during the year
Utilised during
the year
At 30 June
2013
£m £m £m £m £m
Current liabilities
Restructuring provision 6 - 13 (3) 16
Acquired and acquisition-related provisions 15 (1) (14) - -
Customer-related provisions - - 47 (6) 41
Other provisions 22 17 17 (19) 37
43 16 63 (28) 94
Non-current liabilities
Other provisions 12 2 6 (6) 14
18 Borrowings
2013 2012
£m £m
Current borrowings
Obligations under finance leases 11 8
Non-current borrowings
Guaranteed Notes 2,843 2,338
Obligations under finance leases 66 60
2,909 2,398

27
19 Share capital
2013 2012
£m £m
Allotted, called-up and fully paid shares of 50p
1,593,905,182 (2012: 1,674,454,881) 797 837
20 Shareholders’ equity Purchase of own equity shares for cancellation
On 29 November 2011, at the Company’s AGM, the Company was granted the authority to return £750 million of capital to shareholders via
a share buy-back programme. This authority was subject to an agreement between the Company and Twenty-First Century Fox, Inc.
(formerly known as News Corporation) (and others) dated 28 July 2011 whereby following any market purchases of shares by the Company,
Twenty-First Century Fox, Inc. would sell to the Company sufficient shares to maintain its percentage shareholding at the same level as
applied prior to those market purchases. The price payable to Twenty-First Century Fox, Inc. would be the price payable by the Company in
respect of the relevant market purchases (the “2011 Share Buy-back Agreement”).
At the Company’s AGM on 1 November 2012, the Company was granted the authority to return a further £500 million of capital to
shareholders via a share buy-back programme. This authority was subject to an agreement between the Company and Twenty-First
Century Fox, Inc. (and others) dated 28 July 2012 on substantially the same terms as the 2011 Share Buy-back Agreement.
During the year, the Company purchased, and subsequently cancelled, 80,549,699 ordinary shares at an average price of £7.75 per share,
with a nominal value of £40 million, for a consideration of £627 million. Consideration included stamp duty and commission of £3 million.
This represents 5% of called-up share capital at the beginning of the period. Of these purchases, the Company purchased, and
subsequently cancelled, 31,525,314 ordinary shares from Twenty-First Century Fox, Inc. at an average price of £7.75 per share, with a nominal
value of £16 million, for a consideration of £245 million. Consideration included stamp duty of £1 million.
During the prior year, the Company purchased, and subsequently cancelled, 78,387,718 ordinary shares at an average price of £6.92 per
share, with a nominal value of £39 million, for a total consideration of £546 million. Consideration included stamp duty and commission of
£3 million. This represented 4% of called-up share capital at the beginning of the period. Of these purchases, the Company purchased, and
subsequently cancelled, 30,679,157 ordinary shares from Twenty-First Century Fox, Inc. at an average price of £6.92 per share, with a
nominal value of £15 million, for a consideration of £213 million. Consideration included stamp duty of £1 million.
21 Notes to the Consolidated Cash Flow Statement
Reconciliation of profit before tax to cash generated from operations
2013 2012
£m £m
Profit before tax 1,257 1,189
Depreciation and impairment of property, plant and equipment 176 179
Amortisation and impairment of intangible assets 202 165
Share-based payment expense 80 66
Net finance costs 80 93
Share of results of joint ventures and associates (46) (39)
1,749 1,653
Decrease (increase) in trade and other receivables 35 (32)
Increase in inventories (93) (81)
Increase in trade and other payables 136 175
Increase in provisions 52 25
Decrease in derivative financial instruments (2) (3)
Cash generated from operations 1,877 1,737
22 Events after the reporting period
On 25 July 2013, the Board agreed to seek the necessary approvals to return a further £500 million of capital to shareholders via a share
buy-back programme. Shareholder approvals will be sought at the Company’s AGM on 22 November 2013. The Company has entered into an
agreement with Twenty-First Century Fox, Inc. (formerly known as News Corporation) (and others) under which, following any market
purchases of shares by the Company, Twenty-First Century Fox, Inc. will sell to the Company sufficient shares to maintain its percentage
shareholding at the same level as applied prior to those market purchases. The price payable to Twenty-First Century Fox, Inc. will be the
price payable by the Company in respect of the relevant market purchases. The agreement is conditional on the appropriate shareholder
approvals being granted. The effect of the agreement is to provide that there will be no change in Twenty-First Century Fox, Inc.’s economic
or voting interests in the Company as a result of the share buy-back programme.

28
Appendix 2 – Non-GAAP measures
Reconciliation of cash generated from operations to adjusted free cash flow
for the year ended 30 June 2013
2013 2012
Note £m £m
Cash generated from operations 21 1,877 1,737
Interest received 29 17
Taxation paid (300) (254)
Dividends received from joint ventures and associates 43 39
Net funding to joint ventures and associates (4) (6)
Purchase of property, plant and equipment (203) (228)
Purchase of intangible assets (251) (229)
Interest paid (128) (125)
Free cash flow 1,063 951
Receipt following final settlement of disputes with a former manufacturer of set-top boxes(i)
(10) -
Cash paid relating to a corporate efficiency programme 4 -
Receipt following an Ofcom determination(i)
(28) -
Cash paid relating to one-off upgrade of set-top boxes(i)
7 -
Cash paid relating to programme to offer wireless connectors to selected Sky Movies
customers(i)
1 -
Cash paid relating to the acquisition and integration of the O2 consumer broadband and
fixed-line telephony business 4 -
Net recovery of costs in relation to News Corporation (subsequently renamed Twenty-First
Century Fox, Inc.) proposal(i)
- (13)
Cash paid relating to a restructuring exercise - 3
Recovery of import duty on set-top boxes(i)
- (25)
Receipt on disposal of joint venture(i)
(13) (6)
Adjusted free cash flow 1,028 910
(i) Net of applicable corporation tax.
Net debt
2013 2012
£m £m
Current borrowings 11 8
Non-current borrowings 2,909 2,398
Borrowings-related derivative financial instruments (327) (356)
Gross debt 2,593 2,050
Cash and cash equivalents (815) (464)
Short-term deposits (595) (710)
Net debt 1,183 876
29
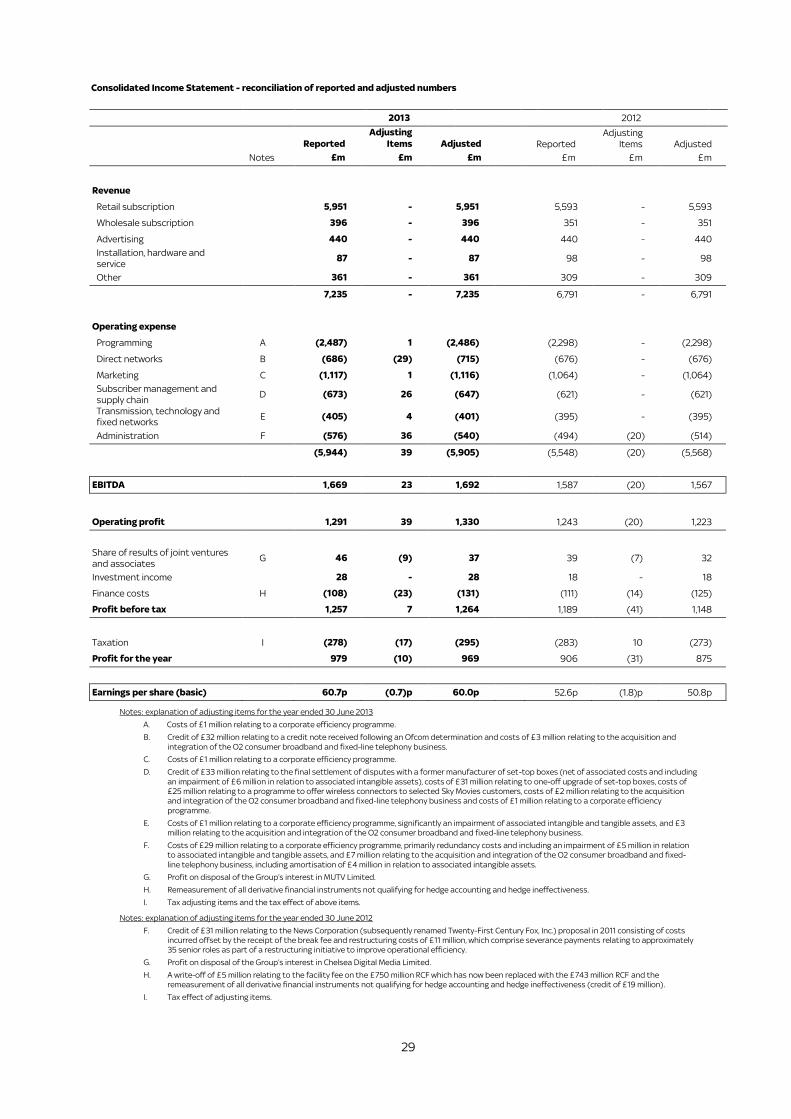
Consolidated Income Statement - reconciliation of reported and adjusted numbers
Notes: explanation of adjusting items for the year ended 30 June 2013
A. Costs of £1 million relating to a corporate efficiency programme.
B. Credit of £32 million relating to a credit note received following an Ofcom determination and costs of £3 million relating to the acquisition and
integration of the O2 consumer broadband and fixed-line telephony business.
C. Costs of £1 million relating to a corporate efficiency programme.
D. Credit of £33 million relating to the final settlement of disputes with a former manufacturer of set-top boxes (net of associated costs and including
an impairment of £6 million in relation to associated intangible assets), costs of £31 million relating to one-off upgrade of set-top boxes, costs of
£25 million relating to a programme to offer wireless connectors to selected Sky Movies customers, costs of £2 million relating to the acquisition
and integration of the O2 consumer broadband and fixed-line telephony business and costs of £1 million relating to a corporate efficiency
programme.
E. Costs of £1 million relating to a corporate efficiency programme, significantly an impairment of associated intangible and tangible assets, and £3
million relating to the acquisition and integration of the O2 consumer broadband and fixed-line telephony business.
F. Costs of £29 million relating to a corporate efficiency programme, primarily redundancy costs and including an impairment of £5 million in relation
to associated intangible and tangible assets, and £7 million relating to the acquisition and integration of the O2 consumer broadband and fixed-
line telephony business, including amortisation of £4 million in relation to associated intangible assets.
G. Profit on disposal of the Group’s interest in MUTV Limited.
H. Remeasurement of all derivative financial instruments not qualifying for hedge accounting and hedge ineffectiveness.
I. Tax adjusting items and the tax effect of above items.
Notes: explanation of adjusting items for the year ended 30 June 2012
F. Credit of £31 million relating to the News Corporation (subsequently renamed Twenty-First Century Fox, Inc.) proposal in 2011 consisting of costs
incurred offset by the receipt of the break fee and restructuring costs of £11 million, which comprise severance payments relating to approximately
35 senior roles as part of a restructuring initiative to improve operational efficiency.
G. Profit on disposal of the Group’s interest in Chelsea Digital Media Limited.
H. A write-off of £5 million relating to the facility fee on the £750 million RCF which has now been replaced with the £743 million RCF and the
remeasurement of all derivative financial instruments not qualifying for hedge accounting and hedge ineffectiveness (credit of £19 million).
I. Tax effect of adjusting items.
2013 2012
Reported
Adjusting
Items Adjusted Reported
Adjusting
Items Adjusted
Notes £m £m £m £m £m £m
Revenue
Retail subscription 5,951 - 5,951 5,593 - 5,593
Wholesale subscription 396 - 396 351 - 351
Advertising 440 - 440 440 - 440
Installation, hardware and
service 87 - 87 98 - 98
Other 361 - 361 309 - 309
7,235 - 7,235 6,791 - 6,791
Operating expense
Programming A (2,487) 1 (2,486) (2,298) - (2,298)
Direct networks B (686) (29) (715) (676) - (676)
Marketing C (1,117) 1 (1,116) (1,064) - (1,064)
Subscriber management and
supply chain
D (673) 26 (647) (621) - (621)
Transmission, technology and
fixed networks E (405) 4 (401) (395) - (395)
Administration
F (576) 36 (540) (494) (20) (514)
(5,944) 39 (5,905) (5,548) (20) (5,568)
EBITDA 1,669 23 1,692 1,587 (20) 1,567
Operating profit 1,291 39 1,330 1,243 (20) 1,223
Share of results of joint ventures
and associates G 46 (9) 37 39 (7) 32
Investment income 28 - 28 18 - 18
Finance costs H (108) (23) (131) (111) (14) (125)
Profit before tax 1,257 7 1,264 1,189 (41) 1,148
Taxation I (278) (17) (295) (283) 10 (273)
Profit for the year 979 (10) 969 906 (31) 875
Earnings per share (basic) 60.7p (0.7)p 60.0p 52.6p (1.8)p 50.8p