Embed Size (px)
Citation preview

British Journal of Political Sciencehttp://journals.cambridge.org/JPS
Additional services for British Journal of Political Science:
Email alerts: Click hereSubscriptions: Click hereCommercial reprints: Click hereTerms of use : Click here
The Compleat Economic Voter: New Theory and British Evidence
Michael S. LewisBeck, Richard Nadeau and Martial Foucault
British Journal of Political Science / FirstView Article / September 2012, pp 1 21DOI: 10.1017/S0007123412000440, Published online:
Link to this article: http://journals.cambridge.org/abstract_S0007123412000440
How to cite this article:Michael S. LewisBeck, Richard Nadeau and Martial Foucault The Compleat Economic Voter: New Theory and British Evidence. British Journal of Political Science, Available on CJO doi:10.1017/S0007123412000440
Request Permissions : Click here
Downloaded from http://journals.cambridge.org/JPS, IP address: 132.204.3.57 on 02 Oct 2012
B.J.Pol.S., Page 1 of 21 Copyright r Cambridge University Press, 2012
doi:10.1017/S0007123412000440
The Compleat Economic Voter: New Theory andBritish Evidence
MICHAEL S. LEWIS-BECK, RICHARD NADEAU AND
MARTIAL FOUCAULT*
Almost all the prolific work done on economic voting has been based on the classic reward–punishmentmodel, which treats the economy as a valence issue. The economy is a valence issue, but it is much morethan that. This article explores two other dimensions of economic voting – position and patrimony.Investigating a 2010 British survey containing relevant measures on these three dimensions, the authorsestimate their impact on vote intention, using a carefully specified system of equations. According to theevidence reported, each dimension of economic voting has its own independent effect. Moreover,together, they reveal a ‘compleat’ economic voter, who wields considerable power over electoral choice inBritain. This new result confirms and extends recent work on American and French elections.
Economic voting has come of age, some might even say attained ‘old age’, as it faceschallenges to its very survival. The extant literature, which now comes to hundreds ofstudies, consistently exhibits significant effects of economic evaluation on vote choice.1
Despite this persistent finding, at least three claims have been laid against it: instability,endogeneity and unidimensionality. The first claim argues that the magnitude of theeconomic voting coefficient varies greatly across time, place and context, implying it has nofundamental existence. The second claim argues that the economic voting coefficient findsits source in partisan bias, having no independent existence of its own. The third claim, anew one, argues that economic voting theory has narrowly restricted its attention to valenceissues, thereby excluding the important dimensions of policy position and patrimony.The first and second claims have received serious treatment elsewhere. We do not weigh
in on those arguments, other than to note that these claims have met vigorouscounterclaims, which some scholars will (and some will not) find convincing.2 The third
* Lewis-Beck – Department of Political Science, University of Iowa (email: [email protected]; Nadeau and Foucault – Department of Political Science, Universite de Montreal. This articlewas first presented at the Annual Conference of the American Political Science Association, Seattle, 2011. Anappendix can be found on the Journal’s website at http://www.journals.cambridge.org/jps.
1 See the literature reviews in the following: Raymond Duch and Randy Stevenson, The EconomicVote: How Political and Economic Institutions Condition Election Results (Cambridge: CambridgeUniversity Press, 2008); Michael S. Lewis-Beck and Mary Stegmaier, ‘Economic Determinants ofElectoral Outcomes’, Annual Review of Political Science, 3 (2000), 183–219; Michael S. Lewis-Beck andMary Stegmaier, ‘Economic Models of the Vote’, in Russell Dalton and Hans-Dieter Klingemann, eds,The Oxford Handbook of Political Behavior (Oxford: Oxford University Press, 2007), pp. 518–37; MichaelS. Lewis-Beck and Mary Stegmaier, ‘The Economic Vote in Transitional Democracies’, Journal ofElections, Public Opinion, and Parties, 18 (2008), 303–23; Helmut Norpoth, ‘The Economy’ in LaurenceLeDuc, Richard G. Niemi and Pippa Norris, eds, Comparing Democracies: Elections and Voting in GlobalPerspectives (Thousand Oaks: Sage, 1996), 299–318; Peter Nannestad and Martin Paldam, ‘The VPFunction: A Survey of the Literature on Vote and Popularity Functions after 25 Years’, Public Choice,79 (1994), 213–45.
2 For debate surrounding the first, see as opposing examples Christopher Anderson, ‘The End ofEconomic Voting? Contingency Dilemmas and the Limits of Democratic Accountability’, Annual Review

claim deals with relatively unexplored terrain. The argument here is that the economicvote should not be just about valence – that is, about whether the economy prospers.In addition, it should include a consideration of the voter’s position on economicpolicy.3 Besides a policy dimension, the argument extends to inclusion of a patrimonialdimension – that is, the voter’s ownership of property.4
The notion that the theory of the economic vote, properly defined, composes threedimensions – valence, position and patrimony – receives fullest theoretical development inLewis-Beck and Nadeau.5 Empirically, these ideas have been tested, to good effect, on theAmerican and French electorates.6 To date, then, analysis has been conducted only onpresidential (i.e., the United States) or semi-presidential systems (i.e., France).In the work at hand, we make a critical extension of the model, to a parliamentary
system, namely Britain. We view this extension as critical, because parliamentary systemsmilitate against the undergirding psychological mechanism of economic voting, i.e., theattribution of responsibility theory whereby reward or punishment occurs.7 In particular,in a parliamentary system, as opposed to a presidential one, responsibility for economicpolicy might be so diffuse that the expected punitive vote cannot be discerned. Our Britishtest is made possible by the availability of a unique 2010 dataset, described below. Theadvantage of this dataset comes in making possible further tests of economic votingtheory. The results also speak to the actual 2010 victory of David Cameron and theConservatives. However, the data, by the nature of their special battery status, are notintended to serve as the base for a detailed explanation of the 2010 contest. For thatpurpose, the standard British Election Study data for 2010 are available, and should beconsulted.8 Our aim here is more specific: to offer further cross-national testing of
(F’note continued)
of Political Scienc, 10 (2007), 271–96; Paolo Bellucci and Michael S. Lewis-Beck, ‘A Stable PopularityFunction? Cross-National Analysis’, European Journal of Political Research, 50 (2011), 190–211. On thesecond, see as opposing examples Geoffrey Evans and Robert Anderson, ‘The Political Conditioning ofEconomic Perceptions’, Journal of Politics, 68 (2006), 194–207; and Michael S. Lewis-Beck, RichardNadeau and Angelo Elias, ‘Economics, Party and the Vote: Causality Issues and Panel Data’, AmericanJournal of Political Science, 52 (2008), 84–95.
3 See the founding discussion in D. Roderick Kiewiet, Macroeconomics and Micropolitics: TheElectoral Effects of Economic Issues (Chicago: Chicago University Press, 1983); and the current argumentsby Michael S. Lewis-Beck and Richard Nadeau, ‘Obama and the Economy in 2008’, Political Science &Politics, 42 (2009), 479–83.
4 See the pivotal paper by Richard Nadeau, Martial Foucault and Michael S. Lewis-Beck,‘Patrimonial Economic Voting: Legislative Elections in France’, West European Politics, 33 (2010),1261–77.
5 Michael S. Lewis-Beck and Richard Nadeau, ‘Economic Voting Theory: Neglected Dimensions’,Electoral Studies, 30 (2011), 288–94.
6 See, respectively, Lewis-Beck and Nadeau, ‘Obama and the Economy in 2008’; and Lewis-Beck andNadeau, ‘Economic Voting Theory’, on the 2008 US presidential election; Richard Nadeau, MartialFoucault and Michael S. Lewis-Beck, ‘Assets and Risk: A Neglected Dimension of Economic Voting’,French Politics, 9 (2011), 97–119; Martial Foucault, Richard Nadeau and Michael S. Lewis-Beck,‘La persistance de l’effet patrimoine lors des elections presidentielles francaises’, Revue francaise de sciencepolitique, 61 (2011), 659–80, on French presidential elections; and Nadeau, Foucault and Lewis-Beck,‘Patrimonial Economic Voting’, on French legislative elections.
7 Michael S. Lewis-Beck and Martin Paldam, ‘Economic Voting: An Introduction’, Electoral Studies,19 (2000), 113–21.
8 In this connection, see a recent paper offering an in-depth treatment of the 2010 race: Harold D.Clarke, David Sanders, Marianne C. Stewart and Paul Whiteley, ‘Valence Politics and Electoral Choice inBritain, 2010’, Journal of Elections, Public Opinion and Parties, 21 (2011), 237–53.
2 LEWIS-BECK, NADEAU AND FOUCAULT

multiple-dimensions of economic voting theory, which, taken together, help to definewhat we call the ‘compleat economic vote’.9
THEORY
Rival theories for explaining the national vote in democracies generally, and Britainin particular, are plentiful. They can be sorted by their leading variables: socio-logical, partisan, issues, leaders. A recent treatment of British elections examines thepotency of models employing these four sets of variables, plus a fifth called the ‘economicvoting model’, our primary interest here.10 The idea that the economy links itselfto British elections has a venerable pedigree. First, Stokes labels economics the valenceissue par excellence.11 Then, writing with Butler in Political Change in Britain, theyelaborate:
issues of economic well-being [are] y as close as any to being pure ‘valence’ issues. If weconceive of economic issues in dimensional terms, the electorate is not spread along acontinuum of preference extending between good times and bad; its beliefs are overwhelminglyconcentrated at the good times end of such a continuum.12
These authors go on to offer an early articulation of traditional reward–punishmenteconomic voting theory: ‘the electorate’s response to the economy is one under which votersreward the Government for the conditions they welcome and punish the Government forthe conditions they dislike’.13 Current studies of economics as a valence issue for the Britishelectorate are thoroughly exploited by, most recently, Clarke, Sanders, Stewart andWhiteley.14 Their work carries on the important analytic distinctions that have developed inthe economic voting literature, separating retrospective and prospective evaluations, andsociotropic and egocentric evaluations.15
Now we turn to the next dimension – the economy as a position issue. Further earlytheorizing by Stokes, responding to the spatial modelling ideas of Downs,16 is relevant: ‘Letus call ‘‘position issues’’ those that involve advocacy of government actions from a setof alternatives over which a distribution of voter preferences is defined.’17 Since thattime, scholars of British elections have spilled considerable ink analysing the impact of
9 ‘Compleat’ is an older form of the English word ‘complete’. We use it to emphasize the necessity ofexploring all the parts, or dimensions, of economic voting theory. An early example of such usage showsitself in the title of Izaak Walton’s 1653 book on fishing, The Compleat Angler. See the discussion in JessStein, ed., Random House Dictionary of the English Language, The Unabridged Edition (New York:Random House, 1967), p. 301.
10 Harold D. Clarke, David Sanders, Marianne C. Stewart and Paul Whiteley, Political Choice inBritain (Oxford: Oxford University Press, 2004).
11 Donald E. Stokes, ‘Spatial Models of Party Competition’, American Political Science Review,57 (1963), 368–77, p. 373.
12 David Butler and Donald E. Stokes, Political Change in Britain (New York: St. Martin’s, 1969), p. 390.13 Butler and Stokes, Political Change in Britain, p. 392.14 Harold D. Clarke, David Sanders, Marianne C. Stewart and Paul Whiteley, Performance Politics and
the British Vote (Cambridge: Cambridge University Press, 2009).15 On the theoretical origins of these differences, see especially Morris P. Fiorina, Retrospective Voting
in American National Elections (New Haven, Conn.: Yale University Press 1981), pp. 6, 26); and DonaldR. Kinder and D. Roderick Kiewiet, ‘Sociotropic Politics: The American Case’, British Journal ofPolitical Science, 11 (1981), 129–61.
16 Anthony Downs, Economic Theory of Democracy (New York: Harper and Row, 1957).17 Stokes, ‘Spatial Models of Party Competition’, p. 373.
The Compleat Economic Voter 3

position issues of all kinds on the voter, including – but going well beyond – economicposition issues.18
A classic illustration of economics as a position issue comes from Butler and Stokeswriting on nationalization, which they use as a lead example: ‘Many issues presentalternative policies or conditions whose value is a matter of disagreement in the country.Nationalization is one of these’.19 For instance, in 1966, 25 per cent of the Britishpublic favoured more nationalization of industry, 42 per cent favoured the status quo,19 per cent favoured less, and 14 per cent had no opinion.20 Many illustrations of positionissues on economic policy come to mind: market regulation, income redistribution,welfare spending, the tax schedule, among others. Voters, we know, tend to take varyingpositions on issues of this sort. For example, some citizens favour more governmentregulation of business, while other citizens favour less. In this case, the regulationquestion could lead certain voters to support Labour (as the pro-regulation party), andother voters to support the Conservatives (as the anti-regulation party).When economic voting is positional, the party closest to the voter’s policy view is
chosen, in the manner described by Downs.21 This means that the voter selects on thebasis of preference, regardless of whether the party is in government or not. Theseeconomic voters are what Kiewiet labels policy-oriented, instead of incumbency-orientedfrom the parlance of the classical economic voting hypothesis.22 A British example mightbe the behaviour of voters who, seeking to lower unemployment, always vote Labourbecause they feel Labour will always excel on that issue.Finally, we turn to the last dimension – the economics of patrimony. This ‘new’ idea is
actually old, and concerns the voter’s relationship to the means of economic production.What citizens own (or not) shapes their material interests, which in turn shapes their votechoice. By ownership we do not mean simply social class, as commonly measured objectivelyor subjectively.23 Nor do we mean the link between income and vote, which represents agrowing line of research.24 Measures of class and income should of course stand as keycontrol variables in any well-specified vote equation. But the notion of patrimony differsfrom these widely-used socio-demographic concepts. Page and Shapiro’s recent work about
18 Mark Franklin, The Decline of Class Voting in Britain (Oxford: Oxford University Press, 1985);Anthony Heath, Roger M. Jowell and John K. Curtice, How Britain Votes (Oxford: Pergamon Press,1985), p. 199; Richard Rose and Ian McAllister, Voters Begin to Choose (London: Sage Publications,1986); Richard Rose and Ian McAllister, The Loyalties of Voters: A Lifetime Learning Model (London:Sage Publications, 1990); Bo Sarlvik and Ivor Crewe, Decade of Dealignment: The Conservative Victory of1970 and Electoral Trends in the 1970s (Cambridge: Cambridge University Press, 1983). ‘Issue voting’, asit is sometimes called, has also been well-pursued in American electoral studies; see the review in MichaelS. Lewis-Beck, William G. Jacoby, Helmut Norpoth and Herbert F. Weisberg, The American VoterRevisited (Ann Arbor: The University of Michigan Press, 2008), chap. 8.
19 Butler and Stokes, Political Change in Britain, pp. 188–9.20 Butler and Stokes, Political Change in Britain, p. 177.21 Downs, Economic Theory of Democracy.22 D. Roderick Kiewiet, Macroeconomics and Micropolitics: The Electoral Effects of Economic Issues
(Chicago: Chicago University Press, 1983), chap. 2.23 Paul A. Abramson, John H. Aldrich and David W. Rohde, Change and Continuity in the 2000
Elections (Washington, D.C.: Congressional Quarterly Press, 2003), pp. 113–15; William H. Flanagan andNancy Zingale, Political Behavior of the American Electorate, 11th edn (Washington, D.C.: CongressionalPress Quarterly, 2006), pp. 115–18.
24 Larry Bartels, Unequal Democracy: The Political Economy of the New Gilded Age (Princeton, N.J.:Princeton University Press, 2008); Jeffrey M. Stonecash, Class and Party in American Politics (Boulder,Colo.: Westview Press, 2000).
4 LEWIS-BECK, NADEAU AND FOUCAULT

Americans’ conception of wealth supports this idea. According to them, wealth is no mysteryfor most Americans and consists of ‘your house value (subtracting mortgage value), yourmoney in a bank, and any stocks, bonds and other assets you own’.25
The belief that what you own moulds your political action goes back to Marx and histheory of social change.26 The economic structure of society forms itself from the relationsof production between owners and workers. In a standard stylized illustration, the ownerspossess the land, equipment, buildings necessary to produce goods. The workers own onlytheir bodies, which they employ labouring in factories owned by capitalists. The dynamicbetween those who possess property, such as factories, and those who possess only theirhands, drives the political engine. Workers receive labour income (wages) and capitalistsreceive capital income (dividends). This usual dichotomy deeply affects the channel bywhich people may accumulate different types of assets, namely their wealth, and leadsthem to seek protection with their favoured public policies. Owners make political choicesin their interest, while workers make political choices in their interest. These interestsare inevitably opposed, so ensuring an ongoing class struggle. How to measure class?The indicators of class commonly used by social scientists today tap directly or indirectlyincome, occupation and education.27 But these contemporary indicators manageempirically to account for just part of the classic ownership variable. Patrimony, whichdirectly measures property ownership, seems much preferred, conceptually andquantitatively, to these more conventional and partial measures.Let us take an example. Suppose Voter A has considerable wealth, say in the form of
stocks. Suppose Voter B possesses only a little wealth, say in the form of a small savingsaccount. We would expect Voter A to seek government economic policies than enhancehis or her stock portfolio, while Voter B would simply seek policies that made his or hersmall savings secure. For the United States, the suggestion is that Voter A would be morelikely to vote Republican, as they are seen as ‘the party of business’. Such tendencies havebeen demonstrated to be case in the United States, at least for the 2008 presidentialelection.28 A similar pattern has also been demonstrated in French presidential elections,by a more favourable vote for right-wing governments. Further, in Australia, which hadthe world’s highest levels of private share-ownership in the 2000s, Donoghue et al. haveobserved that ‘shareowners are from one an half to three times as likely as non-shareowners to vote for the [conservative] Coalition’.29 This finding, however, doessuggest a difference between share ownership and home ownership as expressions ofcitizenship, since home owners’ support for the Coalition was at best muted.30
25 Benjamin I. Page and Lawrence R. Jacobs, Class War? What Americans Really Think aboutEconomic Inequality (Chicago: University of Chicago Press, 2009), p. 38.
26 The bibliography on Marxism has an almost paralysing vastness. Therefore, we suggest two simplepoints on the compass. First, Hobsbawm’s brilliant edited volume on The Communist Manifesto (KarlMarx, Friedrich Engels and Eric J. Hobsbawm, The Communist Manifesto: A Modern Edition (London:Verso, 2012)); secondly, Popper’s unparalleled critique (Karl Popper, The Open Society and Its Enemies,vol. 2 (Hegel and Marx) (London and New York: Routledge, 1945)).
27 Lewis-Beck, Jacoby, Norpoth and Weisberg, The American Voter Revisited.28 Lewis-Beck and Nadeau, ‘Obama and the Economy in 2008’, pp. 479–83.29 Jed Donoghue, Bruce Tranter and Robert White, ‘Homeownership, Shareownership and Coalition
Policy’, Journal of Australian Political Economy, 52 (2003), 58–82, p. 71.30 Patrick Troy, ‘Suburbs of Acquiescence, Suburbs of Protest’, Housing Studies, 15 (2000), 717–38;
Ian McAllister, ‘Housing Tenure and Party Choice in Australia, Britain and the United States’, BritishJournal of Political Science, 14 (1984), 509–22.
The Compleat Economic Voter 5
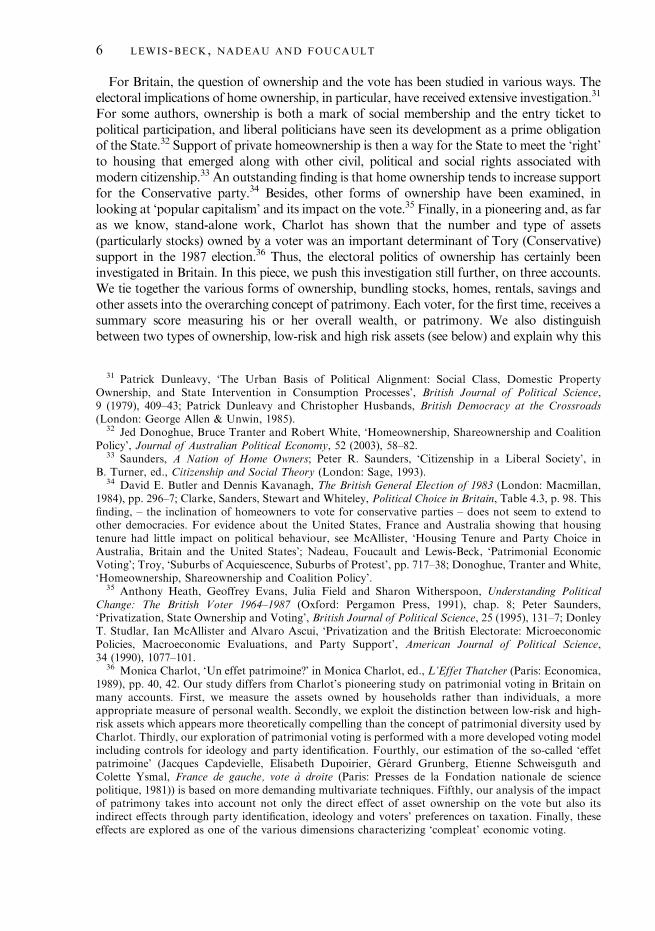
For Britain, the question of ownership and the vote has been studied in various ways. Theelectoral implications of home ownership, in particular, have received extensive investigation.31
For some authors, ownership is both a mark of social membership and the entry ticket topolitical participation, and liberal politicians have seen its development as a prime obligationof the State.32 Support of private homeownership is then a way for the State to meet the ‘right’to housing that emerged along with other civil, political and social rights associated withmodern citizenship.33 An outstanding finding is that home ownership tends to increase supportfor the Conservative party.34 Besides, other forms of ownership have been examined, inlooking at ‘popular capitalism’ and its impact on the vote.35 Finally, in a pioneering and, as faras we know, stand-alone work, Charlot has shown that the number and type of assets(particularly stocks) owned by a voter was an important determinant of Tory (Conservative)support in the 1987 election.36 Thus, the electoral politics of ownership has certainly beeninvestigated in Britain. In this piece, we push this investigation still further, on three accounts.We tie together the various forms of ownership, bundling stocks, homes, rentals, savings andother assets into the overarching concept of patrimony. Each voter, for the first time, receives asummary score measuring his or her overall wealth, or patrimony. We also distinguishbetween two types of ownership, low-risk and high risk assets (see below) and explain why this
31 Patrick Dunleavy, ‘The Urban Basis of Political Alignment: Social Class, Domestic PropertyOwnership, and State Intervention in Consumption Processes’, British Journal of Political Science,9 (1979), 409–43; Patrick Dunleavy and Christopher Husbands, British Democracy at the Crossroads(London: George Allen & Unwin, 1985).
32 Jed Donoghue, Bruce Tranter and Robert White, ‘Homeownership, Shareownership and CoalitionPolicy’, Journal of Australian Political Economy, 52 (2003), 58–82.
33 Saunders, A Nation of Home Owners; Peter R. Saunders, ‘Citizenship in a Liberal Society’, inB. Turner, ed., Citizenship and Social Theory (London: Sage, 1993).
34 David E. Butler and Dennis Kavanagh, The British General Election of 1983 (London: Macmillan,1984), pp. 296–7; Clarke, Sanders, Stewart and Whiteley, Political Choice in Britain, Table 4.3, p. 98. Thisfinding, – the inclination of homeowners to vote for conservative parties – does not seem to extend toother democracies. For evidence about the United States, France and Australia showing that housingtenure had little impact on political behaviour, see McAllister, ‘Housing Tenure and Party Choice inAustralia, Britain and the United States’; Nadeau, Foucault and Lewis-Beck, ‘Patrimonial EconomicVoting’; Troy, ‘Suburbs of Acquiescence, Suburbs of Protest’, pp. 717–38; Donoghue, Tranter and White,‘Homeownership, Shareownership and Coalition Policy’.
35 Anthony Heath, Geoffrey Evans, Julia Field and Sharon Witherspoon, Understanding PoliticalChange: The British Voter 1964–1987 (Oxford: Pergamon Press, 1991), chap. 8; Peter Saunders,‘Privatization, State Ownership and Voting’, British Journal of Political Science, 25 (1995), 131–7; DonleyT. Studlar, Ian McAllister and Alvaro Ascui, ‘Privatization and the British Electorate: MicroeconomicPolicies, Macroeconomic Evaluations, and Party Support’, American Journal of Political Science,34 (1990), 1077–101.
36 Monica Charlot, ‘Un effet patrimoine?’ in Monica Charlot, ed., L’Effet Thatcher (Paris: Economica,1989), pp. 40, 42. Our study differs from Charlot’s pioneering study on patrimonial voting in Britain onmany accounts. First, we measure the assets owned by households rather than individuals, a moreappropriate measure of personal wealth. Secondly, we exploit the distinction between low-risk and high-risk assets which appears more theoretically compelling than the concept of patrimonial diversity used byCharlot. Thirdly, our exploration of patrimonial voting is performed with a more developed voting modelincluding controls for ideology and party identification. Fourthly, our estimation of the so-called ‘effetpatrimoine’ (Jacques Capdevielle, Elisabeth Dupoirier, Gerard Grunberg, Etienne Schweisguth andColette Ysmal, France de gauche, vote a droite (Paris: Presses de la Fondation nationale de sciencepolitique, 1981)) is based on more demanding multivariate techniques. Fifthly, our analysis of the impactof patrimony takes into account not only the direct effect of asset ownership on the vote but also itsindirect effects through party identification, ideology and voters’ preferences on taxation. Finally, theseeffects are explored as one of the various dimensions characterizing ‘compleat’ economic voting.
6 LEWIS-BECK, NADEAU AND FOUCAULT

distinction matters for voting behaviour (see below). Finally, we test the impact of suchpatrimony on the vote, within the framework of a fully developed economic voting model.
DATA AND MEASURES
The British electorate stands as one of the best studied in the world. The British ElectionStudy (BES) alone has regularly fielded, since 1964, national survey samples at each generalelection. These investigations have been, arguably, second to none in their range andsophistication, and the 2010 BES is no exception. Nevertheless, though a comprehensiveinstrument, it does not generally administer all the economic voting items we need to test ourmulti-dimensional hypotheses. For this, special item batteries had to be designed, and theywere fielded in Wave Five of the British Cooperation Campaign Analysis Project (BCCAP),in a national internet survey carried out just before the 10 May 2010 election. Further detailson the survey methodology appear in Appendix 1 online, as does the wording of the itemsused to measure each variable subsequently analysed.The economic items, our central focus, deserve special attention. To assess the economy
as a valence issue, we use a classic sociotropic retrospective question, asking therespondent to evaluate the quality of national economic performance over the past year(with the responses eventually scaled 0–1). Table 1A presents the wording and thedistribution on this variable, going into the 2010 British general election.To assess the economy as a position issue, we employ a question on tax policy, an item
first used in a pre-election survey of the 2008 US presidential election.37 The question
TABLE 1 Voters’ Economic Perceptions and Position on TaxationFairness in the 2010 British General Election
Panel A. Economic Perceptions (%)
Better, same 42Worse 34Much worse 23N 757
Panel B. Fairness in Tax Policy
Rich 60 and poor 10 32Rich 50 and poor 20 41Rich 40 and poor 30 10Rich 30 and poor 30 10Don’t know 8N 762
Panel A Question: ‘Would you say that over the past year the nation’s economy hasgotten much better, gotten better, stayed about the same, gotten worse, or gottenmuch worse?’. Panel B Question: ‘Suppose a rich person has one pound sterling, and apoor person has one pound sterling. How much tax should be paid on that pound?Rich person pays 60 pence, poor person pays 10 pence; rich person pays 50 pence,poor person pas 20 pence; rich person pays 40 pence, poor person pays 30 pence; richperson pays 30 pence and poor person pays 30 pence.’Source: BCCAP 2010 (Wave 5).
37 Lewis-Beck and Nadeau, ‘Obama and the Economy in 2008’, pp. 479–83.
The Compleat Economic Voter 7
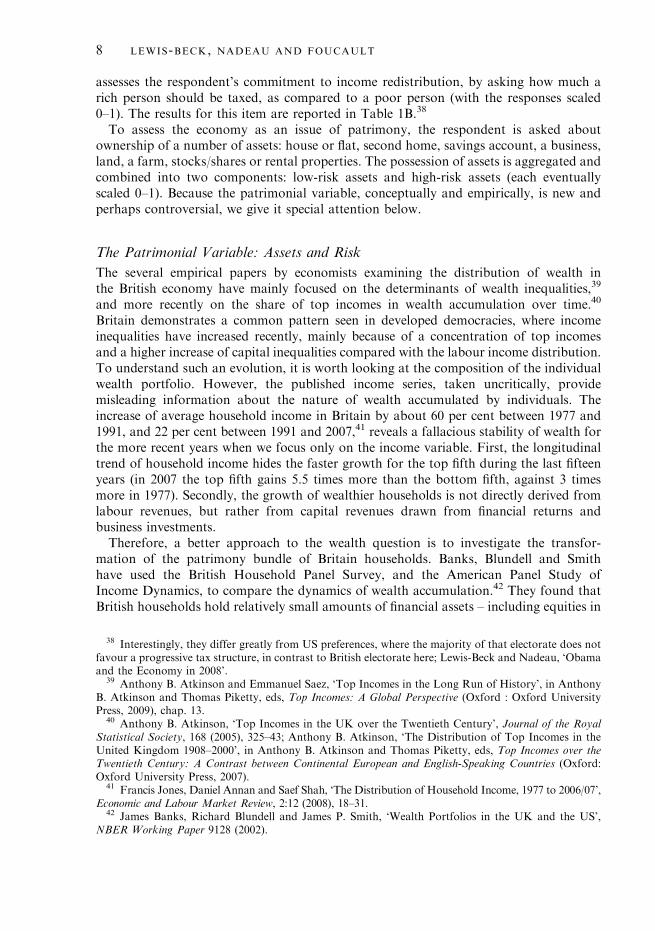
assesses the respondent’s commitment to income redistribution, by asking how much arich person should be taxed, as compared to a poor person (with the responses scaled0–1). The results for this item are reported in Table 1B.38
To assess the economy as an issue of patrimony, the respondent is asked aboutownership of a number of assets: house or flat, second home, savings account, a business,land, a farm, stocks/shares or rental properties. The possession of assets is aggregated andcombined into two components: low-risk assets and high-risk assets (each eventuallyscaled 0–1). Because the patrimonial variable, conceptually and empirically, is new andperhaps controversial, we give it special attention below.
The Patrimonial Variable: Assets and Risk
The several empirical papers by economists examining the distribution of wealth inthe British economy have mainly focused on the determinants of wealth inequalities,39
and more recently on the share of top incomes in wealth accumulation over time.40
Britain demonstrates a common pattern seen in developed democracies, where incomeinequalities have increased recently, mainly because of a concentration of top incomesand a higher increase of capital inequalities compared with the labour income distribution.To understand such an evolution, it is worth looking at the composition of the individualwealth portfolio. However, the published income series, taken uncritically, providemisleading information about the nature of wealth accumulated by individuals. Theincrease of average household income in Britain by about 60 per cent between 1977 and1991, and 22 per cent between 1991 and 2007,41 reveals a fallacious stability of wealth forthe more recent years when we focus only on the income variable. First, the longitudinaltrend of household income hides the faster growth for the top fifth during the last fifteenyears (in 2007 the top fifth gains 5.5 times more than the bottom fifth, against 3 timesmore in 1977). Secondly, the growth of wealthier households is not directly derived fromlabour revenues, but rather from capital revenues drawn from financial returns andbusiness investments.Therefore, a better approach to the wealth question is to investigate the transfor-
mation of the patrimony bundle of Britain households. Banks, Blundell and Smithhave used the British Household Panel Survey, and the American Panel Study ofIncome Dynamics, to compare the dynamics of wealth accumulation.42 They found thatBritish households hold relatively small amounts of financial assets – including equities in
38 Interestingly, they differ greatly from US preferences, where the majority of that electorate does notfavour a progressive tax structure, in contrast to British electorate here; Lewis-Beck and Nadeau, ‘Obamaand the Economy in 2008’.
39 Anthony B. Atkinson and Emmanuel Saez, ‘Top Incomes in the Long Run of History’, in AnthonyB. Atkinson and Thomas Piketty, eds, Top Incomes: A Global Perspective (Oxford : Oxford UniversityPress, 2009), chap. 13.
40 Anthony B. Atkinson, ‘Top Incomes in the UK over the Twentieth Century’, Journal of the RoyalStatistical Society, 168 (2005), 325–43; Anthony B. Atkinson, ‘The Distribution of Top Incomes in theUnited Kingdom 1908–2000’, in Anthony B. Atkinson and Thomas Piketty, eds, Top Incomes over theTwentieth Century: A Contrast between Continental European and English-Speaking Countries (Oxford:Oxford University Press, 2007).
41 Francis Jones, Daniel Annan and Saef Shah, ‘The Distribution of Household Income, 1977 to 2006/07’,Economic and Labour Market Review, 2:12 (2008), 18–31.
42 James Banks, Richard Blundell and James P. Smith, ‘Wealth Portfolios in the UK and the US’,NBER Working Paper 9128 (2002).
8 LEWIS-BECK, NADEAU AND FOUCAULT

stock – compared to American households, but a quite similar share compared to Frenchhouseholds.43
British households move into home ownership at relatively young ages, and a largefraction of their individual wealth is concentrated in housing. These findings suggest that,especially in Britain, there have been some fundamental changes in national policiesaimed at encouraging wider rates of home ownership and greater participation in theequity market. The growth of owner-occupation in Britain has been facilitated since theSecond World War by the implementation of tax advantages from the 1960s onward.44
In the 1980s, the Thatcher Government launched a massive sale from the social housingsector to willing tenants.45 Around this time, coinciding with the flotation of previouslynationalized public utilities such as British Telecom (1984) and British Gas (1986),a further set of measures aimed at promoting a ‘share-owning democracy’ – namelytax-favoured employee share ownership schemes – was introduced.A second and recent generation of surveys led by the Office for National Statistics
between July 2006 and June 2008, namely the Wealth and Assets Survey, collected data on30,595 households examining, among other things, the level of assets, savings and debt,and saving for retirement. From this survey, we learn that 92 per cent of Britishhouseholds have a current account, 68 per cent are homeowners, 62 per cent have asavings account, 22.2 per cent hold stocks and 10.5 per cent have subscribed to lifeassurance. All in all, this survey provides a portrayal of British property and financialwealth whose major trends are very close to the electoral data that we exploit in Table 2.The things one owns, an individual’s ‘patrimony’, can be defined, in sum, as cumulated
assets held.46 It is limited to tangible assets, ignoring debt. Table 2A shows thedistribution of assets about the time of the 2010 British general election. There are sixmeasured components: house or flat, second home, savings, stocks/shares, business orland, rental property. As might be expected, given the above discussion, the mostfrequently occurring assets are savings accounts, at 69 per cent, and home ownership, at65 per cent.47 Also, we observe that stock ownership stands at 26 per cent. Taken alltogether, these estimates, which closely parallel the above recounted estimates, from muchmore elaborate surveys, further bolster our confidence in the quality of our commissioned2010 survey.As suggested in Table 2A, assets can be sorted into low-risk and high-risk types.
For theoretical reasons, this distinction has value. We assume, first, that citizens chooseassets according to their degree of risk aversion. Those who wish to avoid risk tend to
43 Data from the French Election Studies and the CCAP project for the 2008 US presidential electionconfirm that the proportion of stock owners is quite similar in France and Britain and clearly higher in theUnited States; this reassuring finding suggests that the survey items used in the study at hand aptlycapture the structure of wealth ownership in different countries; for the French case, see Nadeau,Foucault and Lewis-Beck, ‘Assets and Risk’; Nadeau, Foucault and Lewis-Beck, ‘Patrimonial EconomicVoting’; and Foucault, Nadeau and Lewis-Beck, ‘La persistance de l’effet patrimoine lors des electionspresidentielles francaises’; for the US case, see Lewis-Beck and Nadeau ‘Economic Voting Theory’.
44 Patrick Dunleavy, The Politics of Mass Housing in Britain (Oxford: Oxford University Press, 1981).45 Saunders, A Nation of Home Owners.46 Margo Berman, ‘Examining Risk Attitudes’, Complexity, 9:5 (2004), 25–30; Ted To, ‘Risk and
Evolution’, Economic Theory, 13 (1999), 329–43.47 A good portion of these properties are mortgaged. However, as shall be see below in fn. 59, there are
no significant differences in the vote choices of these respondents, compared to those who own theirhomes outright.
The Compleat Economic Voter 9

accumulate assets that generate a highly certain (but reduced) rate of return. The two typesof assets, risky and non-risky, require different amounts of information for their acquisitionor maintenance. A savings account, for instance, seems non-risky, since it needs littleongoing information to sustain it. The same logic applies to certain other assets, such as ahome. When the asset involves savings or housing, then, little information is needed, and therisks of heavy loss are low, at least in comparison to stock or business assets.48
Following this line of argument, we categorized the six asset items as low risk v. highrisk, and then constructed two scales. Each is an additive index scale, arrived at bysumming the dichotomized items. On the Low-Risk Scale a top score of 3 registerssomeone who has a house or flat, a second home and a savings account, while a score of0 registers someone who has none of these things. Similarly, on the High-Risk Scale, a topscore of 3 registers someone who has stocks, some sort of business and owns rented
TABLE 2 Asset Ownership in Britain, 2010
Panel A. The distribution of asset ownership
Low-risk assetsHouse or apartment 65Country house 3Savings account 69
High-risk assetsStocks 26Business, land or farm 8Rental properties 7
N 762
Panel B. The structure of asset accumulation in the UK
Ownership of low-risk asset0 item 151 item 352 items 493 items 1
Ownership of high-risk assets0 item 661 item 272 items 63 items 0
N 762
Note: Panel A: Entries represent the percentage of households owning specificassets. For details about which items belong to each category of assets, see theonline appendix. Panel B: Entries represent the percentage of households owningthe number of assets indicated for each category of assets. For details about whichitems belong to each category of assets, see the online appendix.Source: BCCAP 2010 (Wave 5).
48 Shlomo Benartzi and Richard H. Thaler, ‘Myopic Loss Aversion and the Equity Premium Puzzle’,Quarterly Journal of Economics, 110 (1995), 73–92; Olof Dahlback, ‘Saving and Risk Taking’, Journal ofEconomic Psychology, 12 (1991), 479–500; C. Huang and R. H. Litzenberger, Foundations for FinancialEconomics (New York: Elsevier Science, 1988). For a more detailed discussion of the theoretical argumentbehind this distinction, see Nadeau, Foucault and Lewis-Beck, ‘Assets and Risk’.
10 LEWIS-BECK, NADEAU AND FOUCAULT
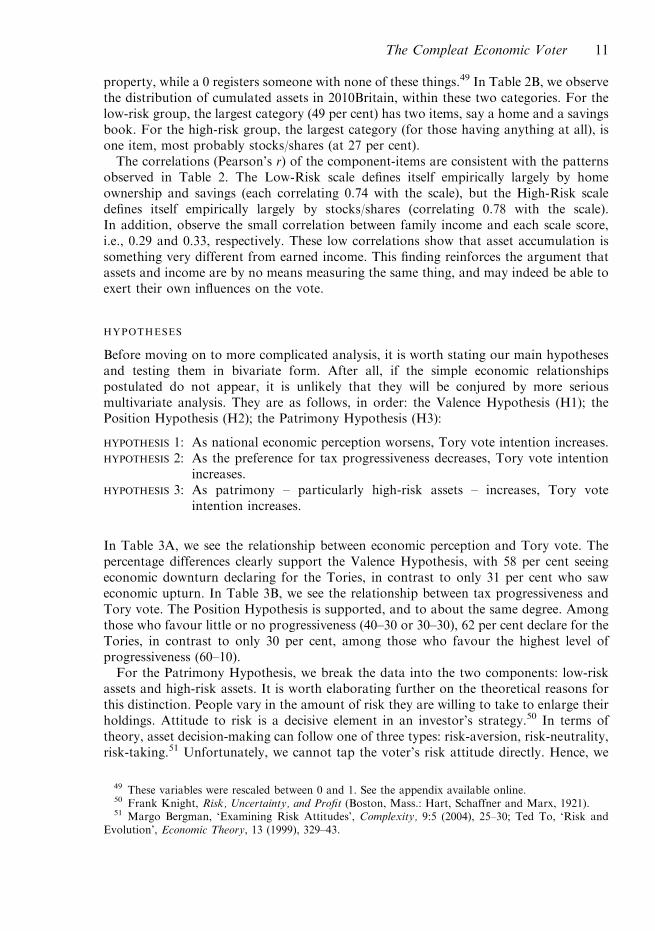
property, while a 0 registers someone with none of these things.49 In Table 2B, we observethe distribution of cumulated assets in 2010Britain, within these two categories. For thelow-risk group, the largest category (49 per cent) has two items, say a home and a savingsbook. For the high-risk group, the largest category (for those having anything at all), isone item, most probably stocks/shares (at 27 per cent).The correlations (Pearson’s r) of the component-items are consistent with the patterns
observed in Table 2. The Low-Risk scale defines itself empirically largely by homeownership and savings (each correlating 0.74 with the scale), but the High-Risk scaledefines itself empirically largely by stocks/shares (correlating 0.78 with the scale).In addition, observe the small correlation between family income and each scale score,i.e., 0.29 and 0.33, respectively. These low correlations show that asset accumulation issomething very different from earned income. This finding reinforces the argument thatassets and income are by no means measuring the same thing, and may indeed be able toexert their own influences on the vote.
HYPOTHESES
Before moving on to more complicated analysis, it is worth stating our main hypothesesand testing them in bivariate form. After all, if the simple economic relationshipspostulated do not appear, it is unlikely that they will be conjured by more seriousmultivariate analysis. They are as follows, in order: the Valence Hypothesis (H1); thePosition Hypothesis (H2); the Patrimony Hypothesis (H3):
HYPOTHESIS 1: As national economic perception worsens, Tory vote intention increases.HYPOTHESIS 2: As the preference for tax progressiveness decreases, Tory vote intention
increases.HYPOTHESIS 3: As patrimony – particularly high-risk assets – increases, Tory vote
intention increases.
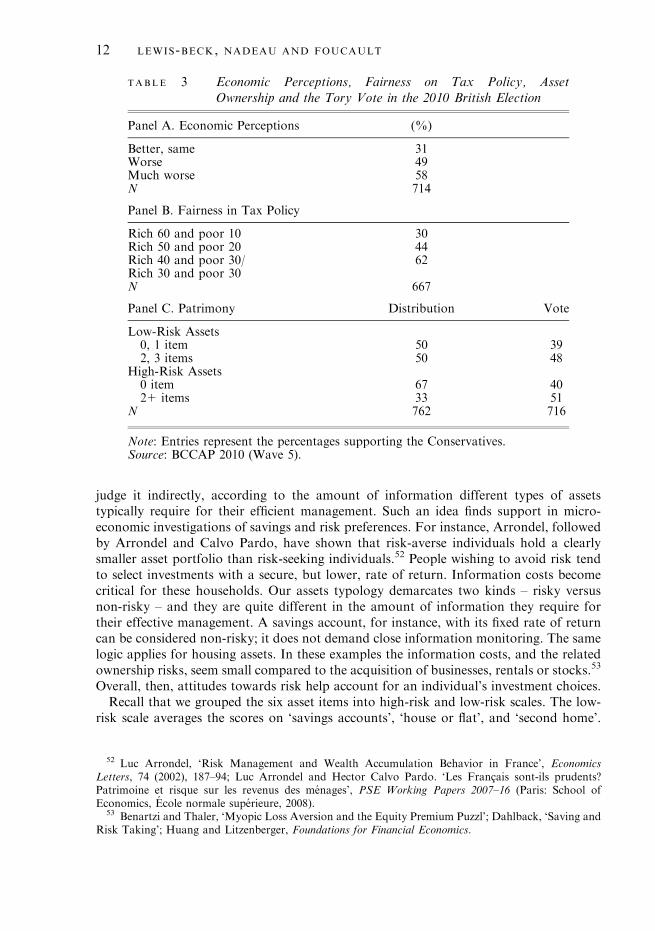
In Table 3A, we see the relationship between economic perception and Tory vote. Thepercentage differences clearly support the Valence Hypothesis, with 58 per cent seeingeconomic downturn declaring for the Tories, in contrast to only 31 per cent who saweconomic upturn. In Table 3B, we see the relationship between tax progressiveness andTory vote. The Position Hypothesis is supported, and to about the same degree. Amongthose who favour little or no progressiveness (40–30 or 30–30), 62 per cent declare for theTories, in contrast to only 30 per cent, among those who favour the highest level ofprogressiveness (60–10).For the Patrimony Hypothesis, we break the data into the two components: low-risk
assets and high-risk assets. It is worth elaborating further on the theoretical reasons forthis distinction. People vary in the amount of risk they are willing to take to enlarge theirholdings. Attitude to risk is a decisive element in an investor’s strategy.50 In terms oftheory, asset decision-making can follow one of three types: risk-aversion, risk-neutrality,risk-taking.51 Unfortunately, we cannot tap the voter’s risk attitude directly. Hence, we
49 These variables were rescaled between 0 and 1. See the appendix available online.50 Frank Knight, Risk, Uncertainty, and Profit (Boston, Mass.: Hart, Schaffner and Marx, 1921).51 Margo Bergman, ‘Examining Risk Attitudes’, Complexity, 9:5 (2004), 25–30; Ted To, ‘Risk and
Evolution’, Economic Theory, 13 (1999), 329–43.
The Compleat Economic Voter 11
judge it indirectly, according to the amount of information different types of assetstypically require for their efficient management. Such an idea finds support in micro-economic investigations of savings and risk preferences. For instance, Arrondel, followedby Arrondel and Calvo Pardo, have shown that risk-averse individuals hold a clearlysmaller asset portfolio than risk-seeking individuals.52 People wishing to avoid risk tendto select investments with a secure, but lower, rate of return. Information costs becomecritical for these households. Our assets typology demarcates two kinds – risky versusnon-risky – and they are quite different in the amount of information they require fortheir effective management. A savings account, for instance, with its fixed rate of returncan be considered non-risky; it does not demand close information monitoring. The samelogic applies for housing assets. In these examples the information costs, and the relatedownership risks, seem small compared to the acquisition of businesses, rentals or stocks.53
Overall, then, attitudes towards risk help account for an individual’s investment choices.Recall that we grouped the six asset items into high-risk and low-risk scales. The low-
risk scale averages the scores on ‘savings accounts’, ‘house or flat’, and ‘second home’.
TABLE 3 Economic Perceptions, Fairness on Tax Policy, AssetOwnership and the Tory Vote in the 2010 British Election
Panel A. Economic Perceptions (%)
Better, same 31Worse 49Much worse 58N 714
Panel B. Fairness in Tax Policy
Rich 60 and poor 10 30Rich 50 and poor 20 44Rich 40 and poor 30/ 62Rich 30 and poor 30N 667
Panel C. Patrimony Distribution Vote
Low-Risk Assets0, 1 item 50 392, 3 items 50 48
High-Risk Assets0 item 67 4021 items 33 51
N 762 716
Note: Entries represent the percentages supporting the Conservatives.Source: BCCAP 2010 (Wave 5).
52 Luc Arrondel, ‘Risk Management and Wealth Accumulation Behavior in France’, EconomicsLetters, 74 (2002), 187–94; Luc Arrondel and Hector Calvo Pardo. ‘Les Francais sont-ils prudents?Patrimoine et risque sur les revenus des menages’, PSE Working Papers 2007–16 (Paris: School ofEconomics, Ecole normale superieure, 2008).
53 Benartzi and Thaler, ‘Myopic Loss Aversion and the Equity Premium Puzzl’; Dahlback, ‘Saving andRisk Taking’; Huang and Litzenberger, Foundations for Financial Economics.
12 LEWIS-BECK, NADEAU AND FOUCAULT

The high-risk scale averages the scores on ‘business’, ‘rentals’ and ‘stocks’. It is the typesof investment a voter has – less risky and routine versus risky and complicated – that willshape policy preferences and, finally, party choice. Why would voters with more high-riskassets be more inclined to support parties on the right? Because governments on the rightclaim they will do better at lowering taxes, decreasing business regulation and freeingfinancial markets.54 Their rhetoric more often supports free-market approaches, asopposed to state-run solutions favoured by the left.55 Free-market mechanisms tend tobenefit risk-seekers, who are able to achieve higher profit margins. Still, once in themarket, there is the possibility of greater loss. Therefore, as reward, risk-seekers expect ahigher rate of return, while the risk-averse seek protection and security. Given theseproclivities, high-risk voters will favour free-market politics and parties, more so thanlow-risk voters. Fortunately, we have data to which we now turn, in order to test thesepropositions.56
First, observe in Table 3C that more assets, within either category, leads to a higherpercentage of Tory voting, so supporting H3. However, note further that the apparenteffect is somewhat stronger among the high-asset group. (Comparing percentagedifferences, the figures are 9 points and 11 points, respectively). This result, whichsuggests a difference in political impact between the high-risk and low-risk groups, wepursue below.
MODELS
Economics, as important as it may be for vote choice, does not stand as the soledeterminant, even in its multiple dimensions. We know that other forces, long-termand short-term, act on this political behaviour. The classic framework, derived fromThe American Voter, has served British election studies well, as least as a starting point foranalysis.57 Recalling their pivotal theoretical construct, the funnel of causality, certainexplanatory variables occur before others in time.58 Socio-demographic variables are themost remote and, in current nomenclature, most fully possess exogenous status. That is,they are more or less fixed, unchanging over time and, while they influence the vote, thevote does not influence them. Classic examples of these are gender and social class.
54 Alberto Alesina and Howard Rosenthal, Partisan Politics, Divided Government, and the Economy,(New York: Cambridge University Press, 1995); Carles Boix, ‘Partisan Governments, the InternationalEconomy and Macroeconomic Policies in OECD Countries, 1964–93’, World Politics, 53 (2000), 38–73.
55 Herbert McClosky and John Zaller, The American Ethos: Public Attitudes towards Capitalism andDemocracy (Cambridge: Cambridge University Press, 1984).
56 As discussed, earlier work has shown that home ownership was linked to Conservative support (thisfinding does not extend to the democracies of the United States, Australia and France, see fnn. 30–33).This may have changed as the memories of the 1980s sale of social housing by the Thatcher Governmentfaded. Furthermore, besides being a low-risk investment, home ownership is also increasingly perceived asa social right associated with modern citizenship. See Saunders, A Nation of Home Owners; Saunders,‘Citizenship in a Liberal Society’. Overall, the motivations and dispositions associated with homeownership suggest that its impact on vote choice will be less pronounced than that for high-risk assets.
57 Angus Campbell, Philp E. Converse, Warren E. Miller and Donald E. Stokes, The American Voter(New York: Wiley and Sons, 1960); Butler and Stokes, Political Change in Britain; Clarke, Sanders,Stewart and Whiteley, Political Choice in Britain; Clarke, Sanders, Stewart and Whiteley, PerformancePolitics and the British Voter.
58 On the funnel of causality, see Campbell, Converse, Miller and Stokes, The American Voter, chap. 2;for a graphical update of the funnel, see Lewis-Beck, Jacoby, Norpoth and Weisberg, The American VoterRevisited, chap. 2.
The Compleat Economic Voter 13
Our variable of patrimony stands as a new socio-demographic variable in a votingbehaviour model. Therefore, it is useful to challenge its status directly, testing whether itdemonstrates a statistically significant effect, after traditional socio-demographicvariables have been controlled. First, then, we propose the following revised socio-demographic model of vote choice:
Vote ¼ fðgender; age; education; region;patrimony; income and occupationÞ: ð1Þ
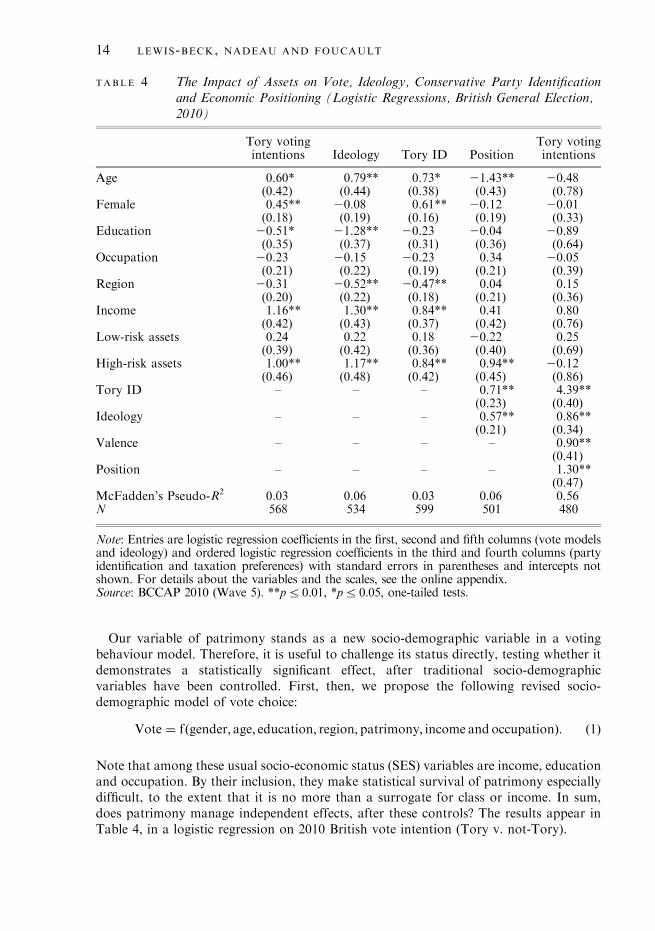
Note that among these usual socio-economic status (SES) variables are income, educationand occupation. By their inclusion, they make statistical survival of patrimony especiallydifficult, to the extent that it is no more than a surrogate for class or income. In sum,does patrimony manage independent effects, after these controls? The results appear inTable 4, in a logistic regression on 2010 British vote intention (Tory v. not-Tory).
TABLE 4 The Impact of Assets on Vote, Ideology, Conservative Party Identificationand Economic Positioning (Logistic Regressions, British General Election,2010)
Tory votingintentions Ideology Tory ID Position
Tory votingintentions
Age 0.60* 0.79** 0.73* 21.43** 20.48(0.42) (0.44) (0.38) (0.43) (0.78)
Female 0.45** 20.08 0.61** 20.12 20.01(0.18) (0.19) (0.16) (0.19) (0.33)
Education 20.51* 21.28** 20.23 20.04 20.89(0.35) (0.37) (0.31) (0.36) (0.64)
Occupation 20.23 20.15 20.23 0.34 20.05(0.21) (0.22) (0.19) (0.21) (0.39)
Region 20.31 20.52** 20.47** 0.04 0.15(0.20) (0.22) (0.18) (0.21) (0.36)
Income 1.16** 1.30** 0.84** 0.41 0.80(0.42) (0.43) (0.37) (0.42) (0.76)
Low-risk assets 0.24 0.22 0.18 20.22 0.25(0.39) (0.42) (0.36) (0.40) (0.69)
High-risk assets 1.00** 1.17** 0.84** 0.94** 20.12(0.46) (0.48) (0.42) (0.45) (0.86)
Tory ID – – – 0.71** 4.39**(0.23) (0.40)
Ideology – – – 0.57** 0.86**(0.21) (0.34)
Valence – – – – 0.90**(0.41)
Position – – – – 1.30**(0.47)
McFadden’s Pseudo-R2 0.03 0.06 0.03 0.06 0.56N 568 534 599 501 480
Note: Entries are logistic regression coefficients in the first, second and fifth columns (vote modelsand ideology) and ordered logistic regression coefficients in the third and fourth columns (partyidentification and taxation preferences) with standard errors in parentheses and intercepts notshown. For details about the variables and the scales, see the online appendix.Source: BCCAP 2010 (Wave 5). **pr0.01, *pr0.05, one-tailed tests.
14 LEWIS-BECK, NADEAU AND FOUCAULT

In Table 4 (column 1) high-risk assets, a patrimony measure, achieves statisticalsignificance, despite these controls. It is important to emphasize that patrimony here doesnot appear to be a mere proxy for social class. In this equation, there are a number ofvariables that have been used as indicators of social class – education, income andoccupation. Even with these class indicators taken into account, the patrimony variablemanages an independent effect. The implication is that patrimony does add something tothe explanation, something that usual measures of class do not.Further, observe that low-risk assets do not find significance. This suggests that it not
just assets per se, but how assets are perceived, that counts for politics. The holding oflow-risk assets, such as a home, does not invoke a political object, at least in thiselection.59 But the holding of high-risk assets, such as stock, does. The voter who hasstock appears to take into account which party will better serve that portfolio. In thatsense, there is a subjective, or endogenous, component to the patrimonial vote. Suchpotential endogeneity makes it important to control directly for relevant politicalattitudes, such as party identification and left–right ideology, which may themselves beendogenous to some extent.Does possession of high-risk assets relate to these relevant political attitudes? Yes. Such a
pattern continues with the estimation of the influence of patrimony on party identificationand ideology. High-risk assets appear to heighten Conservative party identification andright-wing ideological formation (see Table 4, columns 2 and 3, respectively). Finally, it alsoseems to motivate economic policy on taxation. As the estimates of Table 4 (column 4)indicate, those with more high-risk assets endorse a less progressive policy. In sum, thesevarious results on patrimonial effects in Table 4, showing direct and indirect manifestationsof political influence, suggest the strategic role patrimony, at least high-risk patrimony, canplace in the vote calculus.Having established the role of patrimony, we can turn to the vote impact of the other
economic variables – valence and position. Thus, we expand the model specification, asfollows:
Vote ¼ fðsocio� demographics;party; ideology; valence;positionÞ: ð2Þ
Note that the socio-demographic component now includes the traditional variables, pluspatrimony, i.e., the specification of Equation 1. In addition, the long-term variables ofparty identification and left–right ideology are added. The former serves as a criticalcontrol against partisan bias within the economic variables. The latter serves as apervasive control on the role of other issues, a ‘super-issue’ variable, as ideology issometimes called.60 These extensive controls make it difficult for economic valence andpolicy position to exhibit an independent effect. But they do, as Table 4 (column 5) shows.In a model that captures about three-fifths of the variance in vote intention, according
to this pseudo-R2, valence and position both have statistically significant effects. Theeffect of valence economics is perhaps not surprising. After all, the impact of sociotropic
59 Furthermore, it makes no difference whether the homes are mortgaged or not. First, bivariateanalyses show virtually no differences between respondents owning their home outright and those owningit with a mortgage: support for the Conservative parties in both groups is the same at 45 per cent (thecomparable figures for Labour are 19 and 17 per cent respectively). Secondly, this variable (mortgage5 1,0 otherwise) is never significant when included in our models.
60 On this point, see Lewis-Beck, Jacoby, Norpoth and Weisberg, The American Voter Revisited,pp. 223–9.
The Compleat Economic Voter 15
retrospective economic voting in British general elections has been established for sometime.61 What is surprising is the strength of position economics, even in the face ofcontrols on the other economic dimensions (of valence and patrimony). The positioncoefficient is highly statistically significant, at 0.001. Furthermore, it is substantivelysignificant. That is, position economics has slightly less than one-and-a-half times theimpact on vote intention that valence economics does.62
What about the direct effects of patrimony, in this more fully specified model? As canbe seen, they wash out, with neither low-risk nor high-risk assets coming close toconventional levels of statistical significance. Fortunately, the meaning of this result isclear, because of the foregoing estimates in Table 4 (columns 2–4), concerning the impactof patrimony on party identification, left–right ideology and economic position. In otherwords, while patrimony has no direct effect on the vote, it has indirect effects, passedthrough the more endogenous variables of party, ideology and position. To quantify thisindirect effect, in its multiple streams, it is necessary to specify a multi-equation modeland calculate the indirect effects with a path analysis.Thus, we postulate a block-recursive model, with four equations, one for vote, and one
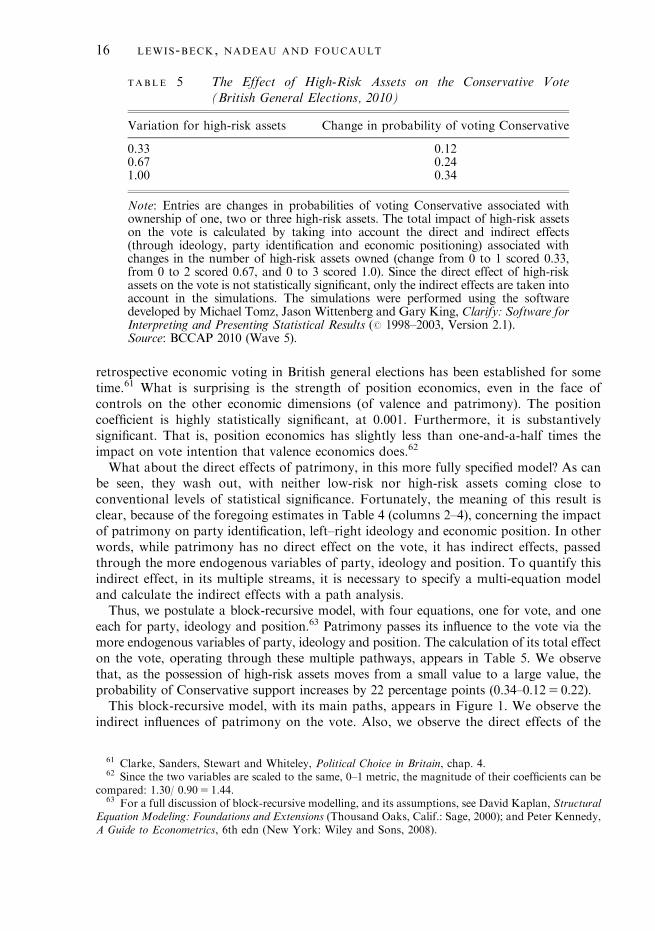
each for party, ideology and position.63 Patrimony passes its influence to the vote via themore endogenous variables of party, ideology and position. The calculation of its total effecton the vote, operating through these multiple pathways, appears in Table 5. We observethat, as the possession of high-risk assets moves from a small value to a large value, theprobability of Conservative support increases by 22 percentage points (0.34–0.125 0.22).This block-recursive model, with its main paths, appears in Figure 1. We observe the
indirect influences of patrimony on the vote. Also, we observe the direct effects of the
TABLE 5 The Effect of High-Risk Assets on the Conservative Vote(British General Elections, 2010)
Variation for high-risk assets Change in probability of voting Conservative
0.33 0.120.67 0.241.00 0.34
Note: Entries are changes in probabilities of voting Conservative associated withownership of one, two or three high-risk assets. The total impact of high-risk assetson the vote is calculated by taking into account the direct and indirect effects(through ideology, party identification and economic positioning) associated withchanges in the number of high-risk assets owned (change from 0 to 1 scored 0.33,from 0 to 2 scored 0.67, and 0 to 3 scored 1.0). Since the direct effect of high-riskassets on the vote is not statistically significant, only the indirect effects are taken intoaccount in the simulations. The simulations were performed using the softwaredeveloped by Michael Tomz, Jason Wittenberg and Gary King, Clarify: Software forInterpreting and Presenting Statistical Results (r 1998–2003, Version 2.1).Source: BCCAP 2010 (Wave 5).
61 Clarke, Sanders, Stewart and Whiteley, Political Choice in Britain, chap. 4.62 Since the two variables are scaled to the same, 0–1 metric, the magnitude of their coefficients can be
compared: 1.30/ 0.905 1.44.63 For a full discussion of block-recursive modelling, and its assumptions, see David Kaplan, Structural
Equation Modeling: Foundations and Extensions (Thousand Oaks, Calif.: Sage, 2000); and Peter Kennedy,A Guide to Econometrics, 6th edn (New York: Wiley and Sons, 2008).
16 LEWIS-BECK, NADEAU AND FOUCAULT
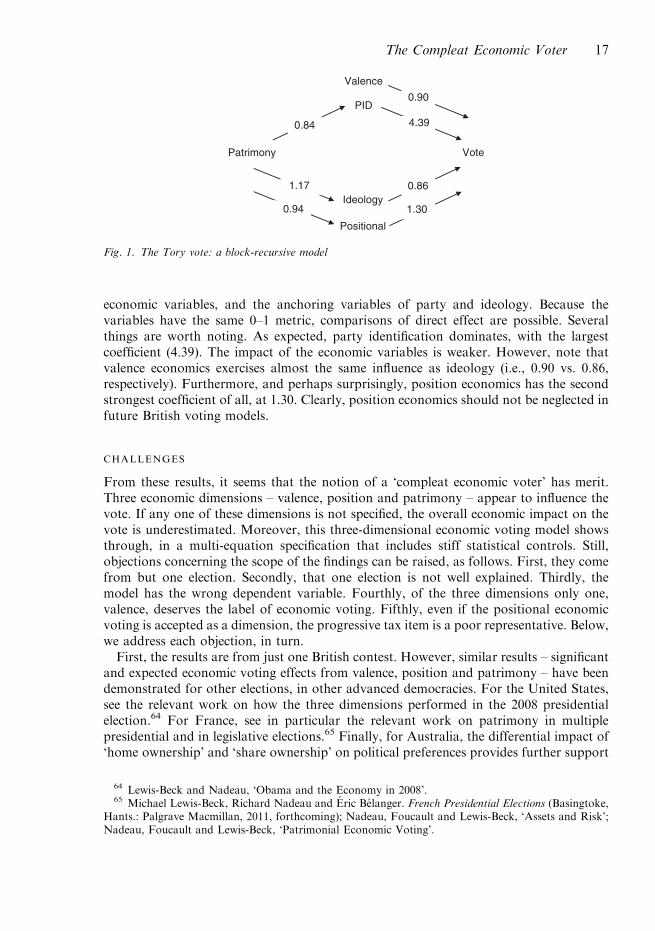
economic variables, and the anchoring variables of party and ideology. Because thevariables have the same 0–1 metric, comparisons of direct effect are possible. Severalthings are worth noting. As expected, party identification dominates, with the largestcoefficient (4.39). The impact of the economic variables is weaker. However, note thatvalence economics exercises almost the same influence as ideology (i.e., 0.90 vs. 0.86,respectively). Furthermore, and perhaps surprisingly, position economics has the secondstrongest coefficient of all, at 1.30. Clearly, position economics should not be neglected infuture British voting models.
CHALLENGES
From these results, it seems that the notion of a ‘compleat economic voter’ has merit.Three economic dimensions – valence, position and patrimony – appear to influence thevote. If any one of these dimensions is not specified, the overall economic impact on thevote is underestimated. Moreover, this three-dimensional economic voting model showsthrough, in a multi-equation specification that includes stiff statistical controls. Still,objections concerning the scope of the findings can be raised, as follows. First, they comefrom but one election. Secondly, that one election is not well explained. Thirdly, themodel has the wrong dependent variable. Fourthly, of the three dimensions only one,valence, deserves the label of economic voting. Fifthly, even if the positional economicvoting is accepted as a dimension, the progressive tax item is a poor representative. Below,we address each objection, in turn.First, the results are from just one British contest. However, similar results – significant
and expected economic voting effects from valence, position and patrimony – have beendemonstrated for other elections, in other advanced democracies. For the United States,see the relevant work on how the three dimensions performed in the 2008 presidentialelection.64 For France, see in particular the relevant work on patrimony in multiplepresidential and in legislative elections.65 Finally, for Australia, the differential impact of‘home ownership’ and ‘share ownership’ on political preferences provides further support
Valence
PID
Patrimony Vote
Ideology
Positional
0.84
1.17
4.39
0.90
0.86
1.300.94
Fig. 1. The Tory vote: a block-recursive model
64 Lewis-Beck and Nadeau, ‘Obama and the Economy in 2008’.65 Michael Lewis-Beck, Richard Nadeau and Eric Belanger. French Presidential Elections (Basingtoke,
Hants.: Palgrave Macmillan, 2011, forthcoming); Nadeau, Foucault and Lewis-Beck, ‘Assets and Risk’;Nadeau, Foucault and Lewis-Beck, ‘Patrimonial Economic Voting’.
The Compleat Economic Voter 17

for distinguishing between low-risk and high-risk assets for explaining vote choice.66
These particular British findings, then, are not unique.Secondly, our primary purpose is not to explain the 2010 British election, but to break new
ground in economic voting theory. However, in the course of confirming (or disconfirming)our main hypotheses, a broad model specification of the vote had to be elaborated. Thatmodel, in final form, explains 56 per cent of the variance in vote choice, according to theMcFadden R2, column 5, Table 4.67 That model fit actually exceeds the model fit generatedfor the fullest specification (‘the Composite Model’) offered by Clarke et al. in their generalexplanation of the 2010 vote, where the maximum McFadden pseudo-R2 equals 0.55.68
Furthermore, when the percentage of votes correctly predicted is examined for these twomodels, the results are 89.0 per cent and 88.8 per cent, respectively. In other words, ourmodel, although not primarily intended to, explains the 2010 choice extremely well.69
Thirdly, our model thus far has focused on the dichotomous choice, between the Toriesand other parties. While this reads well in terms of theory, e.g., more patrimony meansmore Tory voting, it is ‘wrong’ in the sense that valence economic voting assumespunishment is meted out against the incumbent, in this case Labour (not the Tories).The implication is that, with the right dependent variable – Labour v. other parties –results would be different. To discuss this topic in a crisp manner, we turn to amultinomial approach, with the Conservatives as the reference choice against the othertwo main party choices – Labour and the Liberal Democrats. Using this as our newdependent variable, we replicate our main analyses (see Table 6). The highlights areas follows. High-risk assets (HRA) are strongly tied to support for Labour and theLiberal Democrats (see Columns 1 and 2) in the simple SES voting model (the expectedsign is negative). In reproducing the analysis for the Ideology dependent variable, thecoefficient for HRA is even stronger than before. Furthermore, as expected, HRA isstrongly linked to Labour Party Identification (column 4). The replicated result forPositional economic voting as the dependent variable (column 6) is in the expecteddirection, with the coefficient slightly higher than before. As confirming as the foregoingresults are, our deeper concern is with the results for the complete voting model, displayedin columns 7 and 8. The direct impact of valence and positional economics on incumbentLabour party vote comes through clearly (with its negative sign since we use the sameinverse coding as before, from positive to negative), as do the indirect effects of patrimonythrough Ideology, Party Identification and Attitudes towards taxation (positional). Thus,with the ‘right’ dependent variable – a Labour incumbent – the essential economic votingresults remain intact.
66 Donoghue, Tranter and White, ‘Homeownership, Shareownership and Coalition Policy’; Troy,‘Suburbs of Acquiescence, Suburbs of Protest’.
67 Of the various available pseudo-R2, the McFadden appears preferred. With logistic regression, thereare many pseudo-R2, in contrast to the template R2 from ordinary least squares regression. Considerablework has been done comparing the qualities of the different pseudo-R2 from binomial logistic regressionequations. One view is that, of the dozen or so available, the McFadden is to be preferred, because itmimics most closely the conservative, statistically desirable, properties of the ordinary R2. Scott Menard,Applied Logistic Regression Analysis, Second Edition, No.106 (Thousand Oaks, Calif.: Sage, 2002), chap.2.
68 Clarke, Sanders, Stewart and Whiteley, ‘Valence Politics and Electoral Choice in Britain’, Table 2.69 Moreover, it does it parsimoniously, with only 12 independent variables, instead of 38 independent
variables as required in the model by Clarke, Sanders, Stewart and Whiteley, ‘Valence Politics andElectoral Choice in Britain’, Table 2.
18 LEWIS-BECK, NADEAU AND FOUCAULT

TABLE 6 The Impact of Assets on Vote, Ideology, Party Identification and Economic Positioning (Multinomial, Logistic andOrdered Logistic Regressions, British General Election, 2010)
Vote Party ID Vote
Labour Lib-Dem Ideology Labour Lib-Dem Position Labour Lib-Dem
Age 20.04 21.31** 0.82* 0.04 22.35** 21.31** 20.68 20.23(0.61) (0.50) (0.48) (0.60) (0.62) (0.47) (1.31) (0.93)
Female 20.45* 20.23 0.04 20.62** 20.46* 20.15 20.55 20.19(0.27) (0.22) (0.21) (0.26) (0.28) (0.20) (0.54) (0.39)
Education 0.58 0.76* 21.46** 0.37 0.27 20.02 1.64 1.89**(0.50) (0.43) (0.41) (0.48) (0.54) (0.40) (1.09) (0.79)
Social Class 0.23 0.38 20.18 0.26 0.58* 0.39 0.40 20.09(0.31) (0.26) (0.25) (0.29) (0.32) (0.24) (0.67) (0.48)
Region 0.50* 0.27 20.43* 0.95** 0.48 0.19 20.11 20.11(0.28) (0.25) (0.24) (0.28) (0.31) (0.23) (0.59) (0.43)
Income 20.97 21.20** 1.27** 21.24** 20.96 0.79* 20.80 21.44(0.61) (0.50) (0.47) (0.61) (0.60) (0.45) (1.27) (0.92)
Low-risk assets 20.44 0.09 0.06 20.42 0.06 0.10 20.13 0.39(0.57) (0.48) (0.46) (0.56) (0.60) (0.45) (1.14) (0.85)
High-risk assets 21.60** 21.02* 1.37** 21.84** 20.27 20.97* 21.22 21.11(0.75) (0.57) (0.53) (0.71) (0.65) (0.50) (1.52) (1.10)
Labour ID – – – – – 20.54* 8.19** 3.57**(0.31) (1.00) (0.69)
Liberal-Democrat ID – – – – – 20.27 3.94** 5.08**(0.30) (1.34) (0.68)
Ideology – – – – – 0.81** 20.52 21.23**(0.25) (0.66) (0.42)
Valence – – – – – – 22.00** 21.16**(0.73) (0.51)
Position – – – – – – 21.98** 21.93**(0.81) (0.59)
McFadden’s Pseudo-R2 0.03 0.06 0.06 0.07 0.59N 487 439 426 412 412
Note: Entries are multinomial regression coefficients, expect in column 2 showing logistic regression coefficients and column 6 showingordered logistic regression coefficients with standard errors in parentheses and intercepts not shown. For details about the variables and thescales, see the online appendix.Source: BCCAP 2010 (Wave 5). **pr 0.01, *pr 0.05, one-tailed tests.
TheComplea
tEconomic
Voter
19

Fourthly, the valence dimension has traditionally held pride of place in the economicvoting lexicon. It focuses on the performance of the macro-economy. But it has neverbeen the only dimension investigated under the guise of economic voting. As noted,Kiewiet, author of the first book on economic voting theory, explicitly argued some timeago for the need for inclusion of an economic policy dimension, to tap what hecalled policy-oriented economic voting.70 Kiewiet also heavily explored the role ofpocketbook economic voting, but dismissed it because of its consistently weak findings.71
Nevertheless, perhaps pocketbook (or egocentric) voting should be included here, as itdoes meet the criterion of a valence issue, i.e., there is a virtual consensus amongindividual voters that it is a ‘good thing’ for their personal financial well-being toimprove. Furthermore, and more importantly, it could be argued that the reportedinfluence from patrimony is a mere reflection of pocketbook voting. When a personalfinancial well-being measure was added to the specification, the risk assets effects we havereported could disappear as spurious. A direct test includes pocketbook retrospections inthe simple SES voting models (Table 4, column 1 and Table 6, columns 1 and 2), in orderto see what happens to the relationship between High-Risk asset (HRA) ownership andthe vote. The results are clear-cut. The impact of adding these egocentric perceptions onthe coefficient for the HRA variable is negligible; if anything, the effect of HRA appears abit stronger after this inclusion.72
Fifthly, there is the concern that, even accepting the role of positional economic voting,attitudes on progressive taxation are a poor representative. To answer that concern, weexamine the performance of other economic policy attitudes available in the dataset,namely unemployment policy and tax cuts. The first one is a ‘priority’ measure, with therespondent ranking ‘unemployment’ as their first, second, third or fourth priority.73 Thesecond item offers a ten-point scale on the question ‘Using the 0 to 10 scale below, wherethe 0 means that government should cut taxes a lot and spend much less on health andsocial services, and the end marked 10 means that the government should raise taxes a lotand spend much more on health and social services, where would you place YOURSELFon this scale?’ Both variables are included in the complete voting models (Table 4,column 5 and Table 6, columns 7 and 8). The results for the progressive tax item withoutthese unemployment and tax-cutting items are as follows: Tory vote5 1.30 (0.47)**;Labour vote5 21.98 (0.82)**; Libdem5 21.93 (0.59)**. The results for the progressivetax item with these unemployment and tax-cutting items are as follows: Tory vote5 1.21(0.48)**; Labour vote5 21.72 (0.82)**; Libdem5 21.81 (0.60)**. We observe severalthings. First, our progressive taxation item remains strong and significant in all cases.Moreover, the coefficients for that taxation item retain on average 91 per cent of theiroriginal magnitude. Secondly, the impact of including the two additional variables on theexplained variance is hardly discernible with the pseudo (McFadden) R2 remaining at0.56 and 0.59, respectively. Thirdly, the other possible positional variables have an
70 Kiewiet, Macroeconomics and Micropolitics.71 Kiewiet, Macroeconomics and Micropolitics.72 Using the equations of Table 4, column 1 and the Table 6, columns 1 and 2, compare the HRA
coefficient without and with the egocentric variables included , respectively: Tory vote5 1.00; Labourvote5 21.60; Libdem vote5 21.02 (all significant); Tory vote5 1.00; Labour vote5 21.70; LibdemVote5 21.06 (all significant).
73 Other possible priorities to select were inflation, trade or growth; a reverse coding is used to get apositive sign for the Tory model.
20 LEWIS-BECK, NADEAU AND FOUCAULT

unstable pattern; the ‘unemployment’ variable is only close to being significant for theTories (t5 1.62); the opposite is true for the ‘cutting taxe’ variable (being not significantat all for the Tories but significant for Labour and the Liberal Democrats). All in all, theseresults show that our progressive taxation item is powerful and preferred as a positionalmeasure, performing as well in the British context as it did in the US demonstration.74
SUMMARY AND CONCLUSIONS
Studies relating economics to the individual voter, plentiful as they are, have all been ofone type, focusing on economics as a valence issue. This perspective has great value.Clearly, the overwhelming evidence that voters punish or reward governments on thebasis of economic performance represents a major contribution in the explanation ofelectoral behaviour. But, we argue, voters also rely on other aspects of the economy inmaking their choices. They assess central aspects of economic policy, and the positionsthey take there also shape their vote. Furthermore, the particular configuration of theirwealth portfolio, which we label ‘patrimony’, makes a difference for their politicalpreferences.Taken together, the proposition is that the economic vote has multiple dimensions –
valence, position and patrimony. Fortunately, the proposition is open to empirical testingand, while much has been done on the first dimension, little has been done on the secondtwo. Here we explore a British election survey which, uniquely, allows us to examine allthe dimensions within the confines of one study. We observe that each of the threedimensions exerts an independent influence on vote intention, even after the imposition ofextensive statistical controls. Valence economics operates as expected. Those who saw theeconomy as worsening were more likely to punish the ruling Labour party, and to vote forthe Tory opposition. But positional economic preferences are also at work. Where votersplace themselves on the economic policy spectrum makes a difference for their vote.In particular, those less inclined to progressive taxation were clearly more likely tosupport the Tories. The economics of patrimony, through various routes, reaches thevoters. Furthermore, it wields its influence in different ways from social class, as usuallymeasured. Importantly, it is only the high-risk assets that matter. Holders of stocks orbusiness assets want good financial reward for their risks, and so incline to the Tories andtheir more pro-market policies.While this is only one study, it is the first of its kind in Britain. Besides, its results closely
replicate those on multi-dimensional economic voting found in the United States. And,particularly with respect to the patrimonial dimension, it also supports work done inFrance. Still, the exploration of multi-dimensional economic voting is in its infancy.A battery of the essential economic items – on valence, position and patrimony – needs tobe administered in surveys with a larger sample and more items, not to mention othercountries. Moreover, issues of causal flow, from and among the economic variables,need to be addressed, and this really demands a panel design. Clearly, the work is justbeginning. Nevertheless, the portrait of the ‘compleat economic voter’ is taking onsharper features.
74 Lewis-Beck and Nadeau. ‘Obama and the Economy in 2008’.
The Compleat Economic Voter 21