Embed Size (px)
Citation preview

Brisbane City Plan 2014Local Government Infrastructure PlanExtrinsic Material
Planning assumptions
June 2018
© Brisbane City Council 2018
This publication is copyright and contains information that is the property of the Brisbane City Council. While every care is taken to ensure the accuracy of this data, the Brisbane City Council and the copyright owners, in permitting the use of this data, make no representations or warranties about its accuracy, reliability, completeness or suitability for any particular purpose and disclaims all responsibility and all liability (including without limitation, liability in negligence) for all expenses, losses, damages (including indirect or consequential damage) and costs which you might incur as a result of the data being inaccurate or incomplete in any way and for any reason.

Table of Contents1 INTRODUCTION................................................................................................................................. 4
1.1 BACKGROUND................................................................................................................................. 4
1.2 PURPOSE....................................................................................................................................... 4
2 LEGISLATIVE REQUIREMENTS.......................................................................................................5
2.1 DEVELOPMENT IN THE PLANNING SCHEME AREA NOT SUBJECT TO THE PLANNING ACT 2016...............5
3 PLANNING ASSUMPTIONS OVERVIEW..........................................................................................6
3.1 INTRODUCTION................................................................................................................................ 6
3.2 PROJECTION AREA..........................................................................................................................6
3.3 TIME PERIODS................................................................................................................................. 6
3.4 LGIP DEVELOPMENT TYPES.............................................................................................................6
3.5 PLANNED DENSITY..........................................................................................................................7
3.5.1 Land use and yield provisions of the planning scheme..........................................................7
3.5.2 Recent development trends....................................................................................................7
3.5.3 Scale and land use mix of existing development....................................................................7
3.5.4 External expert consultant advice...........................................................................................8
3.5.5 City Plan 2014 assumed scale of development assumptions.................................................8
3.5.6 The information sources.........................................................................................................8
3.6 ULTIMATE DEVELOPMENT.................................................................................................................8
4 METHODOLOGY FOR THE EXISTING AND FUTURE RESIDENT POPULATION AND RESIDENTIAL DWELLING SUPPLY....................................................................................................9
4.1 INTRODUCTION................................................................................................................................ 9
4.2 OVERVIEW OF BRISBANE’S URBAN DWELLING SUPPLY MODEL............................................................9
4.3 FACTORS DETERMINING FUTURE RESIDENTIAL DEVELOPMENT FOR LGIP..........................................11
4.3.1 Residential development types and planning scheme uses.................................................11
4.3.2 Localities and the PIA for existing and future resident population........................................12
4.3.3 Brisbane’s dwelling demand and ultimate development.......................................................12
4.3.4 Land use and yield assumptions..........................................................................................13
4.3.5 City Plan planning provisions...............................................................................................13
4.3.6 Development potential of land..............................................................................................14
4.3.7 Brisbane City Council policy constraints...............................................................................19
4.3.8 Existing level of development as at June 2014 and a base year of 2016.............................22
4.3.9 Development and building approvals....................................................................................22
4.3.10 Allocation of predicted future private residential dwelling supply........................................22
4.3.11 Residential occupancy rates...............................................................................................23
5 METHODOLOGY FOR THE PREDICTED EXISTING AND FUTURE EMPLOYMENT AND ULTIMATE NON-RESIDENTIAL FLOOR SPACE...............................................................................24
LGIP Planning Assumptions Extrinsic Material Page 2
5.1 INTRODUCTION.............................................................................................................................. 24
5.2 EMPLOYMENT PROJECTIONS TO 2041............................................................................................24
5.2.1 LGIP non-residential development types and industrial classification..................................24
5.2.2 LGIP non-residential types and planning scheme uses........................................................25
5.2.3 BCC non-residential floor space projections.........................................................................25
5.2.4 Inclusion of draft neighbourhood plans that have occurred after the development of the employment projections................................................................................................................26
5.3 CALCULATING ‘ULTIMATE DEVELOPMENT’ FIGURES FOR EMPLOYMENT AND FLOOR SPACE..................27
5.3.1 Existing floor space by non-residential use types.................................................................27
5.3.2 Land use and yield assumptions..........................................................................................27
5.3.3 Developable area of land......................................................................................................28
5.3.4 Brisbane City Council policy constraints...............................................................................29
5.3.5 Ultimate employees..............................................................................................................31
6 PLANNED DEMAND........................................................................................................................ 32
6.1 PLANNED INFRASTRUCTURE DEMAND RATE.....................................................................................32
6.2 SERVICE CATCHMENTS AND PLANNED DEMAND...............................................................................32
6.2.1 Service catchment boundaries.............................................................................................32
6.2.2 Planned demand for service catchments..............................................................................33
7 PRIORITY INFRASTRUCTURE AREA............................................................................................34
8 APPENDICES................................................................................................................................... 35
8.1 APPENDIX A: CITY PLAN 2014 LAND USE AND YIELD ASSUMPTIONS.................................................35
8.2 APPENDIX B: NEIGHBOURHOOD PLANS AND OTHER AREAS REFLECTED IN THE LAND USE AND YIELD ASSUMPTIONS..................................................................................................................................... 38
8.2.1 Adopted neighbourhood plans..............................................................................................38
8.2.2 Draft neighbourhood plans (as at October 2015).................................................................39
8.2.3 Priority Development Areas..................................................................................................39
8.2.4 State Planning Regulatory Provision (SPRP).......................................................................39
8.3 APPENDIX C: RESIDENTIAL OCCUPANCY RATES..............................................................................40
8.4 APPENDIX D: LAND USE GROUPINGS FOR EXISTING LEVEL OF DEVELOPMENT (JUNE 2014)...............50
8.5 APPENDIX E: LAND USE AND YIELD ASSUMPTIONS FOR POTENTIAL NON-RESIDENTIAL DEVELOPMENT51
8.6 APPENDIX F: DEMAND CONVERSION RATES....................................................................................53
8.7 APPENDIX G: DEMAND GENERATION TABLES (ETS)........................................................................56
LGIP Planning Assumptions Extrinsic Material Page 3

1 Introduction
1.1 Background
Brisbane City Council (Council) has prepared City Plan 2014 in accordance with the Planning Act 2016. The planning scheme sets a framework for managing development in Brisbane over a 20 year horizon. In accordance with legislation Council is required to prepare a Local Government Infrastructure Plan (LGIP) to guide the planning of trunk infrastructure.
For the LGIP, Council was also required to demonstrate that it can fund the trunk infrastructure identified in the LGIP from infrastructure charges revenue and other revenue sources. Accordingly, the planning horizon of the LGIP is 10 years, reduced from the 20 year planning horizon of the Council’s PIP, in order to align the planning and funding of future trunk infrastructure.
The Council prepared the LGIP by undertaking a review of the Brisbane Priority Infrastructure Plan 2014, having regard to the following principles:
(1) reviewing the items identified in the Schedule of Works (SoW) in the PIP already delivered by Council;
(2) reviewing the timing for delivery of items identified in the SoW in the PIP;(3) aligning the timing for delivery of items identified in the SoW in the PIP to a 10 year planning
horizon.
To manage and plan future infrastructure to support Brisbane’s growth over the next 10 years, Council has assembled a number of growth related residential and non-residential databases in order to understand the extent, location and sequencing of this growth.
Underpinning the residential databases is an extensive series of assumptions related to planning policies. The future supply of private residential dwellings and the subsequent future residential population has been set to meet the overall dwelling and population demand of the State Government.
The non-residential databases are also based on an initial series of economic related assumptions, further adjusted by the State Government to reflect the intent of relevant planning policies and other local conditions. These databases further form the basis for LGIP, to predict Brisbane’s future scale of development and future infrastructure demand.
The extrinsic material includes amendments relating to the City Centre, Albion, Taringa, Spring Hill, Hemmant Lytton, and Lower Oxley Creek North Neighbourhood Plans. These neighbourhood plans are yet to be included in City Plan 2014 as they are the subject of a separate planning scheme amendment process. The information has been included in anticipation of a neighbourhood plan for the area progressing and is subject to change.
1.2 Purpose
The purpose of this report is to provide an overview of the methodologies and assumptions used in the preparation of the existing and future population, existing and future residential dwellings, existing and future employees and the existing and future non-residential floor space.
As this data forms the basis for determining infrastructure demand, the report also provides an overview of the methods undertaken in order to calculate the planned density and the existing and projected demand for each Council infrastructure network.
The report also provides information to support the Priority Infrastructure Area (PIA) used to prepare an LGIP.
LGIP Planning Assumptions Extrinsic Material Page 4

2 Legislative requirementsUnder the Planning Act 2016, the Council is required to prepare a LGIP.
The LGIP must contain certain information relating to the planning of trunk infrastructure including:
(1) the existing and future residential and non-residential development within the local government area;
(2) the planned demand;(3) the existing and projected demand for each relevant network;(4) the PIA that defines the physical area that can contain a minimum of 10 years of anticipated
urban growth.
2.1 Development in the planning scheme area not subject to the Planning Act 2016
For the purpose of the negotiation of an infrastructure agreement with the local government, planning assumptions for development which is not subject to or is exempt development under the Planning Act 2016 2009 such as the following:
(1) development under the South Bank Corporation Act 1989;(2) development of strategic port land under the Transport Infrastructure Act 1994;(3) development under the Economic Development Act 2012;(4) development under the Airports Act 1996;(5) development of a Commonwealth place.
LGIP Planning Assumptions Extrinsic Material Page 5

3 Planning assumptions overview
3.1 Introduction
Statutory guideline 03/14 Local government infrastructure plans requires that a local government’s LGIP state the assumptions about the type, location, scale and timing of population and employment growth and the resulting development within a local government area. The planning assumptions in LGIP therefore state the following:
(1) the existing and future population and residential dwelling supply in the local government area;
(2) the existing and future employees and non-residential floor space in the local government area;
(3) the assumptions about the type, location, scale and timing of residential and non-residential development which are used to derive the demand for a trunk infrastructure network giving a consistent basis for the planning of the trunk infrastructure network and the determination of the PIA.
3.2 Projection area
The existing and future resident population and residential dwelling supply and employee and non-residential floor space are represented by projection areas in the local government area.
For the purposes of the LGIP, the projection areas are identified according to the Australian Bureau of Statistics (ABS), Australian Standard Geographical Classification (ASGC) at Statistical Area 2 (SA2).
The ASGS is a common framework of statistical geography that was introduced in 2011 for the production of statistics to ensure comparability and spatial integration. Within Brisbane, there are 135 SA2s that represent a scale similar to suburbs. The use of SA2s also represents a change from the current PIP which has been reported using Statistical Local Areas (SLAs) of which there are 158 within Brisbane local government area.
3.3 Time periods
The existing and future resident population, residential dwelling supply, employees and non-residential floor space figures in the local government area have been prepared for the following time periods to align with the ABS census years:
(1) 2016-2021;(2) 2021-2026; and(3) 2026-2031.
An ultimate development figure has also been provided for both residential and non-residential figures.
3.4 LGIP development types
For the purposes of reporting the existing and future resident population, residential dwelling supply, employees and non-residential floor space, development types prescribed by the Queensland Government have been used1. These development types reflect an aggregation of specific types of residential dwelling or industry sector of employment. Both the specific types and the development categories have also been cross-referenced to the planning scheme uses.
1 Section 2.5.2.a of Statutory Guideline 03/14, Queensland Government.
LGIP Planning Assumptions Extrinsic Material Page 6

Further information relating to the development types is set out in section 4.3.1 (Residential development types and planning scheme uses) and section 5.2.2 (Non-residential development types and planning scheme uses) of this document.
3.5 Planned density
The planned density for the purposes of the LGIP has been determined to reflect the realistic level (scale and intensity) of development. It is calculated with reference to the land use and yield provisions of the planning scheme, site constraints, development trends and the scale and land use mix of existing development.
Further information about the assumptions used to derive a planned density is stated below.
3.5.1 Land use and yield provisions of the planning scheme
Land use and yield provisions of the planning scheme set out the intent for the future scale, type and location of development. These provisions were drawn from:
(1) the City Plan 2014 (as at 30 June 2014) zone and precinct codes; development codes; and the level of assessment tables (for permissible uses);
(2) neighbourhood plans adopted as at 30 October 2015 and incorporated into the planning scheme; and
(3) specific neighbourhood plans in draft status as at October 2015 (subsequently adopted in 2016-2017).
The land use and yield information derived from these sources were compiled, analysed and tested to provide the set of assumptions that formed the basis for the planned density assumptions (where relevant).
The specific process for this involves obtaining specified building metrics, densities and land use mix from the planning scheme and neighbourhood plans. Where specific information is not stated, Council officers make estimates having regard to the intent of the provisions in context of other information sources related to development density and land use mix as set out below. For land in the emerging communities zone, the planned density and subsequent modelling has taken into account the provision of land for roads, parks and other infrastructure.
3.5.2 Recent development trends
Analysis of recent development trends was carried out to check and inform the planned density assumptions derived from the planning scheme. Recent development trends provide an indication of the scale, type and location of developments being achieved on the ground and were used to test whether the assumptions derived from the planning scheme are realistic.
Information sources that were used include:
(1) development approvals (MCU and RoL) (January 2010 to December 2015);(2) residential development approvals (MCU and RoL) for Economic Development Queensland’s
(EDQ) priority development areas (PDAs) (January 2010 to December 2012);(3) Virtual Brisbane 3D modelling of development approvals to calculate and inform non-GFA
methodology;(4) knowledge and experience of planning professionals particularly in understanding
development trends across the city.
3.5.3 Scale and land use mix of existing development
An analysis of the scale and land use mix of existing development was also used to inform the planned density assumptions.
LGIP Planning Assumptions Extrinsic Material Page 7

This analysis was carried out using Brisbane City Council’s Land Use Activity Dataset (LUAD) as at June 2011 which contains gross floor area by land use type and can be further analysed by zone. This analysis has since been further refined by using Brisbane City Council’s Land Use Activity Dataset (LUAD) as at June 2014.
This information was used to examine the scale and type of development for various land use types and activities within each zone. For each zone where LUAD could be used with confidence, histograms and averages were developed to analyse the range and scale of development, which in turn was used to further inform and calibrate the planned density assumptions.
3.5.4 External expert consultant advice
In late 2012, an external consultant was commissioned to provide a set of density and land use mix assumptions for the planned density calculations. This advice was used to further revise the planned density calculations.
3.5.5 City Plan 2014 assumed scale of development assumptions
The current assumed scale of development assumptions from the City Plan 2014 PIP were also used to check, inform and calibrate the final assumptions for the planned density table.
3.5.6 The information sources
The following table indicates how each of the above information sources was considered in developing assumptions for the various types of development specified below.
Table 3.5.6.1—Key information sources by type of development to derive the assumed scale of development table
Information Source Type of development
Residential Centres and mixed use
Non-Residential
Other
Land use and yield provisions of the planning scheme (including neighbourhood plans)
Yes Yes In part In part
Recent development trends Yes Yes Yes Yes
Scale and land use mix of existing development
Yes Yes Yes In part
External expert consultant advice Yes Yes Yes Yes
City Plan 2014 (PIP) assumed scale of development assumptions
Yes Yes Yes Yes
3.6 Ultimate development
Ultimate development represents the total realistic development potential of the City Plan. This takes into consideration the development potential of all zones and neighbourhood plan precincts by applying planned densities for various land uses to the developable area of land. Ultimate development provides the population and employment capacity for land at various localities across the city.
In addition, there are rules within the models that calculate ultimate development that take account of other factors that would affect probability and feasibility of properties developing or redeveloping, this ensures that the Ultimate development is realistic and achievable.
LGIP Planning Assumptions Extrinsic Material Page 8
4 Methodology for the existing and future resident population and residential dwelling supply
4.1 Introduction
A requirement of the LGIP is the provision of existing and future residential dwelling supply and the subsequent resident population resulting from the potential residential dwelling supply.
Council has invested in an urban supply model for the purpose of understanding future potential residential dwelling supply by location and timeframe. This model is used for a number of planning purposes throughout the organisation.
Section 4.2 provides a general overview of the Council’s urban supply model known as BUG Residential. Sections 4.3 to 4.3.11 outline the key data inputs and assumptions that have been used in the model in order to create the residential component of the planning assumptions for the LGIP.
4.2 Overview of Brisbane’s urban dwelling supply model
BUG Residential is the Council’s residential dwelling supply model with population demand set by the Queensland Government. The primary purpose of the model is to determine at a site level, what, when and where future potential residential dwelling supply could develop at 2014 and in five year intervals from 2016 to 2036. In order to achieve the State Government’s dwelling demand, the model assesses the development potential of all sites within the Brisbane local government area based on various principles and planning policy inputs and assumptions. The State Government projections state that the additional dwelling demand by 2036 for the Brisbane local government area will be 150,040 dwellings (2011 to 2036). As the BUG Residential model allocates potential dwelling supply from 2014, the overall additional dwelling demand to therefore be achieved in the Brisbane local government area by 2036 is 133,697 private residential dwellings. Of note, for the purposes of the LGIP, the State Government dwelling projections are used to set the demand for infrastructure planning purposes, rather than the South East Queensland Regional Plan 2009 (SEQRP) target for Brisbane of 156,000 additional dwellings from 2006 to 2031. The reason for this is that infrastructure planning should be based on the actual known demand of dwellings that will be required to meet the State Government’s population projections. Of further note is that for the purposes of the LGIP, the results reported were from 2016 and not the base year in the model of 2014.
Predicted resident population estimates are then calculated, outside of the model environment, based on specific detached and attached dwelling occupancy rates.
Figure 3.5.6.1 provides an overview of the five major components of the model that combine to determine potential dwelling supply by location and timeframes.
LGIP Planning Assumptions Extrinsic Material Page 9

5. ALLOCATION OF SUPPLYModel allocates development timeframe (2016, 2021, 2026, 2031, 2036) based on set parameters and targetsOption generation process is undertaken by taking into consideration all factors above in order to allocate the type of residential dwelling supply and the estimated timeframe
4. PRICING MODELRuns through a pricing model to calculate the likelihood of a site developingIncludes land area, number of dwellings, accessibility to use
3. PLANNING ASSUMPTIONSApplies land use and yield assumptions to calculate potential development yieldFor example adopted neighbourhood plans, priority development areas and other statutory planning assumptionsPolicy constraints i.e. caravan parks, residential welfare, heritage sites, community education, community health
1. BASE DATA LAYERIdentifies existing land use/activity and number of dwellings for each site within Brisbane local government areaLand use and number of dwelling as of June 2014
2. DATA AND CONSTRAINTS LAYERSApplies constraints to each site to calculate developable areaDevelopment area constraints i.e. waterways, wetlands, koala habitat areas, park landsDevelopment and building approvals
Figure 3.5.6.1—Key components of Brisbane’s urban dwelling supply model
First the model needs to understand the existing land use / activity of all sites in the Brisbane local government area. The model assigns different growth parameters depending on the existing land use (for example a detached residential dwelling, vacant land etc.). Once the existing land use / activity for each site are identified, the model calculates the developable area by excluding constrained land. The model identifies if the site is fully or partially constrained and calculates what is left over for potential development. A constraint can be physical, such as waterways and/or slopes, and / or can be related to specific planning scheme zones that do not allow for any form of intensive residential or non-residential development, such as environmental protection areas.
Once developable area has been determined the model calculates the potential development yield for each site. The potential development yield is sourced from both existing statutory planning policy and other planning constraints (known as policy constraints for example, parameters for development on a heritage listed site). The model collates the appropriate land use and yield assumptions for each individual site in Brisbane. The primary land use (extent of residential development) and yield assumptions (allowable densities), were sourced from the following:
LGIP Planning Assumptions Extrinsic Material Page 10

(1) the City Plan 2014 zone codes and development codes (as at 30 June 2014);(2) neighbourhood plans adopted as at 30 October 2015 that are incorporated in the planning
scheme;(3) select neighbourhood plans in draft status as at October 2015 (subsequently adopted in
2016-2017); and(4) development schemes for priority development areas.
Once the potential yield is identified, BUG Residential evaluates all potential residential land uses using its pricing model to calculate the likelihood of a site developing. The pricing model uses information such as the existing land use / activity occurring on a site and the number of existing residential dwellings on a site. Two major inputs to the pricing model are how well a site is accessible to users (accessibility index) and where it sits on the propensity curve.
After the model completes the steps above it allocates the likelihood of development occurring in five year time periods.
4.3 Factors determining future residential development for LGIP
The future residential dwelling supply to accommodate the State government’s projected resident population in the local government area has been determined taking into account the following factors:
(1) Queensland Government dwelling projections (demand);(2) Land use planning provisions (land use and yield assumptions) of;
(a) the planning scheme;(b) other relevant planning provisions;(c) land use planning provisions (land use and yield assumptions) of other statutory
instruments, including development schemes for priority development areas;(3) Development potential of land (developable area and constraints);(4) Brisbane City Council policy constraints;(5) Existing level of development as at June 2014;(6) Development and building approvals;(7) Allocation of predicted future private residential dwelling supply; and(8) Residential occupancy rates.
The following sections describe these factors in detail, including the data sources and assumptions for each.
4.3.1 Residential development types and planning scheme uses
The residential development types in the LGIP are identified as either a private residential dwelling or a non-private residential dwelling.
A private residential dwelling is defined as a dwelling house or a multiple dwelling, which is intended to be occupied by residents on a permanent basis.
Those dwellings categorised in the non-private residential dwelling development type typically represent communal dwellings. For the purposes of the LGIP, non-private residential dwellings are stated in the existing and projected residential dwellings and existing and projected population tables.
LGIP Planning Assumptions Extrinsic Material Page 11

Table 4.3.1.2—Residential development types and planning scheme uses
Residential development type Planning scheme uses
Private residential development
Dwelling house Dwelling house
Multiple dwelling Dual occupancy, Dwelling unit, Multiple dwelling, Retirement facility
Other non-private residential development
Non-private dwelling Caretaker's accommodation, Non-resident workforce accommodation, Relocatable home park, Residential care facility, Rural workers’ accommodation
4.3.2 Localities and the PIA for existing and future resident population
A requirement of the LGIP is to provide the existing and future resident population and residential dwelling supply for each projection area (defined as an SA2), as well as total growth figures for within the PIA and separate total growth figures for outside the PIA. It should be noted that there are several SA2s in Brisbane that are partially located both inside and outside of the PIA.
As the BUG residential model produces results at a site level, the residential data for both dwellings and population were able to be aggregated into its’ corresponding SA2.
4.3.3 Brisbane’s dwelling demand and ultimate development
The BUG Residential dwelling target to 2036 (controlled total) and mini targets (at each five year time period from 2016) are listed in Table 4.3.3.3. The ‘target’ and ‘period targets’ act as growth caps and restrict the model from over allocating growth in each five year intervals.
The dwelling target and period targets (i.e. 2016, 2021, 2026, 2031, 2036) are based on the 2015 Edition State Government dwelling projections (medium series). Some modifications had to be made to the QTT dwelling projections for use in the residential supply model as the growth for 2011 to 2016 period is far in excess of the existing level of development and building completion rates for this period; excess growth for this time period was redistributed to remaining projection years to ensure that the total growth to 2036 remains the same.
In order to ascertain dwelling growth already achieved, given that the dwelling projections calculate growth from 2011, Council undertook an analysis of the number of private residential dwellings as at June 2014. This figure was recorded as 440,118 private residential dwellings. The growth therefore required from 2014 to 2036 is 133,697 private residential dwellings. For the purposes of reporting in the LGIP only those figures from 2016 through to 2031 were reported.
Table 4.3.3.3—Dwelling target at 2031 and mini targets
Year Dwellings (private) period targets and target
Dwelling growth required at each five year interval
2016 454,118 14,000
2021 487,023 32,095
2026 513,958 26,935
2031 545,272 31,314
2036 573,815 28,543
LGIP Planning Assumptions Extrinsic Material Page 12

Although the BUG Residential model constrains potential residential dwelling supply at 2036 to reflect the Queensland Government projections i.e. future dwelling demand, the model is able to also identify sites that have potential residential development opportunities beyond 2036 which is defined as the ultimate development. Apart from the use of the mini targets and overall 2036 controlled total, the methodology to calculate ultimate development is exactly the same and is calculated in the same model run.
4.3.4 Land use and yield assumptions
For the purposes of the BUG Residential model, land use and yield assumptions are sourced from planning instruments, primarily from the City Plan 2014 including all neighbourhood plans incorporated in the planning scheme and select neighbourhood plans that are anticipated to be gazetted at the time of the LGIP’s gazettal. Other statutory planning instruments and their provisions such as development schemes for priority development areas also provide the future intent of an area including the intended uses and the allowable densities.
A land use assumption simply means the proportion and type of uses that can occur in a zone, precinct or other specific planning area. For example, information is collated on the percentage and type of residential uses that are able to occur and also taking into consideration the proportions of non-residential uses where relevant.
A yield assumption simply refers to the density of residential development that can occur. In the first instance, building metrics such as the type of building (i.e. duplex, townhouse, apartment), site cover, storeys, car parking configuration and site size is calculated for each allowable dwelling type and building configuration on specified site sizes to determine a range of plot ratios for each zone, precinct or other specific planning area. The plot ratio information is then converted into dwellings per hectare. Dwellings per hectare, or simply density, are the measurement of how many dwellings have the potential to be built over one hectare of unconstrained land.
A zone, precinct or specific planning area can have an assumption for an attached dwelling, detached dwelling or both an attached and detached dwelling. For example a Low-medium density residential zone – 2 storey mix precinct (with a site area of 600m2) can have a density of 20 dwellings per hectare for detached dwellings and 44 for attached dwellings. When a precinct has both attached and detached assumptions, a probability (percentage) of how much of that zone will be detached is determined to avoid too much growth of one dwelling type. For example a Low-medium density residential zone – 2 storey precinct for all site sizes is expected to develop as a mix of 40% detached dwellings and 60% attached dwellings. By using this example, the model will therefore apply 8 dwellings per hectare for detached and 26.4 dwellings per hectare for attached to all applicable sites in this zone and precinct.
4.3.5 City Plan planning provisions
The BUG Residential model requires all sites located in Brisbane to be allocated a zone and where applicable a precinct. Where a site has been identified as being located in a residential zone or a zone that allows for a mix of residential and non-residential development, a density assumption for attached dwellings and/or detached dwellings is applied.
Appendix A is a summary table for each relevant City Plan 2014 zone and precinct which identifies the density assumptions used in the BUG Residential model for both attached and detached dwellings. This table provides information such as minimum lot sizes for attached and detached dwellings, the plot ratio for each site size for attached dwellings, attached dwellings per hectare and detached dwellings per hectare, the probability of detached and the probability of attached to non-residential uses.
The method undertaken to derive these assumptions are summarised below:
LGIP Planning Assumptions Extrinsic Material Page 13

(1) Extensive review of the zone and precinct codes and applicable development codes in order to understand the density parameters such as site cover, storeys, car parking configurations, non-GFA and GFA of buildings that could occur in the zone and precinct in order to ascertain ranges of plot ratios that could occur in specific precincts and on site sizes.
(2) Extensive review of the zone and precinct codes in order to understand the range and type of dwellings that could occur in the zone and precinct, particularly in the 2 and 3 storey precincts.
(3) Expert urban planners / architects advice in building design.(4) Analysis of residential development approvals over a two year period and modelling in
Council’s Virtual Brisbane Model to ascertain non-GFA proportions to GFA, dwelling sizes, number of dwellings and all other site details related to individual development approvals.
(5) Extensive review of the existing dwelling stock in Brisbane to ascertain existing plot ratios, and development trends related to building types including number of dwellings, size of developments etc.
Although all sites in Brisbane are allocated to a zone and where applicable a precinct, for those sites located in a neighbourhood plan area, the specific provisions of the neighbourhood plan, particularly in relation to land use and yield assumptions, will in most cases override the zone assumptions. Appendix B provides a list of all neighbourhood plans reflected in the land use and yield assumptions.
The same rule applies to all sites located in a priority development area. Although these sites are also allocated a zone and precinct, the land use and yield assumptions outlined in the relevant planning instrument will over-ride the planning scheme assumptions if provisions are provided.
4.3.6 Development potential of land
The development potential of land represents the net developable area of land when the area of specific City Plan 2014 overlay and overlay sub-categories and specific City Plan 2014 zones and precincts have been subtracted from the total land area.
City Plan 2014 overlay constraints typically comprise those constraints where a majority of development would be deemed as inappropriate and therefore would not be approved (Table 4.3.6.4). The City Plan 2014 overlays that were not used in the calculation of net developable area are shown in Table 4.3.6.5.
The specific City Plan 2014 zones and precincts used in the net developable area calculation primarily relate to environmental zones and precincts (Table 4.3.6.6).
Table 4.3.6.4—Physical and environmental constraints used to determine net developable area for potential residential development
Physical and environment constraints Sub-category
Biodiversity Areas High ecological significance
Priority koala habitat area
Extractive resources KRA resource/processing area
KRA separation area
KRA transport route separation area
KRA transport route
Flood Brisbane River flood planning area 1
Creek/waterway flood planning area 1
LGIP Planning Assumptions Extrinsic Material Page 14

Physical and environment constraints Sub-category
Industrial amenity Industrial hazard investigation area
Industrial amenity investigation area (in part)
Regional infrastructure corridors and substations
Gas pipeline 20m
Oil pipeline 15m
Major electricity infrastructure high voltage powerline easement
Road hierarchy Future arterial road (20m buffer)
Waterway corridors Brisbane River corridor
Citywide waterway corridor
Wetlands Wetland
Slope (City Plan Policy) Slope greater than 25%
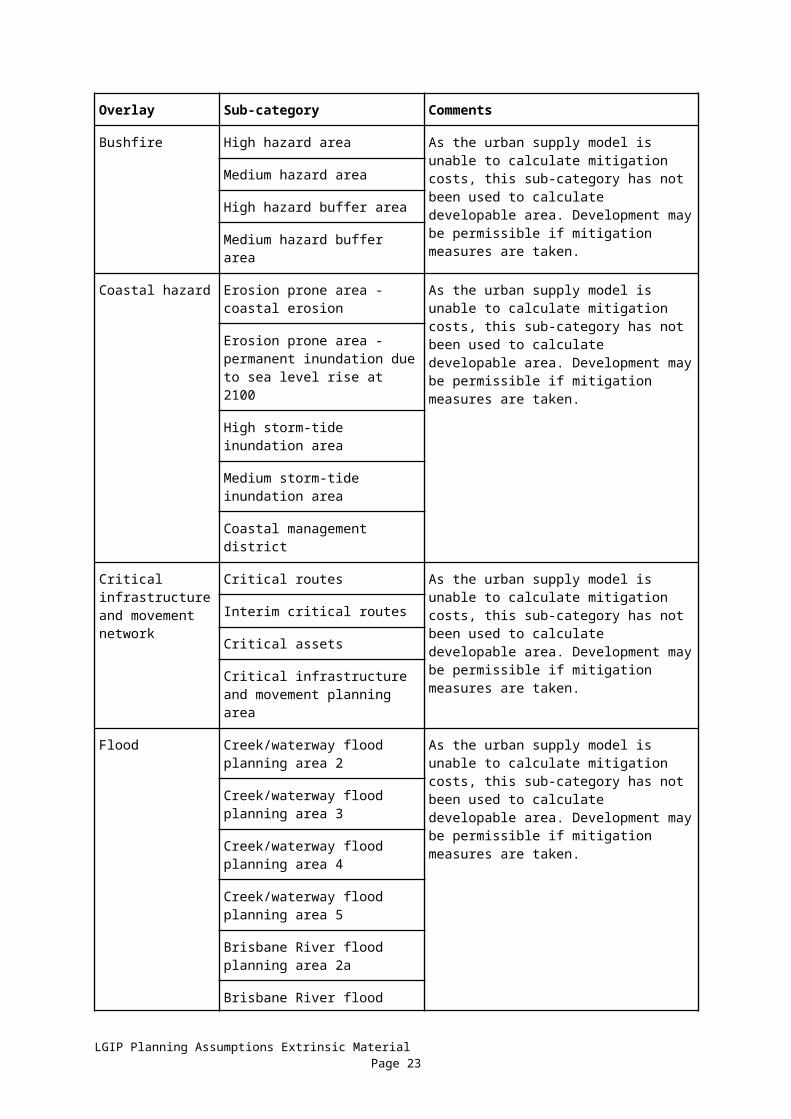
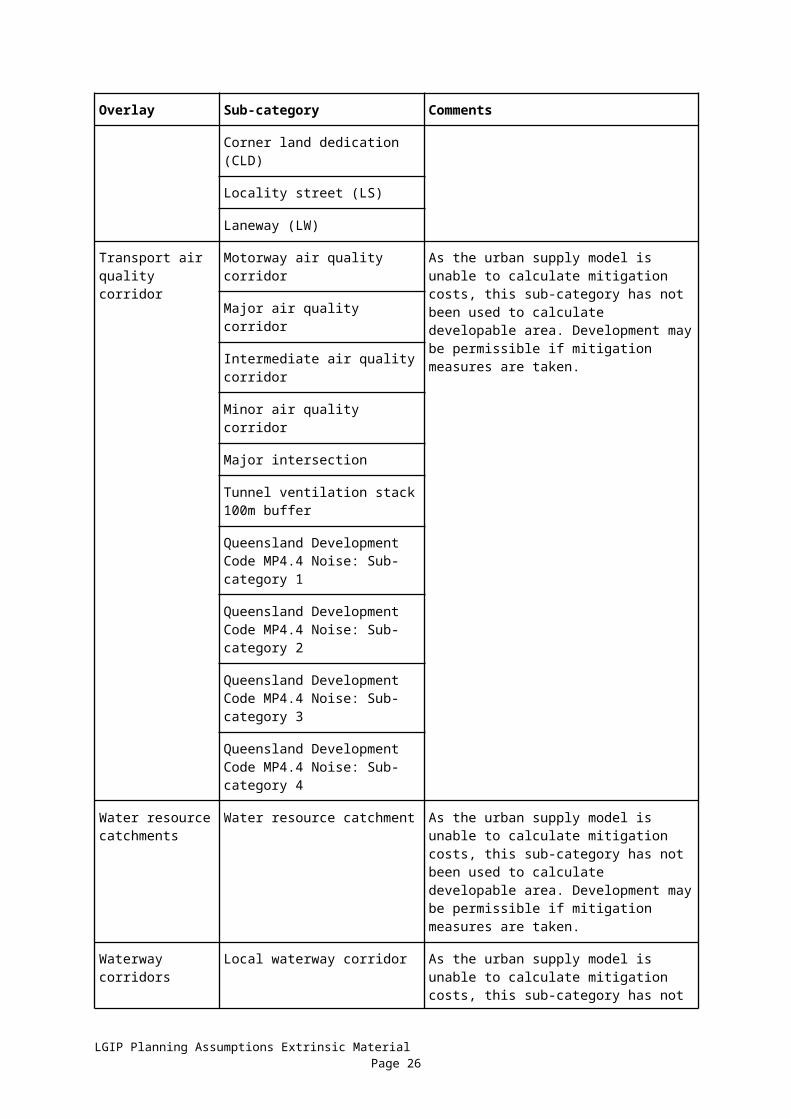
Table 4.3.6.5—City Plan 2014 overlay and sub-category not included in net developable area calculation
Overlay Sub-category Comments
Active frontages in residential zones
Active frontages As the urban supply model is unable to calculate mitigation costs, this sub-category has not been used to calculate developable area. Development may be permissible if mitigation measures are taken.
Airport Environs Obstacle Limitation Surface (OLS)
As the urban supply model is unable to calculate mitigation costs, this sub-category has not been used to calculate developable area. Development may be permissible if mitigation measures are taken.
Procedures for Air Navigation Services (PANS) surface
Air Navigation Features
Australian Noise Exposure Forecast Contour (ANEF)
Bicycle Network Primary Cycle Route As the urban supply model is unable to calculate mitigation costs, this sub-category has not been used to calculate developable area. Development may be permissible if mitigation measures are taken.
Secondary Cycle Route
Local Cycle Route
Riverwalk - Floating walkway
Biodiversity Areas Biodiversity interface area As the urban supply model is unable to calculate mitigation costs, this sub-category has not been used to calculate developable area. Development may be permissible if mitigation measures are taken.
General ecological significance
Koala habitat area
LGIP Planning Assumptions Extrinsic Material Page 15

Overlay Sub-category Comments
Bushfire High hazard area As the urban supply model is unable to calculate mitigation costs, this sub-category has not been used to calculate developable area. Development may be permissible if mitigation measures are taken.
Medium hazard area
High hazard buffer area
Medium hazard buffer area
Coastal hazard Erosion prone area - coastal erosion
As the urban supply model is unable to calculate mitigation costs, this sub-category has not been used to calculate developable area. Development may be permissible if mitigation measures are taken.
Erosion prone area - permanent inundation due to sea level rise at 2100
High storm-tide inundation area
Medium storm-tide inundation area
Coastal management district
Critical infrastructure and movement network
Critical routes As the urban supply model is unable to calculate mitigation costs, this sub-category has not been used to calculate developable area. Development may be permissible if mitigation measures are taken.
Interim critical routes
Critical assets
Critical infrastructure and movement planning area
Flood Creek/waterway flood planning area 2
As the urban supply model is unable to calculate mitigation costs, this sub-category has not been used to calculate developable area. Development may be permissible if mitigation measures are taken.
Creek/waterway flood planning area 3
Creek/waterway flood planning area 4
Creek/waterway flood planning area 5
Brisbane River flood planning area 2a
Brisbane River flood planning area 2b
Brisbane River flood planning area 3
Brisbane River flood planning area 4
Brisbane River flood planning area 5
Overland flow flood planning
LGIP Planning Assumptions Extrinsic Material Page 16

Overlay Sub-category Comments
area
Heritage Area adjoining local heritage As the urban supply model is unable to calculate mitigation costs, this sub-category has not been used to calculate developable area. Development may be permissible if mitigation measures are taken.
Area adjoining state heritage
Landslide Landslide susceptibility area As the urban supply model is unable to calculate mitigation costs, this sub-category has not been used to calculate developable area. Development may be permissible if mitigation measures are taken.
Neighbourhood character
Local character significance As the urban supply model is unable to calculate mitigation costs, this sub-category has not been used to calculate developable area. Development may be permissible if mitigation measures are taken.
Potential and actual acid sulphate soils
Potential and actual acid sulphate soils
As the urban supply model is unable to calculate mitigation costs, this sub-category has not been used to calculate developable area. Development may be permissible if mitigation measures are taken.
Land at or below 5m AHD sub-category
Land above 5m AHD and below 20m AHD sub-category
Regional infrastructure corridors and substations
Roma to Brisbane gas pipeline 100m
As the urban supply model is unable to calculate mitigation costs, this sub-category has not been used to calculate developable area. Development may be permissible if mitigation measures are taken.
Moonie to Brisbane oil pipeline 100m
Road hierarchy Motorways As the urban supply model is unable to calculate mitigation costs, this sub-category has not been used to calculate developable area. Development may be permissible if mitigation measures are taken.
Arterial roads
Suburban roads
District roads
Neighbourhood roads
Local roads
Primary freight routes
Primary freight access
Wildlife movement solution
Significant landscape trees
Significant landscape trees - adjoining site
As the urban supply model is unable to calculate mitigation costs, this sub-category has not been used to calculate developable area. Development may be permissible if mitigation measures are taken.
LGIP Planning Assumptions Extrinsic Material Page 17

Overlay Sub-category Comments
Streetscape hierarchy
Subtropical boulevard - in centre (SB1)
As the urban supply model is unable to calculate mitigation costs, this sub-category has not been used to calculate developable area. Development may be permissible if mitigation measures are taken.
Subtropical boulevard - out of centre (SB2)
City street major (CS1)
City street minor (CS2)
Neighbourhood street major (NS1)
Neighbourhood street minor (NS2)
Industrial street (IS)
Cross block link (CBL)
Corner land dedication (CLD)
Locality street (LS)
Laneway (LW)
Transport air quality corridor
Motorway air quality corridor As the urban supply model is unable to calculate mitigation costs, this sub-category has not been used to calculate developable area. Development may be permissible if mitigation measures are taken.
Major air quality corridor
Intermediate air quality corridor
Minor air quality corridor
Major intersection
Tunnel ventilation stack 100m buffer
Queensland Development Code MP4.4 Noise: Sub-category 1
Queensland Development Code MP4.4 Noise: Sub-category 2
Queensland Development Code MP4.4 Noise: Sub-category 3
Queensland Development Code MP4.4 Noise: Sub-category 4
Water resource catchments
Water resource catchment As the urban supply model is unable to calculate mitigation costs, this sub-category has not been used to calculate developable area. Development may be permissible if mitigation measures are taken.
Waterway corridors Local waterway corridor As the urban supply model is unable to calculate mitigation costs, this sub-category
LGIP Planning Assumptions Extrinsic Material Page 18

Overlay Sub-category Comments
has not been used to calculate developable area. Development may be permissible if mitigation measures are taken.
Table 4.3.6.6—City Plan zones and zone precincts comprising a constraint and used to determine net developable area
City Plan zone City Plan zone precinct
Community facilities Cemetery
Conservation Local
District
Metropolitan
Environmental management N/A
Open space Local
District
Metropolitan
Sport and recreation Local
District
Metropolitan
4.3.7 Brisbane City Council policy constraints
Brisbane City Council policy constraints are defined to specific zones and zone precincts and land uses that if occurring on a site would exclude residential development. Policy constraints are not used in the net developable area calculation as other types of development could occur on these sites i.e. this type of constraints exclude residential development.
Table 4.3.7.7 provides an overview of the City Plan zones and zone precincts that have been excluded as a result of policy constraints for residential development.
Table 4.3.7.8 provides an overview of land use / activity with no residential development opportunity. Land use constraints typically represent land uses and activities related to community uses (such as hospitals), government owned land and sites that have been stated by Council as not being appropriate to be developed, particularly for residential purposes, such as existing caravan parks.
It is relevant to note that a policy constraint can be overridden by way of a neighbourhood plan or development application.
Table 4.3.7.7—City Plan zones and zone precincts with no residential development potential2
City Plan zone City Plan zone precinct
Community facilities Major health care
2 Table 4.3.7.7 is not used in the net developable area calculation.
LGIP Planning Assumptions Extrinsic Material Page 19
City Plan zone City Plan zone precinct
Community facilities Major sports venue
Community facilities Community purposes
Community facilities Education purposes
Community facilities Emergency services
Community facilities Health care purposes
Extractive industry N/A
General industry B zone precinct N/A
General industry C zone precinct N/A
Industry investigation area N/A
Rural N/A
Specialised centre Major education and research facility
Specialised centre Entertainment and conference centre
Specialised centre Brisbane markets
Specialised centre Large format retail
Specialised centre Mixed industry and business
Specialised centre Marina
Special Industry N/A
Special purpose Defence
Special purpose Detention facility
Special purpose Transport infrastructure
Special purpose Utility services
Special purpose Airport
Special purpose Port
Township N/A
Tourist accommodation N/A
LGIP Planning Assumptions Extrinsic Material Page 20

Table 4.3.7.8—Land use/activity or other policy constraint on a site with no residential development potential3
Land use / activity Sub-category Parameter (if applicable)
Caravan parks / mobile home
Residential welfare Includes nursing homes, residential institutions etc.
Commercial character building
Heritage Local heritage placeLocal heritage areaState heritage place
Allow development when a site is greater or equal to 1,200m². Applicability of Inner city sites assessed by Heritage Team
Traditional building character
Neighbourhood character
Pre 1911 building
Community – health
Includes private and public hospitals, does not include doctor surgeries located outside of a hospital
Community – education
Community – other Includes funeral parlours, religious buildings, cemeteries, libraries, defence force establishments, welfare premises and community protection centres that are not primarily administrative
Open space Includes parks and gardens /bushland and reserves
Sites outside the SEQ Urban Footprint
State owned land Manual adjustment made for sites with residential potential.
Council owned land Manual adjustment made for sites with residential potential.
Vacant land with no residential potential
Vacant land that is not suitable for residential development
Sites ‘excluded’ from development
Includes: walkways, ramps, access restriction strips, reservoirs, dams, bores, vacant State owned land (typically road reserves, roads and state parks)
3 Table 4.3.7.8 is not used in the net developable area calculation.
LGIP Planning Assumptions Extrinsic Material Page 21

4.3.8 Existing level of development as at June 2014 and a base year of 2016
The existing level of development for all sites in Brisbane was based on the Council’s Rates Information Management System (RIMS) and was further refined to form a Land Use Activity Dataset (LUAD). This database classifies every site in Brisbane by the 19 land use/activity categories (see Appendix D) and records the number of residential dwellings and gross floor area. To validate the information RIMS database has been cross analysed with other sources including the Queensland Government Fire Service Levy, City Plan area classifications, development applications and aerial images. The database used for the LGIP is as at 30 June 2014, however the results for base year were published as the year 2016.
4.3.9 Development and building approvals
Another primary dataset used in the BUG Residential model is a time series of residential development and building approvals. The development and building approvals utilise the proposed dwelling count and are treated as being more likely to be constructed in the first time periods from 2014.
The following provides an overview of the three types of development and building approvals data that were used at the time of preparing the residential component of the planning assumptions for the LGIP:
(1) development approvals for Multiple Unit Dwellings from January 2010 to August 2015; (2) development approvals for Reconfiguration of a Lot for residential subdivision (primarily for
detached sub-divisions) from January 2010 to August 2015; (3) building approvals for detached houses from January 2010 to August 2015;(4) development approvals for Multiple Unit Dwelling for Priority Development Areas from
January 2010 to August 2015; and(5) development approvals for Reconfiguration of a Lot for residential subdivision from January
2010 to August 2015.
The development and building approvals data is sourced from internal datasets held by the Council.
4.3.10 Allocation of predicted future private residential dwelling supply
For the final allocation of the predicted private residential dwelling supply, the pricing model is applied to calculate where and when future residential development is likely to occur.
In the first part of the allocation process the model categorises each developable site into one of the following:
(1) development and building approval;(2) vacant land less than 800m²;(3) vacant land greater than 800m²;(4) redevelopment of existing residential;(5) redevelopment of existing non-residential.
One of the major factors in determining the likelihood of a site developing and the year of development is the propensity value. In the model, propensity value is a unique value generated by the model based on multiple factors including developable area, accessibility and dwelling density to determine the likelihood of a redevelopment for each site. The unimproved capital value (UCV) is used by the propensity calculation through a site value that is expressed in dollars per square metre. Where the UCV is zero or unknown a value of $200/m² is applied.
An accessibility-based factor is also applied to the calculation which reduces propensity in highly accessible areas and correspondingly increases propensity in less accessible areas to the calculation. The introduction of an accessibility-based factor is to consider the increased costs associated with
LGIP Planning Assumptions Extrinsic Material Page 22
development particularly in the CBD and inner city areas and the generally cheaper cost of development in greenfield areas.
The attribute “Cost Constrained” considers the higher development costs of sites that are subject constraints, such as flooding. This feature recognises that constraints are not always black or white in terms of development potential. When a site is flagged to be “Cost Constrained”, the propensity value is reduced by a factor of 0.5. The reduction of propensity means that the site will either happen at a later date or possibly not at all depending on the extent of other cost effective alternatives.
A “Plan Activation Timeframe” is also included in the model so that any specific planning assumptions for each plan can be manually activated unless the plan has reached its plan activation timeframe.
4.3.11 Residential occupancy rates
The dwelling supply data was then converted into the estimated resident population using residential occupancy rates provided by the State Government that were associated with the 2015 edition Population and Dwelling projections.
The occupancy rates for each SA2 and each time period by detached and attached dwelling type are set out in Appendix C.
LGIP Planning Assumptions Extrinsic Material Page 23

5 Methodology for the predicted existing and future employment and ultimate non-residential floor space
5.1 Introduction
For the purposes of the LGIP, employment projections are an essential component that informs the future employment numbers and the projected locations and timeframes of employment. The employment projections are then converted to provide the future non-residential floor space (Gross Floor Area, GFA) by five year time periods.
The employment projections used in the LGIP are known as the SEQ Council of Mayors (SEQCoM) employment projections, Queensland Treasury and Trade (QTT) primary scenario and were completed in November 2014. The overall population and employment assumptions were prepared by QTT and were then allocated to a small area by the National Institute of Economic and Industry Research (NIEIR).
This section provides an overview of the QTT primary scenario 2014 employment projections and the resulting floor space projections used in order to create the non-residential component of the planning assumptions for the LGIP.
A requirement of Statutory Guideline 03/14 is to also produce the ultimate non-residential employment and floor space figures, this section also provides an overview of the methodology undertaken by Council to calculate ultimate non-residential development figures.
Ultimate development has also been used to limit the employment projections to the capacity of the land. For employment demand that has exceeded ultimate development, this has been redistributed to other areas with capacity.
5.2 Employment projections to 2041
The following describes a brief overview of the methodology undertaken by QTT and NIEIR in the preparation of their employment projections.
The employment projections dataset contains base year employment as at 2011 and employment projections for 2016, 2021, 2026, 2031, 2036 and 2041 years.
The base year employment data is based on the ABS 2011 Census Place of Work data which is obtained from Journey to Work information. The data is then adjusted upwards to account for responses from the Census that were “inadequately described” or “not stated”.
The model parameters provided by QTT include the overall LGA level employment projections and SA2 level population projections. NIEIR then took this information and using a small area allocation model, they allocated the data to SA2 and SA1 levels to create the QTT primary scenario model output.
Although the employment dataset has a base year at 2011, the LGIPs base year was set at 2016 and employment projections for intermediate years include 2021, 2026, 2031 and 2036.
5.2.1 LGIP non-residential development types and industrial classification
As per the guideline published by the State Government, employment growth in the LGIP is grouped by a specified LGIP non-residential development type. These LGIP non-residential types have been specified by the State as Retail, Commercial, Industrial, Community Purpose and Other.
The employment data sourced from QTT and NIEIR is provided by industrial sectors defined by the Australian New Zealand Standard Industrial Classifications (ANZSIC) (2006 Edition). This data is
LGIP Planning Assumptions Extrinsic Material Page 24

provided at ‘1’ and ‘2’ digit levels which has 19 divisions and 86 subdivisions respectively. This data has then been converted to LGIP development types that align with land use using a concordance that was prepared by RPS in August 2015. This concordance was carried out at 2 digit level and proportionally assigned to LGIP development type taking into consideration of mobile workers, occupation type and geography.
5.2.2 LGIP non-residential types and planning scheme uses
Planning scheme uses are also aligned to LGIP development type which is required for inclusion within the Local Government Infrastructure Plan. This was prepared by considering use definitions in the planning scheme in conjunction with ANZSIC categories (1 & 2 digit level) and LUAD classification. Table 5.2.2.9 shows each of the planning scheme uses and the LGIP non-residential development type.
For purposes of the LGIP, Mobile workers are included in the ‘Existing and projected employees’ table. Mobile workers are unable to be included in the ‘Existing and projected non-residential floor space’ table as they have no fixed place of work that has any associated floor space e.g. public transport drivers.
Table 5.2.2.9—LGIP non-residential development types and planning scheme uses
LGIP non-residential development type
Planning Scheme Uses
Retail Adult store, Agricultural supplies store, Bar, Brothel, Bulk landscape supplies, Car wash, Food and drink outlet, Function facility, Garden centre, Hardware and trade supplies, Hotel, Market, Motor sport facility, Nightclub entertainment facility, Outdoor sales, Resort complex, Roadside stall, Rooming accommodation, Parking station, Service industry, Service station, Shop, Shopping centre, Short term accommodation, Showroom, Theatre, Tourist attraction, Tourist park, Wholesale nursery
Commercial Home-based business, Office, Research and technology industry, Sales office, Veterinary service
Industrial Air service, High impact industry, Landing, Low impact industry, Marine industry, Medium impact industry, Port service, Special industry, Telecommunications facility, Transport depot, Warehouse, Winery
Community purpose Cemetery, Child-care centre, Club, Community care centre, Community use, Crematorium, Detention facility, Educational establishment, Emergency services, Environment facility, Funeral parlour, Health care service, Hospital, Indoor sport and recreation, Major sport, recreation and entertainment facility, Nature-based tourism, Outdoor sport and recreation, Park, Place of worship
Other Animal husbandry, Animal keeping, Aquaculture, Cropping, Extractive industry, Intensive animal industry, Intensive horticulture, Major electricity infrastructure, Permanent plantation, Renewable energy facility, Rural industry, Substation, Utility installation
Mobile worker Note—There is no planning scheme use definition for mobile workers. Mobile workers include workers that have no fixed place of work e.g. construction workers.
5.2.3 BCC non-residential floor space projections
To convert employment projections to non-residential floor space, the rate of growth in jobs is applied to actual base floorspace (GFA) of the Land Use Activity Dataset (LUAD, 2014). The application of
LGIP Planning Assumptions Extrinsic Material Page 25
these rates is applied by LGIP development type and five year time periods. The data is further adjusted to account for differences in base dates of the datasets and also includes use of building approvals data to obtain a more accurate estimate of GFA by 2016.
The alignment of LUAD categories to LGIP development types are shown in Table 5.2.3.10 below.
Table 5.2.3.10—LUAD categories and LGIP non-residential development types
LGIP non-residential development type
Planning Scheme Uses
Retail RetailAccommodation and Food Services and Arts and RecreationShowroom, Retail Warehouse, Bulky Goods
Commercial Office
Industrial Industry – lightIndustry – generalIndustry – heavyIndustry – otherWarehouses, Bulk Stores, Logistics
Community purpose Community - HealthCommunity – EducationCommunity - Other
Other Rural ActivitiesAll Other
5.2.4 Inclusion of draft neighbourhood plans that have occurred after the development of the employment projections
A number of neighbourhood plans are currently in draft status and have occurred after the development of the employment projections (Nov 2014). These neighbourhood plans have been accounted for and incorporated into the employment projections through adjustments in the modelling process.
As neighbourhood plans are developed, Council officers usually prepare a local assessment of development potential known as a ‘capacity assessment’. A capacity assessment works in a similar process to LGA wide urban growth modelling and is summarised through the following process:
(1) Neighbourhood Plan boundary is established.(2) Existing development is established at base year (obtained from most recent LUAD dataset).(3) Development approvals and Building approvals are added to account for short term years.(4) Land use and density assumptions are developed and taken into account for new precincts
and also zones.(5) Developable area is calculated taking into account of constraints (consistent with LGA wide
modelling constraints, plus any additional local constraints if known)(6) Ultimate development is calculated by multiplying density assumptions by developable area.
On occasion Virtual Brisbane 3D modelling of neighbourhood planning scenarios will be used to derive ultimate GFA.
(7) Sequencing of development for projection years will be derived from development and building approvals, economic report (if available), employment projections for area,
LGIP Planning Assumptions Extrinsic Material Page 26

discussions with land owners and developers in the area and other relevant research and information sources.
(8) Conversion of dwellings and GFA to population and employees will also be undertaken using household occupancy rates and employee to floorspace conversion rates.
Neighbourhood plans incorporated through this process include Albion NP, City Centre NP, Taringa NP, Hemmant Lytton NP, Spring Hill and Lower Oxley Creek North.
The non-residential ultimate calculation which is described in the next section incorporates draft neighbourhood plan planning assumptions into that model.
5.3 Calculating ‘ultimate development’ figures for employment and floor space
As a requirement of Statutory Guideline 03/14 for the LGIP, an ultimate development figure for potential non-residential development (potential future floor space supply) was calculated for all relevant sites across Brisbane. It is important to note that ultimate development is calculated independently of the growth anticipated from the employment projections and may be higher or even lower than original projected demand at either the local projection area (SA2) or even at the LGA level. This is different to the residential modelling which directly links residential demand to residential land supply.
The following describes an overview of the methodology undertaken by Council in the preparation of an ultimate development figure for employment and non-residential floor space. An overview of each input required in the calculation is as follows:
(1) The existing floor space (existing development) by non-residential use type across all sites in Brisbane City;
(2) City Plan 2014 zoning;(3) Land use and yield provisions derived from the planned density of all City Plan 2014 zones,
zone precincts and relevant neighbourhood plan precincts;(4) City Plan 2014 overlay and zoning constraints to determine developable area of land;(5) Brisbane City Council policy and other constraints to potential re-development; and (6) Conversion of ultimate GFA to ultimate employees.
5.3.1 Existing floor space by non-residential use types
The existing level of development for all sites in Brisbane was based on the Council’s Rates Information Management System (RIMS) and was further refined to form a Land Use Activity Dataset (LUAD). This database classifies every site in Brisbane by the 19 land use/activity categories (see Appendix D) and records the number of dwellings and gross floor area. To validate the information RIMS database has been cross analysed with other sources including the Queensland Government Fire Service Levy, City Plan 2014 zoning, development approvals and aerial images. The database is used to reflect the existing level of development for the non-residential ultimate development floor space figures for LGIP as at 30 June 2014.
5.3.2 Land use and yield assumptions
For the purposes of calculating an ultimate development figure, all relevant sites in Brisbane that could yield potential new or additional non-residential development were allocated its’ equivalent land use and yield provisions. Appendix E is a summary table for each relevant City Plan 2014 zone and precinct and neighbourhood plan precinct and sub-precinct which identifies the density assumptions used in calculating the type and extent of development that could occur on sites across Brisbane.
The method undertaken to derive the non-residential land use and yield assumptions are summarised below:
LGIP Planning Assumptions Extrinsic Material Page 27

(1) Analysis of zone, precinct and applicable development codes in order to understand the density parameters such as site cover, storeys, car parking configurations, non-GFA and GFA of buildings that could occur in the zone and precinct in order to ascertain ranges of plot ratios that could occur.
(2) Urban planners / architects advice in building design.(3) Analysis of development approvals over a two year period and modelling in Council’s Virtual
Brisbane Model.(4) Analysis of the existing development in Brisbane to understand plot ratios of existing
development.
All sites in Brisbane are allocated to a zone and where applicable a precinct. For those sites located in a neighbourhood plan area, the specific provisions of the neighbourhood plan will in most cases override the zone and precinct density assumptions. For precincts in Priority Development Areas these are also assigned land use and yield assumptions. Appendix B provides a list of all neighbourhood plans reflected in the land use and yield assumptions.
5.3.3 Developable area of land
The developable area of land represents the site area minus constrained land. Constraints for the purpose of calculating developable area separated into two categories:
(1) Physical and environmental constraints which are mostly obtained from City Plan 2014 Overlays (Table 5.3.3.11); and
(2) Specific City Plan 2014 zones and precincts used in the net developable area calculation primarily relate to environmental zones and precincts (Table 12).
Table 5.3.3.11—Physical and environmental constraints used to determine net developable area for potential non-residential development
Physical and environment constraints Sub-category
Biodiversity Areas High ecological significance
Priority koala habitat area
Extractive resources KRA resource/processing area
KRA separation area
KRA transport route separation area
KRA transport route
Flood Brisbane River flood planning area 1
Creek/waterway flood planning area 1
Regional infrastructure corridors and substations Roma to Brisbane gas pipeline 20m
Moonie to Brisbane oil pipeline 15m
Major electricity infrastructure high voltage powerline easement
Road hierarchy Future arterial road (20m buffer)
Waterway corridors Brisbane River corridor
Citywide waterway corridor
LGIP Planning Assumptions Extrinsic Material Page 28

Physical and environment constraints Sub-category
Wetlands Wetland
Slope (City Plan Policy) Slope greater than 25%
Table 5.3.3.12—City Plan 2014 zones and zone precincts comprising a constraint and used to determine net developable area for potential non-residential development
City Plan 2014 zone City Plan 2014 zone precinct
Community facilities Cemetery
Conservation Local
District
Metropolitan
Open space Local
District
Metropolitan
Sport and recreation Local
District
Metropolitan
5.3.4 Brisbane City Council policy constraints
Council policy constraints are defined to specific zones and zone precincts and land uses that if occurring on a site would exclude non-residential development. Policy constraints are not used in the net developable area calculation as other types of development could occur on these sites.
Table 5.3.4.13 provides an overview of the City Plan 2014 zones and zone precincts that have been excluded as a result of policy constraints for non-residential development.
Table 5.3.4.14 provides an overview of land use / activity with no non-residential development opportunity. Land use constraints typically represent land uses and activities related to select government owned land and sites that have been stated by Council as not being appropriate to be developed.
Table 5.3.4.13—City Plan zones and zone precincts with no non-residential development potential4
City Plan zone City Plan zone precinct
Low Density Residential -
Low Medium Residential 2 storey mix zone precinct, 2 or 3 storey mix zone precinct and Up to 3 storeys zone precinct
Medium Residential -
4 Table 5.3.4.13 is not used in the net developable area calculation.
LGIP Planning Assumptions Extrinsic Material Page 29

City Plan zone City Plan zone precinct
High Density Residential Up to 8 storeys zone precinct and Up to 15 storeys zone precinct
Character residential Character zone precinct and Infill housing zone precinct
Emerging Community -
Rural Residential -
Limited development (c. land) N/A
Township N/A
Table 5.3.4.14—Land use/activity or other policy constraint on a site with no non-residential development potential5
Land use / activity Sub-category Parameter (if applicable)
Caravan parks / mobile home
Residential welfare Includes nursing homes, residential institutions etc.
Local heritage sites Allow development when a site is greater or equal to 1,200m².
Open space Includes parks and gardens /bushland and reserves
Sites outside the SEQ Urban Footprint
State owned land Select land not suitable for non-residential development
Council owned land Select land not suitable for non-residential development
Specific sites in the City Centre with no future development potential
Vacant land with no non-residential potential
Vacant land that is not suitable for non-residential development
Sites ‘excluded’ from development
Includes: walkways, ramps, access restriction strips, reservoirs, dams, bores, vacant State owned land (typically road reserves, roads and state parks)
5.3.5 Ultimate employees
Following the development of non-residential ultimate floorspace (GFA), this data is then converted to calculate ultimate employees. This is developed by taking rate of growth in floorspace from the base 5 Table 5.3.4.14 is not used in the net developable area calculation.
LGIP Planning Assumptions Extrinsic Material Page 30

(LUAD 2014) to Ultimate and applying this to the base employment which in turn provides the ultimate capacity for employees. The difference in base dates of the two datasets is also accounted for.
LGIP Planning Assumptions Extrinsic Material Page 31

6 Planned demand
6.1 Planned infrastructure demand rate
The calculation of planned demand per net developable hectare for a zone, precinct or other specific planning area (i.e. neighbourhood plan area) is based on three key inputs. The inputs are as follows:
(1) density, expressed as attached or detached dwellings per net developable hectare for residential development and plot ratios (GFA divided by net developable area) for non-residential development;
(2) land use mix within a zone, precinct or other specific planning area;(3) demand conversion rates to allow the conversion of the number of assumed dwellings, GFA
or employees (by LGIP development type) into an amount of demand per hectare.
It is important that these inputs result in a planned demand that is aligned with the likely demand achieved by development in a zone or precinct. The alignment of planned demand (and therefore infrastructure provision) with the achieved demand is a key goal of infrastructure planning.
Demand conversion rates are calculated having regard to their desired standards of service. This is described in the relevant Extrinsic Material for each network. The demand conversion rates including ETs and desired rate of provision per unit of demand are listed in Appendix F.
For the stormwater network, a similar approach was used but the measure of demand is expressed as impervious fraction.
6.2 Service catchments and planned demand
6.2.1 Service catchment boundaries
In determining appropriate service catchments for infrastructure networks a number of factors were considered including:
(1) trunk infrastructure items operating as a system to service both citywide and local catchments, such as:(a) metropolitan parks performing unique functions to service the city;(b) principal community facilities servicing local catchments;(c) district access roads and suburban routes servicing local trips;
(2) reasonable apportionment of establishment costs of trunk infrastructure;(3) clarity of boundary definitions for both open and closed networks;(4) administration of a financial system supporting the LGIP;(5) Council’s desired standards of service, land acquisition, capital works and expenditure
program.
The methodology for determining the service catchments for each network is outlined below.
Service catchments for the road network are defined areas based on amalgamated traffic modelling zones, which originate from the Brisbane Strategic Transport Model (BSTM). The pathway network and ferry terminals network have a single service catchment which covers the extent of the LGA (mainland only).
Service catchments for stormwater are primarily based on Brisbane’s major catchments and sub-catchments as well as Local Stormwater Management Plans which provide greater detail in relation to catchments. The service catchments for stormwater reflect the natural catchment boundaries and desired standards of service for stormwater infrastructure.
LGIP Planning Assumptions Extrinsic Material Page 32

Service catchments for public parks use geographical landmarks (Brisbane River) and major infrastructure (Gympie Road/Bowen Bridge Road/Pacific Motorway) to define the four catchments. Refer to section 4.4.1 of the Public Parks and Land for Community Facilities Extrinsic Material for further detail.
Service catchments for land for community facilities are defined to reflect the areas serviced by particular infrastructure items. Land for community facilities service catchments reflect the local ‘draw’ of each identified infrastructure item. Furthermore, the service catchments have common boundaries with the desired standards of service categories on which the infrastructure planning is also based. Refer to section 4.4.2 of the Public Parks and Land for Community Facilities Extrinsic Material for further detail.
6.2.2 Planned demand for service catchments
Underpinning the planned demand figures are the private residential dwelling supply and the future non-residential floor space for each five year timeframe from 2016 to 2031 and beyond 2031 (ultimate development). Residential and non-residential development types were reported by service catchment in a matrix of cumulative attached dwellings, detached dwellings, retail, commercial, industrial, community purposes and other development types by five year timeframes from 2016 to 2031 (as well as ultimate).
The planned demand for the public parks, land for community facilities, transport (ferry terminals) and transport (pathway) networks is calculated by multiplying the residential and non-residential growth data by the demand conversion rates.
The planned demand for the Transport network (roads) has been calculated using the BSTM for years 2016 to 2026; for beyond 2026 and ultimate the BSTM data has been projected using the rate of growth obtained from the combined residential and non-residential growth outputs (utilising equivalent tenements).
The planned demand for the Stormwater network has been calculated using hydrologic methods which are appropriate to the type of catchment in accordance with the Queensland Urban Drainage Manual (QUDM). The existing demand for stormwater infrastructure is determined using impervious imagery, and future stormwater demand is calculated using assumptions from the residential and non-residential growth data. The detailed method is located in the Stormwater network extrinsic material.
Tables for planned demand have also been expressed as equivalent tenements (ETs) for the transport, public parks and land for communities networks and are located in Appendix G.
LGIP Planning Assumptions Extrinsic Material Page 33
7 Priority infrastructure areaThe PIA identifies the area that Council intends to prioritise for the provision of all trunk infrastructure networks to service urban growth for a minimum of 10 years.
The LGIP PIA includes urban zoned land under the planning scheme. In accordance with the SPA infrastructure guidelines, the PIA excludes rural land except where the land has been rezoned for urban purposes under an adopted neighbourhood plan. The PIA generally follows the Urban Footprint of the adopted South East Queensland Regional Plan.
The PIA also includes the following priority development areas within the Council’s local government area:
(1) Bowen Hills;(2) Woolloongabba;(3) Northshore Hamilton;(4) Fitzgibbon; and (5) South Bank.
LGIP Planning Assumptions Extrinsic Material Page 34

8 Appendices
8.1 Appendix A: City Plan 2014 land use and yield assumptions
For all residential and residential related zones and precincts in the planning scheme, the following land use and yield assumptions have been used in the BUG Residential model as the assumptions underpinning the potential future residential dwelling supply for all lots within Brisbane’s local government area.
Table 8.1.1—City Plan 2014 density assumptions for attached and detached dwellings
City Plan 2014 Density assumptions for attached Density assumptions for detached
Zone and Precinct Minimum lot size (attached)
Plot ratio Attached dwellings per hectare(Note 1)
Attached probability to non-residential
Minimum lot size (detached)
Detached dwellings per site
Detached dwellings per hectare(Note 1)
Detached probability to attached
Character Residential - Character 450m2 1 20(Note 2) 1
Character Residential - Infill housing 300m2 33(Note 3) 20 0.6
Low Density Residential - N/A 400m2 1 16 1
Low - medium Density Residential - 2 storey mix 600m2 0.66 44 260m2 2 20(Note 4) 0.4
800m2 0.7 75 260m2 3 20(Note 4) 0.4
1200m2 0.8 80 260m2 5 20(Note 4) 0.4
Low - medium Density Residential - 2 to 3 storey mix 600m2 0.9 60 200m2 2 24(Note 4) 0.4
800m2 0.75 75 200m2 3 24(Note 4) 0.4
1200m2 1 80 200m2 5 24(Note 4) 0.4
Low - medium Density Residential - 3 storeys 600m2 0.8 80 200m2 2 24(Note 4) 0.4
800m2 0.9 90 200m2 3 24(Note 4) 0.1
1200m2 1.05 105 200m2 5 24(Note 4) 0.1
LGIP Planning Assumptions Extrinsic Material Page 35

City Plan 2014 Density assumptions for attached Density assumptions for detached
Low - medium Density Residential - 2 storey mix(In Neighbourhood Character Overlay only)
450m2 1 20(Note 2) 1
450m2 1 20(Note 2) 1
450m2 1 20(Note 2) 1
Medium Density Residential - Up to 5 storeys 800m2 1.4 175
1200m2 1.6 200
2400m2 1.8 225
High Density Residential - Up to 8 storeys 800m2 1.8 225
1200m2 2.7 338
2400m2 3 375
High Density Residential - Up to 15 storeys 800m2 3 375
1200m2 3.4 425
2400m2 3.8 475
Rural Zone 100 ha 1
Rural Residential 1 to 5 ha 3 1
Emerging Community(Note 5) 22 18 0.8
Neighbourhood Centre(Note 6) 75 10%
District Centre - District(Note 6) 1.25 125 10%
District Centre - Corridor(Note 6) 150 5%
Principal Centre - City Centre(Note 6) 1625 20%
Principal Centre - Regional Centre(Note 6)
LGIP Planning Assumptions Extrinsic Material Page 36

City Plan 2014 Density assumptions for attached Density assumptions for detached
Major Centre(Note 6) 120 5%
Mixed Use - Inner City(Note 6) 188 20%
Mixed Use - Centre Frame(Note 6) 150 50%
Mixed Use - Corridor Zone(Note 6) 150 10%
Table Notes:
(1) Notes for dwellings per hectare calculations:
(a) Applying 150m2 for attached in the Character residential - Infill housing precinct) and Low-medium density residential – 2 storey mix and 2 to 3 storey mix precincts where the minimum lot size is 600m2 only.
(b) Applying 100m2 for attached in all other Low – medium zones.
(c) Applying 80m2 for attached in all other QPP precincts that are 5 storeys or above.
(d) Applying 250m2 for all detached dwellings.
(2) It has been assumed that as the purpose of the character precinct in the character residential zone is for detached dwellings only and as this area is primarily located in infill that the dwellings per hectare calculation can be based on 'gross' as infrastructure is assumed to be provided.
(3) The plot ratio has been sourced from the Character residential zone code for the infill housing zone precinct (maximum dwelling yield of 300m2 of site area with a maximum plot ratio of 0.5 times the site area).
(4) The detached dwellings per hectare calculation for all zones assume that the potential future detached development will occur in infill areas only.
(5) The dwellings per hectare rates for attached and detached in the Emerging community zone are based on two years (January 2010 to December 2011) of building completions data in existing (as at 28th February 2012) Emerging community areas. Over the two year period, a total of 541 new attached dwellings were built and a total of 1,207 detached dwellings were built. The dwelling per hectare is based on the site area of each type of residential dwelling.
(6) Where in a Neighbourhood Plan precinct, specific provisions for the precinct will apply.
LGIP Planning Assumptions Extrinsic Material Page 37

8.2 Appendix B: Neighbourhood plans and other areas reflected in the land use and yield assumptions
8.2.1 Adopted neighbourhood plans
(1) Acacia Ridge—Archerfield neighbourhood plan(2) Algester—Parkinson—Stretton neighbourhood plan(3) Ashgrove—Grange district neighbourhood plan(4) Aspley district neighbourhood plan(5) Australia TradeCoast neighbourhood plan(6) Banyo—Nudgee neighbourhood plan(7) Bowen Hills neighbourhood plan(8) Bracken Ridge and district neighbourhood plan(9) Bulimba district neighbourhood plan(10) Calamvale district neighbourhood plan(11) Capalaba West neighbourhood plan(12) Carina—Carindale neighbourhood plan(13) Carindale centre neighbourhood plan(14) Centenary suburbs neighbourhood plan(15) Chermside centre neighbourhood plan(16) Clayfield—Wooloowin district neighbourhood plan(17) Darra—Oxley district neighbourhood plan(18) Doolandella neighbourhood plan(19) East Brisbane—Coorparoo district neighbourhood plan(20) Eastern corridor neighbourhood plan(21) Enoggera district neighbourhood plan(22) Everton Park neighbourhood plan(23) Ferny Grove—Upper Kedron neighbourhood plan(24) Fig Tree Pocket neighbourhood plan(25) Forest Lake neighbourhood plan(26) Fortitude Valley neighbourhood plan(27) Holland Park—Tarragindi district neighbourhood plan(28) Indooroopilly centre neighbourhood plan(29) Ithaca district neighbourhood plan(30) Kangaroo Point peninsula neighbourhood plan(31) Kangaroo Point south neighbourhood plan(32) Kelvin Grove urban village neighbourhood plan(33) Kuraby neighbourhood plan(34) Lake Manchester neighbourhood plan(35) Latrobe and Given Terraces neighbourhood plan(36) Lower Oxley Creek south neighbourhood plan(37) Lutwyche Road corridor neighbourhood plan(38) McDowall—Bridgeman Downs neighbourhood plan(39) Milton neighbourhood plan(40) Milton Station neighbourhood plan(41) Mitchelton centre neighbourhood plan(42) Mitchelton neighbourhood plan(43) Moggill—Bellbowrie district neighbourhood plan(44) Moorooka—Stephens district neighbourhood plan(45) Moreton Island settlements neighbourhood plan(46) Mt Coot-tha neighbourhood plan(47) Mt Gravatt corridor neighbourhood plan
LGIP Planning Assumptions Extrinsic Material Page 38

(48) New Farm and Teneriffe Hill neighbourhood plan(49) Newstead and Teneriffe waterfront neighbourhood plan(50) Nudgee Beach neighbourhood plan(51) Nundah district neighbourhood plan(52) Petrie Terrace and Spring Hill neighbourhood plan(53) Pinkenba—Eagle Farm neighbourhood plan(54) Racecourse precinct neighbourhood plan(55) Richlands—Wacol corridor neighbourhood plan(56) River gateway neighbourhood plan(57) Rochedale urban community neighbourhood plan(58) Sandgate district neighbourhood plan(59) Sandgate Road neighbourhood plan(60) Sherwood—Graceville district neighbourhood plan(61) South Brisbane riverside neighbourhood plan(62) Taringa neighbourhood plan(63) Toombul—Nundah neighbourhood plan(64) Toowong—Auchenflower neighbourhood plan(65) Toowong—Indooroopilly district neighbourhood plan(66) Wakerley neighbourhood plan(67) West End—Woolloongabba district neighbourhood plan(68) Western gateway neighbourhood plan(69) Willawong neighbourhood plan(70) Woolloongabba centre neighbourhood plan(71) Wynnum West neighbourhood plan(72) Wynnum—Manly neighbourhood plan
8.2.2 Draft neighbourhood plans (as at October 2015)6
(1) Albion neighbourhood plan(2) City Centre neighbourhood plan(3) Hemmant Lytton neighbourhood plan(4) Lower Oxley Creek north neighbourhood plan(5) Spring Hill neighbourhood plan(6) Taringa neighbourhood plan
8.2.3 Priority Development Areas
(1) Bowen Hills PDA(2) Fitzgibbon PDA(3) Hamilton Northshore PDA(4) Woolloongabba PDA
8.2.4 State Planning Regulatory Provision (SPRP)
(1) Yeerongpilly Transit Oriented Development
6 This material includes amendments relating to select Neighbourhood Plans that were draft as at October 2015. These neighbourhood plans are yet to be included in City Plan 2014 as they are the subject of a separate planning scheme amendment process. The information has been included in anticipation of a neighbourhood plan progressing and is subject to change.
LGIP Planning Assumptions Extrinsic Material Page 39

8.3 Appendix C: Residential occupancy rates
Table 8.3.1—Small area occupancy rates for detached dwellings (Note 1)
Statistical Area 2 (SA2) ASGS 2011 2011 2016 2021 2026 2031 2036
Albion 2.56 2.47 2.39 2.30 2.22 2.15
Alderley 2.66 2.66 2.66 2.66 2.66 2.66
Algester 2.87 2.93 2.90 2.87 2.84 2.81
Annerley 2.72 2.69 2.66 2.63 2.61 2.58
Ascot 2.90 2.80 2.70 2.61 2.52 2.43
Ashgrove 2.95 2.95 2.95 2.95 2.95 2.95
Aspley 2.80 2.77 2.73 2.70 2.67 2.64
Auchenflower 2.93 2.91 2.81 2.71 2.62 2.53
Bald Hills 2.83 2.80 2.77 2.73 2.70 2.67
Balmoral 2.76 2.74 2.65 2.56 2.47 2.38
Bardon 2.80 2.80 2.80 2.80 2.80 2.80
Bellbowrie - Moggill 3.01 3.08 3.05 3.02 2.99 2.96
Belmont - Gumdale 3.09 3.15 3.12 3.10 3.07 3.05
Boondall 2.74 2.70 2.67 2.64 2.61 2.58
Bracken Ridge 2.90 2.87 2.84 2.80 2.77 2.74
Bridgeman Downs 3.13 3.10 3.06 3.02 2.99 2.95
Brighton (Qld) 2.56 2.53 2.50 2.47 2.44 2.41
Brisbane Airport 2.59 2.63 2.60 2.57 2.54 2.51
Brisbane City 2.69 2.59 2.50 2.41 2.33 2.25
Brisbane Port - Lytton 1.17 1.19 1.18 1.17 1.16 1.15
Brookfield - Kenmore Hills 3.11 3.17 3.14 3.11 3.08 3.05
Bulimba 2.88 2.77 2.68 2.59 2.50 2.41
Calamvale - Stretton 3.19 3.16 3.13 3.09 3.06 3.03
Camp Hill 2.75 2.80 2.77 2.74 2.72 2.69
Cannon Hill 2.61 2.58 2.56 2.53 2.50 2.48
Carina 2.67 2.64 2.61 2.59 2.56 2.53
Carina Heights 2.61 2.58 2.56 2.53 2.50 2.48
Carindale 3.10 3.07 3.04 3.01 2.98 2.95
LGIP Planning Assumptions Extrinsic Material Page 40

Statistical Area 2 (SA2) ASGS 2011 2011 2016 2021 2026 2031 2036
Carseldine 2.86 2.83 2.79 2.76 2.73 2.69
Chapel Hill 2.89 2.95 2.92 2.89 2.87 2.84
Chelmer - Graceville 2.81 2.86 2.84 2.81 2.78 2.76
Chermside 2.34 2.31 2.28 2.25 2.23 2.20
Chermside West 2.65 2.70 2.66 2.63 2.60 2.57
Clayfield 2.83 2.81 2.71 2.62 2.53 2.44
Coopers Plains 2.66 2.63 2.60 2.58 2.55 2.52
Coorparoo 2.77 2.75 2.72 2.69 2.66 2.63
Corinda 2.79 2.76 2.74 2.71 2.69 2.66
Darra - Sumner 2.85 2.86 2.86 2.86 2.86 2.86
Deagon 2.33 2.37 2.34 2.31 2.28 2.26
Durack 3.15 3.25 3.25 3.25 3.25 3.26
Eagle Farm - Pinkenba 2.00 1.98 1.96 1.93 1.91 1.89
East Brisbane 2.72 2.62 2.53 2.44 2.36 2.28
Eight Mile Plains 3.16 3.12 3.09 3.06 3.03 3.00
Enoggera 2.68 2.66 2.63 2.61 2.58 2.56
Enoggera Reservoir 2.89 2.95 2.92 2.89 2.86 2.84
Everton Park 2.58 2.55 2.52 2.49 2.46 2.43
Fairfield - Dutton Park 2.91 2.88 2.85 2.82 2.79 2.76
Fig Tree Pocket 3.22 3.19 3.16 3.13 3.10 3.07
Forest Lake - Doolandella 2.99 2.99 2.99 3.00 3.00 3.00
Fortitude Valley 2.34 2.26 2.18 2.11 2.03 1.96
Geebung 2.57 2.61 2.58 2.55 2.52 2.49
Grange 2.87 2.87 2.87 2.87 2.87 2.87
Greenslopes 2.60 2.57 2.54 2.52 2.49 2.47
Hamilton (Qld) 2.79 2.69 2.60 2.51 2.42 2.34
Hawthorne 2.85 2.83 2.74 2.64 2.55 2.46
Hendra 2.65 2.65 2.65 2.65 2.65 2.65
Highgate Hill 2.90 2.80 2.70 2.61 2.52 2.43
Holland Park 2.72 2.70 2.67 2.64 2.61 2.59
LGIP Planning Assumptions Extrinsic Material Page 41

Statistical Area 2 (SA2) ASGS 2011 2011 2016 2021 2026 2031 2036
Holland Park West 2.68 2.73 2.71 2.68 2.65 2.62
Inala - Richlands 2.95 2.96 2.96 2.96 2.96 2.96
Indooroopilly 2.80 2.77 2.74 2.72 2.69 2.67
Ipswich - North 3.10 3.11 3.11 3.11 3.11 3.11
Jindalee - Mount Ommaney 2.81 2.87 2.84 2.81 2.79 2.76
Kangaroo Point 2.38 2.30 2.22 2.14 2.07 2.00
Karana Downs 2.94 2.95 2.95 2.95 2.95 2.95
Kedron - Gordon Park 2.67 2.64 2.61 2.58 2.55 2.52
Kelvin Grove - Herston 2.68 2.59 2.50 2.41 2.33 2.25
Kenmore 2.82 2.80 2.77 2.74 2.72 2.69
Keperra 2.56 2.62 2.59 2.57 2.54 2.52
Kuraby 3.33 3.29 3.26 3.23 3.19 3.16
Lake Manchester - England Creek 2.60 2.60 2.60 2.61 2.61 2.61
Macgregor (Qld) 3.09 3.06 3.03 3.00 2.97 2.93
Manly - Lota 2.65 2.63 2.61 2.58 2.56 2.54
Manly West 2.81 2.79 2.76 2.74 2.72 2.70
Mansfield (Qld) 2.94 2.99 2.96 2.93 2.90 2.87
McDowall 2.92 2.88 2.85 2.81 2.78 2.75
Middle Park - Jamboree Heights 2.83 2.89 2.86 2.83 2.81 2.78
Mitchelton 2.65 2.63 2.60 2.58 2.55 2.53
Moorooka 2.60 2.58 2.55 2.52 2.50 2.47
Morningside - Seven Hills 2.60 2.50 2.42 2.33 2.25 2.18
Mount Coot-tha 2.60 2.65 2.63 2.60 2.58 2.55
Mount Gravatt 2.73 2.70 2.67 2.65 2.62 2.59
Murarrie 2.72 2.70 2.67 2.65 2.63 2.61
New Farm 2.63 2.61 2.52 2.44 2.35 2.27
Newmarket 2.79 2.79 2.79 2.79 2.79 2.79
Newstead - Bowen Hills 2.53 2.44 2.36 2.28 2.20 2.12
Norman Park 2.69 2.69 2.69 2.69 2.69 2.69
Northgate - Virginia 2.64 2.69 2.66 2.62 2.59 2.56
LGIP Planning Assumptions Extrinsic Material Page 42
Statistical Area 2 (SA2) ASGS 2011 2011 2016 2021 2026 2031 2036
Nudgee - Banyo 2.66 2.71 2.68 2.65 2.61 2.58
Nundah 2.62 2.59 2.56 2.52 2.49 2.47
Oxley (Qld) 2.80 2.80 2.80 2.80 2.81 2.81
Paddington - Milton 2.66 2.57 2.48 2.39 2.31 2.23
Pallara - Willawong 3.05 3.02 2.98 2.95 2.92 2.89
Parkinson - Drewvale 3.35 3.32 3.28 3.25 3.21 3.18
Pinjarra Hills - Pullenvale 3.17 3.24 3.21 3.18 3.15 3.12
Red Hill (Qld) 2.68 2.68 2.68 2.68 2.68 2.68
Redland Islands 1.43 1.42 1.41 1.40 1.38 1.37
Riverhills 2.71 2.68 2.66 2.63 2.61 2.58
Robertson 3.09 3.15 3.11 3.08 3.05 3.02
Rochedale - Burbank 3.12 3.09 3.06 3.03 2.99 2.96
Rocklea - Acacia Ridge 2.68 2.65 2.62 2.60 2.57 2.54
Runcorn 3.01 3.07 3.04 3.00 2.97 2.94
Salisbury - Nathan 2.66 2.71 2.68 2.66 2.63 2.60
Sandgate - Shorncliffe 2.65 2.70 2.67 2.63 2.60 2.57
Seventeen Mile Rocks - Sinnamon Park 3.02 2.99 2.96 2.93 2.90 2.88
Sherwood 2.91 2.88 2.85 2.83 2.80 2.77
South Brisbane 2.65 2.56 2.47 2.39 2.30 2.22
Spring Hill 2.60 2.51 2.42 2.34 2.26 2.18
St Lucia 2.95 2.92 2.89 2.87 2.84 2.81
Stafford 2.42 2.40 2.37 2.34 2.31 2.28
Stafford Heights 2.60 2.65 2.61 2.58 2.55 2.52
Sunnybank 2.85 2.82 2.79 2.77 2.74 2.71
Sunnybank Hills 2.99 3.05 3.02 2.98 2.95 2.92
Taigum - Fitzgibbon 2.60 2.57 2.54 2.51 2.48 2.45
Taringa 2.73 2.70 2.67 2.65 2.62 2.60
Tarragindi 2.71 2.76 2.73 2.70 2.68 2.65
The Gap 2.87 2.93 2.90 2.88 2.85 2.82
Tingalpa 2.80 2.78 2.76 2.73 2.71 2.69
LGIP Planning Assumptions Extrinsic Material Page 43

Statistical Area 2 (SA2) ASGS 2011 2011 2016 2021 2026 2031 2036
Toowong 2.89 2.79 2.69 2.60 2.51 2.42
Upper Kedron - Ferny Grove 3.08 3.05 3.02 2.99 2.96 2.93
Upper Mount Gravatt 2.64 2.61 2.59 2.56 2.53 2.51
Wacol 3.04 3.14 3.14 3.14 3.14 3.14
Wakerley 3.19 3.16 3.13 3.11 3.08 3.05
Wavell Heights 2.57 2.61 2.58 2.55 2.52 2.49
West End 2.81 2.71 2.61 2.52 2.44 2.35
Westlake 3.06 3.12 3.09 3.06 3.03 3.00
Wilston 2.98 2.98 2.98 2.98 2.98 2.98
Windsor 2.68 2.58 2.49 2.41 2.32 2.24
Wishart 3.01 2.98 2.95 2.92 2.88 2.86
Woolloongabba 2.68 2.66 2.63 2.60 2.57 2.55
Wooloowin - Lutwyche 2.83 2.73 2.64 2.55 2.46 2.37
Wynnum 2.63 2.61 2.59 2.57 2.55 2.53
Wynnum West - Hemmant 2.71 2.68 2.66 2.64 2.61 2.59
Yeronga 2.74 2.72 2.69 2.66 2.63 2.61
Zillmere 2.50 2.47 2.44 2.41 2.38 2.35
Source: Queensland Treasury, Population and dwelling projections, 2015 Edition.
Table Note:
(1) Excludes occupancy rates for non-private dwellings and their residents, as well as caravans, houseboats and temporary residences.
Table 8.3.2—Small area occupancy rates for attached dwellings (Note 1)
Statistical Area 2 (SA2) ASGS 2011 2011 2016 2021 2026 2031 2036
Albion 1.57 1.60 1.63 1.66 1.69 1.73
Alderley 1.59 1.62 1.65 1.68 1.72 1.75
Algester 2.30 2.35 2.40 2.46 2.51 2.57
Annerley 1.83 1.87 1.91 1.95 1.99 2.04
Ascot 1.62 1.65 1.68 1.72 1.75 1.78
Ashgrove 1.66 1.70 1.73 1.76 1.80 1.83
Aspley 1.57 1.59 1.62 1.64 1.67 1.70
Auchenflower 1.79 1.82 1.86 1.89 1.93 1.97
LGIP Planning Assumptions Extrinsic Material Page 44

Statistical Area 2 (SA2) ASGS 2011 2011 2016 2021 2026 2031 2036
Bald Hills 1.62 1.64 1.67 1.70 1.72 1.75
Balmoral 1.64 1.67 1.70 1.73 1.77 1.80
Bardon 1.68 1.71 1.74 1.78 1.81 1.85
Bellbowrie - Moggill 1.93 2.02 2.05 2.09 2.12 2.15
Belmont - Gumdale 2.65 2.74 2.75 2.76 2.77 2.78
Boondall 1.93 1.97 2.00 2.03 2.06 2.10
Bracken Ridge 2.14 2.18 2.21 2.25 2.29 2.32
Bridgeman Downs 1.82 1.85 1.88 1.91 1.94 1.97
Brighton (Qld) 1.49 1.51 1.53 1.56 1.59 1.61
Brisbane Airport 1.65 1.67 1.70 1.73 1.76 1.79
Brisbane City 1.75 1.78 1.82 1.85 1.89 1.93
Brisbane Port - Lytton 1.65 1.65 1.66 1.67 1.67 1.68
Brookfield - Kenmore Hills 1.40 1.42 1.44 1.47 1.49 1.51
Bulimba 1.72 1.76 1.79 1.83 1.86 1.90
Calamvale - Stretton 2.78 2.84 2.90 2.96 3.03 3.10
Camp Hill 1.78 1.82 1.86 1.90 1.94 1.99
Cannon Hill 1.88 1.92 1.97 2.01 2.05 2.10
Carina 1.96 2.00 2.05 2.09 2.14 2.19
Carina Heights 1.97 2.02 2.06 2.11 2.15 2.20
Carindale 1.96 2.00 2.05 2.09 2.14 2.19
Carseldine 1.69 1.71 1.74 1.77 1.80 1.83
Chapel Hill 2.01 2.04 2.07 2.10 2.14 2.17
Chelmer - Graceville 1.60 1.62 1.65 1.67 1.70 1.73
Chermside 1.72 1.75 1.78 1.81 1.84 1.87
Chermside West 1.70 1.73 1.75 1.78 1.81 1.84
Clayfield 1.67 1.70 1.73 1.77 1.80 1.84
Coopers Plains 1.84 1.88 1.92 1.97 2.01 2.05
Coorparoo 1.72 1.76 1.80 1.84 1.88 1.92
Corinda 1.66 1.69 1.71 1.74 1.77 1.79
Darra - Sumner 2.61 2.69 2.77 2.85 2.93 3.01
LGIP Planning Assumptions Extrinsic Material Page 45

Statistical Area 2 (SA2) ASGS 2011 2011 2016 2021 2026 2031 2036
Deagon 1.15 1.34 1.65 1.65 1.65 1.65
Durack 1.41 1.45 1.50 1.54 1.59 1.63
Eagle Farm - Pinkenba 1.63 1.66 1.69 1.71 1.74 1.77
East Brisbane 1.75 1.78 1.82 1.85 1.89 1.93
Eight Mile Plains 2.58 2.64 2.70 2.76 2.82 2.88
Enoggera 1.63 1.65 1.68 1.70 1.73 1.76
Enoggera Reservoir 1.65 1.67 1.70 1.73 1.75 1.78
Everton Park 1.67 1.70 1.73 1.75 1.78 1.81
Fairfield - Dutton Park 1.79 1.83 1.87 1.91 1.95 1.99
Fig Tree Pocket 4.28 4.34 4.41 4.48 4.55 4.62
Forest Lake - Doolandella 1.69 1.74 1.79 1.84 1.90 1.95
Fortitude Valley 1.69 1.72 1.76 1.79 1.83 1.86
Geebung 1.85 1.88 1.91 1.94 1.98 2.01
Grange 1.63 1.66 1.70 1.73 1.76 1.80
Greenslopes 1.74 1.78 1.82 1.86 1.90 1.94
Hamilton (Qld) 1.59 1.62 1.65 1.69 1.72 1.75
Hawthorne 1.86 1.90 1.93 1.97 2.01 2.05
Hendra 1.84 1.88 1.91 1.95 1.99 2.03
Highgate Hill 1.82 1.86 1.89 1.93 1.97 2.01
Holland Park 1.60 1.64 1.67 1.71 1.75 1.79
Holland Park West 1.81 1.85 1.89 1.94 1.98 2.02
Inala - Richlands 2.37 2.44 2.51 2.59 2.66 2.74
Indooroopilly 2.19 2.22 2.26 2.30 2.33 2.37
Ipswich - North 2.91 3.00 3.08 3.17 3.27 3.36
Jindalee - Mount Ommaney 1.91 1.94 1.97 2.00 2.03 2.07
Kangaroo Point 1.68 1.71 1.75 1.78 1.82 1.85
Karana Downs 1.58 1.62 1.67 1.72 1.77 1.82
Kedron - Gordon Park 1.62 1.65 1.67 1.70 1.73 1.76
Kelvin Grove - Herston 2.01 2.05 2.09 2.14 2.18 2.22
Kenmore 2.68 2.72 2.76 2.80 2.85 2.89
LGIP Planning Assumptions Extrinsic Material Page 46

Statistical Area 2 (SA2) ASGS 2011 2011 2016 2021 2026 2031 2036
Keperra 1.43 1.45 1.47 1.49 1.52 1.54
Kuraby 2.45 2.51 2.56 2.62 2.68 2.74
Lake Manchester - England Creek 1.60 1.65 1.69 1.74 1.79 1.85
Macgregor (Qld) 2.31 2.36 2.41 2.46 2.52 2.57
Manly - Lota 1.45 1.46 1.46 1.47 1.47 1.48
Manly West 1.97 1.97 1.98 1.99 2.00 2.00
Mansfield (Qld) 2.04 2.08 2.13 2.17 2.22 2.27
McDowall 1.99 2.02 2.05 2.09 2.12 2.16
Middle Park - Jamboree Heights 1.76 1.79 1.81 1.84 1.87 1.90
Mitchelton 1.64 1.66 1.69 1.71 1.74 1.77
Moorooka 1.74 1.78 1.82 1.86 1.90 1.94
Morningside - Seven Hills 1.85 1.89 1.92 1.96 2.00 2.04
Mount Coot-tha 1.65 1.67 1.70 1.73 1.75 1.78
Mount Gravatt 1.78 1.82 1.86 1.90 1.95 1.99
Murarrie 2.58 2.59 2.60 2.61 2.62 2.63
New Farm 1.65 1.68 1.71 1.74 1.78 1.81
Newmarket 1.69 1.72 1.76 1.79 1.83 1.86
Newstead - Bowen Hills 1.76 1.79 1.82 1.86 1.90 1.93
Norman Park 1.73 1.76 1.80 1.83 1.87 1.90
Northgate - Virginia 1.85 1.88 1.91 1.94 1.97 2.00
Nudgee - Banyo 1.92 1.96 1.99 2.02 2.05 2.09
Nundah 1.69 1.72 1.75 1.78 1.81 1.84
Oxley (Qld) 2.10 2.16 2.22 2.29 2.35 2.42
Paddington - Milton 1.73 1.77 1.80 1.84 1.87 1.91
Pallara - Willawong 2.27 2.32 2.37 2.43 2.48 2.53
Parkinson - Drewvale 1.92 1.96 2.00 2.05 2.09 2.14
Pinjarra Hills - Pullenvale 1.15 1.17 1.19 1.20 1.22 1.24
Red Hill (Qld) 1.70 1.73 1.76 1.80 1.83 1.87
Redland Islands 0.66 1.00 1.00 1.00 1.00 1.00
Riverhills 1.86 1.88 1.91 1.94 1.97 2.00
LGIP Planning Assumptions Extrinsic Material Page 47

Statistical Area 2 (SA2) ASGS 2011 2011 2016 2021 2026 2031 2036
Robertson 1.95 1.99 2.04 2.08 2.13 2.17
Rochedale - Burbank 3.16 3.23 3.30 3.38 3.45 3.53
Rocklea - Acacia Ridge 2.10 2.15 2.19 2.24 2.29 2.34
Runcorn 2.63 2.77 2.83 2.89 2.96 3.02
Salisbury - Nathan 1.50 1.53 1.57 1.60 1.64 1.67
Sandgate - Shorncliffe 1.34 1.36 1.38 1.40 1.43 1.45
Seventeen Mile Rocks - Sinnamon Park 2.02 2.05 2.08 2.12 2.15 2.18
Sherwood 1.70 1.73 1.76 1.78 1.81 1.84
South Brisbane 1.85 1.88 1.92 1.96 2.00 2.04
Spring Hill 1.82 1.85 1.89 1.93 1.96 2.00
St Lucia 2.06 2.09 2.13 2.16 2.19 2.23
Stafford 1.49 1.52 1.54 1.57 1.59 1.62
Stafford Heights 1.65 1.68 1.71 1.74 1.76 1.79
Sunnybank 2.25 2.30 2.35 2.40 2.45 2.51
Sunnybank Hills 2.35 2.48 2.53 2.59 2.64 2.70
Taigum - Fitzgibbon 1.84 1.87 1.90 1.94 1.97 2.00
Taringa 1.85 1.88 1.91 1.94 1.97 2.00
Tarragindi 1.65 1.69 1.73 1.77 1.80 1.84
The Gap 1.82 1.85 1.88 1.91 1.94 1.97
Tingalpa 2.06 2.07 2.08 2.08 2.09 2.10
Toowong 1.95 1.99 2.02 2.06 2.10 2.15
Upper Kedron - Ferny Grove 1.79 1.82 1.85 1.87 1.90 1.93
Upper Mount Gravatt 2.10 2.15 2.20 2.25 2.30 2.35
Wacol 2.51 2.58 2.66 2.74 2.82 2.90
Wakerley 2.30 2.31 2.32 2.32 2.33 2.34
Wavell Heights 1.76 1.79 1.82 1.85 1.88 1.91
West End 1.71 1.75 1.78 1.81 1.85 1.89
Westlake 1.89 1.92 1.95 1.98 2.01 2.04
Wilston 1.82 1.85 1.89 1.93 1.96 2.00
Windsor 1.60 1.63 1.67 1.70 1.73 1.76
LGIP Planning Assumptions Extrinsic Material Page 48

Statistical Area 2 (SA2) ASGS 2011 2011 2016 2021 2026 2031 2036
Wishart 2.03 2.07 2.12 2.17 2.21 2.26
Woolloongabba 1.86 1.90 1.94 1.98 2.03 2.07
Wooloowin - Lutwyche 1.65 1.68 1.72 1.75 1.78 1.82
Wynnum 1.44 1.45 1.45 1.46 1.47 1.47
Wynnum West - Hemmant 1.91 1.91 1.92 1.93 1.93 1.94
Yeronga 1.76 1.80 1.84 1.88 1.92 1.96
Zillmere 1.79 1.82 1.85 1.88 1.91 1.95
Source: Queensland Treasury, Population and dwelling projections, 2015 Edition.
Table Note:
(1) Excludes occupancy rates for non-private dwellings and their residents, as well as caravans, houseboats and temporary residences.
LGIP Planning Assumptions Extrinsic Material Page 49
8.4 Appendix D: Land use groupings for existing level of development (June 2014)
Table 8.4.1—Land use groupings (June 2014)
Residential
Residential Attached
Residential Semi-detached
Residential Detached
Residential Welfare
Non – Residential
Retail
Accommodation and Food Services and Arts and Recreation
Showroom, Retail Warehouse, Bulky Goods
Office
Industry – light
Industry – general
Industry – heavy
Industry – other
Warehouses, Bulk Stores, Logistics
Community - Health
Community – Education
Community - Other
Rural Activities
Vacant Land
Open Space
All Other
LGIP Planning Assumptions Extrinsic Material Page 50

8.5 Appendix E: Land use and yield assumptions for potential non-residential development
For all non-residential related zones and precincts in the planning scheme, the following land use and yield assumptions have been used in the non-residential ultimate calculator for all relevant lots within the Brisbane’s local government area.
Table 8.5.1—Non-residential land use and yield provisionsZone Code Multiple
dwelling(planned density, dwg/ha)
Dwelling house
(planned density, dwg/ha)
Retail(planned
plot ratio)
Commercial(planned
plot ratio)
Industry(planned
plot ratio)
Community(planned
plot ratio)
Other(planned
plot ratio)
Total(planned
plot ratio)
CF1 - Major health care 0 0 0 0 0 2.5 0 2.5
CF2 - Major sports venue 0 0 0 0 0 0.3 0 0.3
CF3 - Cemetery 0 0 0 0 0 0.01 0 0.01
CF4 - Community purpose 0 0 0 0 0 1 0 1
CF5 - Education purpose 0 0 0 0 0 0.75 0 0.75
CF6 - Emergency services 0 0 0 0 0 1 0 1
CF7 - Health care purposes 0 0 0 0 0 1 0 1
CN - Conservation 0 0 0 0 0 0 0 0
CN1 - Local 0 0 0 0 0 0 0 0
CN2 - District 0 0 0 0 0 0 0 0
CN3 - Metropolitan 0 0 0 0 0 0 0 0
CR1 - Character 0 20 0 0 0 0 0 0.5
CR2 - Infill housing 13.5 11.8 0 0 0 0 0 0.44
DC1 - District 12.5 0 0.875 0.25 0 0 0 1.25
DC2 - Corridor 7.5 0 1.26 0.165 0 0 0 1.5
EC - Emerging community 4.6 14.2 0 0 0 0 0 0.41
EI - Extractive industry 0 0 0 0 0.004 0 0 0.004
EM - Environmental management 0 0 0 0 0 0 0 0
HDR1 - High density residential (Up to 8 storeys) 306 0 0 0 0 0 0 2.4
HDR2 - High density residential (Up to 15 storeys) 408 0 0 0 0 0 0 3.3
II - Industry investigation 0 0 0 0 0.5 0 0 0.5
IN1 - General industry A 0 0 0.025 0.025 0.45 0 0 0.5
IN2 - General industry B 0 0 0 0 0.5 0 0 0.5
IN3 - General industry C 0 0 0 0 0.5 0 0 0.5
LDR - Low density residential 0.8 15.2 0 0 0 0 0 0.39
LII - Low impact industry 0 0 0.025 0.025 0.45 0 0 0.5
LMR1 - Low-medium density residential (2 storey mix) 45.8 7.8 0 0 0 0 0 0.7
LMR2 - Low-medium density residential (2 or 3 storey mix) 45.8 9.4 0 0 0 0 0 0.75
LMR3 - Low-medium density residential (Up to 3 storeys) 86.5 2.2 0 0 0 0 0 0.95
MC - Major centre 7.75 0 0.975 0.435 0 0.015 0 1.5
MDR - Medium density residential 180 0 0 0 0 0 0 1.44
MU1 - Inner city 38 0 0.6 0.6 0 0 0 1.5
MU2 - Centre frame 75 0 0.3 0.3 0 0 0 1.2
MU3 - Corridor 15.1 0 0.54 0.54 0 0 0 1.2
NC - Neighbourhood centre 6.3 0 0.447 0.084 0 0.006 0 0.6
LGIP Planning Assumptions Extrinsic Material Page 51

Zone Code Multiple dwelling(planned density, dwg/ha)
Dwelling house
(planned density, dwg/ha)
Retail(planned
plot ratio)
Commercial(planned
plot ratio)
Industry(planned
plot ratio)
Community(planned
plot ratio)
Other(planned
plot ratio)
Total(planned
plot ratio)
OS - Open space 0 0 0 0 0 0 0 0
OS1 - Open space (Local) 0 0 0 0 0 0 0 0
OS2 - Open space (District) 0 0 0 0 0 0 0 0
OS3 - Open space (Metropolitan) 0 0 0 0 0 0 0 0
PC1 - Principal centre (City centre) 325 0 2.6 7.15 0 0.65 0 13
PDA 0 0 0 0 0 0 0 0
RR - Rural residential 0 3 0 0 0 0 0 0.08
RU - Rural 0 0.1 0 0 0 0 0 0.003
SBCA 0 0 0 0 0 0 0 0
SC1 - Specialised centre (Major education and research facility) 0 0 0 0 0 2 0 2
SC2 - Specialised centre (Entertainment and conference centre) 0 0 0 0 0 0.6 0 0.6
SC3 - Specialised centre (Brisbane Markets) 0 0 0 0 0.6 0 0 0.6
SC4 - Specialised centre (Large format retail) 0 0 0.6 0 0 0 0 0.6
SC5 - Specialised centre (Mixed industry and business) 0 0 0 0.18 0.42 0 0 0.6
SC6 - Specialised centre (Marina) 0 0 0.004 0.003 0.003 0 0 0.01
SI - Special industry 0 0 0 0 0.1 0 0 0.1
SP1 - Special purpose (Defence) 0 0 0 0 0.15 0.25 0 0.4
SP2 - Special purpose (Detention facility) 0 0 0 0.16 0 0 0 0.16
SP3 - Special purpose (Transport infrastructure) 0 0 0 0 0.1 0 0 0.1
SP4 - Special purpose (Utility services) 0 0 0 0 0.12 0 0.12 0.24
SP5 - Special purpose (Airport) 0 0 0.00435 0.0015 0.024 0.00015 0 0.03
SP6 - Special purpose (Port) 0 0 0 0.005 0.045 0 0 0.05
SR - Sport and recreation 0 0 0 0 0 0 0 0
SR1 - Sport and recreation (Local) 0 0 0 0 0 0 0 0
SR2 - Sport and recreation (District) 0 0 0 0 0 0 0 0
SR3 - Sport and recreation (Metropolitan) 0 0 0 0 0 0 0 0
T - Township 0 16 0 0 0 0 0 0.4
TA - Tourist accommodation 0 0 0.08 0.01 0 0.01 0 0.1
LGIP Planning Assumptions Extrinsic Material Page 52

8.6 Appendix F: Demand Conversion rates
Table 8.6.1—Demand conversion rates for the transport network (roads)
Desired Standards of Service (DSS) Area
Type of development Desired rate of provision per unit of Demand (vehicle trips per day /dwelling or GFA)
ET Conversion Rate
Brisbane LGA Dwelling house/lot 6.50 1.00000
Brisbane LGA Multi-unit dwelling 4.20 0.64615
Brisbane LGA Non-private/other 2.00 0.30769
Brisbane LGA Retail 0.40 0.06154
Brisbane LGA Commercial 0.16 0.02462
Brisbane LGA Industrial 0.05 0.00769
Brisbane LGA Community purpose 0.15 0.02308
Brisbane LGA Other 0 0
Table 8.6.2—Demand conversion rates for the transport network (pathway)
Desired Standards of Service (DSS) Area
Type of development Desired rate of provision per unit of Demand (person trips per day/dwelling or GFA)
ET Conversion Rate
Citywide Dwelling house/lot 2.30000 1.00000
Citywide Multi-unit dwelling 1.48615 0.64615
Citywide Non-private/other 0.70769 0.30769
Citywide Retail 0.14154 0.06154
Citywide Commercial 0.05662 0.02462
Citywide Industrial 0.01769 0.00769
Citywide Community purpose 0.05308 0.02308
Citywide Other 0 0
LGIP Planning Assumptions Extrinsic Material Page 53

Table 8.6.3—Demand conversion rates for the transport network (ferry terminals)
Desired Standards of Service (DSS) Area
Type of development Desired rate of provision per unit of Demand (person trips per day/dwelling or GFA)
ET Conversion Rate
Citywide Dwelling house/lot 0.07101 1
Citywide Multi-unit dwelling 0.04590 0.64615
Citywide Non-private/other 0.02180 0.30769
Citywide Retail 0.00440 0.06154
Citywide Commercial 0.00170 0.02462
Citywide Industrial 0.00050 0.00769
Citywide Community purpose 0.00160 0.02308
Citywide Other 0 0
Table 8.6.4—Demand conversion rates for the public parks network
Desired Standards of Service (DSS) Area
Type of development
Desired rate of provision per unit of demand (m2 park/dwelling or GFA)
ET Conversion Rate
Inside local recreation need area Dwelling house/lot 117.76800 1.00000
Inside local recreation need area Multi-unit dwelling 75.70800 0.64286
Inside local recreation need area Non-private/other 42.06000 0.35714
Inside local recreation need area Retail 0.06799 0.00058
Inside local recreation need area Commercial 0.15300 0.00130
Inside local recreation need area Industrial 0.02782 0.00024
Inside local recreation need area Community purpose 0 0
Inside local recreation need area Other 0 0
Outside local recreation need area Dwelling house 84.18000 0.71480
Outside local recreation need area Multi-unit dwelling 47.70200 0.40505
Outside local recreation need area Non-private/other 28.06000 0.23827
Outside local recreation need area Retail 0.04577 0.00039
Outside local recreation need area Commercial 0.10300 0.00087
Outside local recreation need area Industrial 0.01873 0.00016
Outside local recreation need area Community purpose 0 0
Outside local recreation need area Other 0 0
LGIP Planning Assumptions Extrinsic Material Page 54

Desired Standards of Service (DSS) Area
Type of development
Desired rate of provision per unit of demand (m2 park/dwelling or GFA)
ET Conversion Rate
Table 8.6.5—Demand conversion rates for the land for community facilities network
Desired Standards of Service (DSS) Area
Type of Development Desired rate of provision per unit of demand (m2/dwelling or GFA)
ET Conversion Rate
Centres Dwelling house 5.50160 0.92857
Centres Multi-unit dwelling 3.80880 0.64286
Centres Non-private/other 2.11600 0.35714
Centres Retail 0.00433 0.00073
Centres Commercial 0.01300 0.00219
Centres Industrial 0.00236 0.00040
Centres Community purpose 0 0
Centres Other 0 0
General Urban Dwelling house/lot 5.92480 1.00000
General Urban Multi-unit dwelling 3.80880 0.64286
General Urban Non-private/other 2.11600 0.35714
General Urban Retail 0.00520 0.00088
General Urban Commercial 0.01300 0.00219
General Urban Industrial 0.00236 0.00040
General Urban Community purpose 0 0
General Urban Other 0 0
Fringe Dwelling house 5.44360 0.91878
Fringe Multi-unit dwelling 2.98520 0.50385
Fringe Non-private/other 1.75600 0.29638
Fringe Retail 0.00650 0.00110
Fringe Commercial 0.01300 0.00219
Fringe Industrial 0.00236 0.00040
Fringe Community purpose 0 0
Fringe Other 0 0
LGIP Planning Assumptions Extrinsic Material Page 55

LGIP Planning Assumptions Extrinsic Material Page 56
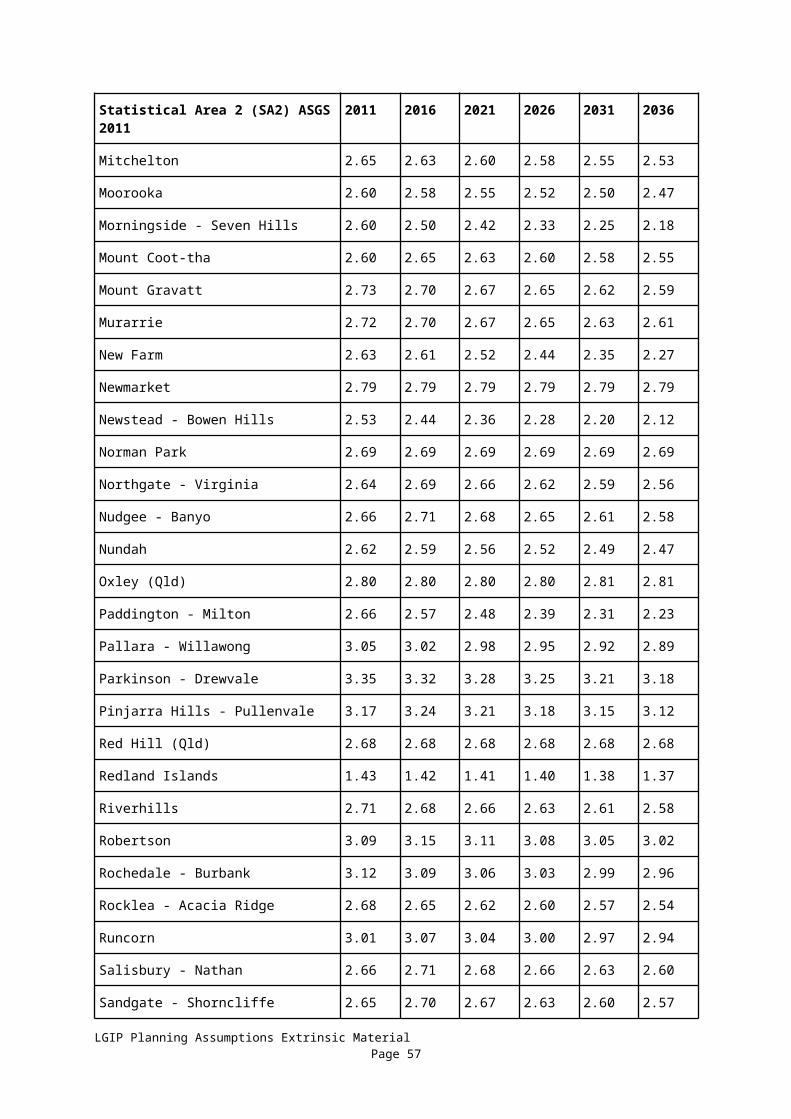
8.7 Appendix G: Demand generation tables (ETs)
Table 8.7.1—Demand generation for the transport network (roads)
Service catchment
Cumulative demand (ET)2016 (base date)
2021 2026 2031 2036 Ultimate development
1 58,220 60,732 63,689 66,589 69,959 84,4922 12,191 12,835 13,571 14,118 14,809 13,3573 65,254 67,658 72,044 77,582 85,405 127,8974 50,220 52,211 53,817 56,098 59,083 74,0115 34,670 36,629 38,651 40,805 43,113 57,2416 70,044 73,151 78,093 82,827 87,255 107,1037 91,787 97,399 102,837 108,864 114,094 125,7988 405,947 451,276 484,542 519,689 547,844 634,8689 37,837 40,716 44,758 49,018 54,226 64,69210 69,208 74,492 79,808 86,423 92,817 124,80011 37,668 39,322 40,789 41,980 43,755 52,77312 24,192 24,384 24,784 26,012 27,107 29,78513 38,017 40,938 44,295 48,932 52,934 71,70314 73,944 78,597 83,638 88,084 94,820 137,38815 86,472 90,496 95,368 100,691 107,769 136,00016 90,116 95,776 105,578 111,257 116,657 164,42117 9,613 9,789 10,224 10,461 10,781 13,149Citywide 1,255,400 1,346,401 1,436,486 1,529,430 1,622,428 2,019,478
Table 8.7.2—Demand generation for the transport network (pathway)
Service catchment
Cumulative demand (ET)2016 (base date)
2021 2026 2031 2036 Ultimate development
Citywide 1,255,847 1,346,815 1,436,783 1,529,688 1,622,553 2,017,677
Table 8.7.3—Demand generation for the transport network (ferry terminals)
Service catchment
Cumulative demand (ET)2016 (base date)
2021 2026 2031 2036 Ultimate development
Citywide 1,255,847 1,346,815 1,436,783 1,529,688 1,622,553 2,017,677
LGIP Planning Assumptions Extrinsic Material Page 57

Table 8.7.4—Demand generation (ETs) for the public parks network (inside local recreation needs area)
Service catchment
Existing and projected demand (ET)2016 (base date)
2021 2026 2031 2036 Ultimate development
East 98,487 103,466 107,396 111,287 116,659 128,980North 80,118 86,613 92,753 97,061 101,274 110,331South 116,842 123,284 128,208 135,404 142,490 154,408West 116,368 120,857 123,878 127,968 132,197 143,525
Table 8.7.5—Demand generation (ETs) for the public parks network (outside local recreation needs area)
Service catchment
Existing and projected demand (ET)2016(base date)
2021 2026 2031 2036 Ultimate development
East 2,508 2,617 3,435 3,902 4,065 4,449North 1,396 1,505 1,745 2,297 2,376 2,795South 2,333 2,508 3,265 3,863 4,327 5,054West 4,584 4,911 4,927 5,224 5,340 5,793
Table 8.7.6—Demand generation (ETs) for the land for community facilities network
Service catchment Cumulative demand (ET)2016(base date)
2021 2026 2031 2036 Ultimate development
Fringe 6,587 6,967 7,184 7,648 7,662 7,752Urban East 91,959 95,324 99,703 102,445 106,971 118,937Urban North 133,734 143,383 152,166 160,028 167,272 185,245Urban South 118,413 127,237 134,174 144,430 153,586 170,868Urban West 85,036 87,100 88,439 90,437 92,609 99,305
LGIP Planning Assumptions Extrinsic Material Page 58