Embed Size (px)
DESCRIPTION
Bringing Value to the Table Without Ending Up on the Menu. R. Allen Coffman, M.D., F.A.A.P. President TN Chapter of the AAP Highland Pediatrics, Hixson, TN Assistant Clinical Professor, UTCOM/TCTCH Chattanooga, TN. Disclosure Statement of Financial Interest. I, Allen Coffman, - PowerPoint PPT Presentation
Citation preview

Bringing Value to the Table Without Ending Up on the Menu
R. Allen Coffman, M.D., F.A.A.P.President TN Chapter of the AAPHighland Pediatrics, Hixson, TN
Assistant Clinical Professor, UTCOM/TCTCH Chattanooga, TN

Disclosure Statement of Disclosure Statement of Financial InterestFinancial Interest
• I, Allen Coffman, I, Allen Coffman,
DO NOT DO NOT have a financial have a financial interest/arrangement or affiliation with interest/arrangement or affiliation with one or more organizations that could one or more organizations that could be perceived as a real or apparent be perceived as a real or apparent
conflict of interest in the context of the conflict of interest in the context of the subject of this presentation. subject of this presentation.
Disclosure Statement of Disclosure Statement of Unapproved/Investigative UseUnapproved/Investigative Use
I, Allen Coffman, I, Allen Coffman, DO NOT DO NOT anticipate discussing the anticipate discussing the unapproved/investigative use of a unapproved/investigative use of a
commercial product/device during this commercial product/device during this activity or presentationactivity or presentation..

Disclosures
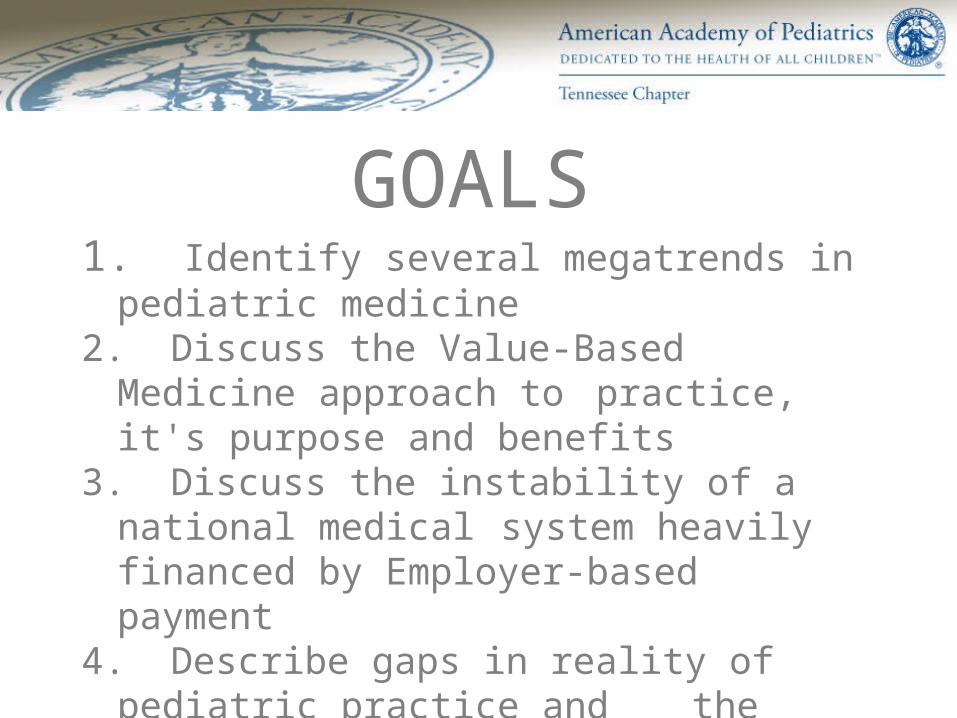
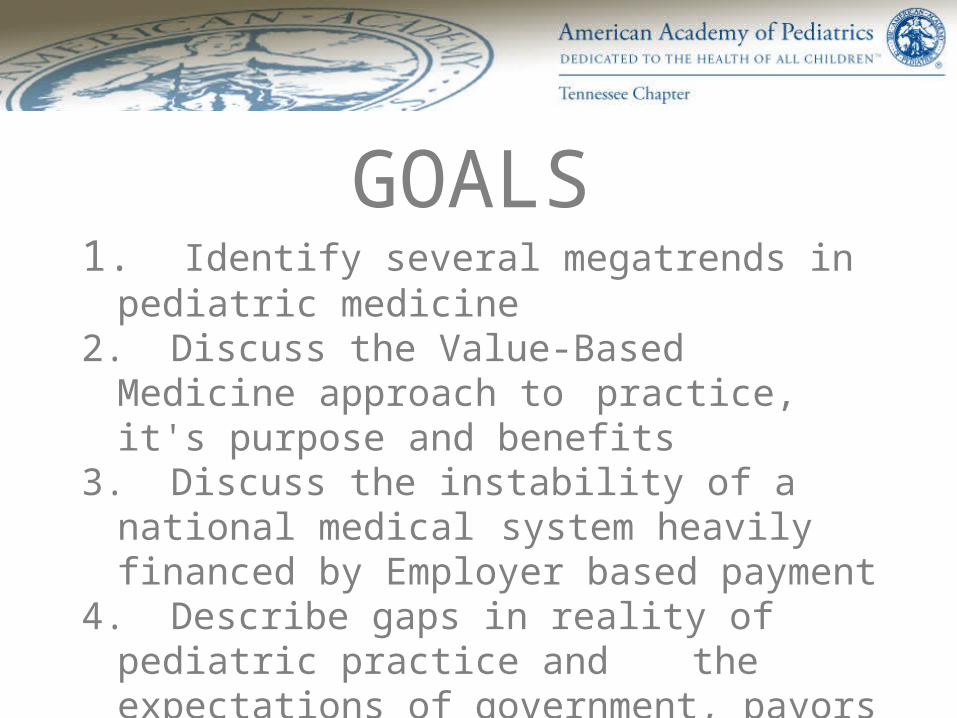
GOALS1. Identify several megatrends in
pediatric medicine2. Discuss the Value-Based Medicine
approach to practice, it's purpose and benefits
3. Discuss the instability of a national medical system heavily financed by Employer-based payment
4. Describe gaps in reality of pediatric practice and the expectations of government, payors and patients
5. Encourage you in your practice of medicine


Source: Organisation for Economic Co-operation and Development (2010), "OECD Health Data", OECD Health Statistics (database). doi: 10.1787/data-00350-en (Accessed on 14 February 2011).Notes: Data from Australia and Japan are 2007 data. Figures for Belgium, Canada, Netherlands, Norway and Switzerland, are OECD estimates. Numbers are PPP adjusted.
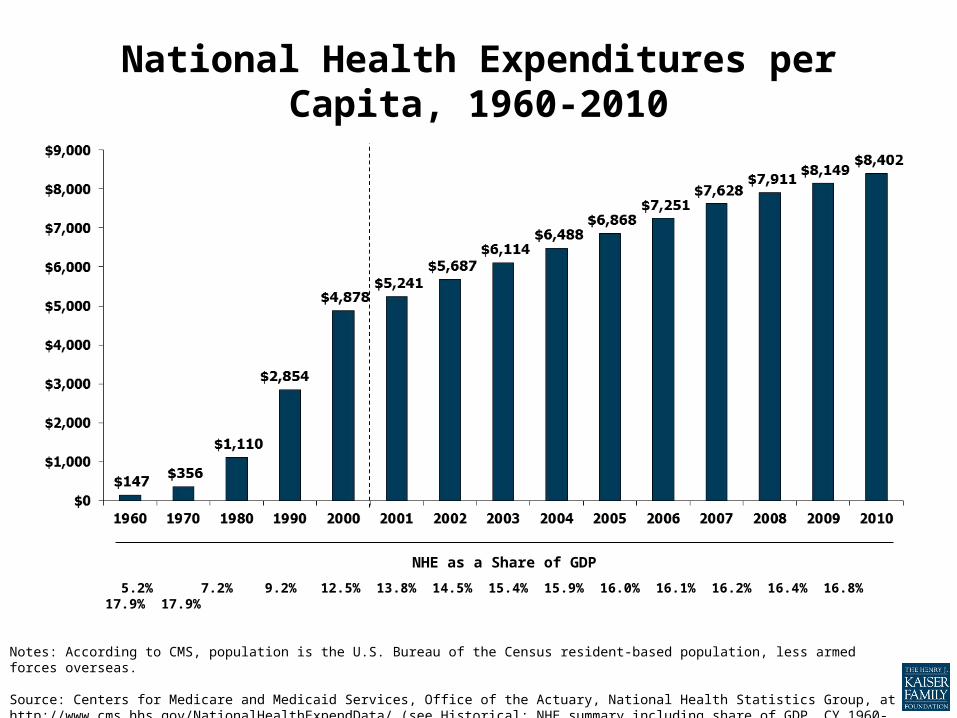
National Health Expenditures per Capita, 1960-2010
Notes: According to CMS, population is the U.S. Bureau of the Census resident-based population, less armed forces overseas.
Source: Centers for Medicare and Medicaid Services, Office of the Actuary, National Health Statistics Group, at http://www.cms.hhs.gov/NationalHealthExpendData/ (see Historical; NHE summary including share of GDP, CY 1960-2010; file nhegdp10.zip).
5.2% 7.2% 9.2% 12.5% 13.8% 14.5% 15.4% 15.9% 16.0% 16.1% 16.2% 16.4% 16.8% 17.9% 17.9%
NHE as a Share of GDP
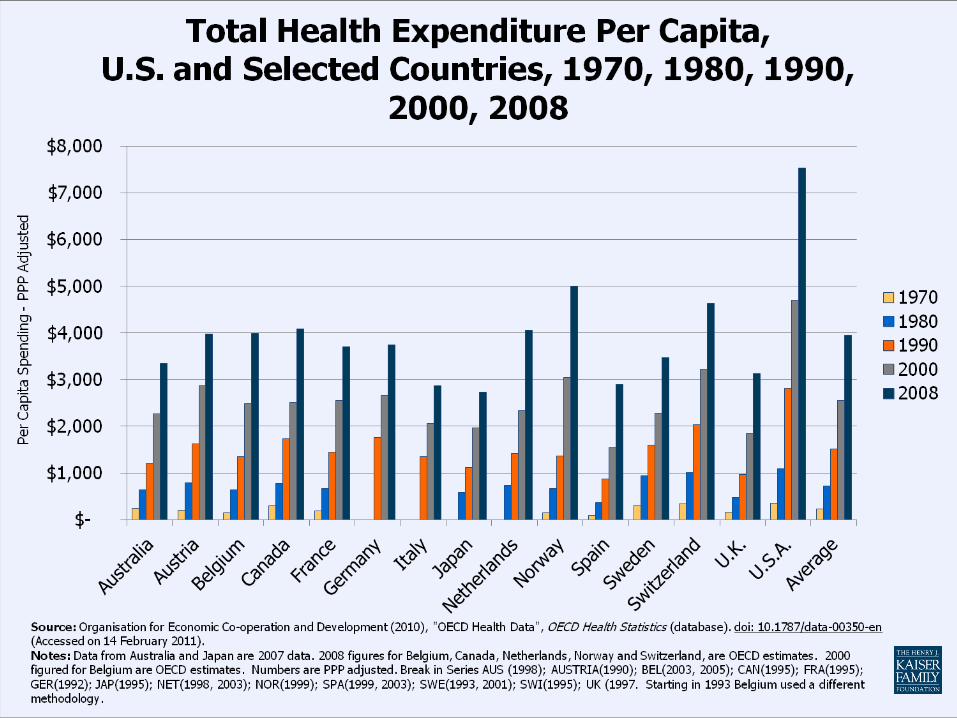
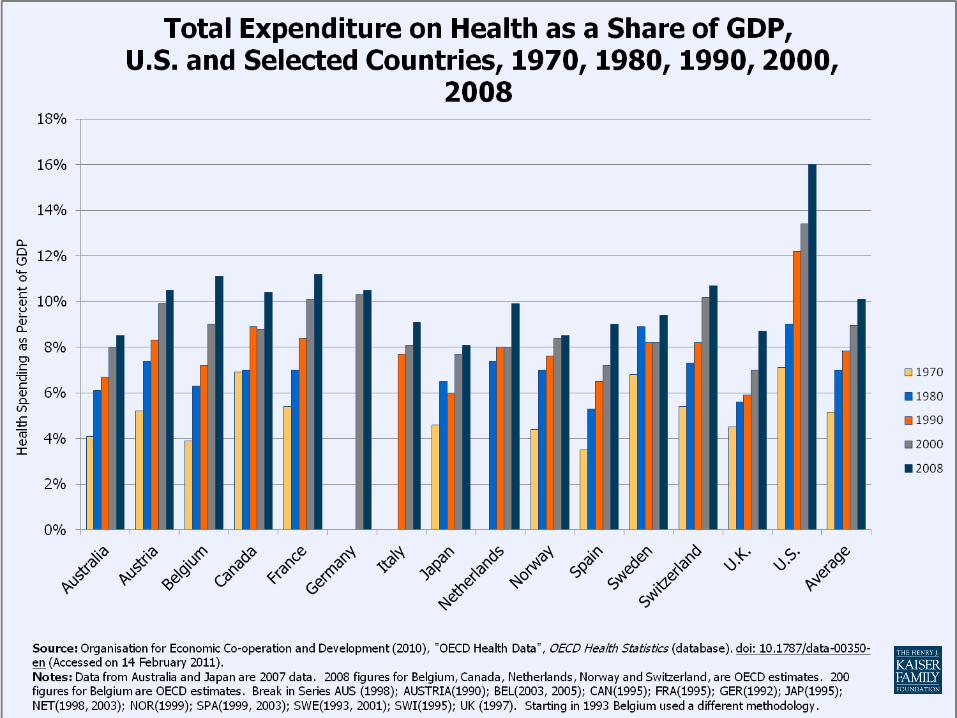
Source: Organisation for Economic Co-operation and Development (2010), "OECD Health Data", OECD Health Statistics (database). doi: 10.1787/data-00350-en (Accessed on 14 February 2011) Notes: Data from Australia and Japan are 2007 data. Figures for Belgium, Canada, Netherlands, Norway and Switzerland, are OECD estimates.

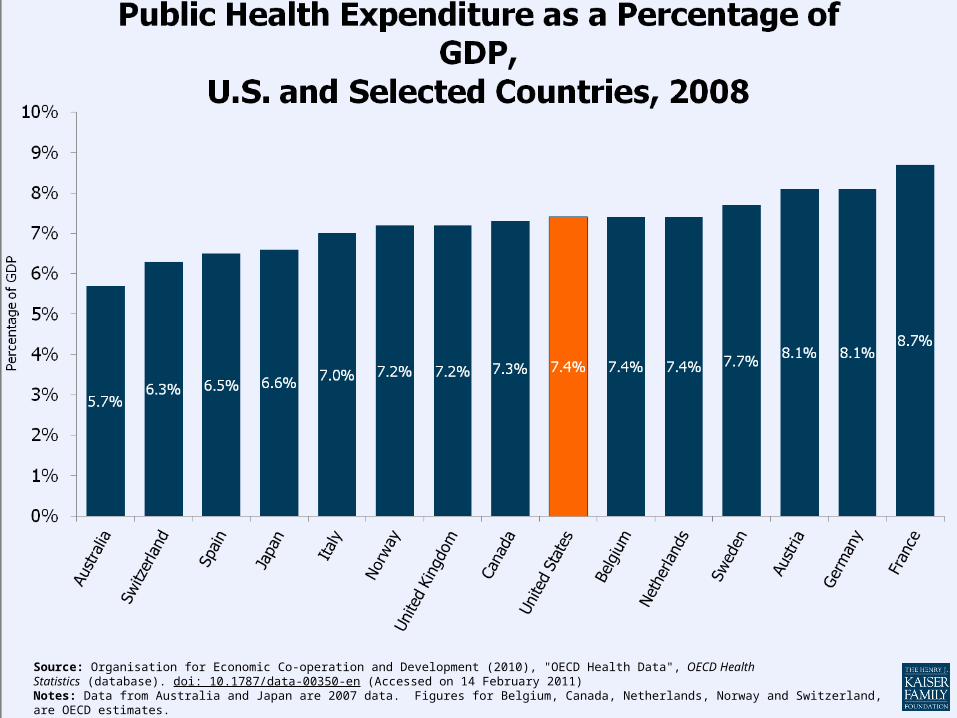
Source: Organisation for Economic Co-operation and Development (2010), "OECD Health Data", OECD Health Statistics (database). doi: 10.1787/data-00350-en (Accessed on 14 February 2011).Notes: Data from Australia and Japan are 2007 data. Figures for Canada, Norway and Switzerland, are OECD estimates. Numbers are PPP adjusted.
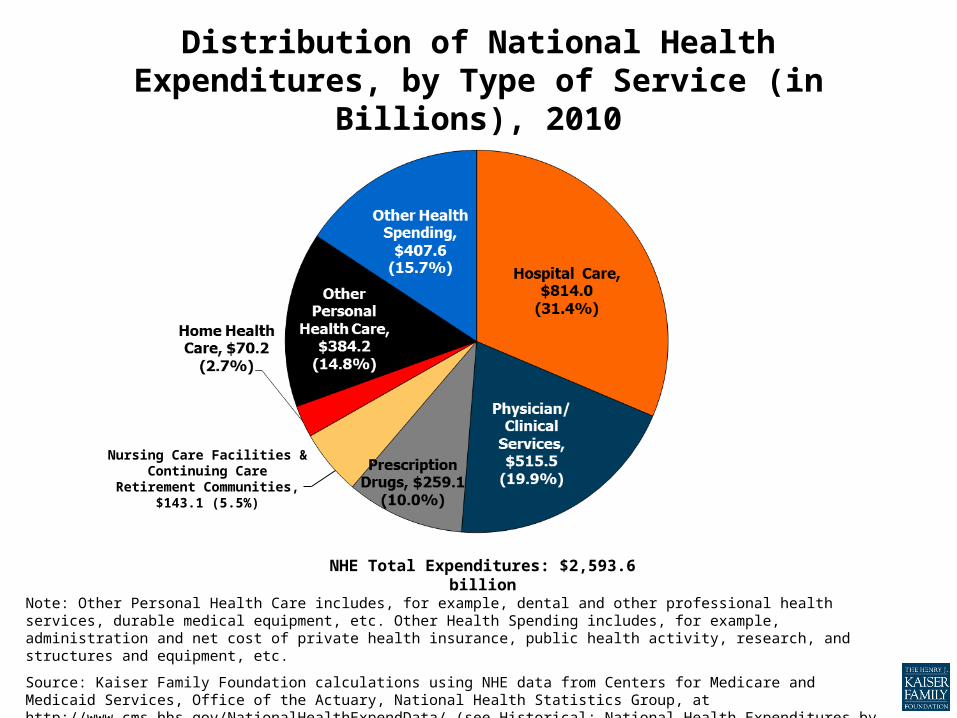
Distribution of National Health Expenditures, by Type of Service (in Billions), 2010
Note: Other Personal Health Care includes, for example, dental and other professional health services, durable medical equipment, etc. Other Health Spending includes, for example, administration and net cost of private health insurance, public health activity, research, and structures and equipment, etc.
Source: Kaiser Family Foundation calculations using NHE data from Centers for Medicare and Medicaid Services, Office of the Actuary, National Health Statistics Group, at http://www.cms.hhs.gov/NationalHealthExpendData/ (see Historical; National Health Expenditures by type of service and source of funds, CY 1960-2010; file nhe2010.zip).
NHE Total Expenditures: $2,593.6 billion
Nursing Care Facilities & Continuing Care
Retirement Communities, $143.1 (5.5%)

Cumulative Increases in Health Insurance Premiums, Workers’ Contributions to Premiums, Inflation, and Workers’ Earnings,
2000-2010
Notes: Health insurance premiums and worker contributions are for family premiums based on a family of four.
Source: Kaiser/HRET Survey of Employer-Sponsored Health Benefits, 1999-2011. Bureau of Labor Statistics, Consumer Price Index, U.S. City Average of Annual Inflation (April to April), 1999-2011. Bureau of Labor Statistics, Seasonally Adjusted Data from the Current Employment Statistics Survey, 1999-2011 (April to April).
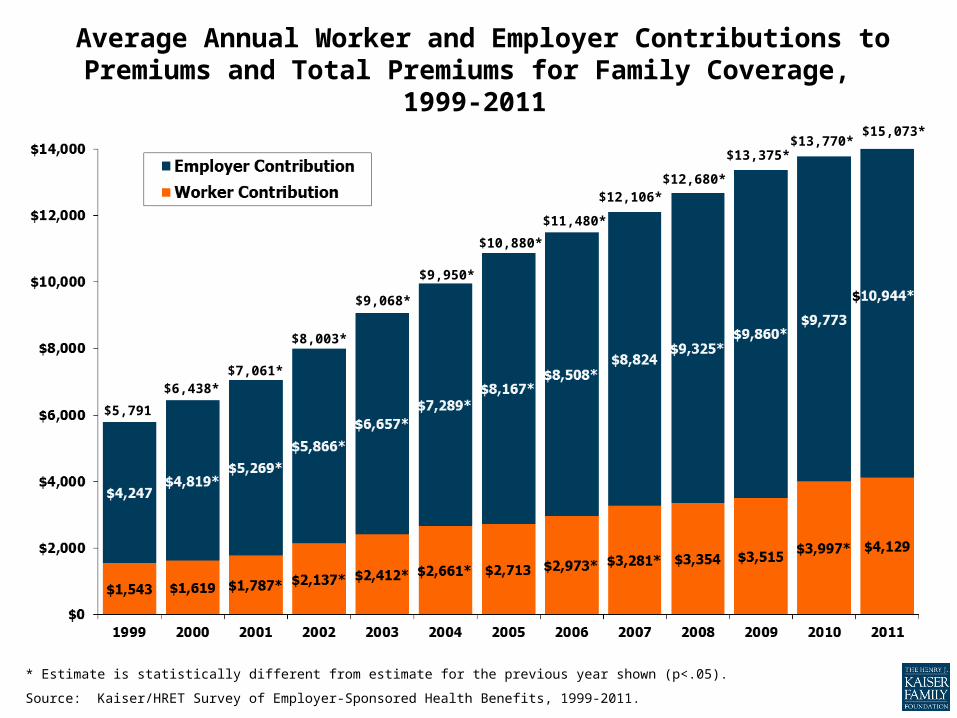
Average Annual Worker and Employer Contributions to Premiums and Total Premiums for Family Coverage,
1999-2011
* Estimate is statistically different from estimate for the previous year shown (p<.05).
Source: Kaiser/HRET Survey of Employer-Sponsored Health Benefits, 1999-2011.
$5,791
$6,438*$7,061*
$8,003*
$9,068*
$9,950*
$10,880*
$11,480*
$12,106*$12,680*
$13,375*$13,770*
$15,073*

• Value Driven Care/Variable Value Definition• Leadership/Patient Expectation Gap• Employer-Based Care• Prevention/Personal Liberty• Shift in Disease Chronicity• New Technology/EHR/HIT• Increasing Cost/Complexity of Business
Pediatric Megatrends

M T
Best Practice
M T
Best Practice
Community Standard of Care
M T
Best Practice
Community Standard of Care
What Families Value
M T

Best Practice
Community Standard of Care
What Families Value
What Payors Value
M T

Best Practice
Community Standard of Care
What Families Value
What Payors Value
Paid Services
M T
M T
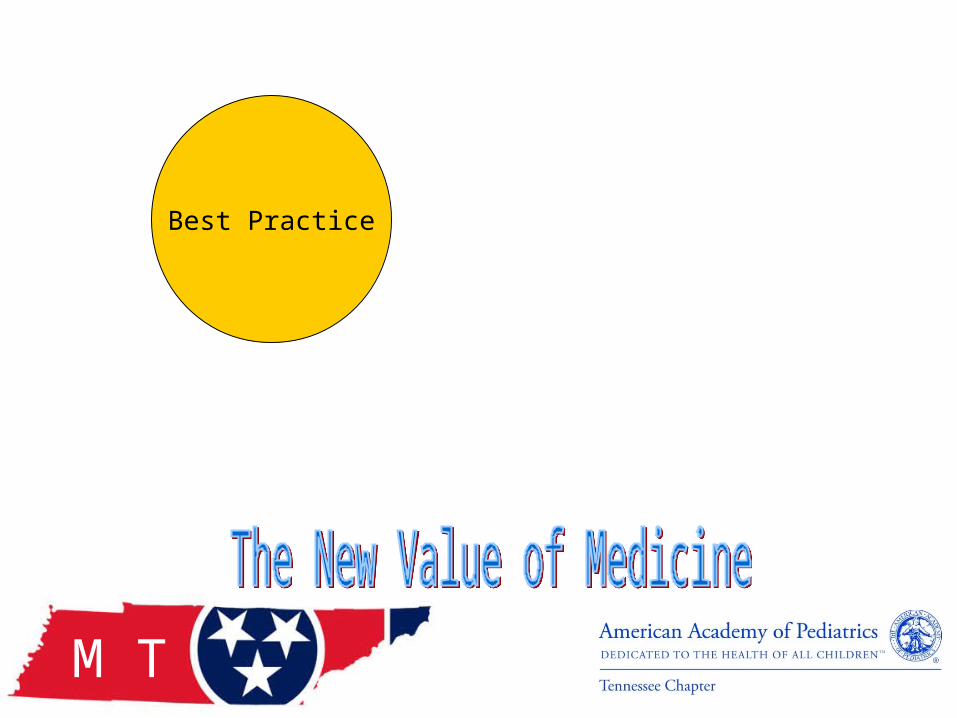
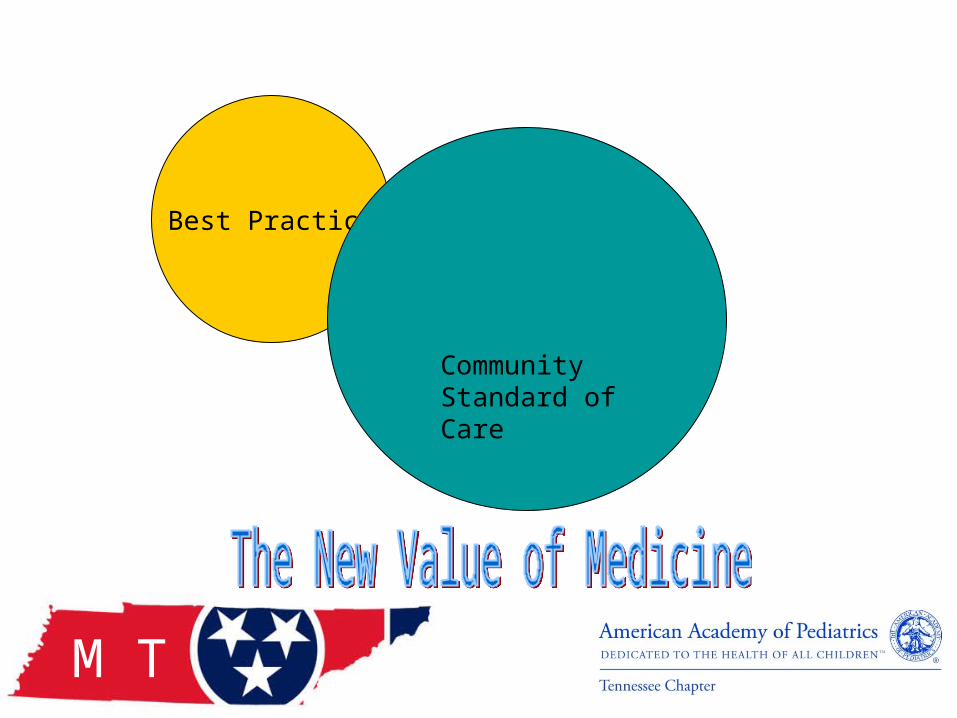
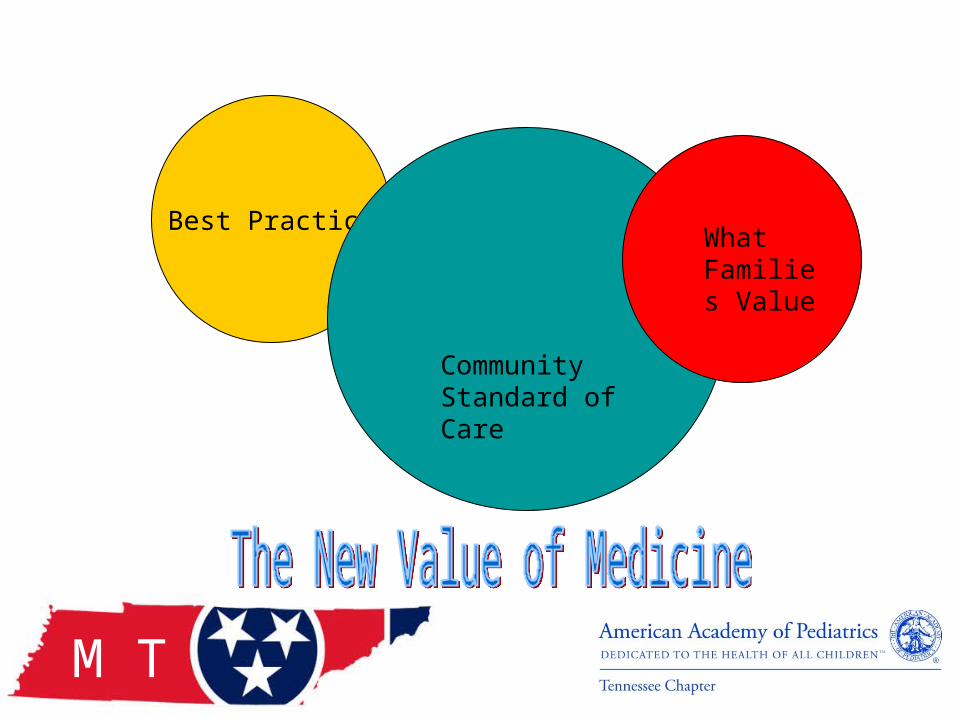
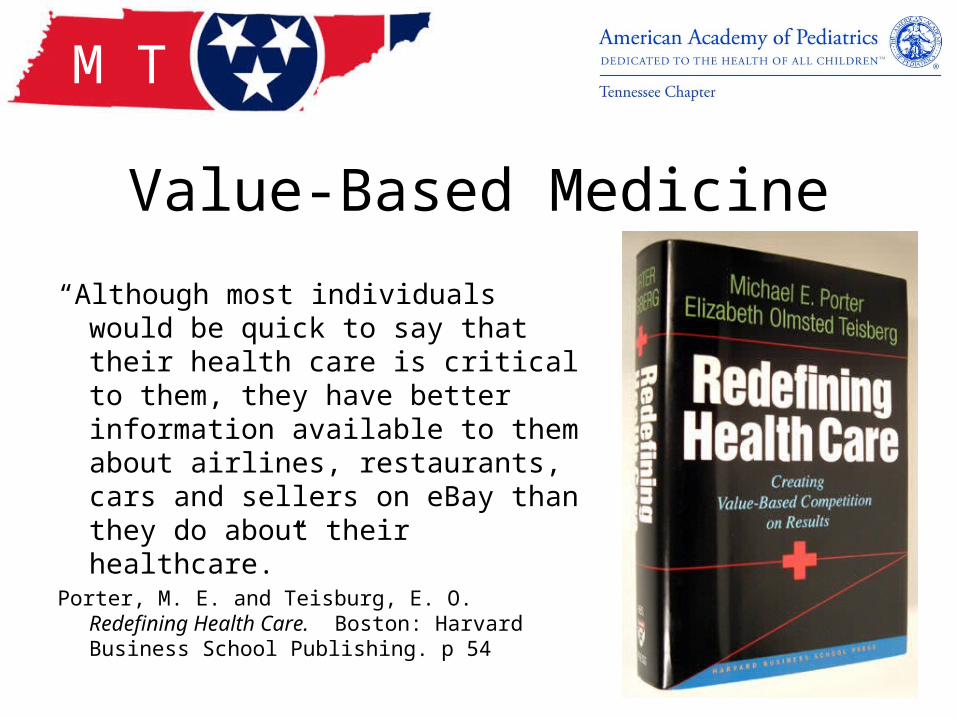
Value-Based Medicine
“Although most individuals would be quick to say that their health care is critical to them, they have better information available to them about airlines, restaurants, cars and sellers on eBay than they do about their healthcare.”
Porter, M. E. and Teisburg, E. O. Redefining Health Care. Boston: Harvard Business School Publishing. p 54
M T
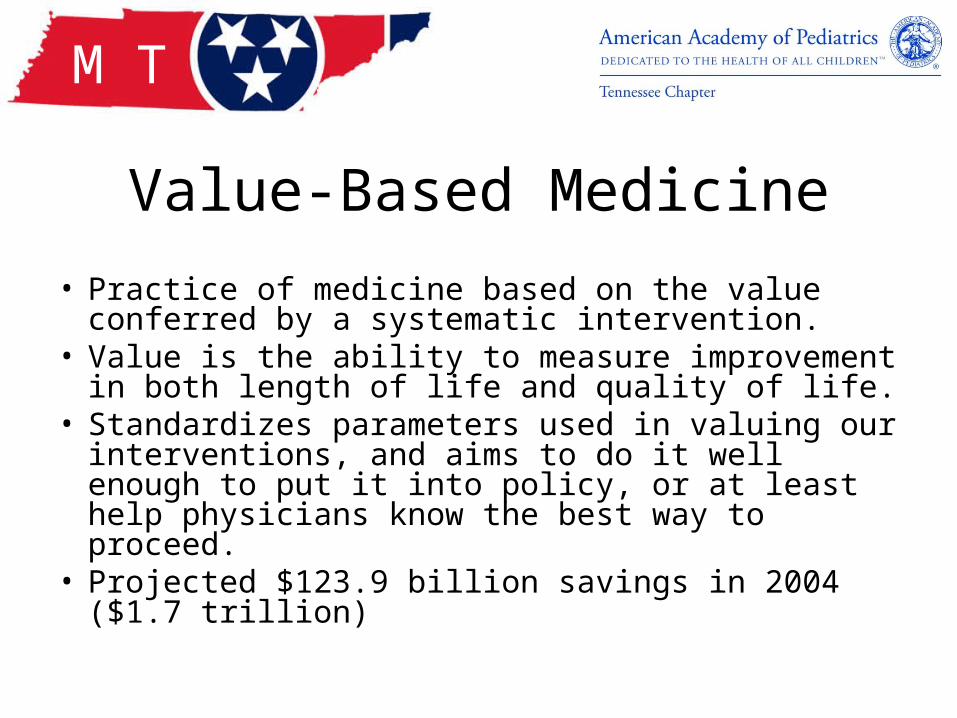
Value-Based Medicine
• Practice of medicine based on the value conferred by a systematic intervention.
• Value is the ability to measure improvement in both length of life and quality of life.
• Standardizes parameters used in valuing our interventions, and aims to do it well enough to put it into policy, or at least help physicians know the best way to proceed.
• Projected $123.9 billion savings in 2004 ($1.7 trillion)
M T
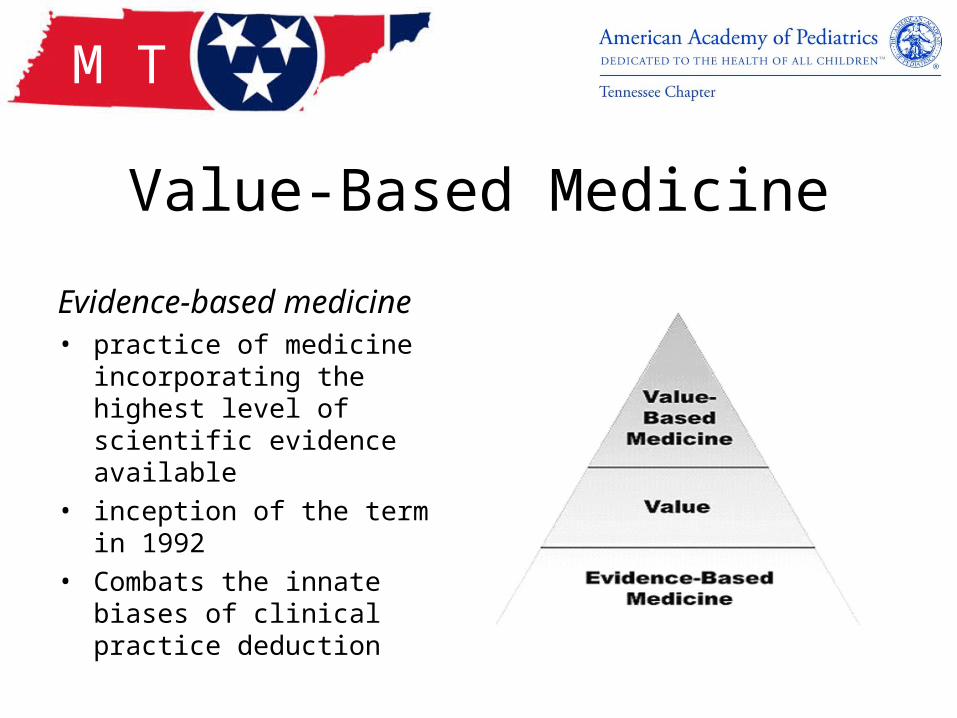
Value-Based Medicine
Evidence-based medicine • practice of medicine
incorporating the highest level of scientific evidence available
• inception of the term in 1992• Combats the innate biases of
clinical practice deduction
M T
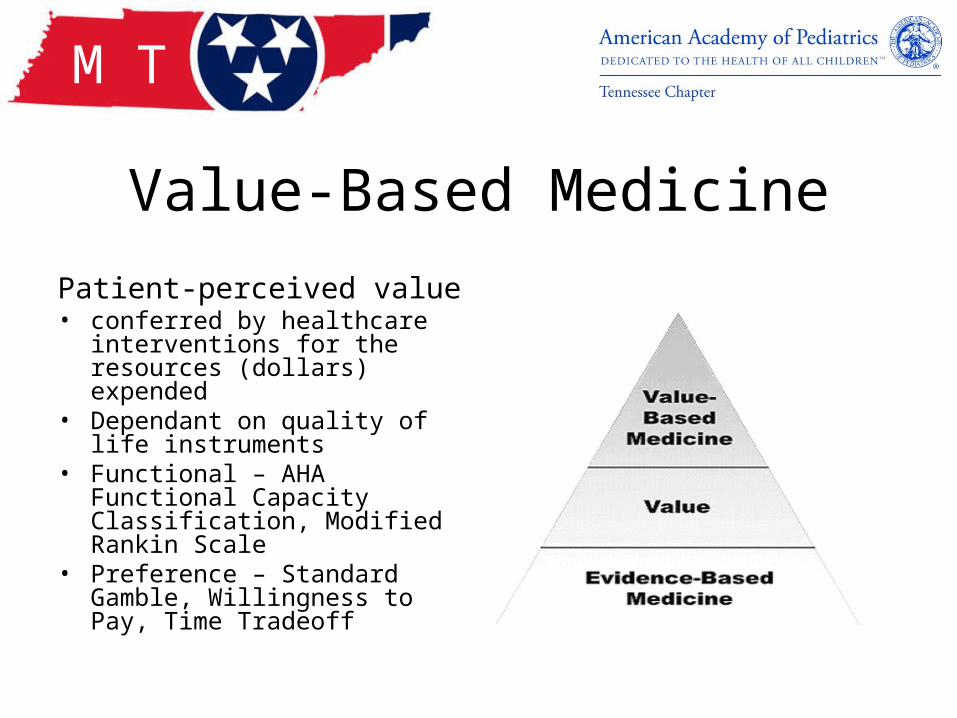
Value-Based Medicine
Patient-perceived value • conferred by healthcare
interventions for the resources (dollars) expended
• Dependant on quality of life instruments
• Functional – AHA Functional Capacity Classification, Modified Rankin Scale
• Preference – Standard Gamble, Willingness to Pay, Time Tradeoff
M T
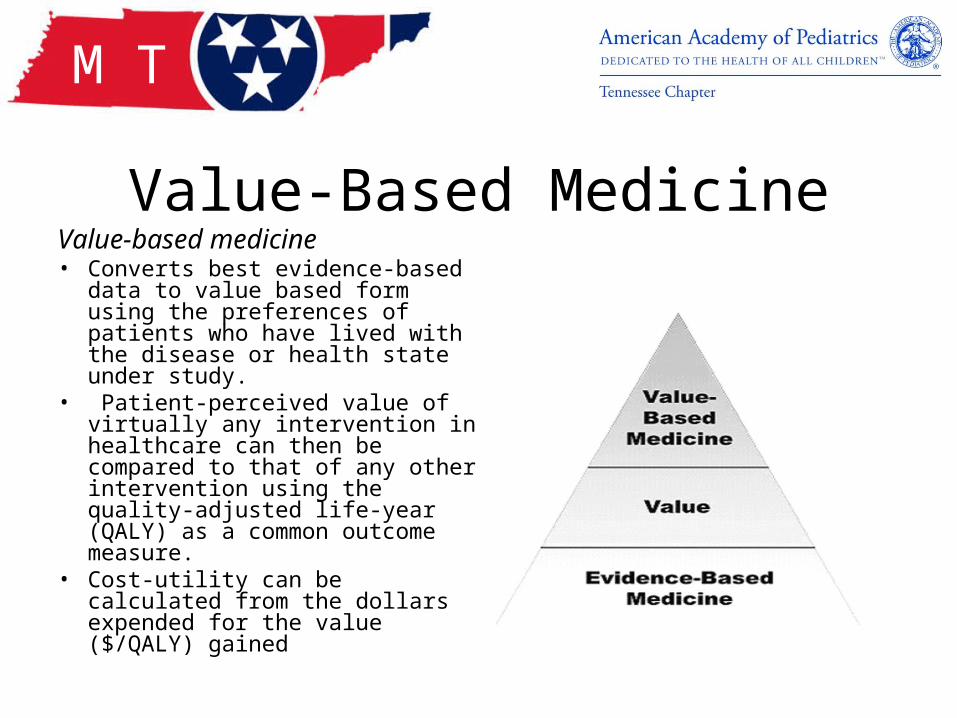
Value-Based MedicineValue-based medicine • Converts best evidence-based
data to value based form using the preferences of patients who have lived with the disease or health state under study.
• Patient-perceived value of virtually any intervention in healthcare can then be compared to that of any other intervention using the quality-adjusted life-year (QALY) as a common outcome measure.
• Cost-utility can be calculated from the dollars expended for the value ($/QALY) gained
A Value Based Medicine approach to health care delivery is important because it…
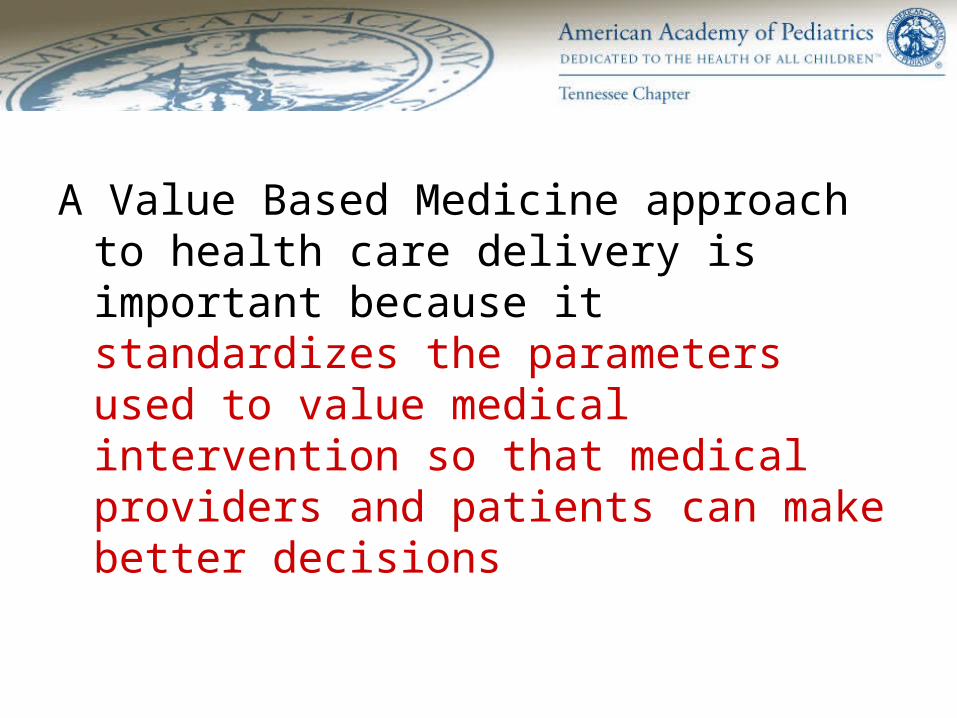
A Value Based Medicine approach to health care delivery is important because it standardizes the parameters used to value medical intervention so that medical providers and patients can make better decisions
M T
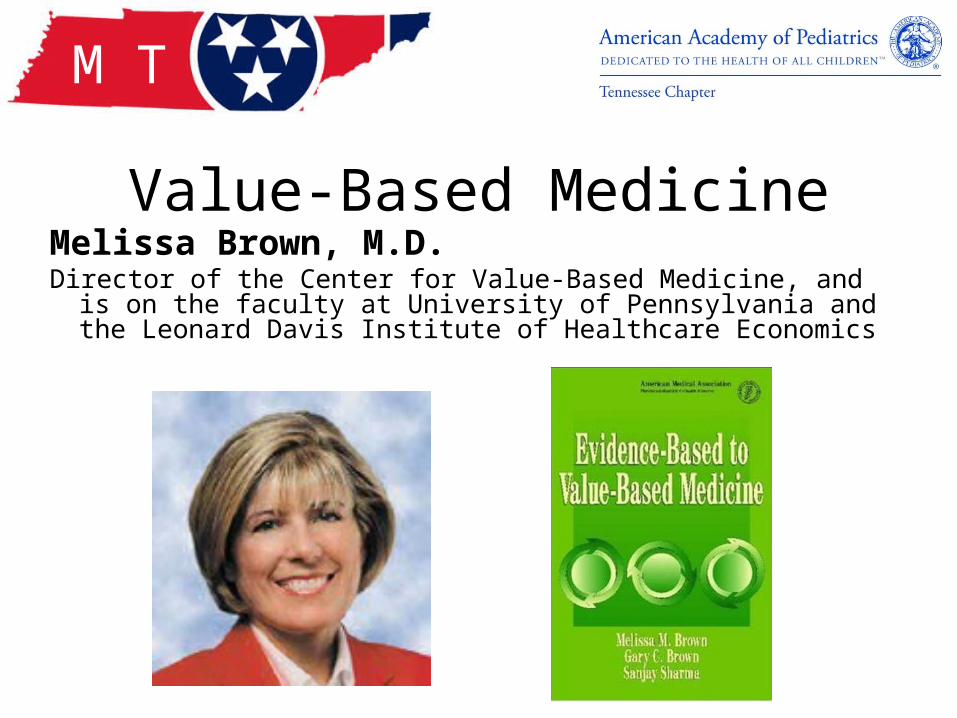
Value-Based MedicineMelissa Brown, M.D.Director of the Center for Value-Based Medicine, and is on
the faculty at University of Pennsylvania and the Leonard Davis Institute of Healthcare Economics

M T
Patient-Centered Outcomes Research Institute
• The Institute will spearhead efforts to prioritize and fund Comparative Effectiveness Research (CER)
• Establish an objective research agenda; • Develop research methodological standards; • Contract with eligible entities to conduct the research; • Ensure transparency by requesting public input; and • Disseminate the results to patients and healthcare
providers.

M T

M T
Value-Based Medicine
• Patient Care Management
• Medical Home
• Patient/Family Centered Care
• Critically Assessed Topics
• Evidence-Based Clinical Pathways
• Health-Care Quality

M T
Value-Based Medicine
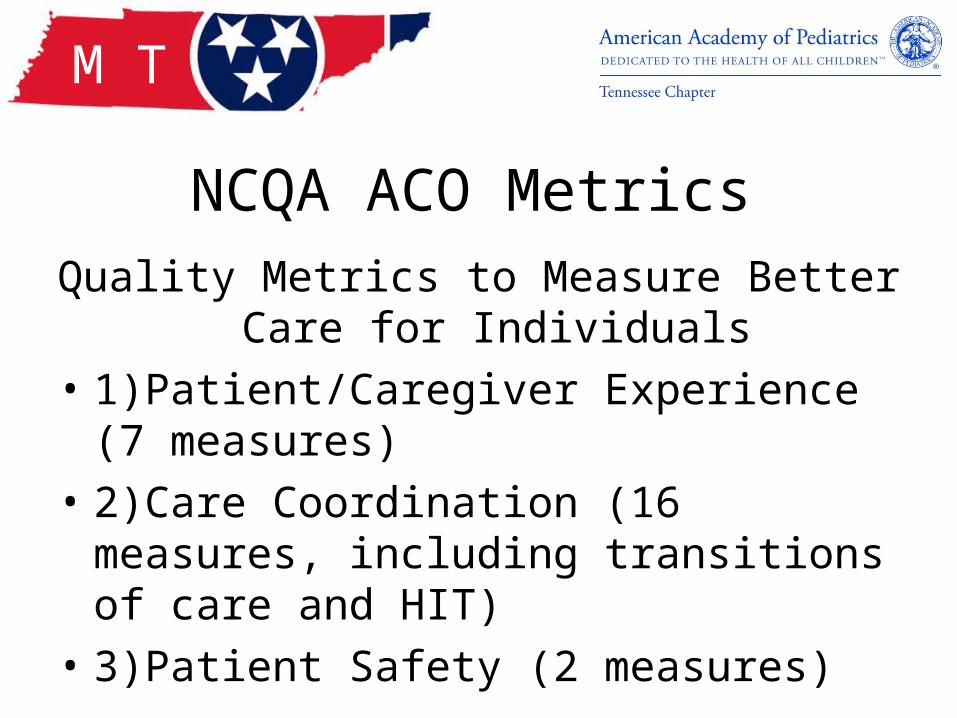
NCQA ACO MetricsQuality Metrics to Measure Better Care for
Individuals
• 1)Patient/Caregiver Experience (7 measures)
• 2)Care Coordination (16 measures, including transitions of care and HIT)
• 3)Patient Safety (2 measures)
M T
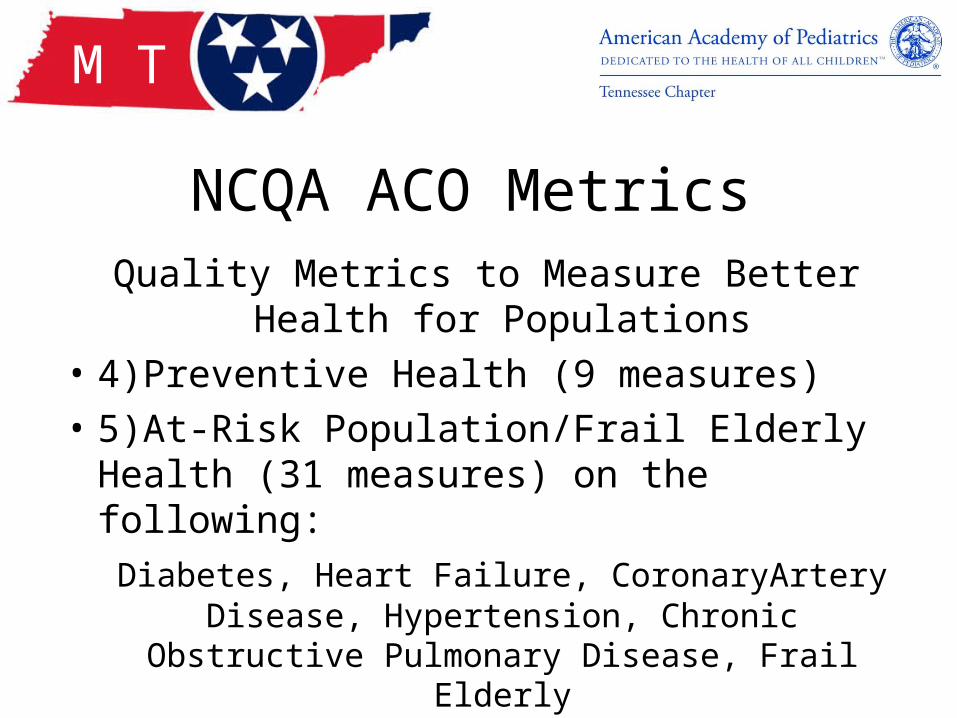
NCQA ACO MetricsQuality Metrics to Measure Better Health for
Populations
• 4)Preventive Health (9 measures)
• 5)At-Risk Population/Frail Elderly Health (31 measures) on the following:
Diabetes, Heart Failure, CoronaryArtery Disease, Hypertension, Chronic Obstructive
Pulmonary Disease, Frail Elderly
M T

M T
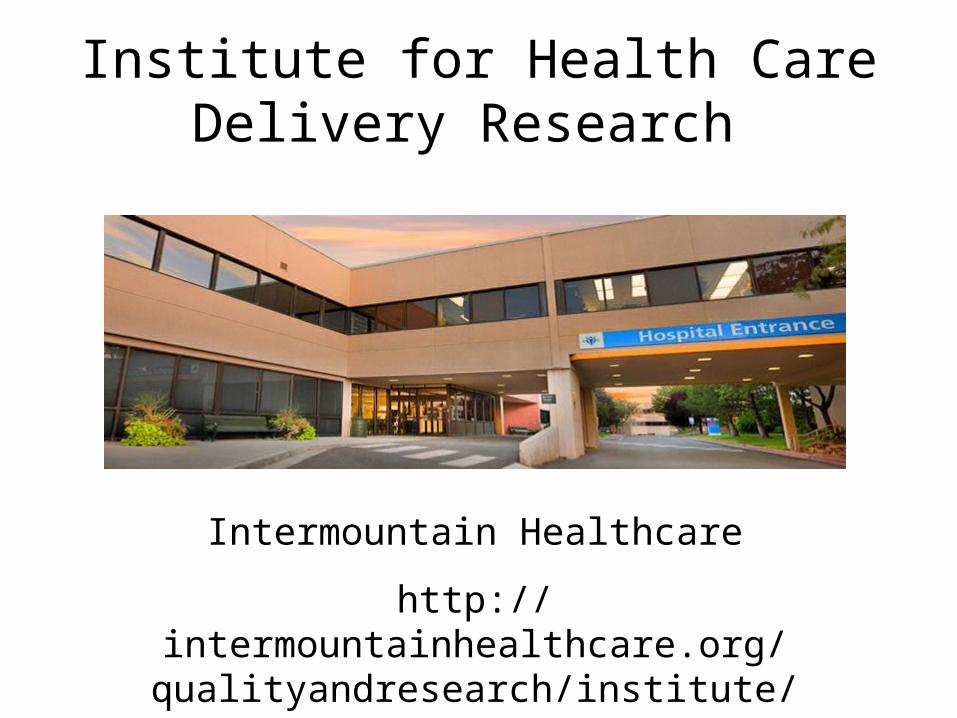
Institute for Health Care Delivery Research
Intermountain Healthcare
http://intermountainhealthcare.org/qualityandresearch/institute/Pages/
home.aspx

Intermountain Healthcare• 1995 Community Acquired Pneumonia Project (Sanpete
County, Utah)• Initial triage criteria for hospitalization, the choice of initial
antibiotics, the work flow to get antibiotics started quickly and a conversion protocol to shift inpatients to medications that could be delivered in the out-patient setting
• Cost dropped 12.3• Revenues dropped 17.5 percent because complications fell
M T
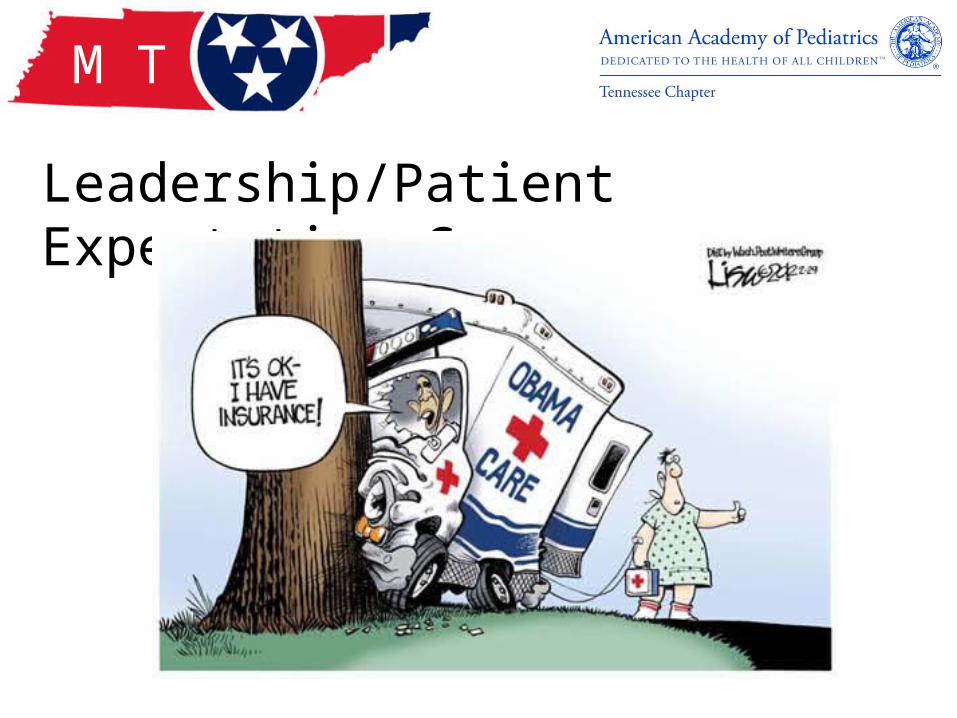
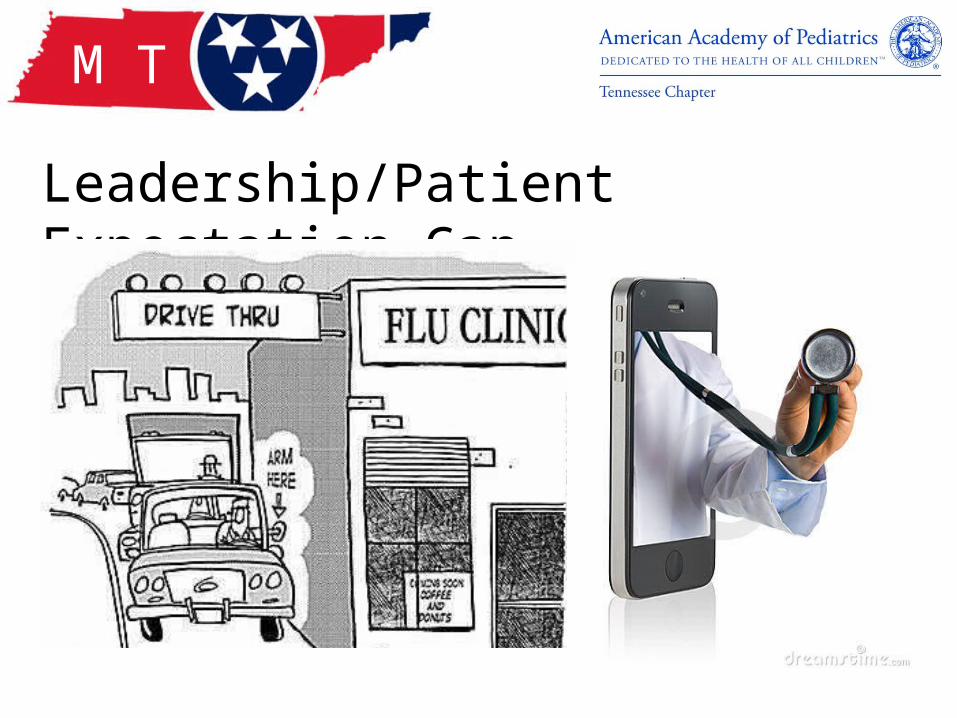
Leadership/Patient Expectation Gap
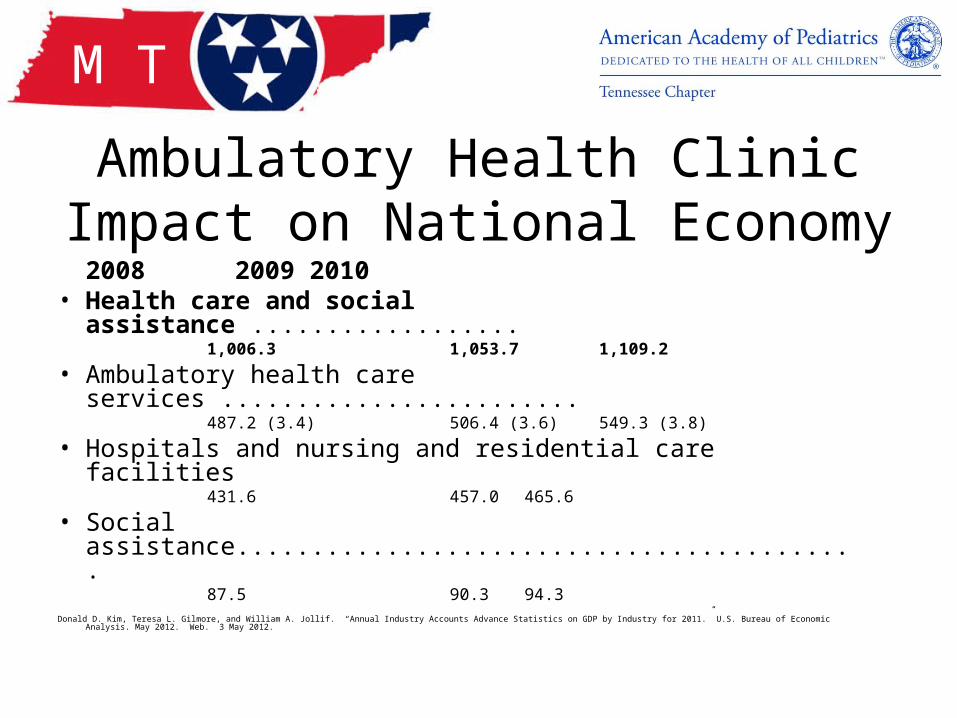
Ambulatory Health Clinic Impact on National Economy
2008 2009 2010• Health care and social assistance ..................
1,006.3 1,053.7 1,109.2
• Ambulatory health care services ........................487.2 (3.4) 506.4 (3.6) 549.3 (3.8)
• Hospitals and nursing and residential care facilities 431.6 457.0 465.6
• Social assistance..........................................87.5 90.3 94.3
Donald D. Kim, Teresa L. Gilmore, and William A. Jollif. “Annual Industry Accounts Advance Statistics on GDP by Industry for 2011.” U.S. Bureau of Economic Analysis. May 2012. Web. 3 May 2012.
M T

M T
Leadership/Patient Expectation Gap
• Each state to build IT platform• Each state negotiate with major insurers• CMS would build façade and integrate SSI and
IRS data• State would run application for Medicaid and
Medicare programs through the exchange• Subsides would than run through states
exchange and financially support exchanges
Insurance Exchanges
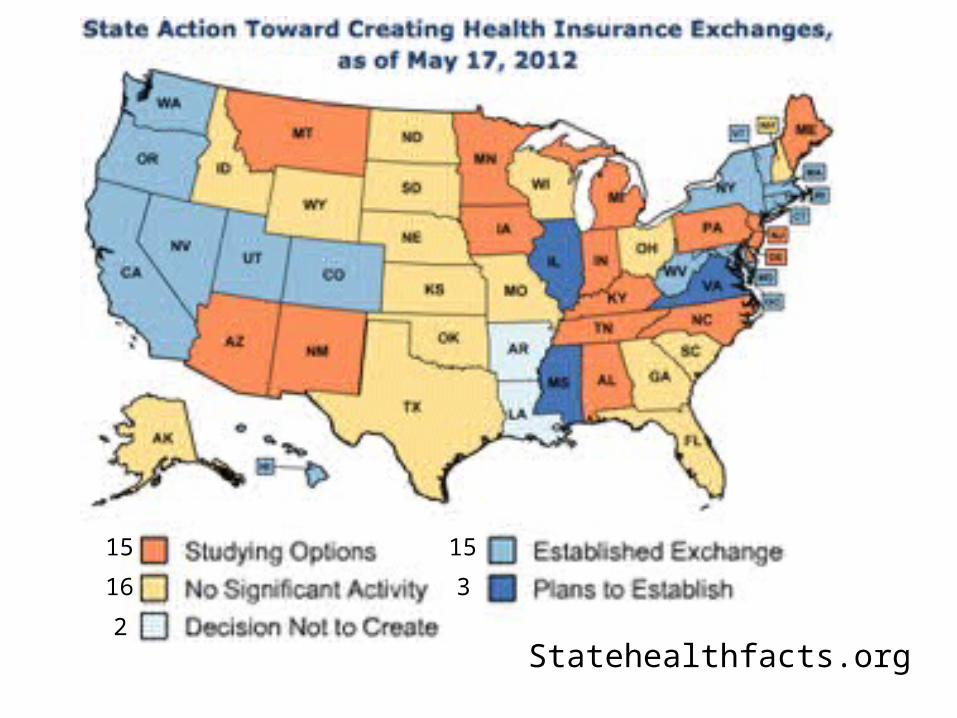
15
16
2
15
3
Statehealthfacts.org
M T
M T
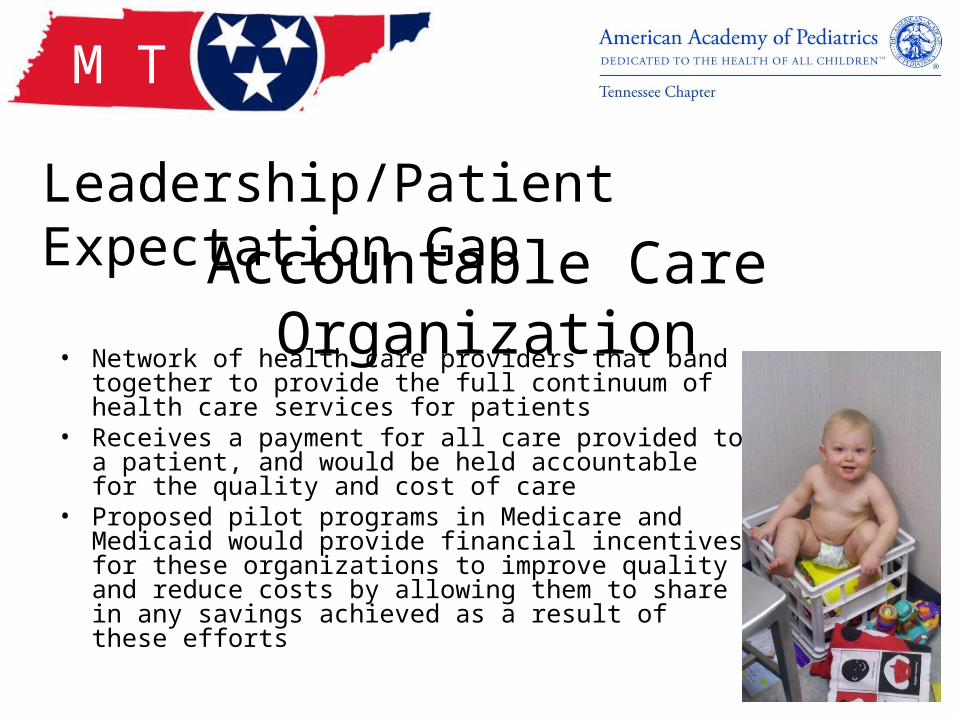
Leadership/Patient Expectation Gap
• Network of health care providers that band together to provide the full continuum of health care services for patients
• Receives a payment for all care provided to a patient, and would be held accountable for the quality and cost of care
• Proposed pilot programs in Medicare and Medicaid would provide financial incentives for these organizations to improve quality and reduce costs by allowing them to share in any savings achieved as a result of these efforts
Accountable Care Organization
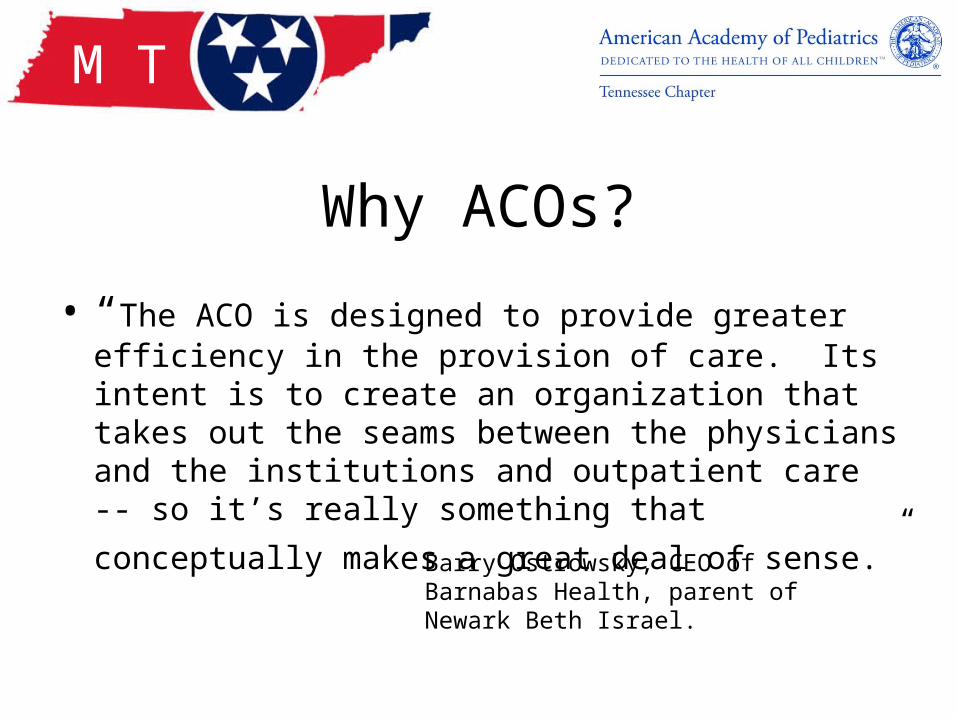
Why ACOs?
• “The ACO is designed to provide greater efficiency in the provision of care. Its intent is to create an organization that takes out the seams between the physicians and the institutions and outpatient care -- so it’s really something
that conceptually makes a great deal of sense.”
M T
Barry Ostrowsky, CEO of Barnabas Health, parent of Newark Beth Israel.
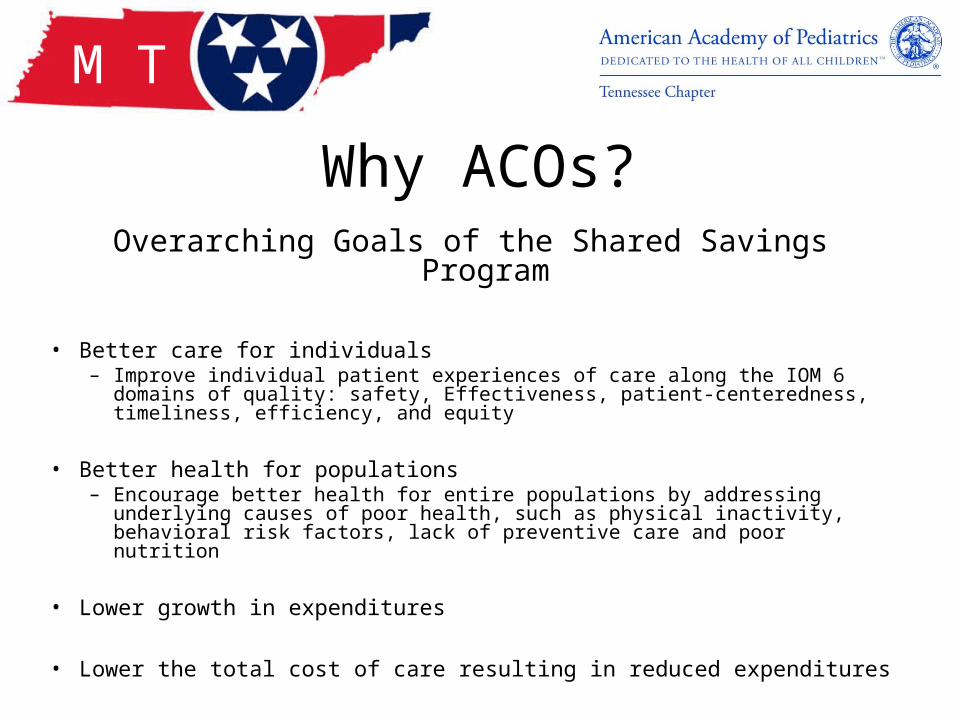
Why ACOs?Overarching Goals of the Shared Savings Program
• Better care for individuals– Improve individual patient experiences of care along the IOM 6 domains
of quality: safety, Effectiveness, patient-centeredness, timeliness, efficiency, and equity
• Better health for populations– Encourage better health for entire populations by addressing underlying
causes of poor health, such as physical inactivity, behavioral risk factors, lack of preventive care and poor nutrition
• Lower growth in expenditures
• Lower the total cost of care resulting in reduced expenditures
M T
M T
Leadership/Patient Expectation Gap
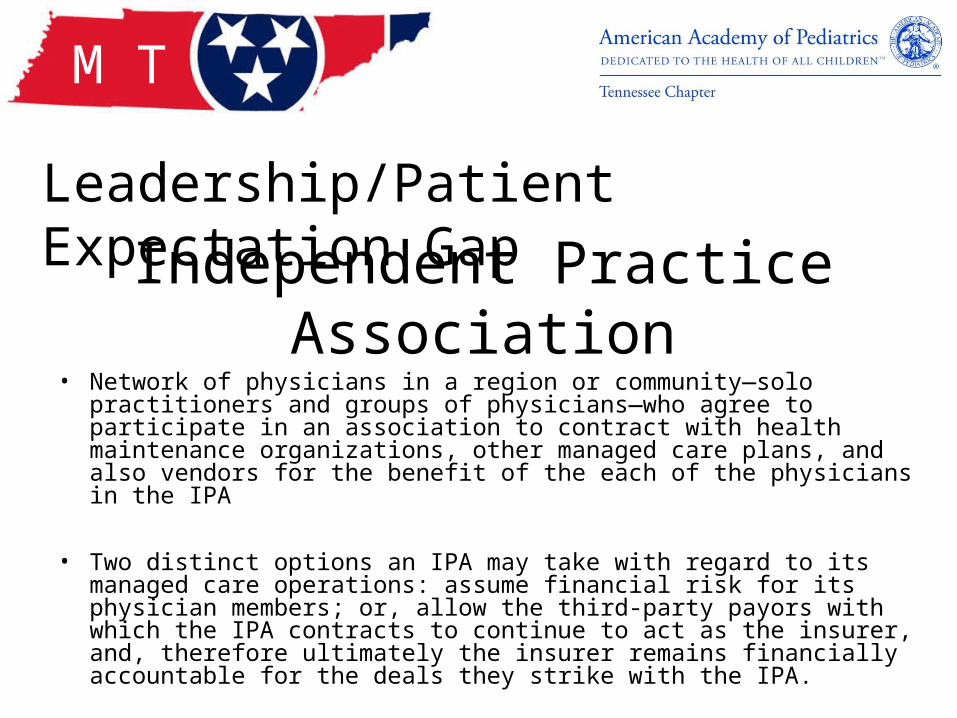
• Network of physicians in a region or community—solo practitioners and groups of physicians—who agree to participate in an association to contract with health maintenance organizations, other managed care plans, and also vendors for the benefit of the each of the physicians in the IPA
• Two distinct options an IPA may take with regard to its managed care operations: assume financial risk for its physician members; or, allow the third-party payors with which the IPA contracts to continue to act as the insurer, and, therefore ultimately the insurer remains financially accountable for the deals they strike with the IPA.
Independent Practice Association
M T

M T
Leadership/Patient Expectation Gap
• Rethink health paradigm• Restructure care delivery • Redesign cost accounting• Do it with no capital added
to system• No stability in the market
Medicine – Why Did I Choose to Work in this Industry?
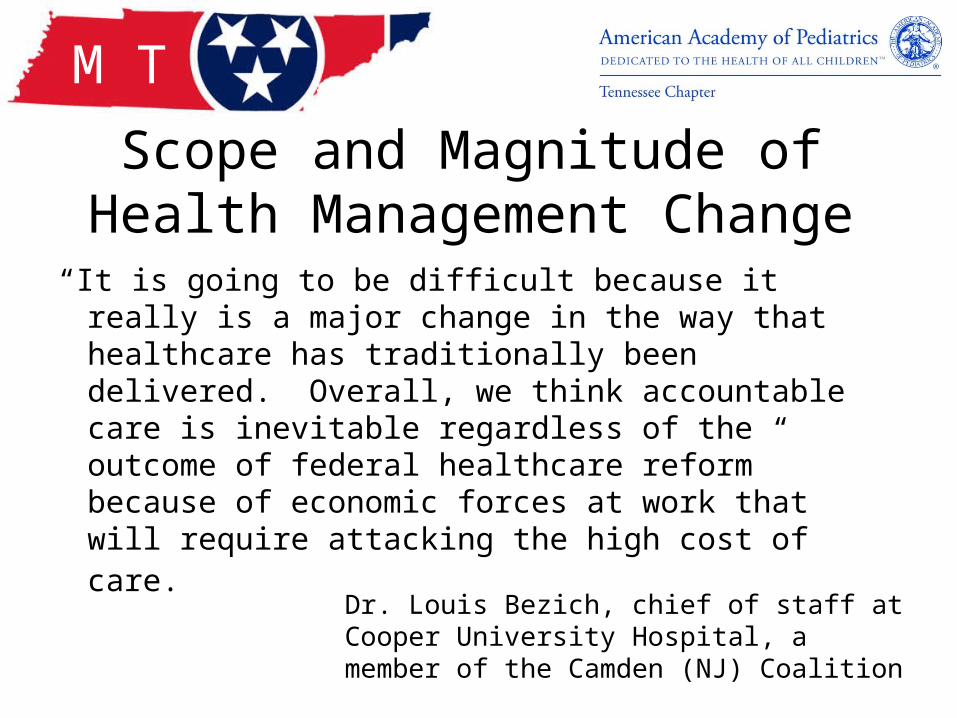
Scope and Magnitude of Health Management Change
“It is going to be difficult because it really is a major change in the way that healthcare has traditionally been delivered. Overall, we think accountable care is inevitable regardless of the outcome of federal healthcare reform” because of economic forces at work that will require attacking the high cost of care.
Dr. Louis Bezich, chief of staff at Cooper University Hospital, a member of the Camden (NJ) Coalition
M T

Scope and Magnitude of Health Management Change
“This is very complicated,” Cantor said. “It is conceptually simple: Providers save money and share in the savings, and in the process improve care. But how do you measure improvement? What activities are allowable and required? What is the approval process? How do the dollars flow? There are a lot of moving parts.”
Joel Cantor, Director Rutgers Center for State Health Policy (The organization that is assisting NJ with Medicaid ACO law, evaluating cost impact and do annual ACO evaluation)
M T
M T
Leadership/Patient Expectation Gap
M T
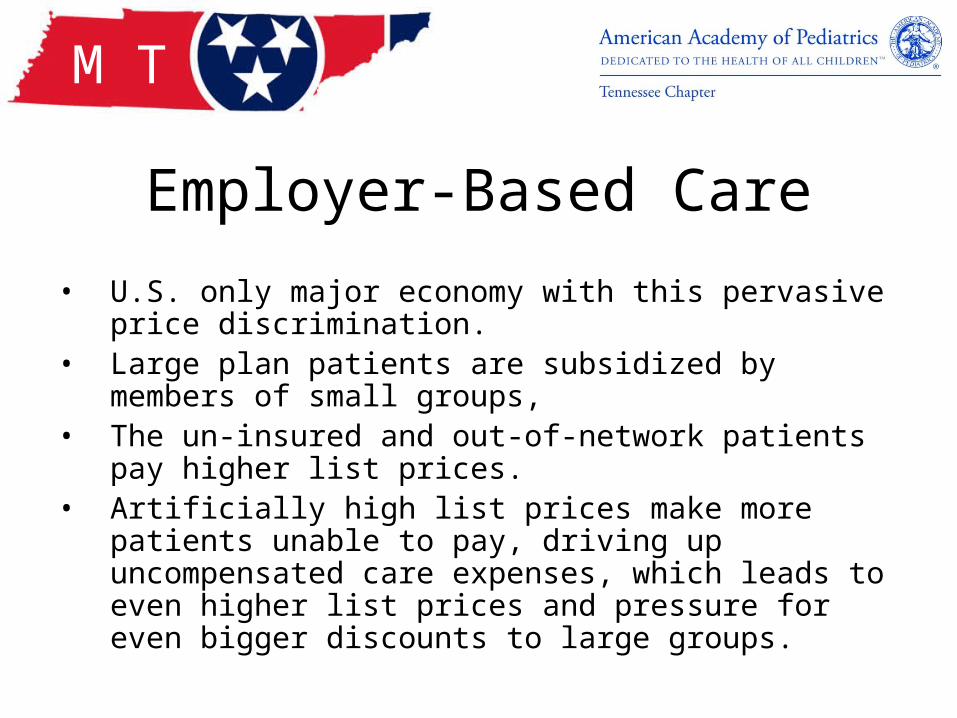
Employer-Based Care
• U.S. only major economy with this pervasive price discrimination.
• Large plan patients are subsidized by members of small groups,
• The un-insured and out-of-network patients pay higher list prices.
• Artificially high list prices make more patients unable to pay, driving up uncompensated care expenses, which leads to even higher list prices and pressure for even bigger discounts to large groups.
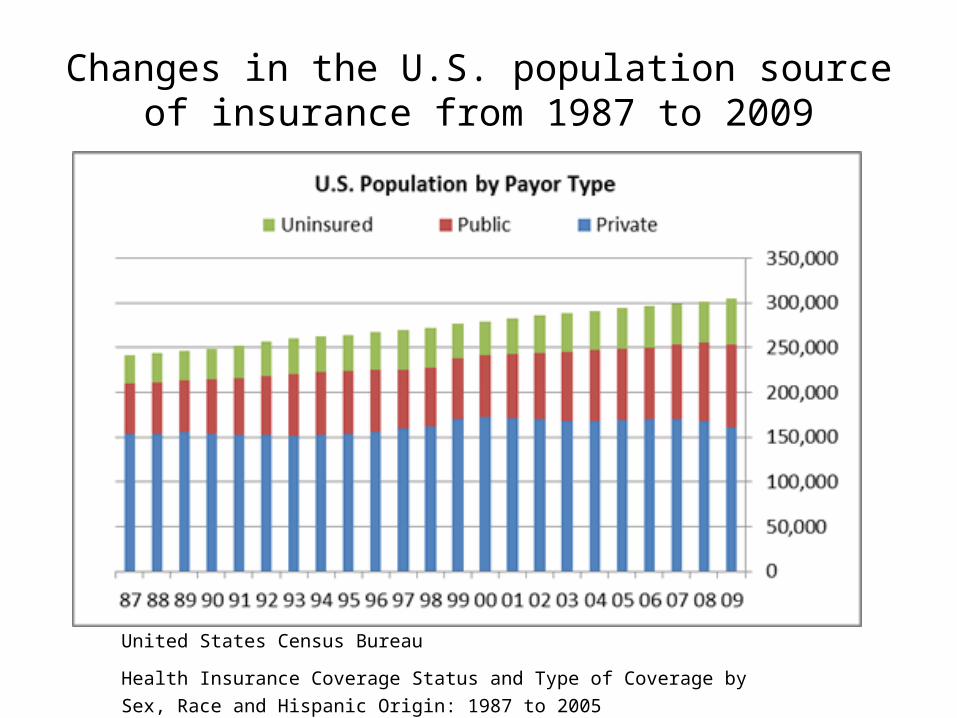
Changes in the U.S. population source of insurance from 1987 to 2009
United States Census Bureau
Health Insurance Coverage Status and Type of Coverage by Sex, Race and
Hispanic Origin: 1987 to 2005
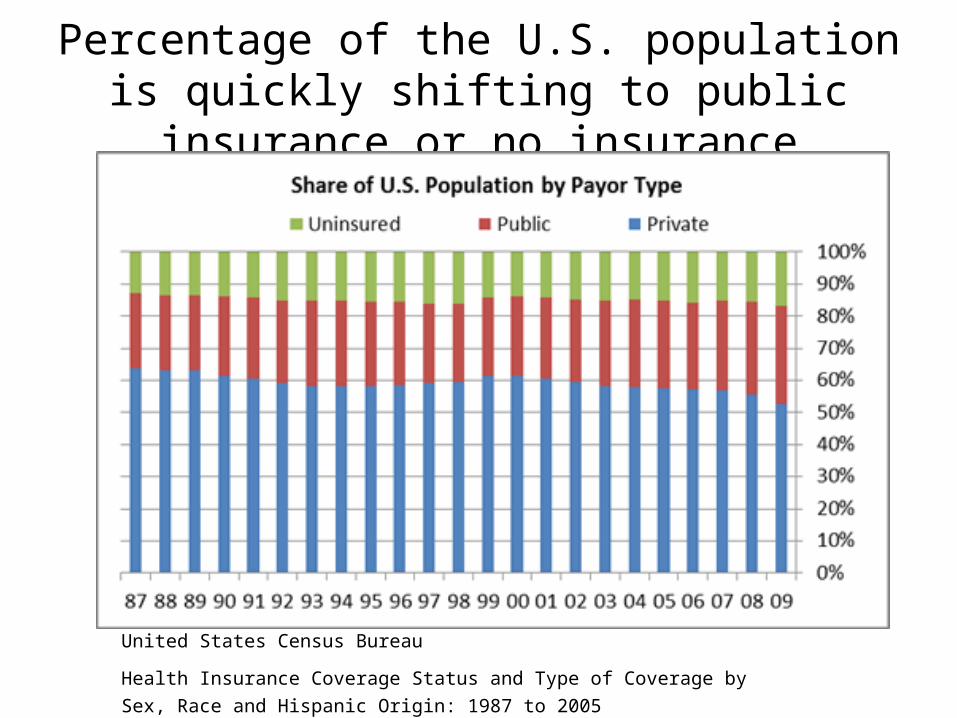
Percentage of the U.S. population is quickly shifting to public insurance or no insurance
United States Census Bureau
Health Insurance Coverage Status and Type of Coverage by Sex, Race and
Hispanic Origin: 1987 to 2005

M T
Dr. Robert Galvin Director of Global Health General Electric
"We need to find the Oprah [Winfrey] of healthcare," he says. To some extent, employees might not trust an employer or a health plan as much as they would trust a third-party advocate who offers independent recommendations on healthcare choices. "If Oprah ever gets into this game, the 10% of consumers who will change on their own will become 70% who will change because they have a trusted person to listen to," he says.

M T
Prevention/Personal LibertyFlorida Gun Law Would Make It Illegal For Doctors To Counsel Parents On Gun Safety

M T
Increasing Disease Chronicity

New Technology/EHR/HIT
• Working closely with Health Information Partnership for Tennessee
• Partnering with other physician professional groups in Tennessee to focus message about HIT
• Pushing for Standards in Medical Data
M T

M T

M T
Increasing Cost of Business Overhead

Initial ACO Startup Costs• Tom Scully, former Center for Medicare & Medicaid Services (CMS)
administrator and current partner at New York private-equity firm Welsh Carson Anderson & Stowe, said, "The start-up cost of a real ACO is probably $30 million and up in a midsize market.“
• CMS estimated it will take $1.7 million per ACO, based on a 2008 study of the Physician Group Practice Demonstration project.
• The American Hospital Association (AHA), however, estimated ACO start-up costs are between $5.3 to $12 million, depending on the hospital size.
• In addition to legal and start-up costs, there also are other accreditation costs, should providers elect to use the voluntary National Committee for Quality Assurance (NCQA) ACO accreditation launched in November for an independent assessment before participating in the governmental Shared Savings or Pioneer ACO programs.
M T
M T
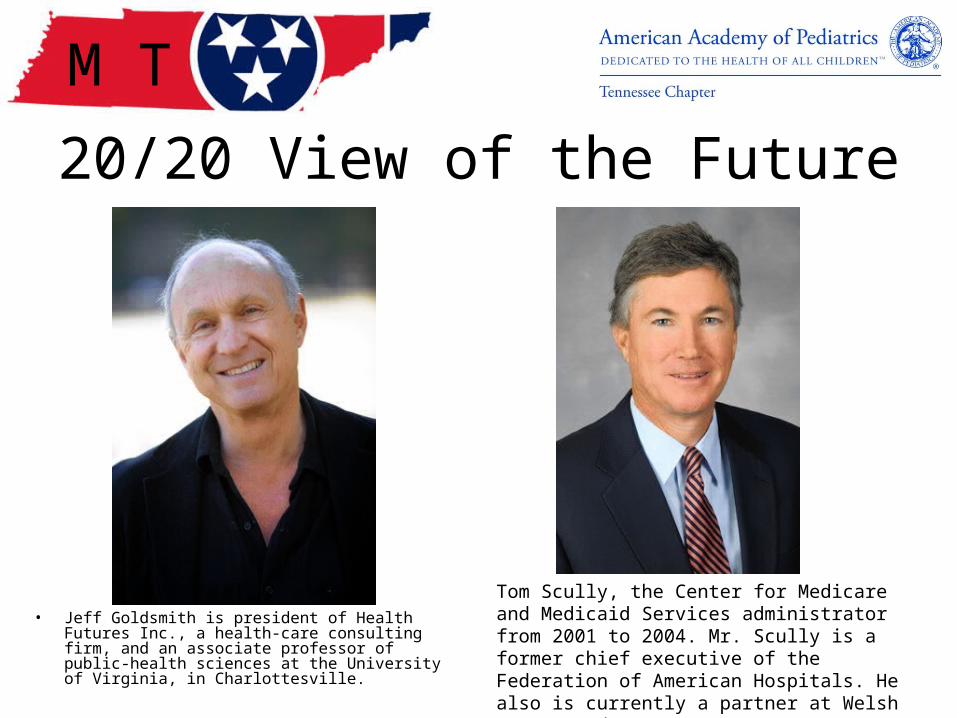
20/20 View of the Future
• Jeff Goldsmith is president of Health Futures Inc., a health-care consulting firm, and an associate professor of public-health sciences at the University of Virginia, in Charlottesville.
Tom Scully, the Center for Medicare and Medicaid Services administrator from 2001 to 2004. Mr. Scully is a former chief executive of the Federation of American Hospitals. He also is currently a partner at Welsh Carson Anderson & Stowe.
M T
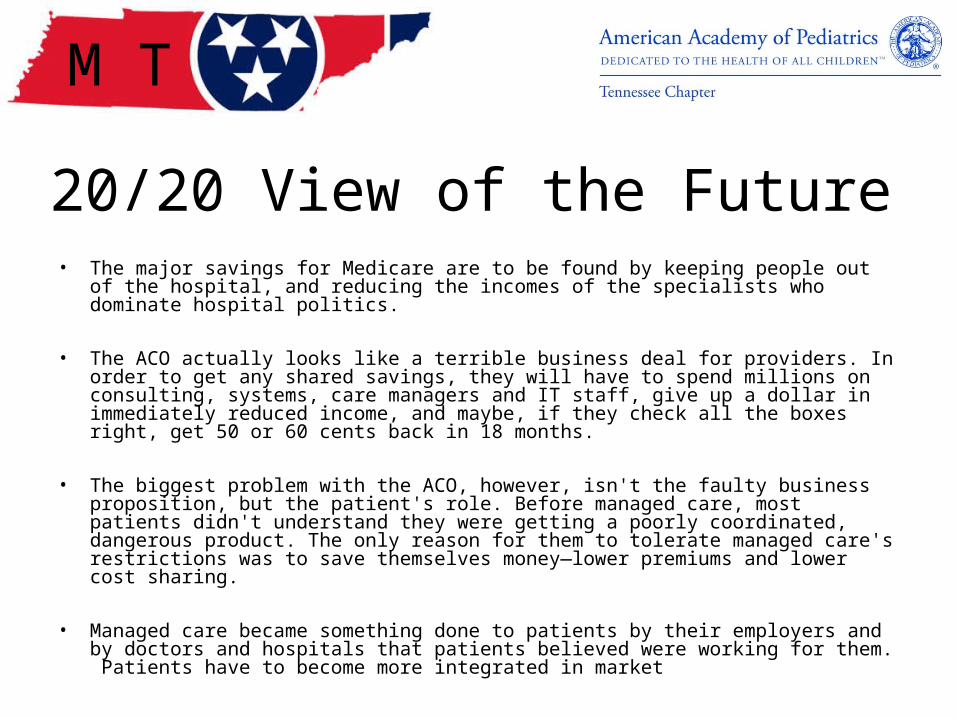
20/20 View of the Future• The major savings for Medicare are to be found by keeping people out of the hospital,
and reducing the incomes of the specialists who dominate hospital politics.
• The ACO actually looks like a terrible business deal for providers. In order to get any shared savings, they will have to spend millions on consulting, systems, care managers and IT staff, give up a dollar in immediately reduced income, and maybe, if they check all the boxes right, get 50 or 60 cents back in 18 months.
• The biggest problem with the ACO, however, isn't the faulty business proposition, but the patient's role. Before managed care, most patients didn't understand they were getting a poorly coordinated, dangerous product. The only reason for them to tolerate managed care's restrictions was to save themselves money—lower premiums and lower cost sharing.
• Managed care became something done to patients by their employers and by doctors and hospitals that patients believed were working for them. Patients have to become more integrated in market
M T
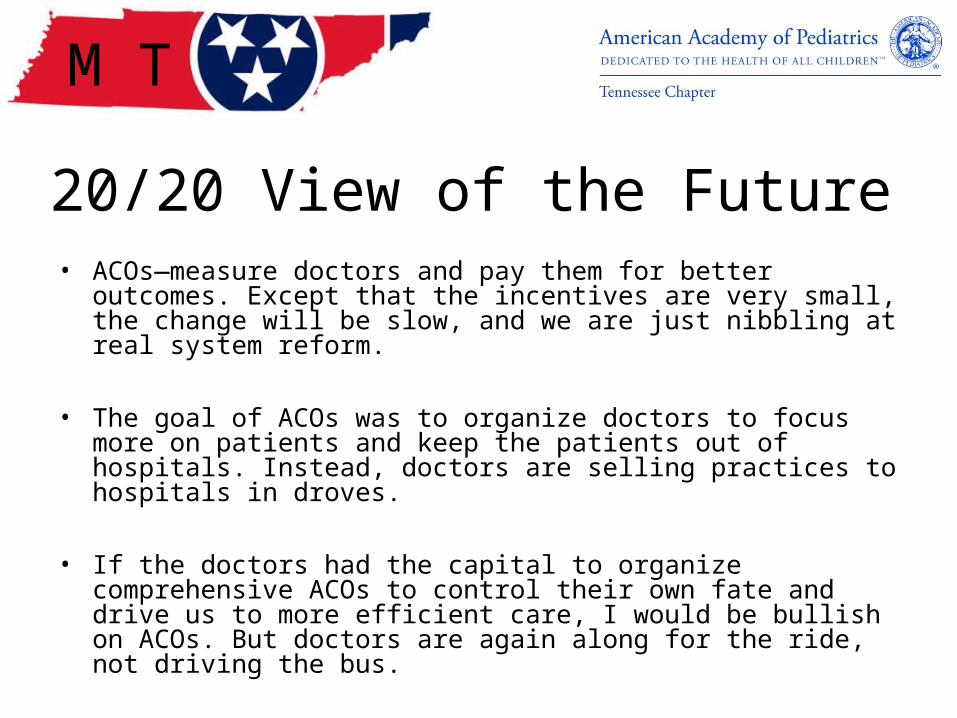
20/20 View of the Future• ACOs—measure doctors and pay them for better outcomes. Except
that the incentives are very small, the change will be slow, and we are just nibbling at real system reform.
• The goal of ACOs was to organize doctors to focus more on patients and keep the patients out of hospitals. Instead, doctors are selling practices to hospitals in droves.
• If the doctors had the capital to organize comprehensive ACOs to control their own fate and drive us to more efficient care, I would be bullish on ACOs. But doctors are again along for the ride, not driving the bus.
M T
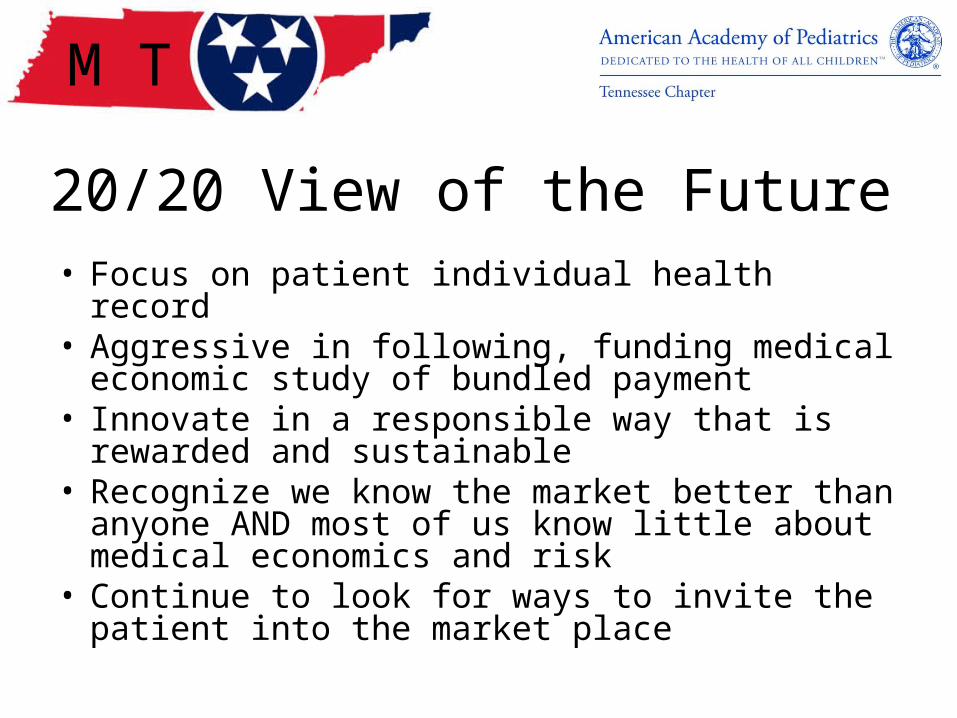
20/20 View of the Future• Focus on patient individual health record• Aggressive in following, funding medical
economic study of bundled payment• Innovate in a responsible way that is rewarded
and sustainable• Recognize we know the market better than
anyone AND most of us know little about medical economics and risk
• Continue to look for ways to invite the patient into the market place
M T

QLIANCE – Seattle, Washington
• The Qliance Vision
• Our vision is to reinvent primary health care via a network of medical practices employed by and directly accountable to our patients. By combining a culture of high quality care and service with best practices in medicine, technology and business, we will:
– Enable the vast majority of Americans, regardless of health or economic status, to access exceptional primary care and service.
– Enable our physicians and other providers to deliver exceptional primary care and service, free of constraints from third party reimbursement.
• We intend that the success of this great company will benefit our employees, partners, investors and every American seeking medical care.
Erika Bliss, MD
President & CEO
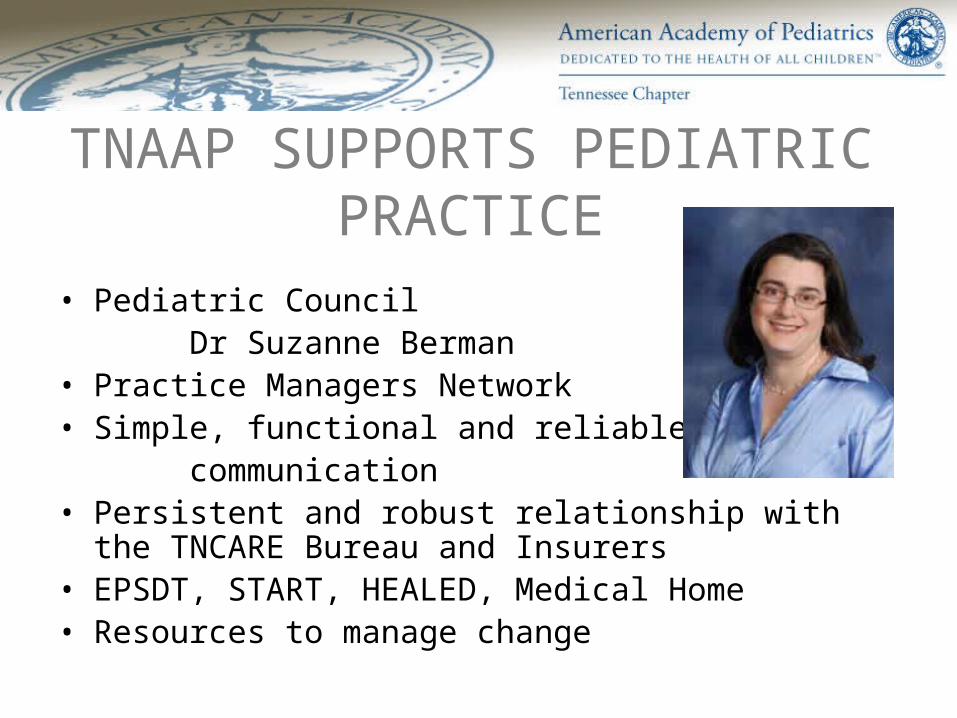
TNAAP SUPPORTS PEDIATRIC PRACTICE
• Pediatric Council Dr Suzanne Berman
• Practice Managers Network• Simple, functional and reliable
communication• Persistent and robust relationship with the TNCARE
Bureau and Insurers• EPSDT, START, HEALED, Medical Home• Resources to manage change

M T

• KYAAP, NCPS, TNAAP and VA-AAP are organizations focusing on pediatric medical care issues in your community
• Open to Local Initiatives• Media Involvement• National Professional Organizations• Synergy Building – “Tearing down the
silos”• Don’t be shy about financial
sustainability
ADVOCACY
GOALS1. Identify several megatrends in
pediatric medicine2. Discuss the Value-Based Medicine
approach to practice, it's purpose and benefits
3. Discuss the instability of a national medical system heavily financed by Employer based payment
4. Describe gaps in reality of pediatric practice and the expectations of government, payors and patients
5. Encourage you in your practice of medicine


Bibliography
• Hibbard, J.H., J. Stockard and M. Tusler. “Does Publicizing Hospital Performance Stimulate Quality Improvement Efforts?” Health Affairs 22, no. 2 (2003): 84-94
• Porter, M. E. and Teisburg, E. O. Redefining Health Care. Boston: Harvard Business School Publishing. p 54.• Wennberg, J.E., and M. M. Cooper, eds. The Dartmouth Atlas of Health Care in the United States. The Trustees of Dartmouth College. Chicago: AHA
Press, 1999. 226-229.• O’Connor A.M., H.A. Llewellyn-Thomas, and A.B. Flood. “Modifying Unwanted Variations in Health Care: Shared Decision Making Using Patient
Decision Aids.” Health Affairs Web exclusive (October 7, 2004)• Bodenheimer T., K. Lorig, H. Holman and K. Grumbach. “Patient Self-Management of Chronic Disease in Primary Care.” Journal of the American
Medical Association 288, no. 19 (2002): S62-S66• Brown, M.B., Brown, G.C., Sharma, S., Evidence-Based to Value-Based Medicine. New York, American Medical Association Press 2005• Andrew S. Ross. “California health insurance exchange moving ahead.” San Francisco Chronicle. 4 April 2012. Web. 2 May 2012• http://healthreform.kff.org/tags/exchanges.aspx• http://healthreform.kff.org/notes-on-health-insurance-and-reform/2011/november/the-economy-and-medical-care.aspx• Miller, J “What employers want: As GE's global healthcare leader, Dr. Robert Galvin measures on value.” Managed Healthcare Executive. July 1 2006 • “Vision of Pediatrics: Megatrends and Scenarios.” AAP. 2011. Web. 18 April 2012.• Bruce D. Armon, Esq.& Howard A. Miller, M.D. “Building a successful IPA .” The Physicians News. July 2001. Web. 3 May 2012.• Porter, M.E., Teisberg, E.O. Redefining Healthcare Creating Value-Based Competition on Results. Boston, Harvard Business School Press, Boston
Mass 2006• http://www.census.gov/hhes/www/hlthins/hlthins.html• “Current Population Survey, 1988 to 2006 Annual Social and Economic Supplements.” U.S. Census Bureau. 2006. Web. 24, April 2012• Fitzgerald, Beth. “NJ’s Inner Cities Ready, but Waiting, to Formalize Medicaid ACOs Urban healthcare providers poised to reduce ER visits -- and
share the savings -- once new rules are in place.” NJSPOTLIGHT. 25 January 2012. Web. 19 May 2012.• Anna Wilde Matthews. “Can Accountable Care Organizations Improve Health Care While Reducing Cost?” Wall Street Journal. 23 January 2012.
Web. 2 May 2012.• Kaiser/HRET Survey of Employer-Sponsored Health Benefits, 1999-2011. Bureau of Labor Statistics, Consumer Price Index, U.S. City Average of
Annual Inflation (April to April), 1999-2011. Bureau of Labor Statistics, Seasonally Adjusted Data from the Current Employment Statistics Survey, 1999-2011 (April to April).
• “Urgent Care Statistics & Benchmarking. Complimentary White Paper on the Urgent Care Industry.” URGENT CARE ASSOCIATION OF AMERICA. August 2010. Web. 12 May 2012.
• Donald D. Kim, Teresa L. Gilmore, and William A. Jollif. “Annual Industry Accounts Advance Statistics on GDP by Industry for 2011.” U.S. Bureau of Economic Analysis. May 2012. Web. 3 May 2012.