Embed Size (px)
Citation preview

National Housing Federation Lion Court 25 Procter Street London, WC1V 6NY
Tel 020 7067 1010 Fax 020 7067 1011 [email protected] www.housing.org.uk
Registered Office: Lion Court, 25 Procter Street, London WC1V 6NY
National Housing Federation Limited, trading as National Housing Federation A company with limited liability
Registered in England No 302132
Briefing:
Renting at Local Housing Allowance
The affordability of private rental properties to benefit claimants
19 July 2019
Summary of key points:
Analysis of data on private rental listings extracted from Zoopla found that:
Only 7.54% of rental properties advertised in England are affordable to LHA claimants.
"Family-sized" properties, i.e. those with two or more bedrooms, are even less affordable,
with only 6.5% being affordable at the relevant LHA rate.
Southern and Eastern parts of England are the least affordable areas.
In 2011, LHA was set to the 30th percentile of rents within Broad Rental Market Areas,
meaning that claimants should have been able to afford 30% of the rental market in each
BRMA. In 2019, the median percentage of the rental market that is affordable within a
BRMA is only 5.9%.
Only 2.75% of rooms within shared accommodation are affordable at LHA. The shared
accommodation rate is usually the only LHA rate that single people aged under 35 may
claim.
Page 2
1. Introduction
There has been much discussion over the last year around whether Local Housing Allowance (LHA)
rates are sufficient to allow people claiming benefits to be able to afford accommodation in the private
rented sector. Shelter, Crisis and The Chartered Institute of Housing have all recently published
analyses comparing LHA levels with the Valuation Office Agency’s published 30th percentile of rents
in an area. However, as this published data includes properties that are currently let to sitting tenants,
the properties that feature would not all be available to a family who are currently seeking
accommodation.
In this briefing, we investigate how many rental properties would be affordable at LHA rates from a
sample of properties that are currently on the market in England. This briefing therefore presents an
analysis of affordability from the point of view of a family on benefits who are currently seeking
accommodation in the private rented sector.
2. Terminology
For the rest of this report, we use the term “affordable” to mean “having a rent which is less than the
LHA amount under consideration”.
3. Results
Our cleaned sample contained 74,154 properties across England. Of these properties, just 5,574
were affordable on the “relevant”1 level of LHA.
Not affordable Affordable Total
England 68,566 5,588 74,154
1The “relevant” level was deemed to be that which corresponds to the number of bedrooms a property has. For example, two bedroom properties were measured against the two-bed LHA rate. Properties with five or more bedrooms were assessed for affordability against the four-bed LHA rate.
Page 3
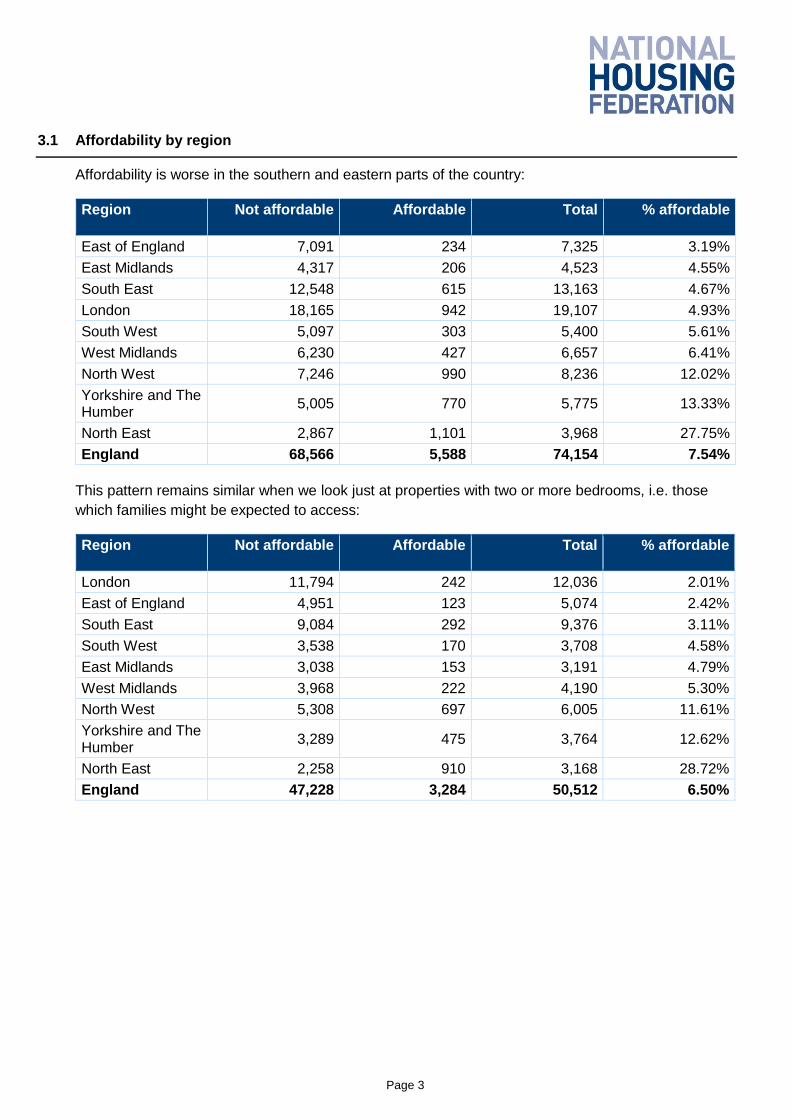
3.1 Affordability by region
Affordability is worse in the southern and eastern parts of the country:
Region Not affordable Affordable Total % affordable
East of England 7,091 234 7,325 3.19%
East Midlands 4,317 206 4,523 4.55%
South East 12,548 615 13,163 4.67%
London 18,165 942 19,107 4.93%
South West 5,097 303 5,400 5.61%
West Midlands 6,230 427 6,657 6.41%
North West 7,246 990 8,236 12.02%
Yorkshire and The Humber
5,005 770 5,775 13.33%
North East 2,867 1,101 3,968 27.75%
England 68,566 5,588 74,154 7.54%
This pattern remains similar when we look just at properties with two or more bedrooms, i.e. those
which families might be expected to access:
Region Not affordable Affordable Total % affordable
London 11,794 242 12,036 2.01%
East of England 4,951 123 5,074 2.42%
South East 9,084 292 9,376 3.11%
South West 3,538 170 3,708 4.58%
East Midlands 3,038 153 3,191 4.79%
West Midlands 3,968 222 4,190 5.30%
North West 5,308 697 6,005 11.61%
Yorkshire and The Humber
3,289 475 3,764 12.62%
North East 2,258 910 3,168 28.72%
England 47,228 3,284 50,512 6.50%

Page 4
3.2 Affordability by Broad Rental Market Area
Broad Rental Market Areas (BRMAs) are bespoke administrative areas that are used for setting the
levels of LHA. They do not correspond to other administrative geographies.
In 2011, LHA rents were indexed to the 30th percentile of rents within each BRMA, meaning that
around 30% of properties within each BRMA should have been affordable at their relevant LHA rate.
In 2019, the median level of affordability within a BRMA was 5.9%.
Broad Rental Market Area
Not affordable Affordable Total % affordable
Huntingdon 226 1 227 0.44%
Thanet 216 1 217 0.46%
Stevenage & North Herts
158 1 159 0.63%
Ipswich 387 3 390 0.77%
Milton Keynes 504 4 508 0.79%
Peterborough 621 6 627 0.96%
Dover-Shepway 174 2 176 1.14%
Central London 3,703 44 3,747 1.17%
Wolds and Coast 79 1 80 1.25%
Outer East London
854 11 865 1.27%
Bury St Edmunds 227 3 230 1.30%
South West Essex 466 7 473 1.48%
North West Kent 314 5 319 1.57%
Sussex East 173 3 176 1.70%
Isle of Wight 172 3 175 1.71%
Outer South East London
967 17 984 1.73%
Mendip 56 1 57 1.75%
Leicester 885 16 901 1.78%
Outer North East London
1,318 24 1,342 1.79%
Northants Central 333 7 340 2.06%
Newbury 179 4 183 2.19%
Bedford 342 8 350 2.29%
Eastern Staffordshire
170 4 174 2.30%
Ashford 210 5 215 2.33%
East Thames Valley
613 15 628 2.39%
Nottingham 727 18 745 2.42%
Rugby & East 159 4 163 2.45%
Coventry 621 16 637 2.51%

Page 5
Broad Rental Market Area
Not affordable Affordable Total % affordable
Swindon 380 10 390 2.56%
Medway & Swale 486 13 499 2.61%
Chichester 291 8 299 2.68%
Colchester 421 12 433 2.77%
Harlow & Stortford 268 8 276 2.90%
Weston-S-Mare 67 2 69 2.90%
Chelmsford 298 9 307 2.93%
Inner South West London
661 20 681 2.94%
Bournemouth 695 22 717 3.07%
Portsmouth 535 17 552 3.08%
Southern Greater Manchester
314 10 324 3.09%
Northampton 334 11 345 3.19%
Cambridge 585 20 605 3.31%
Bristol 763 27 790 3.42%
Blackwater Valley 527 19 546 3.48%
Salisbury 109 4 113 3.54%
South East Herts 435 16 451 3.55%
Cherwell Valley 292 11 303 3.63%
Tameside & Glossop
103 4 107 3.74%
Hull & East Riding 506 20 526 3.80%
Maidstone 253 10 263 3.80%
Aylesbury 303 12 315 3.81%
Central Greater Manchester
1,400 56 1,456 3.85%
Yeovil 223 9 232 3.88%
Crawley & Reigate
636 26 662 3.93%
Southend 288 12 300 4.00%
Central Norfolk & Norwich
610 26 636 4.09%
Gloucester 304 13 317 4.10%
Kernow West 254 11 265 4.15%
Bolton and Bury 415 18 433 4.16%
Kings Lynn 207 9 216 4.17%
Lowestoft & Great Yarmouth
153 7 160 4.38%
Walton 927 46 973 4.73%
Inner East London 778 39 817 4.77%
Cheltenham 430 22 452 4.87%

Page 6
Broad Rental Market Area
Not affordable Affordable Total % affordable
North Nottingham 311 16 327 4.89%
Inner South East London
1,890 99 1,989 4.98%
Grantham & Newark
171 9 180 5.00%
Derby 467 25 492 5.08%
Lincolnshire Fens 93 5 98 5.10%
Worcester South 270 15 285 5.26%
Solihull 175 10 185 5.41%
Worthing 313 18 331 5.44%
North West London
1,106 64 1,170 5.47%
South West Herts 909 54 963 5.61%
Birmingham 2,045 122 2,167 5.63%
Harrogate 165 10 175 5.71%
West Wiltshire 176 11 187 5.88%
Eastbourne 159 10 169 5.92%
Guildford 581 37 618 5.99%
Luton 451 29 480 6.04%
Doncaster 372 24 396 6.06%
Southampton 665 43 708 6.07%
Basingstoke 278 18 296 6.08%
Brighton and Hove
355 23 378 6.08%
Warwickshire South
355 23 378 6.08%
Reading 844 55 899 6.12%
Chesterfield 150 10 160 6.25%
Oxford 724 51 775 6.58%
East Cheshire 155 11 166 6.63%
Black Country 1,108 80 1,188 6.73%
High Weald 422 31 453 6.84%
Barnsley 188 14 202 6.93%
Mid & East Devon 52 4 56 7.14%
Outer South London
1,039 81 1,120 7.23%
Taunton & West Somerset
141 11 152 7.24%
Inner West London
879 69 948 7.28%
South Cheshire 229 18 247 7.29%
Outer North London
1,823 145 1,968 7.37%

Page 7
Broad Rental Market Area
Not affordable Affordable Total % affordable
Worcester North 169 14 183 7.65%
Canterbury 277 23 300 7.67%
Exeter 322 27 349 7.74%
West Cheshire 343 29 372 7.80%
South Devon 291 25 316 7.91%
Staffordshire North
403 36 439 8.20%
Plymouth 436 39 475 8.21%
Outer South West London
1,204 110 1,314 8.37%
Sheffield 761 70 831 8.42%
Oldham & Rochdale
146 14 160 8.75%
Winchester 234 23 257 8.95%
Chilterns 603 60 663 9.05%
Outer West London
1,071 109 1,180 9.24%
Wigan 282 30 312 9.62%
Inner North London
1,237 132 1,369 9.64%
Lincoln 320 35 355 9.86%
Mid Staffs 413 48 461 10.41%
Shropshire 350 41 391 10.49%
Scarborough 76 9 85 10.59%
Mid & West Dorset
143 17 160 10.63%
Wakefield 327 40 367 10.90%
North Cornwall & Devon Borders
57 7 64 10.94%
Scunthorpe 185 23 208 11.06%
York 192 25 217 11.52%
Southport 148 20 168 11.90%
Bath 207 28 235 11.91%
North Cumbria 177 24 201 11.94%
Herefordshire 122 17 139 12.23%
Barrow-in-Furness
63 9 72 12.50%
Kirklees 333 48 381 12.60%
Lancaster 95 14 109 12.84%
North Devon 99 15 114 13.16%
Greater Liverpool 1,387 211 1,598 13.20%
North Cheshire 353 54 407 13.27%

Page 8
Broad Rental Market Area
Not affordable Affordable Total % affordable
Leeds 851 167 1,018 16.40%
Central Lancs 335 66 401 16.46%
Northumberland 338 72 410 17.56%
Grimsby 162 37 199 18.59%
Wirral 339 78 417 18.71%
Rotherham 225 57 282 20.21%
East Lancs 248 65 313 20.77%
Tyneside 1,165 310 1,475 21.02%
Halifax 178 49 227 21.59%
Darlington 108 34 142 23.94%
St Helens 150 49 199 24.62%
Fylde Coast 345 117 462 25.32%
Bradford & South Dales
432 149 581 25.65%
West Pennine 154 54 208 25.96%
Peaks & Dales 128 46 174 26.44%
Kendal 16 6 22 27.27%
Durham 411 171 582 29.38%
Richmond & Hambleton
66 30 96 31.25%
West Cumbria 60 33 93 35.48%
Sunderland 436 244 680 35.88%
Teesside 427 270 697 38.74%
Grand Total 68,566 5,588 74,154 7.54%

Page 9
Map showing affordability of BRMAs. Red lines denote boundaries between regions.

Page 10
3.3 Affordability by size
Rates of affordability are not constant by size. One bedroom accommodation is the most affordable
type of accommodation for LHA claimants. However, rooms in shared accommodation are the least
affordable type of homes for LHA claimants. The shared accommodation rate is (with some
exceptions) the only LHA rate that single people under the age of 35 are able to access.
Two, three and four bedroom accommodation become gradually less affordable as properties
increase in size. A small percentage of homes with five bedrooms or more are affordable when the
four-bed LHA rate is treated as the relevant LHA.
Number of bedrooms
Not affordable at relevant LHA
Affordable at relevant LHA
Total % affordable
Shared Accommodation
5,478 155 5,633 2.75%
One bedroom 15,860 2,149 18,009 11.93%
Two bedrooms 24,765 1,922 26,687 7.20%
Three bedrooms 14,067 1,010 15,077 6.70%
Four bedrooms 5,705 338 6,043 5.59%
Five or more bedrooms
2,691 14 2,705 0.52%
All 73,456 6,050 79,506 7.61%
All two or more bedrooms
47,228 3,284 50,512 6.50%
4. Methodology and assumptions
4.1 Data Cleaning and Coding
We carried out an exercise in July 2019 to gather a range of data from the latest 100 rental
advertisements on property website Zoopla associated with each postcode area. This produced a
base of 118,918 advertisements to work with.
The initial stage of data processing involved identifying and removing any listings that were for
commercial property such as land, garages, retail units etc. This involved a combination of using the
property type field and running text searches on the description. Additionally, all properties that were
situated outside of England (in Wales, Scotland or Northern Ireland) were identified by their postcode
and removed from the dataset.
The second stage was re-coding the “property type” field into simple categories based on the number
of bedrooms each property had. For example, categories such as “three bed house”, “three bed
maisonette” and “three bed flat” were combined into a single “three bed” category. Any properties
recorded as single rooms were coded as shared accommodation. Any homes with five or more
bedrooms were coded into a single category of “5+ bedrooms”. Any properties listed as “studio flats”,
were recoded as one bedroom flats on the basis that housing benefit regulations define a one
bedroom property as one where the tenant has exclusive use of one room, a bathroom and toilet and
a kitchen.

Page 11
At this stage, a number of inconsistencies were discovered in the way the “property type” field on
Zoopla is used by letting agents. Upon inspection, many adverts for multi-bedroom properties
according to the “number of bedrooms” field were found to actually be for individual rooms within
those properties, with rent figures that reflected that. Additionally, it was found that many listings
recorded as “studio flats” were actually for rooms within shared accommodation that had either a
private kitchen or bathroom, but not both (and so would therefore not be eligible for the one bed rate).
These inconsistently coded properties were identified using text searches on the description field and
re-coded as shared accommodation.
Finally, the data was de-duplicated. All listings where the postcode, letting agent, simplified property
type and rental value were all identical were considered duplicates and removed. This left a dataset
consisting of 74,154 properties across England.
4.2 Other types of property
It should be noted that while adverts for land, garages, and commercial premises were removed,
student properties were left in the dataset. This was due to the difficulty of separating those that are
exclusively for students from those that are noted as suitable for students.
Also remaining in the dataset are adverts for “property guardian” schemes, where non-traditionally
residential properties are let at low rents as a way of defending the building from vandalism, squatting
etc. These properties are often occupied on a short-term basis with short notice periods built into the
contract, and thus offer little security in terms of tenure, but they still form part of the rental market
and, if affordable, could in principle be rented by people on housing benefit.
4.3 Matching postcodes to BRMAs
The next stage was to match each postcode with a Broad Rental Market Area (BRMA). This was
achieved by matching each postcode district to the BRMA with which it had the largest area of overlap
using the “Spatial Join - Largest Overlap” tool2 in ArcGIS. Postcode districts were also matched to
their region in which they are situated using the same tool.
4.4 Coding for affordability
Each property was then coded as affordable or unaffordable. Properties were coded as affordable if
their advertised monthly rent was equal to or less than the monthly LHA rate that was applicable to its
size and postcode district.
5. A note on Local Housing Allowance
Local Housing Allowance is a cap on the amount of Housing Benefit that welfare benefit claimants
residing in the private rented sector are entitled to claim. LHA rates are applicable to private rented
sector tenants only, and not to tenants in social housing. LHA rates were fixed in 2011 at the 30th
percentile of private rents for each property size in the Broad Rental Market Area. In 2013, the
method for uprating LHA rates annually was changed from uprating by rises in market rents to
2Available at: https://www.arcgis.com/home/item.html?id=e9cccd343bf84916bda1910c31e5eab2
Page 12
uprating by Consumer Price Index inflation. Additionally, these rates have been frozen since 2016.
Therefore, LHA rates may no longer match the 30th percentile of rents within each BRMA.
Different LHA rates are applicable to different sized rental properties within the same BRMA, ranging
from the shared accommodation rate to a four-bed rate. A housing benefit claimant’s entitlement to a
given property size rate is dependent on the claimant’s personal circumstances such as their age or
number of dependants. It should be noted that for LHA rates of two bedrooms or more, eligibility, and
thus the rate of LHA available, relates to the claimant rather than the dwelling. Therefore, the amount
paid to the claimant is assessed on what size of property they are entitled to, not the size of the
property they are actually residing in.