Embed Size (px)
Citation preview
Bridging the Gap
Bridging the Educational Research-Teaching Practice Gap
TOOLS FOR EVALUATING THE QUALITY OF ASSESSMENT INSTRUMENTS*
Received for publication, June 19, 2009, and in revised form, October 2, 2009
Trevor R. Anderson‡ and John M. Rogan
From the Science Education Research Group (SERG), School of Biochemistry, Genetics and Microbiology,University of KwaZulu-Natal, Pietermaritzburg, South Africa
Student assessment is central to the educational process and can be used for multiple purposesincluding, to promote student learning, to grade student performance and to evaluate the educationalquality of qualifications. It is, therefore, of utmost importance that assessment instruments are of ahigh quality. In this article, we present various tools that instructors could use, both to improveinstrument design and validity before presentation to students and, to evaluate the reliability andquality of the assessment after students have answered the questions. In keeping with our goals ofthe Bridging-the-Gap series, we also present various ideas from the educational literature regardingthe evaluation of assessment quality and end with a list of criteria that instructors could use to guidetheir evaluation process.
Keywords: Assessment, quality, design, item analysis, validity, reliability.
There is a world-wide move in educational institutionstowards the establishment of more formal structures forthe evaluation of the quality of education [1]. This changehas been motivated by the demands of various stake-holders in the educational process including, funding andaccreditation bodies, potential employers of graduates,and the students themselves demanding qualificationsthat are recognized for their high educational standards,and which will thereby enable them to succeed in anever-increasing competitive world. One way to achievethis goal is to evaluate the quality of the assessmentinstruments employed to assess the achievement ofsuch outcomes. Evaluation of assessment quality alsooffers universities a more accurate means of evaluatingfaculty teaching and course quality [2] than student eval-uation questionnaires which, despite often yielding unreli-able measures of teaching quality [3], are the dominantinstrument used to judge teacher success and promo-tions.
In this article in the ‘‘Bridging-the-Gap’’ series onassessment, we focus on procedures that can beemployed to improve the quality of student assessment.
The first part of the paper deals with steps that can betaken in the design of valid test instruments, while thesecond part deals with the calculation of reliability andthe performance of an item analysis that can be doneafter the students have written the test. These proce-dures provide evidence for retaining good items, discard-ing bad ones, and generally feed back into the improve-ment of assessment design when the instrument is usedthe next time around.
BEFORE ASSESSMENT—DESIGNING THE TEST INSTRUMENT
Issues of Validity
The importance of validity has been stressedthroughout this series of articles, if not by name, byexample. Simply stated, if all the items in an assess-ment instrument are designed to match one or moreobjectives of a course, then there is evidence for thevalidity of that instrument. For example, three selectedlearning outcomes from a course on introductorymetabolism taught by one of the authors are given inthe box below, together with examples of test itemsthat can be used both formatively to promote the de-velopment of an outcome during the course and sum-matively to check whether students have indeedachieved the outcome [2]. Note that, in line with ourprevious papers [4, 5], each outcome consists of botha cognitive skill (e.g. apply, transfer, or reason) and aknowledge component.
*This work is supported by National Research Foundation(NRF) (GUN Number 2053218).
‡ To whom correspondence should be addressed. P/Bag X01,Scottsville, Pietermaritzburg, KwaZulu-Natal 3209, South Africa.Tel.: þ27332605464; Fax: þ27332606127. E-mail: [email protected].
This paper is available on line at http://www.bambed.org DOI 10.1002/bmb.2036251
Q 2010 by The International Union of Biochemistry and Molecular Biology BIOCHEMISTRY AND MOLECULAR BIOLOGY EDUCATION
Vol. 38, No. 1, pp. 51–57, 2010

Examples of learning outcomes and correspondingassessment tasks for an introductory course
on metabolism
Outcome 1. Apply the concepts of thermodynamicsto explain metabolic regulation, including the directionof metabolic pathways;
Explain why a metabolic pathway is able to proceedin a particular direction.
Outcome 2. Reason locally and globally about theconcept (system thinking);
Use the supplied metabolic charts to answer the fol-lowing question. If the enzyme triosephosphate isom-erase was irreversibly inhibited by a toxic substance,predict what effect this would have on:
(a) The flux through glycolysis;(b) The concentration of the intermediates in
glycolysis before the point of inhibition;(c) The production of NADH by the Citric Acid
Cycle during aerobic carbohydrate metabolism;(d) The production of ATP per mole of glucose
during anaerobic carbohydrate metabolism;(e) The utilization of oxygen by the electron
transport chain.
Outcome 3. Transfer and apply your knowledge ofchemistry to understand metabolism;
Use your knowledge of chemistry to suggest whichfactors determine whether two biochemical com-pounds will react in an enzyme-catalyzed reaction?
The task addressing Outcome 1 requires students toapply their knowledge of thermodynamics to explainunder what circumstances all the consecutive-linkedreactions in a pathway are able to proceed in the sameforward direction. The task addressing Outcome 2requires students to exercise their system thinking skillsto think locally about the effects on the individualenzyme-catalyzed reaction that is inhibited and about theglobal implications of this inhibition on the functioning ofglycolysis, in which the enzyme occurs, and other relatedpathways. In contrast, the task addressing Outcome 3requires students to transfer and apply their knowledgeof chemistry, studied in the previous year, to answer aquestion about metabolic reactions, something which, inour experience, students find very difficult to do as theytend to store such knowledge in ‘closed boxes’ and onlytransfer it if cued to do so [6].
From the above, it seems obvious that the assessmentinstruments designed by those who teach the courseshould automatically be valid—and this is usually the case.However, at times we sabotage our own goals by notdesigning valid instruments. For example, often coursesinclude goals such as the development of critical reasoning,but this goal is never explicitly assessed. Thus, it is alwaysimportant to check that all the specified course objectivesare being assessed or, alternatively, whether for variouseducational reasons (e.g. the objective is not at the appro-priate educational level of the course and/or of the student;
Table I, Parts A4 and B2) it might be desirable to remove anobjective or add in a new one.
Criteria for Assessment Design
The issue of what constitutes sound assessmentdesign has been discussed by numerous authors overthe years, especially with respect to multiple-choiceitems (e.g. [7, 8]), but also regarding open-ended ques-tions (e.g. [9, 10]). In the authors’ experience, although,only limited consensus exists among biochemists when itcomes to actually judging particular questions and decid-ing what constitutes a ‘‘good’’ and a ‘‘bad’’ question. Forthis reason, continual requests are made by Societies ofBiochemistry (e.g. [11, 12]) for more workshops on stu-dent assessment. In view of the great diversity of opin-ion, a detailed discussion of this topic is beyond thescope of this article. Instead, readers are referred to thefollowing papers (see [13, 14]) as well as to the Assess-ment Design and Delivery System [15] for guidance onitem design and other aspects of assessment. In addi-tion, Table I lists some more general criteria for col-leagues to use, preferably as a collaborative group, toscreen the quality of their assessment instruments.
Issues of Transparency
We have all probably experienced the frustration ofknowing that we could have done better on a test had weknown what the examiner was looking for. In the languageof assessment, students who know and understand thecriteria on which they are to be evaluated (see Table I, A6)are more likely to demonstrate their true worth. For exam-ple, if students know that correct grammar will count 25%of the final grade for a biochemistry essay, they will paycareful attention to their writing skills. There are a numberof ways of conveying the assessment criteria to students,ranging from a simple list to a detailed rubric. A rubric is amatrix in which one axis describes each of the criteria tobe used in the assessment process, and the other axisdefines grades or levels (e.g. excellent, good, adequate,and poor) at which each of the criteria will be judged.Rubrics are best employed for relatively complex tasks orfor essays/term papers. For more information on the devel-opment of rubrics (see Allen and Tanner [16]).
AFTER ASSESSMENT—EVALUATING THE QUALITY OF A TESTINSTRUMENT
The techniques described in this next section enable thosewho designed the assessment instrument to reflect on andimprove what they have done. Just as scientists are able toimprove their laboratory techniques by scrutinizing theirresults, so science educators can improve their assessmentpractices by critically looking at the results. The four techni-ques described below are reliability, standard error of mea-surement (SEM)1, item analysis, and distracter analysis.
Reliability
As scientists we are rightly concerned with the accu-racy of the measurements we make. As science educa-
1The abbreviations used are: SEM, standard error of mea-surement.
52 BAMBED, Vol. 38, No. 1, pp. 51–57, 2010
tors we need to be equally concerned with how accu-rately we are measuring the progress of our students.Reliability, when applied to psychometric measures, is anintuitive concept, which shares some of the same mean-ing as in the world of physical measurement. If a claim ismade that the pH of a certain solution is 4.5, then wewould want to know how accurate this measurement is(i.e. what is the reliability of the instrument used?), and inparticular, the size of the error associated with thisclaim—for example 4.5 þ 0.15. We would also want toknow whether this result would be obtained consis-tently—whether we would get the same reading if wewere to take the measurement again.
A caveat needs to be emphasized at this stage. Theexplanation of reliability below only applies to assess-ment instruments whose items are closed—where thereis clearly one correct answer. The reliability of complexand open-ended assessment techniques cannot be cal-culated in the manner described below.
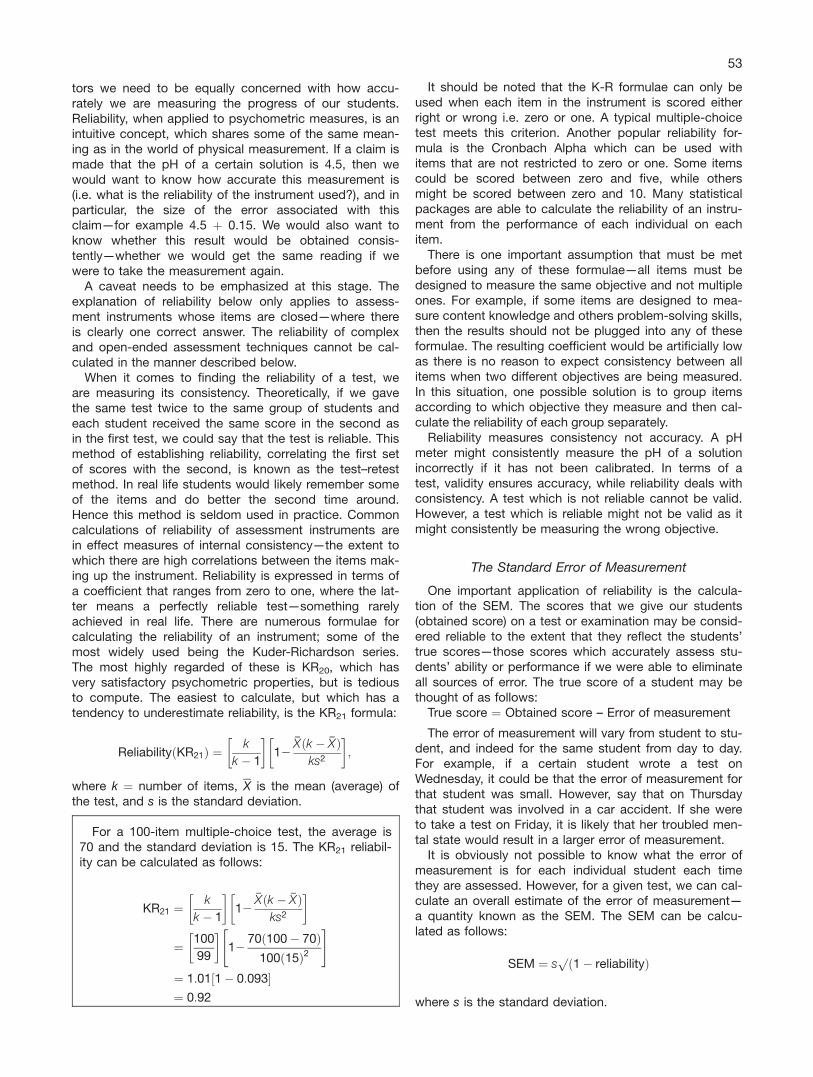
When it comes to finding the reliability of a test, weare measuring its consistency. Theoretically, if we gavethe same test twice to the same group of students andeach student received the same score in the second asin the first test, we could say that the test is reliable. Thismethod of establishing reliability, correlating the first setof scores with the second, is known as the test–retestmethod. In real life students would likely remember someof the items and do better the second time around.Hence this method is seldom used in practice. Commoncalculations of reliability of assessment instruments arein effect measures of internal consistency—the extent towhich there are high correlations between the items mak-ing up the instrument. Reliability is expressed in terms ofa coefficient that ranges from zero to one, where the lat-ter means a perfectly reliable test—something rarelyachieved in real life. There are numerous formulae forcalculating the reliability of an instrument; some of themost widely used being the Kuder-Richardson series.The most highly regarded of these is KR20, which hasvery satisfactory psychometric properties, but is tediousto compute. The easiest to calculate, but which has atendency to underestimate reliability, is the KR21 formula:
ReliabilityðKR21Þ ¼ k
k � 1
� �12
�Xðk � �XÞks2
� �;
where k ¼ number of items, X is the mean (average) ofthe test, and s is the standard deviation.
For a 100-item multiple-choice test, the average is70 and the standard deviation is 15. The KR21 reliabil-ity can be calculated as follows:
KR21 ¼ k
k � 1
� �12
�Xðk � �XÞks2
� �
¼ 100
99
� �12
70ð100� 70Þ100ð15Þ2
" #
¼ 1:01½1� 0:093�¼ 0:92
It should be noted that the K-R formulae can only beused when each item in the instrument is scored eitherright or wrong i.e. zero or one. A typical multiple-choicetest meets this criterion. Another popular reliability for-mula is the Cronbach Alpha which can be used withitems that are not restricted to zero or one. Some itemscould be scored between zero and five, while othersmight be scored between zero and 10. Many statisticalpackages are able to calculate the reliability of an instru-ment from the performance of each individual on eachitem.
There is one important assumption that must be metbefore using any of these formulae—all items must bedesigned to measure the same objective and not multipleones. For example, if some items are designed to mea-sure content knowledge and others problem-solving skills,then the results should not be plugged into any of theseformulae. The resulting coefficient would be artificially lowas there is no reason to expect consistency between allitems when two different objectives are being measured.In this situation, one possible solution is to group itemsaccording to which objective they measure and then cal-culate the reliability of each group separately.
Reliability measures consistency not accuracy. A pHmeter might consistently measure the pH of a solutionincorrectly if it has not been calibrated. In terms of atest, validity ensures accuracy, while reliability deals withconsistency. A test which is not reliable cannot be valid.However, a test which is reliable might not be valid as itmight consistently be measuring the wrong objective.
The Standard Error of Measurement
One important application of reliability is the calcula-tion of the SEM. The scores that we give our students(obtained score) on a test or examination may be consid-ered reliable to the extent that they reflect the students’true scores—those scores which accurately assess stu-dents’ ability or performance if we were able to eliminateall sources of error. The true score of a student may bethought of as follows:
True score ¼ Obtained score – Error of measurement
The error of measurement will vary from student to stu-dent, and indeed for the same student from day to day.For example, if a certain student wrote a test onWednesday, it could be that the error of measurement forthat student was small. However, say that on Thursdaythat student was involved in a car accident. If she wereto take a test on Friday, it is likely that her troubled men-tal state would result in a larger error of measurement.
It is obviously not possible to know what the error ofmeasurement is for each individual student each timethey are assessed. However, for a given test, we can cal-culate an overall estimate of the error of measurement—a quantity known as the SEM. The SEM can be calcu-lated as follows:
SEM ¼ spð1� reliabilityÞ
where s is the standard deviation.
53

Note that if the reliability is one, then the SEMbecomes zero. An example of how the SEM may beinterpreted is given below.
For a 100-item multiple-choice test, the average is65, the standard deviation 15, and the reliability 0.5.The SEM can be calculated:
SEM ¼ 15pð1� 0:5Þ
¼ 15ð0:71Þ¼ 10:65
The score for a person getting 70 on the test couldbe expressed as 70 6 10.65. This may be interpretedthat there is about a 68% probability that this person’strue score lies somewhere between 60 and 80—inother words a person’s score is presented, not by apoint, but by a range.
From the above example, it is clear that for a high-stakes examination, such as one that determineswhether a student passes or fails a course, a high coeffi-cient of reliability is desirable. When determining the fateof a student, looking at the range in which the student’strue score might lie is preferable to using a point score.
There are a number of factors that contribute toenhancing or diminishing the reliability of an instrument,and hence increasing the SEM. Some are random andthus beyond the control of the instructor. However, thereare two that are important and within the control of aninstructor. The one is that students know and understandthe criteria on which their work will be assessed. Thesecond is the quality of the items making up the instru-ment. A reliable instrument is of necessity made up of‘‘good’’ items. Some of the statistical packages identifythe most problematic item, and recalculate the reliabilityof the instrument if that item were to be deleted. How-ever, no information is provided on why that item is prob-lematic. For this an item analysis of each item is bothnecessary and desirable.
Item Analysis
Item analysis provides one with certain characteris-tics of each item in the instrument. This informationcan be used to identify weak items and hence improveboth the items and the instrument as a whole. Wehave found that undertaking this task with the help ofcolleagues is an invaluable exercise. As with the calcu-lation of reliability, item analysis can only be performedonce at least one group has answered the items in theinstrument (see Nagata [17] for a full treatment of itemanalysis).
Item Difficulty—The index of item difficulty is simplydefined as the proportion or percentage of students in a
group getting the item correct. In the case of a weighteditem (one in which more than one possible score is pos-sible, e.g. 1, 2, 3, or 4) it is the average for that itemexpressed as a proportion or percentage. The ideal valueof this index depends on the purpose of the test. Forexample, in a test that is designed to identity just a fewwinners from a large group (e.g. a science Olympiad), theindex for most items will typically be quite low. However,for the normal semester test one would expect the indi-ces of items to range between about 0.4 and 0.8. Anindex of say 0.1 would certainly raise a flag and causeone to examine that item carefully, and to ask the ques-tion, ‘‘Why are so many students unable to answer thisitem? Was this concept not taught?’’
Item discrimination—The index of item discrimination isthe difference between the proportion of the top one-third (approximately) of students getting that item correctminus the proportion of the bottom one third of studentsgetting that item correct. In other words:
Index of discrimination ¼ Item difficulty(top third) – Itemdifficulty(bottom third)
The top and bottom thirds are usually selected on thebasis of the test being analyzed, but could be selectedon the basis of a cumulated semester grade. The indexcan range from 1 (all top students and none of the bot-tom students get the answer correct) to –1. A negativeindex indicates a problematic item—one on which thebetter students are performing worse than the poorerstudents. It is often an indication of a poorly worded ormisleading item. Indices of between 0.2 and 0.4 are con-sidered satisfactory. Note that an item with a difficultyindex of one necessity will of have a discrimination indexof zero. The same is true of an item with a difficulty indexof zero.
Student
Total scoreon the
whole testItem1
Item7
Item13
Item19
Item23
A 95 1 1 1 0 1B 90 1 1 1 0 1C 87 1 1 1 1 0D 82 1 1 1 0 1E 80 1 1 1 0 1F 78 1 0 1 1 1G 75 1 1 0 0 1H 72 1 1 1 0 0I 65 1 1 1 0 1J 62 1 1 0 1 0K 60 1 0 0 0 1L 60 1 1 1 0 0M 58 1 0 1 0 0N 56 1 1 0 1 0O 54 1 1 1 0 0P 52 1 1 0 0 1Q 49 1 1 0 1 0R 46 1 0 1 0 1S 45 1 1 0 0 0T 45 1 0 0 0 0U 41 1 1 0 0 0V 40 1 1 0 0 0W 38 1 1 0 0 0X 35 1 0 0 1 0
Note: A–H constitutes the top group and Q–X the bottom.
54 BAMBED, Vol. 38, No. 1, pp. 51–57, 2010
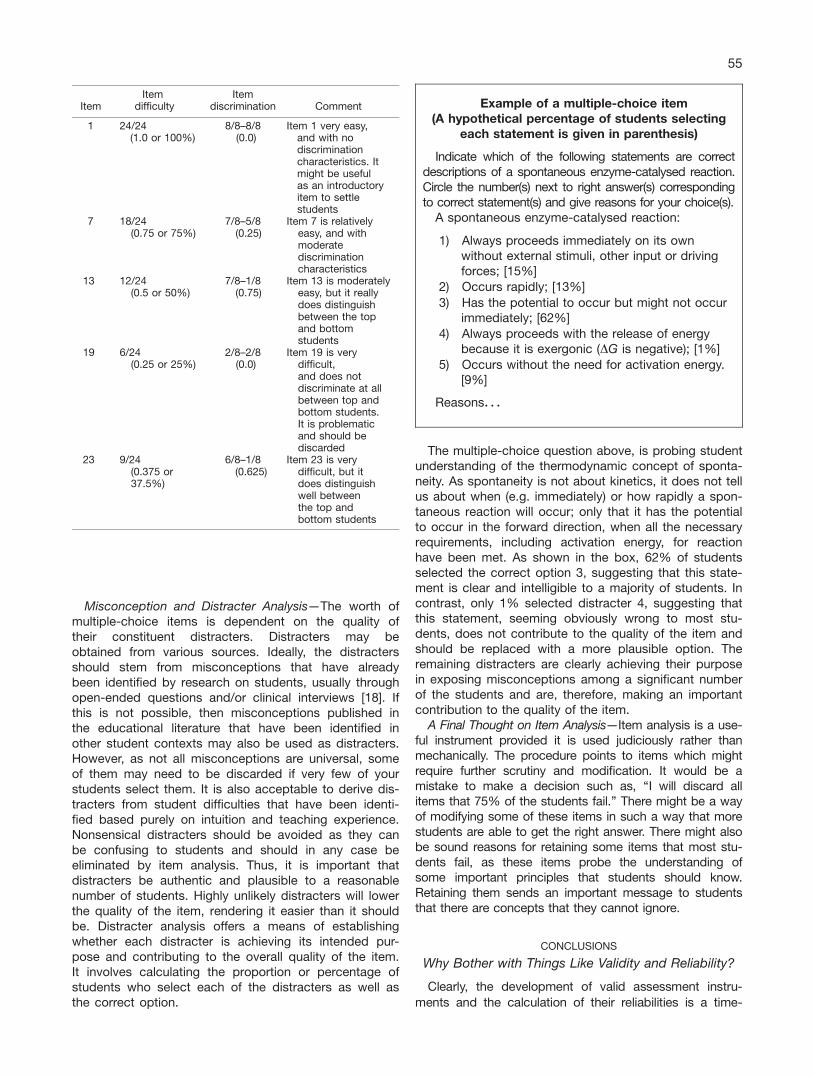
Misconception and Distracter Analysis—The worth ofmultiple-choice items is dependent on the quality oftheir constituent distracters. Distracters may beobtained from various sources. Ideally, the distractersshould stem from misconceptions that have alreadybeen identified by research on students, usually throughopen-ended questions and/or clinical interviews [18]. Ifthis is not possible, then misconceptions published inthe educational literature that have been identified inother student contexts may also be used as distracters.However, as not all misconceptions are universal, someof them may need to be discarded if very few of yourstudents select them. It is also acceptable to derive dis-tracters from student difficulties that have been identi-fied based purely on intuition and teaching experience.Nonsensical distracters should be avoided as they canbe confusing to students and should in any case beeliminated by item analysis. Thus, it is important thatdistracters be authentic and plausible to a reasonablenumber of students. Highly unlikely distracters will lowerthe quality of the item, rendering it easier than it shouldbe. Distracter analysis offers a means of establishingwhether each distracter is achieving its intended pur-pose and contributing to the overall quality of the item.It involves calculating the proportion or percentage ofstudents who select each of the distracters as well asthe correct option.
The multiple-choice question above, is probing studentunderstanding of the thermodynamic concept of sponta-neity. As spontaneity is not about kinetics, it does not tellus about when (e.g. immediately) or how rapidly a spon-taneous reaction will occur; only that it has the potentialto occur in the forward direction, when all the necessaryrequirements, including activation energy, for reactionhave been met. As shown in the box, 62% of studentsselected the correct option 3, suggesting that this state-ment is clear and intelligible to a majority of students. Incontrast, only 1% selected distracter 4, suggesting thatthis statement, seeming obviously wrong to most stu-dents, does not contribute to the quality of the item andshould be replaced with a more plausible option. Theremaining distracters are clearly achieving their purposein exposing misconceptions among a significant numberof the students and are, therefore, making an importantcontribution to the quality of the item.
A Final Thought on Item Analysis—Item analysis is a use-ful instrument provided it is used judiciously rather thanmechanically. The procedure points to items which mightrequire further scrutiny and modification. It would be amistake to make a decision such as, ‘‘I will discard allitems that 75% of the students fail.’’ There might be a wayof modifying some of these items in such a way that morestudents are able to get the right answer. There might alsobe sound reasons for retaining some items that most stu-dents fail, as these items probe the understanding ofsome important principles that students should know.Retaining them sends an important message to studentsthat there are concepts that they cannot ignore.
CONCLUSIONS
Why Bother with Things Like Validity and Reliability?
Clearly, the development of valid assessment instru-
ments and the calculation of their reliabilities is a time-
ItemItem
difficultyItem
discrimination Comment
1 24/24(1.0 or 100%)
8/8–8/8(0.0)
Item 1 very easy,and with nodiscriminationcharacteristics. Itmight be usefulas an introductoryitem to settlestudents
7 18/24(0.75 or 75%)
7/8–5/8(0.25)
Item 7 is relativelyeasy, and withmoderatediscriminationcharacteristics
13 12/24(0.5 or 50%)
7/8–1/8(0.75)
Item 13 is moderatelyeasy, but it reallydoes distinguishbetween the topand bottomstudents
19 6/24(0.25 or 25%)
2/8–2/8(0.0)
Item 19 is verydifficult,and does notdiscriminate at allbetween top andbottom students.It is problematicand should bediscarded
23 9/24(0.375 or37.5%)
6/8–1/8(0.625)
Item 23 is verydifficult, but itdoes distinguishwell betweenthe top andbottom students
Example of a multiple-choice item(A hypothetical percentage of students selecting
each statement is given in parenthesis)
Indicate which of the following statements are correctdescriptions of a spontaneous enzyme-catalysed reaction.Circle the number(s) next to right answer(s) correspondingto correct statement(s) and give reasons for your choice(s).
A spontaneous enzyme-catalysed reaction:
1) Always proceeds immediately on its ownwithout external stimuli, other input or drivingforces; [15%]
2) Occurs rapidly; [13%]
3) Has the potential to occur but might not occurimmediately; [62%]
4) Always proceeds with the release of energybecause it is exergonic (DG is negative); [1%]
5) Occurs without the need for activation energy.[9%]
Reasons. . .
55
consuming process. With many demands on our time,
what benefits might be derived from undertaking these
tasks? We would like to suggest four reasons. We would
also like to suggest that not all instruments are equally in
need of close scrutiny—priorities might need to be estab-
lished.First, it is the nature of science to strive for perfection.
It is conceivable that once a microscope was developedwith a 1003 magnification that biologists could havedecided, ‘‘good enough.’’ But this was not the case, andmore powerful microscopes in turn led to more insightfulresearch. So it is with assessment. Better assessmentcan lead to both better teaching and learning [2], and tobetter research.
Second, we have a legal and moral obligation toensure that high-stake assessment is both valid and reli-able. We place ourselves in an untenable situation if wefail a student on a final examination with a score of 59(assuming the pass mark to be 60) when subsequentresearch might show our instrument lacks reliability. If itwere to have a standard error of say 15, then the truescore of that student might well be 70.
Third, while the thrust of this article is on ways toimprove assessment, both formative and summative, atthe classroom level, there are other situations to con-sider. If an assessment instrument is used as part of a
research project, then it is imperative to show what stepswere taken to develop the instrument and what wasdone to ensure its validity and its reliability. Most peer-refereed journals in science education will require this in-formation for any article, where the results and conclu-sions are based on an assessment instrument.
Fourth, collaborating with colleagues, preferably ingroup sessions, in both the design of valid assessmentinstruments and the analysis of student results (e.g. reliabil-ity and item analysis) can be a stimulating form of profes-sional growth and development [2] that can lead to a com-mon teaching philosophy, improved cohesion betweencourses, more logical progression between educational lev-els, and comparable standards across programs.
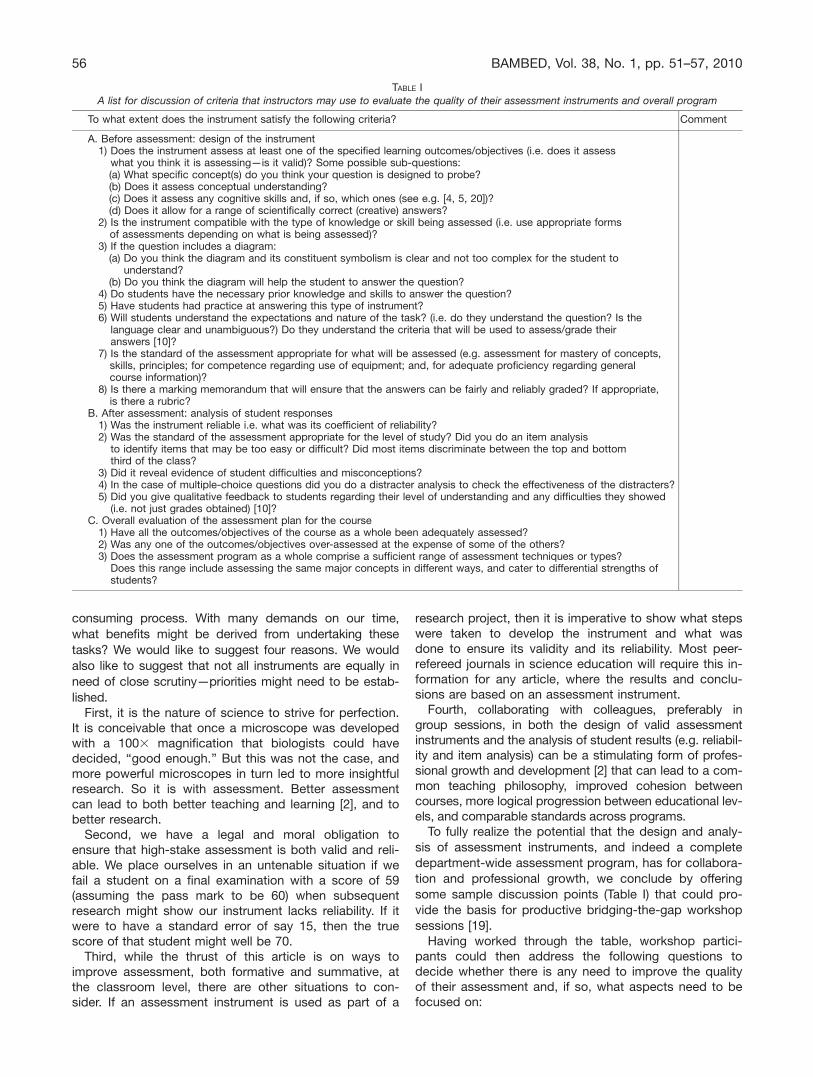
To fully realize the potential that the design and analy-sis of assessment instruments, and indeed a completedepartment-wide assessment program, has for collabora-tion and professional growth, we conclude by offeringsome sample discussion points (Table I) that could pro-vide the basis for productive bridging-the-gap workshopsessions [19].
Having worked through the table, workshop partici-pants could then address the following questions todecide whether there is any need to improve the qualityof their assessment and, if so, what aspects need to befocused on:
TABLE IA list for discussion of criteria that instructors may use to evaluate the quality of their assessment instruments and overall program
To what extent does the instrument satisfy the following criteria? Comment
A. Before assessment: design of the instrument1) Does the instrument assess at least one of the specified learning outcomes/objectives (i.e. does it assess
what you think it is assessing—is it valid)? Some possible sub-questions:(a) What specific concept(s) do you think your question is designed to probe?(b) Does it assess conceptual understanding?(c) Does it assess any cognitive skills and, if so, which ones (see e.g. [4, 5, 20])?(d) Does it allow for a range of scientifically correct (creative) answers?
2) Is the instrument compatible with the type of knowledge or skill being assessed (i.e. use appropriate formsof assessments depending on what is being assessed)?
3) If the question includes a diagram:(a) Do you think the diagram and its constituent symbolism is clear and not too complex for the student to
understand?(b) Do you think the diagram will help the student to answer the question?
4) Do students have the necessary prior knowledge and skills to answer the question?5) Have students had practice at answering this type of instrument?6) Will students understand the expectations and nature of the task? (i.e. do they understand the question? Is the
language clear and unambiguous?) Do they understand the criteria that will be used to assess/grade theiranswers [10]?
7) Is the standard of the assessment appropriate for what will be assessed (e.g. assessment for mastery of concepts,skills, principles; for competence regarding use of equipment; and, for adequate proficiency regarding generalcourse information)?
8) Is there a marking memorandum that will ensure that the answers can be fairly and reliably graded? If appropriate,is there a rubric?
B. After assessment: analysis of student responses1) Was the instrument reliable i.e. what was its coefficient of reliability?2) Was the standard of the assessment appropriate for the level of study? Did you do an item analysis
to identify items that may be too easy or difficult? Did most items discriminate between the top and bottomthird of the class?
3) Did it reveal evidence of student difficulties and misconceptions?4) In the case of multiple-choice questions did you do a distracter analysis to check the effectiveness of the distracters?5) Did you give qualitative feedback to students regarding their level of understanding and any difficulties they showed
(i.e. not just grades obtained) [10]?C. Overall evaluation of the assessment plan for the course1) Have all the outcomes/objectives of the course as a whole been adequately assessed?2) Was any one of the outcomes/objectives over-assessed at the expense of some of the others?3) Does the assessment program as a whole comprise a sufficient range of assessment techniques or types?
Does this range include assessing the same major concepts in different ways, and cater to differential strengths ofstudents?
56 BAMBED, Vol. 38, No. 1, pp. 51–57, 2010
1) How well do your assessment instruments meet thecriteria in Table I? Specify any areas of concern.
2) Would you make any changes to the way youdesign certain assessment instruments? If so,what specific changes would you make?
3) In what way do you think these changes wouldimpact on or improve teaching and student learn-ing?
A Final Point
The analysis techniques described in this article shouldbe accessible to all, and are perfectly adequate for theanalysis of the kind of assessment instruments typicallyused in departments in a science faculty. More rigoroustechniques, such as Rasch analysis [21, 22] and factoranalysis are available and often used in large-scale cur-riculum projects and international comparisons of scien-tific achievement.
Acknowledgment—Patricia McLean (University of KwaZulu-Natal, Pietermaritzburg) is thanked for English proofing the finalversion.
REFERENCES
[1] H. J. Sears, E. J. Wood (2005) Linking Teaching and Research inthe Biosciences, Bioscience Education E-journal, 5, available athttp://www.bioscience.heacademy.ac.uk/journal/vol5/beej-5–4.pdf(accessed June 14, 2009).
[2] T. R. Anderson (2007) Bridging the educational research-teachingpractice gap: The power of assessment, Biochem. Mol. Biol. Educ.35, 471–477.
[3] H. M. Anderson, J. Cain, E. Bird (2005) Online student course eval-uations: Review of literature and a pilot study, Am. J. Pharm. Educ.69, 34–43.
[4] T. R. Anderson, K. J. Schonborn (2008) Bridging the educationalresearch-teaching practice gap: Conceptual understanding, Part 1:The multifaceted nature of expert knowledge, Biochem. Mol. Biol.Educ. 36, 309–315.
[5] K. J. Schonborn, T. R. Anderson (2008) Bridging the educationalresearch-teaching practice gap: Conceptual understanding, Part 2:Assessing and developing student knowledge, Mol. Biol. Educ. 36,372–379.
[6] R. E. Mayer (2002) Rote versus meaningful learning, Theor. Pract.41, 226–232.
[7] M. Alonso, C. Stella, L. Galagovsky (2008) Student assessment inlarge-enrollment biology classes, Mol. Biol. Educ. 36, 16–21.
[8] T. M. Haladyna, S. M. Downing, M. C. Rodriguez (2002) A review ofmultiple-choice item-writing guidelines for classroom assessment,Appl. Meas. Educ. 15, 309–334.
[9] D. L. Carlson, P.A. Marshall (2009) Learning the science ofResearch, Learning the Art of Teaching: Planning Backwards in aCollege Genetics Course Bioscience Education, E-journal, Vol. 13,available at http://www.bioscience.heacademy.ac.uk/journal/volnn/beej-13–4.pdf (accessed June 14, 2009).
[10] O. Gioka (2007) Assessment for learning in biology lessons, J. Biol.Educ. 41, 113–116.
[11] T. R. Anderson (2004) Some guiding principles for assessment,Panel discussion at the 8th IUBMB and ASBMB Conference, Bos-ton, MA, USA, June 12–16, 2004.
[12] T. R. Anderson, M. J. Costa, S. Hamilton, D. W. Sears, J. Voet, D.Voet (2009) ASBMB/IUBMB Education Workshop on assessment ofstudent learning in biochemistry and molecular biology, 21st IUBMB& 12th FAOBMB International Congress, Shanghai, China, August2–8, 2009.
[13] L. W. T. Schuwirth, C. P. M. van der Vleuten (2004) Different writtenassessment methods: what can be said about their strengths andweaknesses? Med. Educ. 38, 974–979.
[14] L. W. T. Schuwirth, C. P. M. van der Vleuten (2003) ABC of learningand teaching in medicine: Written assessment, BMJ 326, 643–645
[15] The Assessment Design and Delivery System (ADDS), available athttp://adds.cse.ucla.edu/about.htm (accessed June 15, 2009).
[16] D. Allen, K. Tanner (2006) Rubrics: Tools for making learning goalsand evaluation criteria explicit for both teachers and learners, CBELife Sci. Educ. 5, 197–203.
[17] R. Nagata (2004) The use of item analysis for improvement of bio-chemical teaching, Biochem. Mol. Biol. Educ. 32, 167–169.
[18] D. J. Grayson, T. R. Anderson, L. G. Crossley (2001) A four-levelframework for identifying and classifying student conceptual andreasoning difficulties, Int. J. Sci. Educ. 23, 611–622.
[19] T. R. Anderson (2007) The importance of bridging the gap betweenscience education research and its application in biochemistryteaching and learning: barriers and strategies, Biochem. Mol. Biol.Educ. 35, 465–470.
[20] L. W. Anderson, D. R. Krathwohl, P. W Airasian, K. A. Cruikshank,R. E. Mayer, P. R. Pintrich, J. Raths, M. C. Wittrock, in L. W. Ander-son, D. R. Krathwohl, Eds. (2001) A Taxonomy for Learning, Teach-ing, and Assessing: A Revision of Bloom’s Taxonomy of EducationalObjectives (Complete edition), Longman, New York, 63–92.
[21] T. G. Bond, C. M. Fox (2007) Applying the Rasch Model: Funda-mental Measurement in the Human Sciences New Jersey, 2nd ed.,Lawrence Erlbaum Associates, Pub., Marwah, New Jersey.
[22] W. Boone, J. Rogan (2005) Rigour in quantitative analysis: Thepromise of Rasch analysis techniques. Afr. J. Res. Math. Sci. Tech-nol. Educ. 9, 25–38.
57