Embed Size (px)
Citation preview

Page 1 of 13
BRIDGES Of Pennsylvania’s more than 22,660 bridges, 23 percent are considered structurally deficient, which is the highest percentage in the nation. While safety is the most important concern, a bridge closure or weight restriction can impact both local and regional traffic and the economy of the region. The Commonwealth’s bridges are 10 years older than the national average and are in dire need of repair and modernization. In November of 2013, the Pennsylvania legislature passed Transportation Funding Bill Act 89, an unprecedented transportation funding package that will bring much needed investment to the Commonwealth’s transportation system. However, it will not be fully funded until 2019, so cannot yet have an effect on the current bridge report card. Unfortunately, even with the additional funding fully in place, it is estimated that approximately 40 percent of the needs for bridges in the Commonwealth will not be met in 2019. As noted in this report, the ASCE recently adopted a more robust set of criteria in assigning infrastructure grades nationally, and this section reflects this new methodology.
BACKGROUND
The economy and the quality of life in the Commonwealth of Pennsylvania (the Commonwealth) require a transportation system that provides a safe, reliable and efficient driving environment. The Commonwealth’s transportation system includes over 22,660 bridges, the third highest number of bridges in the nation, and over 114 million drivers pass over these bridges every day. These bridges are inspected a minimum of every other year and given numeric condition ratings based on the observed condition of the components (i.e. beams, deck slab, abutments, piers, etc.) to determine their physical condition.
If the main components of the bridge exhibit high levels of deterioration, the bridge is classified as Structurally Deficient (SD). While not unsafe, these bridges may require significant maintenance and rehabilitation, or replacement, and the owner must post limits for both speed and the weight of vehicles permitted to cross these bridges. The bridges are also evaluated in terms of outdated design features such as low traffic capacity, narrow lane and shoulder widths, lack of bicycle lanes or pedestrian accommodation, and low overhead or under-clearances. If the bridge does not meet the current standards for such features, the bridge is classified as Functionally Obsolete (FO). FO bridges are not automatically rated as SD, nor are they inherently unsafe;
Weight Restriction on a Structurally Deficient Bridge
Picture Courtesy of Gannett Fleming, Inc.
D+

Page 2 of 13
however, traffic congestion may result due to their inability to meet the demands of today’s traffic and/or their susceptibility to flooding.
CONDITION AND CAPACITY
Currently, of the Commonwealth’s 22,660 bridges1, nearly one in four (23 percent) is categorized as SD. This is the highest percentage compared to the national average of 11 percent. In addition, nearly one in five (19 percent) of Pennsylvania’s bridges is categorized as FO, compared with a national average of 14 percent. State, county, local, private, and authority (Pennsylvania Turnpike) bridges are included in these percentages. Moreover, on average more than 16 million vehicles cross the Commonwealth’s SD bridges every day, which makes the Commonwealth the fourth state with the highest number of vehicles travelling on SD bridges in the nation.
The total percentage of SD bridges has decreased by 4 percent since the 2010 report card, largely due to a short-term increase in funding. Funding increased due to the Accelerated Bridge Program that the Pennsylvania Department of Transportation (PennDOT) undertook between 2008 and 2010, as well as the Pennsylvania Act 44 of 2007 and the federal American Reinvestment and Recovery Act of 2009 (ARRA). Although the Commonwealth still has the highest percentage of SD bridges in the nation, investment and attention to this statistic is having a positive impact on bridge safety across the Commonwealth.
Still, approximately 300 bridges are added to the SD category each year due to age and deterioration. The Commonwealth has nearly 6,400 locally owned bridges and approximately one-third are SD.
To reach the national average of SD bridges, PennDOT and other local jurisdictions in the Commonwealth need to reduce the total number of SD bridges to approximately
1 Only bridges with 20-foot or longer span were considered, as this is consistent with the Federal Highway
Administration’s (FHWA) definition of a “bridge”.
Page 3 of 13
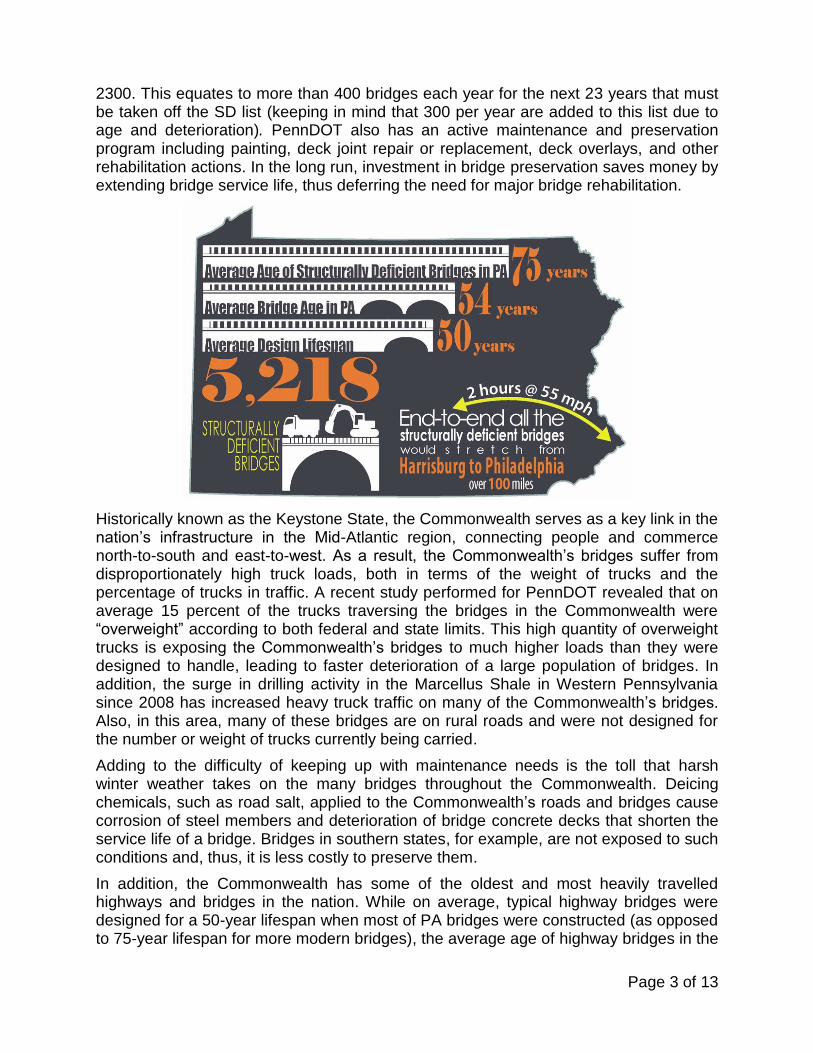
2300. This equates to more than 400 bridges each year for the next 23 years that must be taken off the SD list (keeping in mind that 300 per year are added to this list due to age and deterioration). PennDOT also has an active maintenance and preservation program including painting, deck joint repair or replacement, deck overlays, and other rehabilitation actions. In the long run, investment in bridge preservation saves money by extending bridge service life, thus deferring the need for major bridge rehabilitation.
Historically known as the Keystone State, the Commonwealth serves as a key link in the nation’s infrastructure in the Mid-Atlantic region, connecting people and commerce north-to-south and east-to-west. As a result, the Commonwealth’s bridges suffer from disproportionately high truck loads, both in terms of the weight of trucks and the percentage of trucks in traffic. A recent study performed for PennDOT revealed that on average 15 percent of the trucks traversing the bridges in the Commonwealth were “overweight” according to both federal and state limits. This high quantity of overweight trucks is exposing the Commonwealth’s bridges to much higher loads than they were designed to handle, leading to faster deterioration of a large population of bridges. In addition, the surge in drilling activity in the Marcellus Shale in Western Pennsylvania since 2008 has increased heavy truck traffic on many of the Commonwealth’s bridges. Also, in this area, many of these bridges are on rural roads and were not designed for the number or weight of trucks currently being carried.
Adding to the difficulty of keeping up with maintenance needs is the toll that harsh winter weather takes on the many bridges throughout the Commonwealth. Deicing chemicals, such as road salt, applied to the Commonwealth’s roads and bridges cause corrosion of steel members and deterioration of bridge concrete decks that shorten the service life of a bridge. Bridges in southern states, for example, are not exposed to such conditions and, thus, it is less costly to preserve them.
In addition, the Commonwealth has some of the oldest and most heavily travelled highways and bridges in the nation. While on average, typical highway bridges were designed for a 50-year lifespan when most of PA bridges were constructed (as opposed to 75-year lifespan for more modern bridges), the average age of highway bridges in the

Page 4 of 13
Commonwealth is now approximately 54 years. This is more than ten years older than the national average. Also, the average age of the SD bridges in the Commonwealth is 75 years.
SD bridges can lead to weight restrictions, or “bridge postings”, particularly if the bridge is deemed to be incapable of carrying legal truck loads. These weight restrictions contribute to traffic disruptions, such as detours and traffic congestion, and pose inconveniences for commercial vehicles and school buses which may be forced to take lengthy detours. When Pennsylvania’s bridges are posted, the economy of the region is directly impacted since lengthier transportation routes cost both drivers and businesses more. In addition to load capacity issues, the high percentage of functionally obsolete bridges in the Commonwealth indicates that the capacity for traffic (bridge width) or under-clearance of many bridges in the state is inadequate. The only practical way to solve this problem is through bridge replacement or major rehabilitation.
At current and projected levels of state funding, more than 95 percent of transportation dollars are exhausted in keeping the existing system functional, leaving very little funding for capacity-adding projects. In addition, funding level for capacity-adding projects has dropped significantly over the past few years as shown in Figure 1.
Capacity-adding projects include wider highways and bridges as well as new highways, bypasses and bridges. As is the case with many states, the focus has shifted to maintenance of the existing bridges in the Commonwealth, as PennDOT struggles to the maintain highway mileage that currently exists with limited funding. Over time, this unsustainable trend will result in a highway system that is unable to meet the demands of continued increase in the traffic volumes.
Fig
ure
1:
Fu
nd
ing
Le
ve
ls f
or
Ca
pa
cit
y A
dd
ing
P
roje
cts
S
OU
RC
E:
Pe
nn
sylv
an
ia T
ran
sp
ort
ati
on
P
erf
orm
an
ce R
ep
ort
20
13

Page 5 of 13
FUNDING AND FUTURE NEEDS
Pennsylvania’s aging transportation infrastructure has suffered from decades of under-investment, due to rising construction costs and limited tax revenues associated with fuel consumption. The revenue to operate, maintain and preserve the Commonwealth’s roads and bridges comes primarily from state and federal taxes on motor fuel. Unlike other states, contrary to public perception, income and sales taxes are not used to pay for roads and bridges in Pennsylvania. Funding in the Commonwealth comes from these resources:
General funds
The liquid fuels (gasoline) tax
Vehicle registration fees
Driver license fees
Cars today are more fuel efficient due to the new federal Corporate Average Fuel Economy (CAFE) standards. Vehicles are now using less gasoline per mile travelled; therefore, the Commonwealth now collects less fuel tax revenue per mile traveled than it has at any time in the past. While providing environmental benefits, the increase of hybrid and alternative fuel vehicles has also inadvertently hurt the revenue stream to repair roads and bridges. These vehicles contribute the same level of wear and tear as a gas powered vehicle, but they are not paying an equal share since they are purchasing less gasoline. When adjusted for inflation, the total gas tax paid by the average driver has decreased more than 60 percent since about 1970 (as shown in Figure 2), while the cost of construction and maintenance continues to increase with inflation.
This has led to a serious decline in the amount of money available for improvements to the transportation system, leading to a growing funding gap as shown in Figure 3.
Fig
ure
2:
Mo
nth
ly M
oto
r F
uel
Ta
x P
aid
by t
he
A
ve
rag
e D
rive
r b
y Y
ea
r in
201
0 D
oll
ars
S
ou
rce
: T
ran
sp
ort
ati
on
Fu
nd
ing
Ad
vis
ory
C
om
mis
sio
n R
ep
ort
, A
ug
us
t 2
01
1

Page 6 of 13
The Commonwealth has the fifth-largest state-owned roadway network in the nation, but transportation fees and taxes that fund the highways and bridges are considerably lower compared to the other states and have not increased since 1970s:
39 other states have vehicle registration fees higher than Pennsylvania,
31 other states have higher driver’s license fees, and
14 other states have higher gas taxes.
Some temporary increases in funding were experienced through the Accelerated Bridge Program as well as Act 44 and ARRA, but these all had been short-term increases. Funding for bridges in the Commonwealth has generally been on the decline. As a result, money spent on bridge construction projects has dropped from a high of $1.02 billion in 2009 to $619 million in 2012. The continued underinvestment in transportation systems for so many years has posed a serious threat to PennDOT’s ability to maintain bridges in a state of good repair.
In June 2013, the State Senate approved a bipartisan transportation spending plan of $2.3 billion, and the House passed an amended version of the bill in November 2013. The new transportation funding plan (Transportation Funding Bill Act 89) was signed into law by Governor Corbett on November 25, 2013. The plan will provide an additional $2.3 billion (for all modes of transportation) by 2019. In 2019, the additional amount to be allocated specifically for improving state roads and bridges is estimated to grow to $1.3 billion plus an additional $237 million for local roads and bridges and limited budget for gravel and dirt roads. With the passage of this historic funding bill, Pennsylvania will experience a significant improvement in the long term and a comprehensive and sustainable funding for its transportation system. However, it should be stated that, even with the Transportation Funding Bill Act 89 fully in place, it is estimated that approximately 40 percent of the funding needs for bridges in the Commonwealth will still not be met in the fifth year of the plan (2019).
Fig
ure
3:
Pe
nn
sylv
an
ia’s
Tra
ns
po
rtati
on
Fu
nd
ing
N
ee
ds
So
urc
e:
Tra
ns
po
rtati
on
Fu
nd
ing
Ad
vis
ory
C
om
mis
sio
n R
ep
ort
, A
ug
us
t 2
01
1
(CA
FE
= C
orp
ora
te A
ve
rag
e F
ue
l E
co
no
my)

Page 7 of 13
The evidence suggests that there is high return for transportation investments. According to a Federal Highway Administration (FHWA) study in 2008, each dollar spent on road, highway, and bridge improvements results in an average benefit of $5.20 in the form of reduced vehicle maintenance costs, reduced delays, reduced fuel consumption, improved safety, reduced road and bridge maintenance costs, and reduced emissions as a result of improved traffic flow.
Increasing investments in Pennsylvania’s roads, highways, and bridges will also boost the state’s economy by creating jobs. A 2007 analysis by FHWA found that every $1 billion invested in highway and bridge construction would support approximately 27,800 jobs. The additional $2.3 billion investment in the Commonwealth’s transportation system is expected to generate 50,000 new jobs, in addition to preserving 12,000 existing jobs. As a result, Pennsylvania will remain economically competitive with the other states in the region which have already made investments in their transportation system,
such as New Jersey, Maryland and Virginia.
In addition, PennDOT is also seeking ways to stretch limited dollars. The agency is going through a transformation to improve efficiency through its “Next Generation” processes, which is anticipated to save $1 billion. In addition, Act 88, the Public and Private Partnerships (P3) for Transportation Act, was signed into law in July 2012 by Governor Corbett. This law allows PennDOT to partner with private companies to finance and maintain transportation-related projects. With the P3 approach, PennDOT is now pursuing replacement of more than 500 SD bridges in the Commonwealth with similar design, bundled into a Rapid Bridge Replacement Project. In this approach, design and construction costs are expected to be reduced since the design and construction will be standardized for all the bridges in the bundle. This means less traffic interruption, fewer lane closures, and safer and more reliable connection of people to their homes, workplaces, schools, and communities.
Road and Bridge Construction Workers Picture from PennDOT Local Technical
Assistance Program

Page 8 of 13
OPERATION AND MAINTENANCE
The ability of an owner to effectively maintain infrastructure in compliance with government regulations is dependent on the processes and funding streams. The major bridge owners in the Commonwealth include PennDOT (with 80.6 percent of bridge population) and the Pennsylvania Turnpike Commission (with 3.2 percent of bridge population). The remainder of bridges in the Commonwealth are locally owned by cities and municipalities.
The major bridge owners in the Commonwealth have identifiable maintenance programs and funding sources. PennDOT has instituted excellent policies and procedures for prioritizing
maintenance needs. Maintenance needs are identified and prioritized through routine bridge inspections. Likewise, the Pennsylvania Turnpike Commission has a different yet equally disciplined system for determining maintenance needs for a relatively small population of bridges. The Turnpike Commission has an established budget for “contracted maintenance” at $5,000,000 per year using the mechanism of unit price contracts and other “routine maintenance items” which are programmed through an internal computerized system. Maintenance needs are evaluated with each inspection cycle. Based on available budgeting information, the major bridge owners spend within a range of $2,000 to $5,000 per bridge per year on routine maintenance.
The minor bridge owners include significant population center owners (Pittsburgh/Philadelphia with 2.3 percent of bridge population) and other local bridge owners (comprising various cities, counties and other municipalities with 13.9 percent of bridge population in aggregate), accounting for 16.2 percent of the bridge population. These owners are underfunded with respect to maintenance allotments. They most likely defer maintenance until load postings, closures or capital improvements are made. Based on available budgeting information, minor bridge owners spend less than $800 per bridge per year on routine maintenance.
PUBLIC SAFETY
All bridges must conform to Federal and Pennsylvania bridge design specifications. These regulations ensure all bridges are designed to meet a minimum level of safety for the bridge to serve at least 75 years based on the more modern design and construction practices (as opposed to 50 years effective lifespan for bridges designed prior to 1980s).
Comparing to some other states, the bridge inspection system in the Commonwealth is robust. PennDOT has developed its own bridge inspection training course, and it
Bridge Closed for Repair and Maintenance Picture Courtesy of Intelligent Infrastructure
Systems (IIS)

Page 9 of 13
requires inspectors to take a “refresher” course every two years. This training goes above and beyond Federal requirements. PennDOT also has a rigorous quality assurance program for its inspection efforts where a sample of structures in each maintenance district is ”re-inspected,” and the condition ratings are compared to the original inspection to ensure that assigned condition ratings are well within tolerance. For state-owned bridges, PennDOT performs an inspection for all structures 8 feet or greater in length even though Federal guidelines only require inspections for highway bridges of 20 feet or longer on a biennial basis.
In an effort to extend the life of bridges throughout the Commonwealth, and because of the uncertainty in bridge repair funding, PennDOT authorized new or added weight restrictions on 1,000 SD bridges across the Commonwealth according to the new Risk Based Posting program. This was necessary because the lack of funding had diminished PennDOT’s ability to repair or replace these bridges. The program implements more strict weight restriction criteria which recently resulted in the posting of 530 state-owned and 470 locally-owned bridges.
Closed or posted bridges have contributed to a statewide average detour length of 12 miles for this group of bridges. This means that school buses and delivery vehicles have to travel longer distances, leading to more expensive transportation of goods and longer commutes. However, when gauging the outcomes of the new weight restrictions, it should be noted that restricting the weight of trucks on a bridge does not improve the condition of the bridge, but it extends the life of the bridge in its current condition. In other words, it helps with preservation efforts by reducing the deterioration of the bridge due to heavy trucks.
Based on the records of significant bridge failures since 1950 in the US, no death has occurred as a result of the collapse of highway bridges in Pennsylvania. However, in 2005 a 50-feet section of concrete beam carrying Lakeview Drive in Washington County collapsed onto I-70 and some motorists suffered minor injuries when their minivan slid into the beam moments after it fell. This incident prompted PennDOT to set more strict inspection criteria for this type of concrete beam, not allowing this system to be used for new designs and adding the existing bridges with this system to the list of SD bridges.
Although the Commonwealth still ranks highest in the nation in terms of SD bridges, this may not directly compromise the public safety, since the deficient bridges are inspected routinely and posted at a lower load capacity as required by PennDOT. Nevertheless, this still is an indication of an aging system where potential safety problems must be closely monitored.
RESILIENCE
Resilience can be defined as the ability of a bridge to stay in service during or after a catastrophic event or disruption of service in the bridge network. The Commonwealth ranks in the top 14 states in the nation for the number of Fracture Critical (FC) bridges. FC bridges may not pose a significant risk directly, but they have at least one member whose failure would cause a portion of the bridge or the entire bridge to collapse. These structures were used for long span bridges during the expansion of the interstate highway system in the 1960s and 1970s, prior to the widespread recognition of the

Page 10 of 13
vulnerability of such systems. This represents a lack of redundancy in the bridge network that makes the Commonwealth’s bridge system less resilient.
Because 19 percent of the Commonwealth’s bridges are FO, the bridge network’s ability to handle major traffic incidents is decreased. As stated previously, the Commonwealth has the highest percentage of SD and posted bridges in the nation, and when bridges are posted, getting emergency equipment to the location where help is needed to recover from incidents is difficult.
The Commonwealth also has a significant number of waterways that are prone to flooding. In the past 5 to 10 years, the Commonwealth has seen significant damage to bridges due to floods. Some flooding has also caused scour issues where supporting foundation material is removed from the bridge, and damage has been caused from trees and other debris impacting structures during a flood. The Commonwealth is in a low earthquake risk area compared to other portions of the U.S., but there has been seismic activity within the Commonwealth. Due to the age of the system, many of the Commonwealth’s bridges were not
designed for extreme events like floods and earthquakes. Some critical bridges in major metropolitan areas are also vulnerable to terrorist attacks and should be structurally strengthened to resist this possibility. All of these factors reduce the resilience of the bridge network in the Commonwealth.
INNOVATION AND TECHNOLOGY
In recent years, bridge owners, including federal and state governments, are beginning to see value in supplementing of traditional bridge engineering practices with the implementation of various technologies in certain situations. These technology-based applications, such as structural health monitoring, non-destructive evaluation, sensing and simulation, as well as geometry capturing and image processing, may lead to cost savings in some situations while assuring the efficiency, effectiveness and reliability of aging infrastructure. However, these technologies are not appropriate in all situations or even in the majority of situations. Technology should be implemented when needed, and only when the cost of technology is balanced by the potential benefit of the information obtained.
In recent years, PennDOT has started utilizing a number of advanced testing and monitoring methods to optimize inspection, evaluation, and rehabilitation of its bridges. Examples of these are laser sensors (or so called LiDAR) to monitor movement of walls and bridges, as well as infrared thermo graphic technologies to detect splitting under the surface of the deck which will eventually lead to surface cracks, spalls or even potholes.
Damage to a Bridge due to Flood
Picture Courtesy of PennDOT

Page 11 of 13
In addition, PennDOT, in conjunction with other federal, state agencies and universities, has continuously supported high profile research projects such as FHWA Long Term Bridge Performance Program (LTBP) and funded other academic research projects to improve bridge design, construction and preservation practice in the Commonwealth.
The Commonwealth has also taken a significant lead in the development of sophisticated bridge design software. The construction practice in the Commonwealth employs state-of-the-practice methods and approaches in order to save time and money in construction projects, such as Accelerated Bridge Construction (ABC). In addition, PennDOT is one of a few state DOTs with a robust Transportation Asset Management practice. If the Commonwealth continues to adopt modern planning, design, construction and monitoring techniques, it will be one of the pioneers in technology applications for design, construction, maintenance and management of transportation assets in the nation.
RECOMMENDATIONS
With this information in mind, the Bridges Committee, with the concurrence of the four Pennsylvania ASCE sections, has the following recommendations:
Continue to target the most critical Structurally Deficient bridges by prioritizing the maintenance, repair, and replacement projects.
Improve efforts to enforce State and Federal truck weight limits to minimize unnecessary damage to bridges due to unpermitted overweight vehicles.
Advocate for additional long-term federal and state funding programs for bridges to deliver consistent, reliable funding that is adjusted for inflation. This additional funding is needed to maintain and improve the condition of bridges in the Commonwealth. Transportation funding should also be coordinated with all available Local, State and Federal sources to leverage total funding and investments. Also, owners and agencies should advocate for a user fee that is not based on fuel consumption, but instead based on vehicle miles travelled (VMT).
Improve maintenance record transparency for more effective allocation of maintenance funds.
Continue strict risk-based weight limitation policies to maintain public safety in light of the aging population of bridges.
Continue the rigorous bridge inspection program that is in place. Consider national initiatives to put more inspection effort into aging and vulnerable structures, while putting less effort into simpler structures that are in better condition.
Increase resilience of the Commonwealth’s bridge population by gradually replacing or strengthening the fracture-critical bridges and by replacing aging bridges with structures that are less vulnerable to catastrophic events.
Encourage and continue supporting innovative and efficient project delivery methods such as Public Private Partnership (P3) projects, or bundling of multiple bridge projects to increase efficiency in design and construction.
Page 12 of 13
Continue investigating the latest technological advancements in Structural Health Monitoring (SHM), Non-Destructive Evaluation (NDE), Sensing and Simulation or other PennDOT-approved innovations to better evaluate the current condition and capacity of the bridge population and supplement the conventional bridge design, inspection and maintenance practice in the case of major, long-span, movable, or complex system bridges. These technologies can also be utilized in identifying of and programming for maintenance needs.
Investigate prequalifying contractors based on their ability to handle new technologies and by their familiarity with new construction techniques, in addition to awarding construction projects based on the lowest bid.
SOURCES
American Society for Civil Engineers (ASCE), 2010 Report Card for Pennsylvania’s Infrastructure: 2010. Available at http://www.infrastructurereportcard.org.
City of Philadelphia, PA, The Mayor’s Operating Budget in Brief for Fiscal Year 2012: 2012. Available at http://www.phila.gov/finance/pdfs/Mayors%20Operating%20Budget%20in%20Brief%20FY%202012%20App%20%206-11%20(2).pdf.
City of Pittsburgh, PA, Dept. of Public Works, Bureau of Operations, Budget 2012: 2012. Available at http://www.city.pittsburgh.pa.us/main/assets/budget/2012/2012-Budget.pdf
County of Allegheny, PA, 2012 County Budgets Report: 2012. Available at http://www.county.allegheny.pa.us/budget/2012/2012Operating.pdf
FHWA, 2008 Status of the Nation's Highways, Bridges, and Transit: Conditions and Performance: 2008. Available at http://www.fhwa.dot.gov/policy/2008cpr/
FHWA, Employment Impacts of Highway Infrastructure Investment: 2012. Available at http://www.fhwa.dot.gov/policy/otps/pubs/impacts/index.htm.
FHWA, Fracture Critical Inspection Techniques for Steel Bridges. Publication No. FHWA-NHI-11-051
FHWA, National Bridge Inventory (NBI) Highway Bridge Database: 12/31/2012. Available at http://www.fhwa.dot.gov/bridge/nbi/ascii.cfm.
PennDOT, 2012 Annual Report: 2012. Available at http://www.dot.state.pa.us.
PennDOT, Office of Policy & Public Private Partnerships: 2013. Available at http://www.p3forpa.pa.gov.
PennDOT, PennDOT Next Generation: 2013. Available at http://www.moderndot.pa.gov.
PennDOT, Publication 238: Bridge Safety Inspection Manual: 2010. Available at ftp://ftp.dot.state.pa.us/public/PubsForms/Publications/PUB%20238.pdf
PennDOT, Secretary Schoch’s Presentation on Risk Based Postings: 2013. Available at ftp://ftp.dot.state.pa.us/public/pdf/InfoBridge/RiskBasedPostingspresentation.pdf.
Pennsylvania Governor’s Budget Office, Governor's Executive Budget 2012-13: 2012. Available at http://www.budget.state.pa.us/portal/server.pt/community/past_budgets/4571
Page 13 of 13
Pennsylvania State Transportation Advisory Committee, Transportation Funding Study: May 2010. Available at http://pasenategop.com/committees/transportation/PDF/2010/TAC-report.pdf.
Pennsylvania State Transportation Commission (STC), Pennsylvania Transportation Performance Report: 2013. Available at http://www.talkpatransportation.com/docs/TPR%20FINAL%202-7-13_sm.pdf.
Transportation Funding Advisory Commission, Final Report: August 2011. Available at http://www.tfac.pa.gov.
TRIB Live News, Bridge over I-70 Collapses; Section of Highway Closed: Wednesday, Dec. 28, 2005. Available at http://triblive.com/x/valleyindependent/news/s_408248.html#axzz2lljV6Amv
ASCE POLICY STATEMENTS
ASCE Policy Statement 208: Bridge Safety (PS 208)
ASCE Policy Statement 382: Transportation Funding (PS 382)
ASCE Policy Statement 400: Design-Build Procurement (PS 400)
ASCE Policy Statement 404: Endorsement of Infrastructure Projects (PS 404)
ASCE Policy Statement 434: Transportation Trust Funds (PS 434)
ASCE Policy Statement 451: Life Cycle Cost Analysis (PS 451)
ASCE Policy Statement 496: Innovative Financing for Transportation Projects (PS 496)
ASCE Policy Statement 497: Surface Transportation Research Funding (PS 497)
ASCE Policy Statement 526: Public-Private Partnerships (PS 526)