Embed Size (px)
Citation preview

BRIDGE-SCOUR DATA FOR THE HIGHWAY 101 BRIPGE OVER ALSEA RIVER ESTUARY AT WALDPORT, OREGON - 1988-90
By Milo D. Crumrine
U. S. GEOLOGICAL SURVEY Open-File Report 91-531
Prepared in cooperation withOREGON DEPARTMENT OF TRANSPORTATION
Portland, Oregon 1992

U. S. DEPARTMENT] OF THE INTERIOR
MANUEL LUJAN, JR., Secretary
U.S. GEOLOGICAL SURVEY
Dallas L. Pej:k, Director
For additional information write to:
District ChiefU.S. Geological Survey, WRD 10615 S.E. Cherry Blossom Drive Portland, Oregon 97216
Copies of this report can be purchased from:
U.S.'Geological Survey Books and Open-File Reports Section Federal Center, Box 25425 Denver, Colorado 80225

CONTENTPage
Abstract.............................................................._ 1Introduction .................................................................................................................................................... 1
Purpose and Scope .............................................................................................................................. 1Acknowledgments ......................................................................................................................................... 1Location of sites............................................................................................................................................... 2Data Collection ............................................................................................................................................... 2
Stage, velocity, and discharge............................................................................................................ 2General, constriction, and local scour............................................................................................... 2Suspended-sediment and bed material............................................................................................ 4
Methods of data collection............................................................................................................................. 5Data storage .................................................................................................................................................... 5Illustrations and tables................................................................................................................................... 5References........................................................................................................................................................ 9
ILLUSTRATIONS
Figure 1. Area map showing study locations in the Alsea River Estuarynear Waldport, Oregon........................................................................................................... 3
2. Plan view of of Highway 101 bridge, monitoring locations, and constructiontrestle at Alsea Bay, Oregon.................................................................................................... 4
3. Bed elevations at bent 4, and reference location ........................................................................ 114. Gage height and scour-hole elevation data at bent 4, July 1-4 and September 1-4,1989...... 135. Scour-hole elevations at bent 3 ..................................................................................................... 156. Gage height and scour-hole-elevation data at bent 3 for
May 5-9,1990 ........................................................................................................................... 167. Cross sections at Alsea Bay, 600 feet west of the old
Highway 101 Bridge piers ..................................................................................................... 178. Cross sections at Alsea Bay, 300 feet east of the old
Highway 101 Bridge piers ..................................................................................................... 189. Cross sections at Alsea Bay, 20 feet west of the old
Highway 101 Bridge piers ..................................................................................................... 1910. Mean daily discharge for Alsea River near Tidewater for water years 1988-90 ................. 2111. Water levels during high flow of the Alsea River at
Waldport, Drift Creek Landing, and Kozy Kove, January 6-8,1990 ............................... 2212. Water levels during low flow of the Alsea River at
Waldport, Drift Creek Landing, and Kozy Kove, August 1-3,1989 ................................ 22
m

TABLES
1. Begin and end dates and accuracy of continuous 15-minute data that will be stored in the Bridge Scour Data Base System ...........................................
2. Dates for cross-sectional measurements of the Alsea River atWaldport, Oregon...............................................................................................
3. Scour-hole bed elevations for northeast corner of bent 4, Alsea Riverat Waldport..........................................................................................................
4. Scour-hole bed elevations for southeast corner of bent 4, Alsea Riverat Waldport..........................................................................................................
5. Daily scour-hole bed elevations for southwest corner of bent 4, AlseaRiver at Waldport................................................................................................
6. Bed elevations for 40 feet east of bent 4, Alsea River at Waldport...................7. Scour-hole bed elevations for southeast corner of bent 3, Alsea
River at Waldport................................................................................................8. Maximum and minimum daily water levels for Alsea River at
Waldport..............................................................................................................9. Maximum and minimum daily water levels for Alsea River
at Waldport..........................................................................................................10. Maximum and minimum daily water levels for Alsea River at Kozy Kove
near Waldport, river mile 11.2 ..........................................................................11. Discharge measurements taken in the Alsea River Estuary............................
Page
24
25
2831
33
35
41
4448
CONVERSION FACTIORS AND VERTICAL DATUM
Multiply
inch (in) foot (ft) mile (m)
acre acre square mile (mi2) square mile (mi2)
cubic foot (ft3)
cubic foot per second (ft3 /s) gallon per minute (gal/min)gallon per minute (gal/min)
By To obtain
LENGTH
25.4 millimeter 0.3048 meter 1.609 kilometer)
AREA
4,047 0.407
259.0 2.590
VOLUME
0.02832
FLOW
0.02832 0.063080.002228
square meter hectare (ha)hectare (ha) square kilometer (km2)
cubic meter (m3)
cubic meter per second (m3/s) liter per second (L/s)cubic foot per second (ft3 /s)
SEA LEVEL: In this report "sea level" refers to the National Geodetic Vertical Datum of 1929 (NGVD of 1929) a geodetic datum derived from a general adjustment of the first-order level nets of both the United States and Canada, formerly called Sea Level Datum of 1929.
IV

BRIDGE SCOUR DATA FOR THE HIGHWAY 101 BRIDGE OVER ALSEA RIVER ESTUARY AT WALDPORT, OREGON - 1988-90
By Milo D. Crumrine
ABSTRACT
This report is a compilation of streambed scour and hydraulic data collected prior to and during the construction of a new bridge over the Alsea River Estuary at Waldport, Oregon. These data were collected in cooperation with the Oregon Department of Transportation for the purpose of determining maximum scour around cofferdams and bents of the Highway 101 Bridge (under construction) over Alsea Bay. Data collected includes (1) continuous water-level record of Alsea River at river mile 1.1,5.0, and 11.2, (2) periodic continuous record of ebb and flood-tide velocities in the vicinity of bent 4 of the new bridge, (3) continuous record of bed elevations of Alsea Bay and selected scour holes at bent 3 and bent 4, (4) periodic cross-section measurements at several locations in the vicinity of the Highway 101 Bridge, (5) suspended sediment and bed-load sample results, and (6) cross sections at approximately 1 mile intervals from the mouth of Alsea River to river mile 12.5.
INTRODUCTION
Scour around bridge piers and abutments is a serious problem in many rivers and estuaries. Bridge failure is commonly caused by scour which undermines piers or abutments. Few data are available that document scour around bridge piers in estuaries. A bridge under construction from 1989 to 1991 at Alsea Bay near Waldport, Oregon, provided an excellent opportunity to collect data on bridge scour before, during and after construction.
The U.S. Geological Survey (USGS), in cooperation with Oregon Department of Transportation (ODOT), Bridge Section, started a project in 1988 to study scour through the construction period, in the vicinity of the new Highway 101 Bridge over Alsea Bay.
Purpose and Scope
The purpose of this report is to present data that documents the magnitude of scour around cofferdams and bents of a bridge under construction and to present associated data describing water- surface elevation, velocity, suspended sediment, and bed load. This report presents the types of data collected, the methods of collection, what data are available, and where the data can be obtained.
Acknowledgments
The author would like to acknowledge the Bridge Section of Oregon Department of Transportation, in particular, Tom Lulay and Dave Bryson for their support and interest in this project. The author would also like to thank George Hopkins, Phil Rabb and their crew at the Oregon Department of Transportation Bridge Office at Waldport for their help in surveying, monitoring equipment, and serving as liaison with the contractors and the USGS. Thanks also to General Construction, the contractors for the Waldport Bridge, for their willingness to help in this data collection effort.

LOCATION OF SITES
The study area is located near the mouth of the Alsea River, which flows into the Pacific Ocean at Waldport, Oregon. The bridge being studied is currently (1991) under construction and is located about 100 ft (feet) upstream from the old Highway 101 Bridge at Waldport, Oregon, at river mile (RM) 1.10 (fig. 1).
The initial data collection site was located at pier 6 of the old bridge. Data collected at this site arewater surface elevation, flood,and ebb tide velocities (fig. 2). After construction of bent 4 of the new bridgebegan, another data-collection site was established on the work trestle near the northeast corner of bent 4, and was used to collect ebb-tide velocities, reference bed elevations, and scour-hole elevations at the northeast, southeast, and southwest corners of bent 4. Two water surface elevation sites were established upstream at RM 5.0 and 11.2 (fig. 1). Another site was established at bent 3 to collect scour-hole-elevation data. Data collected at bent 3 was compared with data from bent 4 to evaluate spatial variability of scour between these two locations.
DATA COLLECTION
Stage, Velocity, and D| ischarge
Water surface elevation in Alsea Bay was measured at three locations to define the tidal prism of the estuary: at Highway 101 Bridge (RM 1.1), at confluence of Drift Creek (RM 5.0), and at Kozy Kove (RM 11.2). Ebb and flood-tide velocity was monitored at the Highway 101 Bridge in the main portion of flow near bent 4. Periodic water discharge measurements were made to determine tidal flux. Measurements were made near the mouth of Alsea Bay during ebb and flood tides. One discharge measurement was made near the new bridge location during maximum high-tide conditions, and one measurement was made at RM 5.0, upstream from the main body of the estuary. Additional discharge data were available at the Alsea River near Tidewater streamflow measuring station at RM 21.0, about 8 miles upstream from the tidally affected area.
General, Contraction, and. Local Scour
Scour that occurs around bridge piers is a combination of three types of scour (Jarrett and Boyle, 1986): (1) general scour or fill, that is degradation or aggradation of the streambed under normal conditions;(2) contraction scour caused by the presence of the bridge athus causing an increased velocity and degradation of the s local scour, caused by local disturbances of the flow, such a abutments. Scour around bridge piers and footings in an es and downstream, such as the study area, further complica of scour around piers and abutments more difficult.
butments and piers constricting streamflow, treambed in the vicinity of the bridge; and (3) s vortices and eddies around piers and tuary with strong tidal currents both upstream es the scour process and makes determination
Scour data were collected to define general, contraction, and local scour in the study area. General scour was monitored by surveying cross sections parallel t0 the old Highway 101 Bridge at eight locations, beginning 600 ft east of the bridge centerline and ending 600 ft west. Constaction scour was monitored by recording bed elevations of Alsea Bay at the construction site, but out of the local scour area. Contraction scour near bent 4 was determined by continuously monitoring bed elevations about 40 ft upstream from the cofferdam. This location was affected by contraction scour, but was not affected by local scour from bent 4. Local scour was monitored at each corner of bent 4 of the cofferdam. A second site (bent 3) was monitored for comparison with local scour at bent 4.
Local scour at bent 4 was monitored on a continuous basis at the southwest corner and northeast or southeast corner of the cofferdam. Periodic measurements were made at each corner of the cofferdam at bent 4. Normally, local scour depths would be monitored at the upstream corners of bridge piers; however, at this site, water flows in both directions due to tides, and downstream corners also needed to be monitored because of scour caused by flood tides. Local scour measurements made at bent 4 were

44
° 2
7'
30'
12
4°
05'
57
'30
"123°5
5'
44°
25
'
44°
22'
30"
EX
PL
AN
AT
ION
Mon
itor
ing
site
sG
age
heig
hts
Sco
ur-h
ole
elev
atio
n
Vel
ocity
Riv
er m
ile
Yaq
uina
Jo
hn
Poi
nt
@jr
RM
fRM
12
Lit
tle
y/
n
Als
ea
Alb
any
/JI
Riv
eria
Wes
twoo
dV
illa
ge
J
Lit
tle
RM
Sw
itze
rlan
d 10
RM
KILO
MET
ERS
Fig
ure
l.--
Are
a m
ap s
how
ing
stud
y lo
cati
ons
in t
he A
lsea
Riv
er E
stua
ry n
ear
Wal
dpor
t, O
rego
n.

50 100 150 200 FEET_|_____I_____I ' I
I I I I I Io 10 20 30 40 50 METERS
Figure 2. Plan view of Highway 101 bridge, monitoring locations, and construction trestle at Alsea Bay, Oregon.
compared with a second set of data collected at bent 3. Loc£l scour at the southeast corner of bent 3 cofferdam was continuously monitored for 3 weeks, and scour at each corner was periodically measured from the time of cofferdam construction. Cross sections wefe surveyed from the mouth of the Alsea River to RM 12.5 up to the 100-year-flood elevations so that maximum depths and velocities could be determined for estimating maximum local scour at the new bridge.
Suspended-Sediment and Bed material| I
Suspended-sediment and bed material samples were collected during maximum ebb-tide velocities at RM 5.0, in the vicinity of the new bridge (RM 1.1), and near the point where the Alsea River enter the Pacific Ocean. Suspended sediment samples were analyzed for particle size and concentration. Bed samples were analyzed for particle size.

METHODS OF DATA COLLECTION
Water surface elevation, discharge, sediment, and bed material data were collected using USGS Techniques for Water Resources Investigations recommended procedures (Buchanan and Somers, 1974; Kennedy, 1983; Carter and Davidian, 1968; Guy and Norman, 1970). Cross-sectional data at the bridge and bed elevations that identified scour were collected using sonar equipment in conjunction with data-loggers. Techniques for use of this equipment were tested at the beginning of this project prior to data collection .
Cross-sectional data were collected by boat during high tide using electronic sonar instruments, with a transducer and data-logger. Depths obtained with the sonar device and corresponding times were recorded on a data-logger. Stationing was obtained by referencing the time the boat passed a known station, such as a bridge pier.
Bed-elevation measurements in scour holes and elevations of the streambed in the constricted zone were obtained by using a depth sounder interfaced to a data-logger, as used in the cross-section measurements, except the transducer was mounted to a fixed object (pier, or piling) and directed toward the scour hole or streambed. The depth sounder continuously monitored the same location and transferred the signal to a data-logger, which filtered signals and stored the data. During normal operation, the sonar depth sounder will measure depths within ± 0.5 ft, when scatter is minimum. Sonar equipment was subject to interference (scatter) when the signal path was obstructed by objects such as seaweed or sand particles. Scatter occurs when the sonic signal transmitted by the sonar device reflects off objects other than the intended streambed, such as when sand is suspended in the water column, or seaweed passes through the signal path. When scatter occurs, the data values are less than actual readings and can be detected and filtered. Mean daily scour-hole elevations were accurate within ±1.5 ft during periods when scatter was extreme, and within ±0.5 ft during periods when scatter was at a minimum.
Measurement of local scour using sonar was accomplished by mounting the tranducer near the scour hole and directing the signal toward the bottom of the hole. Determination of the deepest'part of the scour hole was determined by field measurements. Measurements of bent 4, made on December 13,1989, indicate that the deepest part of the southeast scour hole was at the corner, and the depth decreases 2 ft for every 10 ft of distance from the corner. Maximum depth at the southwest corner of bent 4 was located 2 ft away from the corner and depth decreases about 1 ft for every 10 ft of distance from the corner. Directing the sonar transducers toward the deepest part of the scour holes at bent 4 was not difficult because these scour holes were large.
DATA STORAGE
Data collected for this study will be stored in the National Bridge Scour Program data base. The Bridge Scour Data Base System (BSDBS) is being developed by the USGS National Scour Study, in cooperation with the Federal Highway Administration. The BSDBS is an archival and retrieval system which also can be used to compute scour using various scour equations which are incorporated into the system. The BSDBS program is written in fortran and can be used on personal as well as mainframe computers, Landers (1991). Continuous and cross-sectional data collected during this project will be stored in BSDBS and are listed in tables 1 and 2.
ILLUSTRATIONS AND TABLES
Illustrations and tables that appear in the appendix part of this report are explained below. Bed elevations, gage height, and scour-hole elevation at bent 4 are shown in figures 3 and 4. Scour-hole elevations at bent 3 are shown in figures 5 and 6. Cross sections taken in the vicinity of the Alsea Bay Highway 101 Bridge are shown in figures 7,8, and 9. Mean daily discharge for the Alsea River at Tidewater, during the period of study is shown in figure 10. Water-level correlations between Alsea River at Waldport, Alsea River at mouth of Drift Creek, and Alsea River at Kozy Kove during high and low flows are shown in figures 11 and 12.

Daily scour-hole, bed-elevation data for bent 4 are listed in tables 3,4, and 5. Daily bed elevations in the vicinity of bent 4 are shown in table 6. Daily scour-hole bed-elevation data for bent 3 are listed in table 7. Maximum and minimum daily water levels for Alsea River at Waldport, Alsea River at mouth of Drift Creek, and Alsea River at Kozy Kove are listed in tables 8,9d, and 10. Discharge measurements taken in the Alsea River Estuary during the period of study are listed in table 11.
Table 1.-Begin and end dates and accuracy of continuous 15-minute data that will be stored in the Bridge Scour Data Base System (Landers, 1991)
[ft = feet, ft/s = feet per second]secoi
Begin date End date Accuracy
Ebb- and flood-tide velocity in the vicinity of bent 4Apr. 16, 1989Sept. 1, 1989Dec. 14, 1989Apr. 2, 1990
Apr.20,198S ±0.25 ft/sSept. 4, 1989 ±.25 ft/sDec. 18,1985 ±.25 ft/sMar. 67 1990 ±.25 ft/s
Water-surface elevation at Waldport site, river mile 1.1Feb. 26, 1988Oct. 1, 1988May 8, 1989June 7, 1989June 22, 1989July 28, 1989Sept. 9, 1989Sept. 14, 1989Sept. 23, 1989Oct. 1, 1989Nov. 1, 1989Nov. 15, 1989Dec. 11, 1989Jan. 3, 1990Feb. 14, 1990
Sept 30, 1988 ±.25 ftMay 7, 1989 ±.25 ftJune 6, 1989 ±.25 ftJune 19, 1989 ±.25 ftJuly 2, 1989 ±.25 ftSept. 7, 1989 ±.25 ftSept. 11, 1989 ±.25 ftSept. 21, 1989 ±.25 ftSept. 30, 1989 ±.25 ftOct. 23, 1989 ±.25 ftNov. 14, 1989 ±.25 ftNov. 29, 1989 ±.25 ftJan. 1, 1990 ±.25 ftJan. 8, 1990 ±.25 ftJuly 10, 1990 ±.25 ft
Ii Water-surface elevation at confluence of Drift Creek, river mile 5.0
Apr. 19, 1989Oct. 1, 1989
Sept. 30, 1989 ±.25 ftJuly 11, 1990 ±.25 ft
Water-surface elevation at Alsea River at Kozy Kove, river mile 11.2Apr. 21, 1989Oct. 1, 1989Feb. 28, 1990
Sept. 30, 1990 ±.75 ftFeb. 18, 1990 ±.75 ftJuly 10, 1990 ±.75 ft
6

Table 1.-Begin and end dates and accuracy of continuous 15-minute data that will be stored in the Bridge Scour Data Base System continued
Began date End date Accuracy
Scour-hole elevations at N.E. corner bent 4Mar. 9, 1989 Apr. 3,1989 Apr. 12,1989 May 25,1989
6±1.5ft ±1.5 ft
Scour-hole elevations st S.E. corner of bent 4June 14,1989 Aug. 14,1989Aug. 18,1989 Sept. 30,1989Oct. 1,1989 Jan. 10,1990Jan. 17,1990 Jan. 22,1990Jan. 31,1990 Feb. 12,1990Feb. 14,1990 May 1,1990
Scour-hole elevations at S.W. corner of bent 4Apr. 13,1989 July 24, 2989 July 28,1989 Nov. 15,1989 Dec, 13,1989 Jan. 8,1990 Jan. 17,1990 Feb. 9,1990 Feb. 14,1990 July 9,1990
Scour-hole elevations at S.E. corner of bent 3May 3,1990 May 23,1990
Reference-bed elevation at bent 4Apr. 13,1989 Mar. 23,1990
±.25 ft ±.25 ft ±.25 ft ±.25 ft ±.25 ft ±.25 ft
±.25 ft ±.25 ft ±.25 ft ±.25 ft ±.25 ft
±.25 ft
±.25 ft
Table 2.--Dates for cross-sectional measurements oftheAlsea River at Waldport, Oregon. Distances shown arereferenced to the center of the old Highway 101 Bridge
i [ft = feet, X = measurement taken]
Station
Date
8/88 9/88 11/88 12/88 1/89 2/89 3/89 4/89 5/89 10/89 3/90
6OO ft west
300 ft west
100 ft west
50 ft west
X
X
X
X
X
X
X
X
X
X
X X
X
X
X
XXX
XXX
X X
X X
X X X X
X X
X X
X X
50 ft east
100 ft east X X X X
200 ft east
300 ft east X X X X
600 ft east XXX
X
X
8
XXX
X X X X
X X X X

SELECTED REFERENCES
Buchanan T.J., and Somers W.P., 1974, Stage measurement at gaging stations: U.S. Geological Survey Techniques of Water-Resources Investigations, book 3, chapter A7,28 p.
Carter, R.W., and Davidian J., 1968, General procedure for gaging streams: U.S. Geological Survey Techniques of Water-Resources Investigations, book 3, chapter A6,13p.
Guy H.P., and Norman V.W., 1970, Field methods for measurement of fluvial sediment: U.S. Geological Survey Techniques of Water-Resources Investigations, book 3, chapter C2,59 p.
Jarrett, R.D., and Boyle J.M., 1986, Pilot study for collection of bridge-scour data: U.S. Geological Survey Water Resources Investigations Report 86-4030,46 p.
Kennedy E.J., 1983, Computation of continuous records of streamflow: U.S. Geological Survey Techniques of Water-Resources Investigations, Book 3, Chapter A13, 53 p.
Landers M.N., 1991, Bridge scour data base system: Las Vegas, Nevada, Fifth Interagency Sedimentation Conference, 1991, proceedings, p. 2-121:2-126

I
Old Highway 101 Alsea Bay Bridge at Waldport, Oregon. Photo taken before construction of new bridge began.
Old Highway 101 Alsea Bay Bridge at Waldport, Oregon. Photo taken afterconstruction of new bridge started. Wor
10
t trestle is visible near bridge.

-10
-15
-20
O
oc
i
-30
-35
RE
FE
RE
NC
E
SC
OU
R H
OLE
AT
S.W
. C
OR
NE
R
SC
OU
R H
OLE
AT
N.E
. C
OR
NE
R
SC
OU
R H
OLE
AT
N.W
. C
OR
NE
R
SC
OU
R H
OLE
AT
S.E
. C
OR
NE
R
SH
EE
T P
ILIN
G I
N P
LAC
EC
OF
FE
R D
AM
RE
MO
VE
D
FR
OM
AR
OU
ND
BE
NT
4
AP
R
MA
Y
JUN
E
JULY
A
UG
S
EP
T
OC
T
NO
V
DE
C
JAN
1989
19
90
FE
B
MA
R
AP
R
MA
Y
JUN
E
JULY
Figu
re 3
. B
ed e
leva
tion
s at
ben
t 4
and
refe
renc
e lo
catio
ns.
Pile and mount for depth sounder and velocity sensor. Sensors are beneath water surface, in monitoring position.
Velocity sensor and depth transducer raised for cleaning.
12
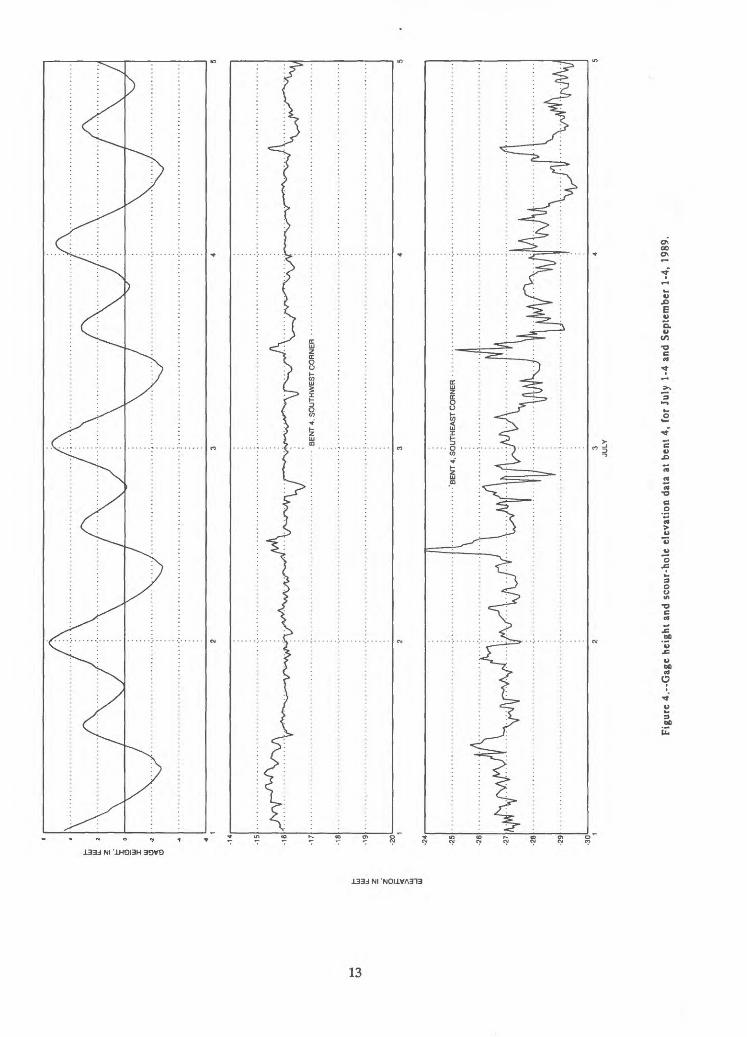
Figu
re 4
.-G
age
heig
ht a
nd s
cour
-hol
e el
evat
ion
data
at
bent
4,
for
July
1-4
and
Sep
tem
ber
1-4,
198
9.

Figu
re 4
.-G
age
heig
ht a
nd s
cour
-hol
e el
evat
ion
data
at
bent
4 f
or J
uly
1-4
and
Sept
embe
r 1-
4, 1
989.
-Con
tinue
d.

-11 -12
-13
-14
-15
-16
-17
i i
i I
ii
ri
i
SH
EE
T P
ILIN
G I
N P
LAC
E.
MA
TE
RIA
L E
XC
AV
AT
ED
FR
OM
IN
SID
E
CO
FF
ER
DA
M -
SO
ME
SP
ILLA
GE
O
UT
SID
E C
OF
FE
R D
AM
j_____I
13
MA
RC
H
1990
2027
3
AP
RIL
10
1724
1
MA
Y
8 15
22
29
5
JUN
E
12
1926
3
JULY
10
Figu
re 5
. Sco
ur-h
ole
elev
atio
ns a
t be
nt 3
for
Mar
ch-J
uly
1990
.

Figu
re 6
.-G
age
heig
ht a
nd s
cour
-hol
e el
evat
ion
data
at b
ent
3 fo
r M
ay 5
-9,
1990
.

-5
-10
-15
-20
-25
345
S
B
S10
11
12
13
14 15
16
17 1
8 19
20
21
JAN
UA
RY
198
9
MA
Y 1
989
-
MA
RC
H 1
990
[53
PIE
R
500
1,00
0 1,
500
DIS
TA
NC
E F
RO
M R
IGH
T B
AN
K,
IN F
EE
T
2,00
02,
500
3,00
0
Figu
re 7
.-C
ross
-sec
tion
s at
Als
ea B
ay, 6
00 f
eet
wes
t of
the
old
Hig
hway
101
Bri
dge
pier
s.

oo
-5
o I - -1
5
-20
-25
10
11
12
13
14 15
16
17 18
19
20
ta ta
ta ta
JAN
UA
RY
198
9
__
MA
Y 1
QR
Q
ivm
i 1
90
9
MA
RC
H 1
990
PIE
R
500
1,00
0 1,
500
DIS
TA
NC
E F
RO
M R
IGH
T B
AN
K,
IN F
EE
T
2,00
02,
500
3,00
0
Figu
re 8
.-C
ross
-sec
tion
s at
Als
ea B
ay,
300
feet
eas
t of
the
old
Hig
hway
101
Bri
dge
pier
s.

8 9
10
11
12
13
14 15
16
17 18
19
20
-5
-10
-15
-20
JAN
UA
RY
198
9
MA
Y 1
989
MA
RC
H 1
990
PIE
R
-25
500
1,00
0 1,
500
DIS
TA
NC
E F
RO
M R
IGH
T B
AN
K,
IN F
EE
T
2,00
02,
500
3,00
0
Figu
re 9
.-C
ross
-sec
tion
s at
Als
ea B
ay,
20 f
eet
wes
t of
the
old
Hig
hway
101
Brid
ge p
iers
.

o -
-5
-
-15
-
-20
-
-25
600
650
700
750
800
850
900
DIS
TA
NC
E F
RO
M R
IGH
T B
AN
K,
IN F
EE
T
950
1,00
01,
050
1,10
0 1,
150
1,20
0
Figu
re 9
.-C
ross
-sec
tion
s at
Als
ea B
ay,
20 f
eet
wes
t of
the
old
Hig
hway
101
Bri
dge
pier
s-C
onti
nued
.

DISCHARGE, IN CUBIC FEET PER SECOND
DISCHARGE, IN CUBIC FEET PER SECOND
DISCHARGE, IN CUBIC FEET PER SECOND
Ia
5- 5
>

15
11
HW W fe
H ffl O 3W fflw.O<O -i
-5 I
_RM0.5 RM5.0 RM11.2
I6 12 18 24
JANUARY 6, 19906 12 18 JANUARY?, 1990
24 6 12 18 24 JANUARYS, 1990
Figure 11.-Water levels during high How of the Alsea River at Waldport (RM 0.5), Drift Creek (RM 5.0), and Kozy Kove (RM 11.2) for January 6-8, 1990.
15
11
W fe
O 3 H* JW ffl
O
-1
-5
RM0.5
RM5.0
_RM11.2
6 12 18 AUGUST 1,1989
24 12AUGUST 2,1989
18 24 6 12 18 AUGUST 3, 1989
24
Figure 12.-Water levels during low flow of the Alsea River at Waldport (RM 0.5), Drift Creek (RM 5.0), and Kozy Kove (RM 11.2) for August 1-3, 1989.

Looking west at bent 4 coffer dam (new Highway 101 bridge under construction) and old highway pier 6. Pile with shelter located left of bent 4 houses depth sounding equipment used to monitor scour hole depths at the southwest corner of bent 4.
Stilling well and shelter at Alsea River at Kozy Kove, RM 11.2.
23

Table 3. Scour-hole bed elevations for northeast corner of bent 4, Alsea River at Waldport
LOCATION. Lat 44°25'58", long 124C04'14", in SE 1/4 SW, 1/4 sec.18, T.13 S., R.ll W.,Lincoln County, Hydrologic Unit 17100205; gage on a metal pile supporting the worktrestle,10 feet northeast of bent 4 of new Highway 101 Bridge, 0.5 miles north ofWaldport.
PERIOD OF RECORD. March 1989 to May 1989 (scour-hole elevation) - discontinued. GAGE. Bed-elevation recorder. Sonic depth sounder in conjunction with a data logger.
Datum of gage is 0.00 feet above National Geodetic Vertical Datum of 1929 (levels byOregon Department of Transportation).
REMARKS. Bed elevations at this site indicate local scour from ebb tide at the northeastcorner of bent 4 cofferdam of the new Highway 101 Bridge.
EXTREMES FOR PERIOD OF RECORD. Maximum daily recorded: -16.1 feet on April 2, 1989;minumum daily recorded: -22.3 feet on May 16, 1989.
DAILY ELEVATION, IN FEET, WATER YEAR OCTOBER 1988 TO SEPTEMBER 1989
DAYMARCH
RECORDED OBSERVEDAPRIL I
RECORDED OBSERVEDMAY
RECORDED OBSERVED
12345
6789
10
1112
131415
16.7 17.2
17.1 17.1 17.3 17.4 17.4
16.2 16.1 16.3
18.3 18.3 19.0
17.9 17. J2 17.|8 1
-20.7-20.6-20.8
-21.3-21.3
-21.3-21.3-21.1-21.2-21.2
-21.1-21.4-21.8-21.2-21.2
-21.3
1617181920
17.2 17.1 17.2
17.0 16.7
18.7 19.0 18.1 17.6 19.0
I-22.3-21.5-21.4-21.7-21.8
2122232425
16.7 16.9 16.9 16.9 17.0
-19.5-19.6-19.9-20.3-20.4
-19:6 -21.3-21.3-21.4-21.7-20.7
-21.7
262728293031
16.9 17.0 17.0 16.9 16.6 16.3
-20.2-20.5-20.5
-20.4-20.4
24

Table 4. Scour-hole bed elevation for southeast corner of bent 4, Alsea River at Haldport
LOCATION. Lat 44°25'58", long 124°04'14", in SE 1/4 SW 1/4 sec.18, T.13 S., R.ll W., Lincoln County, Hydrologic Unit 17100205; gage on a metal pile supporting the work trestle 10 feet southeast of bent 4 of new Highway 101 Bridge, 0.5 miles north of Waldport. .. f
PERIOD OF RECORD. June 1989 to April 1990 scour-hole elevation).GAGE. Bed-elevation recorder. Sonic-depth sounder in conjunction with a data logger. Datum of gage is 0.00 feet above National Geodetic Vertical Datum of 1929 (levels by Oregon Department of Transportation).
REMARKS. Bed elevations at this site indicate local scour from ebb tide at the southeast corner of bent 4 cofferdam of the new Highway 101 Bridge.
EXTREMES FOR PERIOD OF RECORD. Maximum elevation -26.7 feet on June 16, 17, 19, 20, 1989; minimum elevation, -31.7 feet on February 9, 1990.
DAILY SCOUR-HOLE ELEVATIONS, FEET, WATER YEAR OCTOBER 1988 TO SEPTEMBER 1989
APRIL MAY JUNE JULY AUGUST SEPTEMBER DAY RECORDED OBSERVED RECORDED OBSERVED RECORDED OBSERVED RECORDED OBSERVED RECORDED OBSERVED RECORDED OBSERVED
1 -26.8 -27.9 -28.3 2 -26.9 -28.3 -28.13 -27.8 -28.2 -28.34 -28.7 -28.4 -28.3 5 -28.7 -28.2 -28.4
6 -28.6 -28.5 -28.4 7 -29.0 -28.6 -28.3 8 -28.9 -28.8 -28.5 9 -29.0 -28.8 -28.6
10 -29.1 -28.7 -28.3
11 -28.9 -28.7 -28.1 12 -28.9 -28.4 -28.013 -27.7 -28.5 -28.4 -28.2 14 -27.1 -28.8 -28.2 -28.2 15 -27.1 -28.7 -27.9
16 -26.7 -28.4 -28.0 17 -26.7 -28.8 -28.118 -26.8 -28.5 -28.4 -28.119 -26.7 -28.7 -28.4 -28.1 20 -26.7 -28.6 -28.4 -28.3
21 -26.8 -28.7 -28.5 -28.322 -27.0 -28.6 -28.4 -28.3 23 -26:9 -28.8 -28.7 -28.2 24 -26.9 -28.9 -28.5 -28.2 25 -27.1 -28.6 -28.5 -28.3
26 -27.1 -28.8 -28.6 -28.5 27 -27.3 -28.7 -28.5 -28.328 -27.2 -29.0 -26.7 -28.5 -28.129 -27.0 -28.4 -28.6 -28.030 -26.9 -28.1 -28.5 -28.3 31 -28.2 -28.5 -28.5
25

Table 4. Scour-hole bed elevations for southeast corner of bent 4, Alsea River at ffaldport Continued
DAILY SCOUR-HOLE ELEVATIONS, FEET, WATER YEAR OCTOBER 1989 TO SEPTEMBER 1990
OCTOBER NOVEMBER DECEMBER JANUARY FEBRUARY MARCH DAY RECORDED OBSERVED RECORDED OBSERVED RECORDED OBSERVED RECORDED OBSERVED RECORDED OBSERVED RECORDED OBSERVED
12345
6789
10
1112131415
1617181920
2122232425
262728293031
-28.1-28.3-28.2-28.4-28.5
-28.5-28.4-28.5-28.6-28.6
-28.5-27.9-28.2-28.1-28.1
-28.3-28.2-28.3-28.0-27.8
-28.1-28.0-28.3O Q C iO . D
-28.2
-28.1-28.5-28.4-28.5-28.5-28.4
-28.4-28.3
-28.4
-28.6-28.7
-28.5
-28.7-28.7
-28.5 -28.8
-27.9 -28.7 -28.6 -28.9 -28.7 -29.1
-28.7 -28.8 -28.6 -28.7
-28.6
-28.7 -28.9
-28.75O O
-29.0
-29.3-29.0
-28.8 -28.9 -28.7
-28.7 -29.1-28.9 -28.-28.6 -28.9-29.1 -28.7-29.0 -29.0
-29.0 -29.0_28.9 -29.3-28.5 -29.9_28.7 -29.2-28.6
-28.8 __-28.6
-28.6 -29.0-28.8 -28.8
-28.9
-28.5_28.7
-28.6_28.7
-28.6 __
_28.7_28.7 on £
-28.5
-28.6 -28.5 -28.6
-28.6
-28.4-28.7
26
-27.2
-30.9
-30.6-30.8-31.3-31.2-30.7
-31.2-30.1-31.2-31.7-31.6
-30.8
-31.2-29.7
-30.2-29.9-30.9-30.9-30.6
-30.7-30.6-30.8-30.9-30.2
-30.5-30.6-30.5
-30.7-30.4-30.3-30.3-30.3
-30.3-30.3-30.2-30.2-30.3
-30.5 -30.6 -30.2
-30.3-30.5
-30.4 -30.4 -30.3 -30.4 -30.3
-30.2-30.3-30.2-30.2
-30.2
-30.0 -29.5 -30.0 -29.8 -29.9
-29.8
___
__
-29.9
___
___-30.1-29.8
___
-30.9

Table 4. Scour-hole bed elevations for southeast corner of bent 4, Alsea River at Waldport Continued
DAILY SCOUR-HOLE ELEVATIONS, FEET, WATER YEAR OCTOBER 1989 TO SEPTEMBER 1990
APRIL MAY JUNE JULY DAY RECORDED OBSERVED RECORDED OBSERVED RECORDED OBSERVED RECORDEDOBSERVED
12345
6789
10
1112131415
1617181920
2122232425
262726293031
-30.1-30.2-30.0-30.0-29.8
-30.0-30.0-30.1-30.2-30.0
-30.0-29.9-30.2-30.1-30.0
-29.9-30.1-29.9-30.0-30.0
-30.0-30.1-30.0-30.1-29.8
-30.1-30.0-30.2-30.1-30.1
-30.1-31.0
-31.3
-31.1-31.4
-29.7
-31.2
-31.0
27

Table 5. Daily scour-hole bed elevations for southwest corner of bent 4, Alsea River at Waldport
LOCATION. Lat 44°25'58", long 124°04'14", in SE 1/4 SW 1/4 sec.18, T.13 S., R.ll W., Lincoln County,Hydrologic Unit 17100205, on a wood pile located 10 feet southwest of bent 4 of new Highway 101Bridge, 0.5 miles north of Waldport.
PERIOD OF RECORD. April 1989 to July 1990 (scour-hole elevation). GAGE. Bed elevation recorder. Sonic depth sounder in conjunction with a data logger. Datum of gage is
0.00 feet above National Geodetic Vertical Datum of 1929 (levels by Oregon Department of Transportation). REMARKS. Bed elevations at this site indicate local scour from flood tide flows at the southwest corner
of bent 4 cofferdam of the new Highway 101 Bridge. EXTREMES FOR PERIOD OF RECORD. Maximum bed elevation April! 13, 1989 to March 23, 1990, -13.6 feet April 17,
1989; minimum gage height -27.0 feet April 24, 1990.
ELEVATION, IN FEET, HATER YEAR OCTOBER 1988 TO SEPTEMBER 1989
APRILDAY RECORDED OBSERVED
1
2 3 4 5
6 7 8 9
10
11 12
13 -13.7 -14.814 -13.9 15 -13.7
16 -13.7 17 -13.6 18 -13.719 -14.2 20 -15.4
21 -16.0 -15.822 -16.223 -16.0 24 -15.825 -15.0
26 -14.6 27 -14.7 28 -14.4 29 -14.5 30 -15.0 31
MAYRECORDED OBSERVED
-15.5 -16.0
-15.8 -14.8 -14.9 -14.7
-14.4 -14.4 -14.4 -14.5 -14.5
-14.6 -14.7 -14.7
-15.0-14.9
-14.9
-14.8-14.9
-14.9-14.9
-15.1
-15.0-15.2
-15.1 -15.3-15.0
-15.3-15.5
-15.8-15.9-15.9 -16
JUNE JULY AUGUSTRECORDED OBSERVED RECORDED OBSERVED RECORDED OBSERVED
-16.3 -16.8 -18.-16.3 -17 -18.-16.3 -17
1 £ 1 I T 1
-18.__ _ _1 O
-16.4 ~17 ' 2 ~ 18 -
-16.4 -17.3 -18.-17.5 -18.
-16.6 -17.2 -18.-16.6 -17.3 -18.-16.8 -17.1 -18.
-16.7 -16.9 -18.-16.7 -17.3 -18.-16.7 -16.9 -17.2 -18.-16.6 -17.1 -17.-16.6 -17.! -17.
-16.7 -17.3 -17.-16.7 -17.1 -17.-16.6 -17 -17.-16.6 -17.1 -18.-16.6 -j -17.! -19
-16.7 -17.8 -19.-16.6 -17.9 -19.-16.6 -17. S-16.8 -16.8
-16.9 -16.9
-19. -19. -19.
-19. -19.
-16.9 -17.9 -17.9 -19.-16.9 -18.6 -19.-16.8 -18.7 -19.
" -
-18. 1
28
-19
6
88 9 9
8 8 8 9 8
9 7 7 8 7
7
67 6
2 2 3 2 7
7 6
773
-19.7
SEPTEMBERRECORDED
-19.1
-19.3
-19.5 -19.4-19.3
-19.6-19.1-19.5-19.1-19.3
-19-19.3-19.2-19.1-19
-19-19-19
-19.1-19.3
-19.4-19.5-19.1-19.2-18.8
-18.9-18.5-19.2-19.3-19.1
OBSERVED
___
_ -
___
V

Table 5. Daily scour-hole bed elevations for SW corner of bent 4 Alsea River at Waldport Continued
ELEVATION, IN FEET, HATER YEAR OCTOBER 1989 TO SEPTEMBER 1990
DAY
1
2 345
6789
10
1112131415
161718 1920
2122232425
262728293031
OCTOBERRECORDED OBSERVED
-19.0
-18.6
-18.7 -19.0 -19.0
-18.6 -18.8 -18.8 -18.5 -18.7
-19.0 -19.1-19.3 -19.0 -19.1-19.2
-19.2 -19.3-19.3 -19.2-19.2
-19.4 -19.1
-19.2-19.4 -19.4
_19.4 -19.5
-19.6 '-19.4 -19.4 -19.4
NOVEMBERRECORDED OBSERVED
-19.5
-19.5 -19.6 -19.5-19.5
-19.4 -19.4
-19.4-19.4-19.3
-19.2 -19.4
-19.5 -19.6
. __ __
-19.8 -19.9
__ __
__ _ _ .
DECEMBERRECORDED OBSERVED
___ ___
___ ___
-20.4 -20.4-19.8 -19.8
-19.8 -19.6 -19.8 -19.9
1 Q fi __
-19.9 1 Q ft
-19.9
-19.7 -19.9
-19.7 -19.9
-19.8 -19.9
-19.8 -19.9
JANUARYRECORDED OBSERVED
-20.6
-20.7
-20.6
-20.6 -20.5
-20.6 -20.6 -20.5
__ _ _
__ _
-20.2 -20.1 -20.2 -19.9-20.2
-20.1 -20.4
-20.5 -20.2 -20.6
-20.5 -20.6 -20.5 -20.6 -20.6 -20.5 -22.6
FEBRUARYRECORDED OBSERVED
-20.7
-22.1 -21.9 -21.9-21.8
-21.7-21.8 -21.8-21.7
___ __
-20.3-20.1
-20.0 -19.7
-20.2 -20.1 -20.1
-19.6 -20.1-20.3-20.3-20.4
-20.4 -20.6 -20.6
MARCHRECORDED
-20.7
-21.0 -21.2-21.9-21.2
-21.1-21.1-21.2-20.9-21.1
-21.0-21.0-21.0-21.1-21.2
-21.2-21.1-21.3 -21.3-21.3
-21.4-21.2-21.3-21.6-22.1
-24.0-24.0-24.7-24.9-25.2-24.9
OBSERVED
-19.7
6
__
-19.9
__
-19.4
___ _
-24.9
29

Table 5. Daily-scour-hole bed elevations for southwest corner of bent 4, Alsea River at Waldport Continued
ELEVATION, IN FEET, WATER YEAR OCTOBER 1989 TO SEPTEMBER 1990
APRIL MAY ' JUNE
RECORDED OBSERVED RECORDED OBSERVED RECORDED OBSERVED
12345
6789
10
1112131415
1617181920
2122232425
62728293031
-26.4-26.1-26.0-26.1-26.3
-26.1-26.1-26.1-26.1-26.1
-26.1-25.9-26.5-26.4-26.3
-26.5-26.7-26.3-25.8-26.3
-26.5-26.3-26.5-27.0-26.1
-26.4-25.7-26.1-26.8-26.5
-26.3
-23.5
-25.1-22.1
-21.8-21.6-21.8
-22.0-21.9-21.6-21.7-22.5
-21.7-21.5-22.4
-22.2
-22.3
-22.9-22.4-22.4
-22.8-22.8
-21.9-22.7-22.7-22.4
-23.3
-22.7-23.1-23.5-22.6
-22.7-22.6
-23.2
-25.2
-22.8-22,. 6-22.2
-22,4
-22,4
-22.7-22.5
-22.5
-22.0-22.2
I
-22.4
-23.0-22.9-23.6-22.9
-23.4-23.7-22.7-22.8-22J.4
-22.2
-22.1
-22.2
-22.2
-22,1
-22.2
-22.3
-22.2
-22.4-22U
30
JULY
RECORDED OBSERVED
-21.8
-21.9
-22.0
-21.9
-21.7
-21.6 -21.6 -21.8
-22.0 -26.1
-24.7

Table 6. Bed elevations for 40 feet east of bent 4, Alsea River at Waldport
LOCATION. Lat 40°25'58", long 124°04'14", in SE 1/4 SW 1/4 sec.18, T.13 S., R.ll W., Lincoln County, HydrologicUnit 17100205, on a wooden pile located 40 feet east of bent 4 of new Highway 101 Bridge, 0.5 miles north ofWaldport.
PERIOD OF RECORD. April 1989 to March 1990 (bed elevation). GAGE. Bed elevation recorder. Sonic depth sounder in conjunction with a data logger. Datum of gage is 0.00 feetabove National Geodetic Vertical Datum of 1929 (levels by Oregon Department of Transportation).
REMARKS. Bed elevations at this site reflect contraction scour. These data are used to help differentiate betweengeneral scour, constriction and local scour at bent 4 of the new Highway 101 Bridge.
EXTREMES FOR PERIOD OF RECORD. Maximum daily bed elevation April 13, 1989 to Marrch 23, 1990, -10.7 feetJanuary 8, 1990; minimum daily bed elevation -15.1 feet July 26, August 7,8,11,12, 1989.
DAILY ELEVATION, IN FEET, WATER YEAR OCTOBER 1988 TO SEPTEMBER 1989
APRIL MAY JUNE JULY AUGUST SEPTEMBER DAY RECORDED OBSERVED RECORDED OBSERVED RECORDED OBSERVED RECORDED OBSERVED RECORDED OBSERVED RECORDED OBSERVED
-12.9-12.9-12.9-12.9-13.0
-13.0 -13.5
-12.4 -13.8 -13.6
-14.9-14.8-14.7-14.7-14.8
-14.9-14.8-14.9-14.8-14.9
-13.2-13.1-13.1-13.1-13.1
910
-13.2-13.6-13.6-13.7-13.6
-14.3-14.4-14.5-14.6-14.7
-14.9-14.8-14.9-14.8-14.7
-15.0-15.0-15.1-15.1-15.0
-13.2-13.2-13.2-13.2-13.1
11 12
13 -13.714 -14.015 -14.0
-13.6 -13.6
-14.0 -13.6-13.6
-13.6
-14.8-14.8-14.8-14.7-14.7
-14.7
-14.7-14.6
-14.8 -14.6-14.5
-15.1-15.1-14.9-14.8-14.7
-13.1-12.9-13.0-12.8-12.3
16 -14.117 -14.118 -14.019 -14.020 -13.9
-13.5-13.4-13.3-13.2-13.2
-14.5-14.4-14.3-14.2-14.4
-14.7-14.6-14.5-14.5-14.5
-14.7-14.7-14.6-14.3-14.2
-12.2-12.4-12.2-12.8
-13.7-13.5
2122
23
24 -13.125 -13.8
-13.2-13.2-13.2-13.2-13.2
-14.4-14.4-14.6-14.6-14.8
-14.7-14.7-14.7-14.7-14.9
-14.0-13.9-13.3-13.2-13.1
-13.0-12.3-12.2-12.4-12.6
26
2728293031
-14,-12,-12,-12,-13,
-13.2-13.3-13.4-13.4-13.5-13.4
-14.8-15.0-14.9-14.9-14.8
-15.1-15.0-15.0-14.9-14.9-14.9
-13.1-13.2-13.2-13.2-13.2-13.1
-12.7
31

Table 6. Bed elevations for 40 ft east of bent 4, Alsea River at Waldport Continued
DAILY ELEVATION, IN FEET, WATER YEAR OCTOBER 1989 TO SEPTEMBER 1990
OCTOBER NOVEMBER DECEMBER JANUARY FEBRUARY MARCH
DAY RECORDED OBSERVED RECORDED OBSERVED RECORDED OBSERVED RECORDED OBSERVED RECORDED OBSERVED RECORDED OBSERVED
12345
6789
10
1112131415
-12.1-12.2-12.5
-12.0-12.6-12.5
-12.3-12.3-12.3-12.3-12.4
-12.4-12.4-12.5-12.4-12.4
-12.3-12.4-12.1-12.1-12.4
-14.9 14.8-14.7-14.7-14.8
-14.9-14.8 12.1-11.912.0
12.2-11.911.912.0
-12.3
_1 1.6 -11.5
-11.4-11.9
-11.5 T-- -11.9 -11.6 i -11.9 -11.6
-11.7 -11.3
-11.8
-11.9-11.7
-10.7 | -11.9 -10.9 r -11.5_
~ 1-11.3
.. -11.4r
".
-12.0-12.2
-12.6 -12.3-12.8 -12.9 -12.9 .13.0
-13.0-13.1 -13.1 -13.2 -13.2
-13.0 -13.2 -13.4 -13.5 -13.6
1617181920
2122232425
262728293031
-12.2-12.6-12.5
-12.6-12.4-12.6-12.7-12.7
-12.6-12.6-12.6-12.6-12.5-12.3
-12.2-12.0
-12.0-11.9
-12.1-12.1-12.0-11.9
-12.1-12.3-12.0
-12.1-12.0-12.-12.
-12,-12,
-12.4
-12.8
-13.0
-13.2-13.3-13.3-13.3-13.2-13.2
i
-11.4
LI:
r
-12.4-12.4-12.3-12.1-12.2
-12.4-12,5-12.7-12.9-12.9
-12.7-12.7-12.8
[-11.8
-13.7 -13.6 .13.6 -13.6 -13.5
-13.6
-13.7 -13.7
32

Table 7. Scour-hole bed elevations for Southeast corner of bent 3, Alsea River at Waldport
LOCATION. Lat 44°25'58", long 124°04'14", in SE 1/4 SW 1/4 sec.18, T.13 S., R.ll W., Lincoln County,Hydrologic Unit 17100205, on bent 3 of Highway 101 Bridge (under construction), 0.5 mile north ofWaldport.
PERIOD OF RECORD. May 3-23, 1989 (scour-hole elevations) discontinued. GAGE. Portable depth sounder and data logger. Datum of gage is 0.00 feet above National GeodeticVertical Datum of 1929 (levels by Oregon Department of Transportation).
REMARKS. Data were collected at this site to compare with scour-hole data collected at bent 4, whichis located 350 feet south of this location.
EXTREMES FOR PERIOD OF RECORD. Maximum daily elevation recorded, -14.9 feet May 3, 1989; minimumgage height recorded -15.6 feet May 23, 1989.
ELEVATION, IN FEET, WATER YEAR OCTOBER 1988 TO SEPTEMBER 1989 DAILY MEAN VALUES
MARCH APRIL MAY JUNE JULY DAY RECORDED OBSERVED RECORDED OBSERVED RECORDED OBSERVED RECORDED OBSERVED RECORDED OBSERVED
1 . 2 3 -14.9 4 -15.3 5 -15.3
6 -15.3 7 -15.4 8 -15.3 9 -15.3
10 -15.4
11 -15.4 12 -15.4 13 -15.4 14 -15.3 15 -15.3
16 -15.3 17 -15.4 18 -15.3 19 -15.4 20 -15.3
21 -15.3 22 -15.3 23 -15.6 24 25
26 ~.- 27 28 29 30 31
33

Instrument shelter, stilling well, and velocity probe support at pier 6 at Highway 101 bridge over Alsea Bay. Photo taken before construction of new bridge.
Velocity and depth transducer mounted on aluminum angle for support.
34

Table 8.--Maximum and minimum daily water levels for Alsea .River at Waldport
LOCATION.--Lat 44°25'58", long 124°04'14", in SE 1/4 SW 1/4 sec.18, T.13 S., R.ll W. , Lincoln County, Hydrologic Unit 17100205, on pier 6 of Highway 101 Bridge, 0.5 miles north of Waldport.
PERIOD OF RECORD. March 1988 to July 1990(gage height).
GAGE.--Water-stage recorder. Datum of gage is 0.00 feet above National Geodetic Vertical Datum of 1929 (levels by Oregon Department of Transportation).
REMARKS. Site is affected by tides.
EXTREMES FOR PERIOD OF RECORD. Maximum gage height, 8.18 feet November 22, 1988; minimum gage height -5.60 feet June 19, 1989.
GAGE HEIGHT, IN FEET, WATER YEAR OCTOBER 1987 TO SEPTEMBER 1988
OCTOBER NOVEMBER DAY MAX MIN MAX MIN
DECEMBER JANUARY FEBRUARY MARCH MAX MIN MAX MIN MAX MIN MAX MIN
12345
6789
10
1112131415
1617181920
2122232425
262728293031
MONTH-
4. 4. 3. 4.
5. 4. 4. 4. 4.
3. 3.
3. 3.
4. 4. 4. 5.
5. 5.
5. 4. 3.
3. 3. 2. 2. 2 . 3.
425697£ Q
3654212919
44S) C.
65Q d
47539463
406357a Q
60
4502* Q
999527
-2.64-2.79-2.72-1.39
-1.67-2.62-2.75-2.600 Q "5
-3.10-3.30-3.76-4.47
-4.33-3.76-3.79-3.66
-3.51-2.92
1 DO
-2.391 P T
1 OR
-2.46-3.10
*5 on
-3.12-3.05
35

Table 8. Maximum and minimum daily water levels for Alsea River at Waldport Continued
GAGE HEIGHT, IN FEET, WATER YEAR OCTOBER! 1987 TO SEPTEMBER 1988
APRILDAY
12345
6789
10
1112131415
1617181920
2122232425
262728293031
MAX
4.025.345.575.454.75
5.154.53.3.743.133.25
2.933.534.765.165.34
5.346.005.305.395.04
4.533.763.092.262.46
3.093.634.224.424.56
MIN
-2.50-2.47-1.80-2.97-3.34
-2.93-3.49-3.67-3.82-3.21
-3.59-3.56-2.68-2.49-3.06
-3.43-4.10-4.60-4.09-3.78
-3.37-3.05-2.79-2.67-2.68
-2.38-1.88-1.47-2.02-2.93
MAYMAX
4.855.355.235.204.75
4.354.143.573.263.60
4.485.185.505.705.77
5.565.535.084.293.40
3.222.802.262.663.15
3.964.624.815.095.365.66
MIN
-3.62-3.96-3.68-4.12-4.26
-4.16-3.64-3.67-3.16-3.05
-2.49-2.27-2.75-3.80-4.06
- .24- .35- .26- .41- .27
-3.41-3.18-2.98-2.52-2.09
-1.77-1.76-2.30-3.25-3.81-4.18
JUNEMAX
5.575.696.555.154.07
3.603.714.034.574.40
4.664.534.504.354.36
4.274.033.793.102.75
2.623.373.503.754.05
3.994.254.594.764.68
MIN
-4.-4.-3.-4.-4.
-3.-3.-2.-2.-3.
-4.-4.-5.-4.-5.
-4.-4.-3.-3.-3.
-2.-2.-1.-2.-2.
-3.-4.-4.-5.-5.
1933572708
4616675228
2162009700
803696692-
6800362186
6750980000
JULYMAX
4.834.954.503.643.83
3.904.084.004.054.31
4.454.704.564.384.28
3.643.022.563.023.05
2.883.013.293.674.43
.77
.87
.90
.72
.83
.74
MIN
-5.-4.-4.-4.-3.
-2.-2.-3.-4.-4.
-4.-4.-4.-4.-4.
-4.-4.-3.-3.-2.
-2.-2.-2.-3.-3.
-4.-4.-5.-5.-5.-5.
0084813160
8888280139
4145393749
5141920445
3647943782
166800000000
AUGUSTMAX
4.254.354.404.474.14
3.883.733.673.894.07
4.063.903.963.603.18
3.303.222.963.013.15
3.483.864.194.474.78
4.884.534.674.655.37 '4.69
MIN
-4-3-2-2-2
-3-3-3-4-4
-4-4-4-3-3
-2-2-2-2-2
-2-3-3-3-4
-4-4-4-3-3-3
.35
.54
.83
.63
.86
.27
.53
.94
.22
.15
.07
.07
.00
.78
.36
.78
.51
.77
.84
.72
.98
.15
.44
.96
.45
.68
.76
.54
.83
.05
.25
SEPTEMBERMAX
43333
33333
34333
33333
334-5
55554-
.18
.53
.17
.05
.02
.05
.32
.38
.33
.09
.34
.00
.94
.86
.69
.61
.34
.18
.43
.40
.53
.80
.30 .25
.00
.06
.06
.44
.65
MIN
-3.25-3.22-3.36-3.47-3.65
3.82-3.74-3.59-3.62-3.52
-3.12-2.60-2.61-2.97-3.04
-3.23-3.33-2.98-2.95-3.48
-3.91-3.99-3.86 -3.28
-3.97-4.46-4.37-3.69-3.52
MONTH 6.00 -4.60 5.77 -4.41 6.55 -5.00 4.95 -5.00 5.37 -4.76
36

Table 8. Maximum and minimum daily water levels for the Alsea River at Waldport--Continued
GAGE HEIGHT, IN FEET, WATER YEAR OCTOBER 1988 TO SEPTEMBER 1989
APRILDAY
12345
6789
10
1112131415
161718 1920
2122232425
262728293031
MONT1
MAX
4.795.124.785.265.53
5.765.615.515.425.24
4.323.413.052.472.70
3.123.483.81 4.084.30
4.344.694.764.614.59
4.243.473.022.983.74
H .5 . 7 6
MIN
-1.30-1.63-2.73-2.45-2.90
1 Q ̂ J O J
-4.53-4.77-4.61-4.20
-4.06-3.48-3.11-3.09-3.07
-2.88-2.46-2.530 ft ^~Z o J
«."> ft ^~Z O J
-2.97-3.35-3.51-3.51-3.28
-3.33-3.51-3.27-3.12-2.92
-4.77
MAY
MAX
4.074.625.235.575.71
5.77
4.704.15
3.292.482.692.963.09
3.494.204.14 3.973.97
4 no u o 4.354.584.613.78
3.393.213.493.724.114.55
MIN
-2.86-2.66-3.55-4.29-4.73
-4.95
-4.33-3.79
-3.40-3.18-2.83-2.36-2.02
-2.62-2.97-2.94 -3.93-4.35
-4.46-4.41-4.01-4.00-4.19
-3.88-3.50-2.90-2.76-2.76-3.73
JUNE JULYMAX
4.985.205.125.355.33
3.502.662.74
2.823.053.503.743.91
3.944.384.56
3.933.553.90
4.284.535.105.505.45...
MIN MAX
-4.14 5.48-4.73 -4.99 -5.01 -4.75
-4.26 -3.87 -3.13
-2.52 -1.91 -2.20 -2.53 -2.93
-3.65 -4.17 -4.14
-4.07 -3.68 -3.15
-2.22 -2.32 -2.87
-3.26 3.68-3.94 3.93 4.25
AUGUSTMIN MAX
-4.25 4 4 4 3 2
2 3
3 2 2
2 2 2 3 3
3 3 4 4 4
4 4
4 4 3
3 3 " 3
-4.61 3-4.63 3-4.72 3
4
.35
.52
.00
.55
.98
.73
.06
.06
.48
.12
.79
.47
.68
.57
.78
.65
.63
.07
.05
.56
.79D C OD
.52
.15
.92
.73
.67
.83
.93
.92
.93
.RS
MIN
-4.50-4.16-4.07-4.07-3.67
-3.11-2.55-2.59-2.65-2.97
-3.52-3.71-4.21-4.66-4.26
-4.36-4.32-4.15 ^ ft n J O U
-2.97
"> ft fi Z O U
0 ft ^ £. O J
-2.89-3.12-3.31
-3.51-3.86-4.01-3.90-3.74-3.36
-4 . fifi
SEPTEMBERMAX
3.813.422.823.503.36
2.64
3.10
__
4.00
4.905.165.10 4.353.79
/*
3.113.00
3.073.383.684.194.46...
MIN
-2.94-2.74-2.85-2.39-2.35
-2.95
-2.66
_ _
-3.60
-3.12-3.39-3.75_T R1 j O j_ » CO J.JO
-2.65-2.62
-2.71-2.59-2.29-2.06-2.53...
37
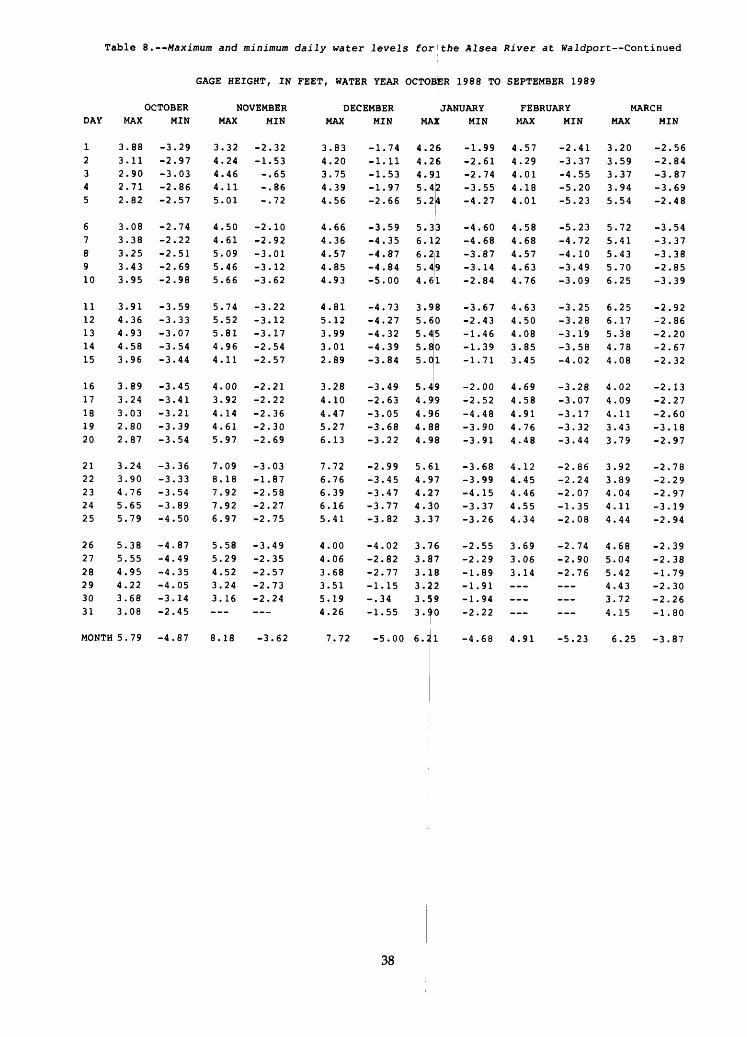
Table 8. Maximum and minimum daily water levels for the Alsea River at Waldport Continued
GAGE HEIGHT, IN FEET, WATER YEAR OCTOBJER 1988 TO SEPTEMBER 1989
DAY
1 2 3 4 5
6 7 8 9 10
11 12 13 1415
1617181920
2122232425
262728293031
OCTOBER MAX MIN
3.88 -3.29 3.11 -2.97 2.90 -3.03 2.71 -2.86 2.82 -2.57
3.08 -2.74 3.38 -2.22 3.25 -2.51 3.43 -2.69 3.95 -2.98
3.91 -3.59 4.36 -3.33 4.93 -3.07 4.58 -3.543.96
3.893.243.032.802.87
3.243.904.765.655.79
5.385.554.954.223.683.08
-3.44
-3.45-3.41-3.21-3.39-3.54
-3.36-3.33-3.54-3.89-4.50
-4.87-4.49-4.35-4.05-3.14-2.45
NOVEMBER MAX MIN
3.32 -2.32 4.24 -1.53 4.46 -.65 4.11 -.86 5.01 -.72
4.50 -2.10 4.61 -2.92 5.09 -3.01 5.46 -3.12 5.66 -3.62
5.74 -3.22 5.52 -3.12 5.81 -3.17 4.96 -2.544.11
4.003.924.144.615.97
7.098.187.927.926.97
5.585.294.523.243.16
-2.57
-2.21-2.22-2.36-2.30-2.69
-3.03-1.87-2.58-2.27-2.75
-3.49-2.35-2.57-2.73-2.24
DECEMBER MAX MIN
3.83 -1.74 4.20 -1.11 3.75 -1.53 4.39 -1.97 4.56 -2.66
4.66 -3.59 4.36 -4.35 4.57 -4.87 4.85 -4.84 4.93 -5.00
4.81 -4.73 5.12 -4.27 3.99 -4.32 3.01 -4.392.89
3.284.104.475.276.13
7.726.766.396.165.41
4.004.063.683.515.194.26
-3.84
-3.49-2.63-3.05-3.68-3.22
-2.99-3.45-3.47-3.77-3.82
-4.02-2.82-2.77-1.15-.34
-1.55
MA
4.2 4.2 4.9 5.4 5.2
5.3 6.1 6.2 5.4 4.6
3.9 5.6 5.4 5.85.0
JANUARY X MIN
6 -1.99 6 -2.61 1 -2.74 2 -3.55 4 -4.27
3 -4.60 2 -4.68 1 -3.87 9 -3.14 1 -2.84
8 -3.67 0 -2.43 5 -1.46 0 -1.391 -1.71
5.4^9 -2.004.99 -2.524.96 -4.484.88 -3.904.98 -3.91
5.61 -3.684.97 -3.994.27 -4.154.40 -3.373.37 -3.26
3.76 -2.553.87 -2.293.18 -1.893.}2 -1.913.59 -1.943.^0 -2.22
FEBRUARY MAX MIN
4.57 -2.41 4.29 -3.37 4.01 -4.55 4.18 -5.20 4.01 -5.23
4.58 -5.23 4.68 -4.72 4.57 -4.10 4.63 -3.49 4.76 -3.09
4.63 -3.25 4.50 -3.28 4.08 -3.19 3.85 -3.583.45
4.694.584.914.764.48
4.124.454.464.554.34
3.693.063.14
-4.02
-3.28-3.07-3.17-3.32-3.44
-2.86-2.24-2.07-1.35-2.08
-2.74-2.90-2.76
MARCH MAX MIN
3.20 -2.56 3.59 -2.84 3.37 -3.87 3.94 -3.69 5.54 -2.48
5.72 -3.54 5.41 -3.37 5.43 -3.38 5.70 -2.85 6.25 -3.39
6.25 -2.92 6.17 -2.86 5.38 -2.20 4.78 -2.674.08
4.024.094.113.433.79
3.923.894.044.114.44
4.685.045.424.433.724.15
-2.32
-2.13-2.27-2.60-3.18-2.97
-2.78-2.29-2.97-3.19-2.94
-2.39-2.38-1.79-2.30-2.26-1.80
MONTH 5.79 -4.87 8.18 -3.62 7.72 -5.00 6. -4.68 4.91 -5.23 6.25 -3.87
38

Table 8. Maximum and minimum daily water levels for Alsea River at Waldport Continued
GAGE HEIGHT,. IN FEET, WATER YEAR OCTOBER 1989 TO SEPTEMBER 1990
OCTOBERDAY
12 345
6789
10
1112131415
1617181920
2122232425
262728293031
MONTH
MAX
4.464.29 3.923.793.78
3.222.752.662.712.92
3.144.044.735.155.28
5.355.114.564.904.52
3.894.27
___
MIN
-2.70-3.12 -3.22-2.99-2.65
-2.90-2.88-2.81-2.80-3.25
-3.20-3.10-3.27-4.15-4.83
-5.19-4.97-4.49-3.38-3.12
-2.61-1.90
___
NOVEMBERMAX
4.06 4.023.662.94
2.582.813.194.074.53
5.015.705.48
4.934.363.602.783.18
3.083.414.484.825.44
5.184.524.59
MIN
-3.55 -2.87-2.84-2.85
-2.53-2.45-2.57-2.24-3.22
-3.95-4.48-4.77
-4.80-4.08-3.61-2.80-2.61
-2.29-1.76-1.53-1.47-1.79
-2.74-3.56-3.91
DECEMBER JANUARY FEBRUARYMAX
___
6.055.655.234.75
4.363.813.893.343.46
3.693.803.974.074.18
5.315.334.884.214.334.44
MIN MAX
__
-4-5-5-4
_ T
-3-2-2-1
1
-2-3-3-3
-3-3-4-4-4" 3
4.934.99
5.896.90
.97
.22
.72
.96
.06
.79
.22
.92
87 .42 .00 .63 .58
.53 __
.77
.45
.94
.31
.07
MIN MAX
1 39 -1.93
-1.24 - .87
5.15 4.38 3.55 3.20
1 QQ J O O
3.86 4.05 4.42 4.34 4.30
4.28 4.55
4.80
MARCHMIN MAX
5 5___ 4 4
___ 4
___ S
4 4
5
5 4
A
5 4
- .16 4- .97 4-2.01 3-2.42 3-1.76 3
-3.34 3-3.59 3-3.80 3-3.98 3-3.78 4
-3.34-2.76-3.07
c
.06
.03
.87
.70
.50
.10
.77
.94
.11
.55
.92
.30
.17
.30
.01
.15
.63
.37
.10
.18
.22
.42
.57
.36
.29
.36
.74
.85
.90
.08
MIN
-2.96 -2.57-2.47-2.55
-2.05-2.56-2.51-1.92-1.72
-1.47-1.95-2.42-1.78-2.57
-2.42-1.70-2.31-1.89-2.54
-2.90-2.84-3.49-3.59-3.00
-3.20-3.92-4.57-4.65-4.73-3.88
39
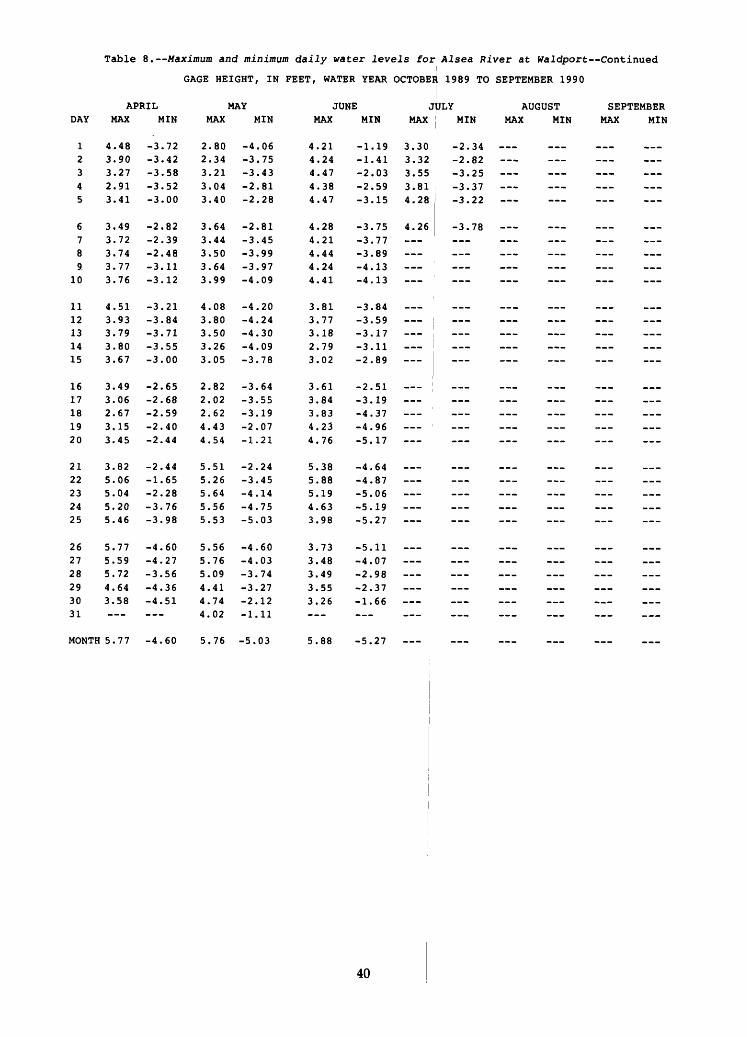
DAY
Table 8. Maximum and minimum daily water levels for Alsea River at Waldport Continued
GAGE HEIGHT, IN FEET, WATER YEAR OCTOBEli 1989 TO SEPTEMBER 1990
APRIL MAX MIN
MAY MAX MIN
JUNE MAX MIN
JJJLY MAX MIN
AUGUST MAX MIN
SEPTEMBER MAX MIN
6 3.49 -2.827 3.72 -2.398 3.74 -2.489. 3.77 -3.11
10 3.76 -3.12
11 4.5112 3.9313 3.7914 3.8015 3.67
16 3.4917 3.0618 2.6719 3.1520 3.45
21 3.8222 5.0623 5.0424 5.2025 5.46
262728293031
5.775.595.724.64
1 4.48 -3.72 2.80 -4.06 4.21 -1.19 3.30 -2.342 3.90 -3.42 2.34 -3.75 4.24 -1.41 3.32 -2.823 3.27 -3.58 3.21 -3.43 4.47 -2.03 3.55 -3.254 2.91 -3.52 3.04 -2.81 4.38 -2.59 3.81 -3.375 3.41 -3.00 3.40 -2.28 4.47 -3.15 4.28 I -3.22
3.64 -2.81 4.28 -3.75 4.26 -3.783.44 -3.45 4.21 -3.77 3.50 -3.99 4.44 -3.89 3.64 -3.97 4.24 -4.13 3.99 -4.09 4.41 -4.13
-4.20 3.81 -3.84 -4.24 3.77 -3.59 -4.30 3.18 -3.17 -4.09 2.79 -3.11 -3.78 3.02 -2.89
-3.64 3.61 -2.51 -3.55 3.84 -3.19-3.19 3.83 -4.37-2.07 4.23 -4.96-1.21 4.76 -5.17
-2.24 5.38 -4.64 -3.45 5.88 -4.87-4.14 5.19 -5.06 -4.75 4.63 -5.19 -5.03 3.98 -5.27
-4.60 3.73 -5.11 -4.03 3.48 -4.07 -3.74 3.49 -2.98 -3.27 3.55 -2.37
12 3.26 -1.66
5.76 -5.03 5.88 -5.27
-3.21-3.84-3.71-3.55-3.00
-2.65-2.68- 2.59-2.40-2.44
-2.44-1.65-2.28-3.76-3.98
-4.60-4.27-3.56-4.36
3.58 -4.51
4.083.803.503.263.05
2.822.022.624.434.54
5.515.265.645.565.53
5.565.765.094.414.744.02
-2
-1.11
MONTH 5.77 -4.60
40

Table 9. Maximum and minimum daily water levels for Alsea River at Drift Creek near Waldport, river mile 5.0.
LOCATION. Lat 44°24'54", long 124°31'54", in SW 1/4 NE 1/4 sec.27, T.13 S., R.ll W. , Lincoln County, Hydrologic Unit 17100205, on left bank, 4 miles east of Waldport, and at mile 5.0.
PERIOD OF RECORD. April 1989 to July 1990 (gage height).GAGE. Water-stage recorder. Datum of gage is 0.00 feet above National Geodetic Vertical Datum of
1929 (levels by Oregon Department of Transportation).REMARKS. Site is affected by tidal fluctuations.EXTREMES FOR PERIOD OF RECORD. Maximum gage height April 23, 1989 to July 11, 1990, 8.47 feet January 9, 1990; minimum gage height -2.99 feet June 21, 1989.
GAGE HEIGHT, FEET, WATER YEAR OCTOBER 1988 TO SEPTEMBER 1989
APRIL DAY MAX 1
1 2 3 4 5
6 7 8 9
10
11 12 13 14 15
16 17 18 19 20
2122232425
262728293031
4.88
4.74
4.343.523.073.123.72
MONTH
MAYUN
.__
.__
.__
, _
.__
2.25
-.16
2.322.502.462.432.13
__
MAX
4.214.845.335.395.86
5.955.635.164.844.24
3.382.592.853.063.25
3.513.964.244.154.09
4.244.504.664.693.88
3.473.373.593.884.344.69
5.95
MIN
-1.98-1.89-2.32-2.49-2.59
-2.66-2.76-2.70-2.64-2.59
-2.51-2.46-2.25-1.97-1.71
-2.10-2.25-2.21-2.58-2.76
-2.79-2.78-2.64-2.45-2.60
-2.60-2.40-2.13-2.07-2.04-2.45
-2.79
JUNEMAX
5.145.295.345.465.47
5.184.353.622.802.89
2.983.153.613.824.00
4.034.494.584.664.88
4.273.993.983.684.02
4.474.625.215.615.54
5.61
MIN
-2.65-2.76-2.83-2.82-2.77
-2.79-2.87-2.76-2.73-2.49
-2.27-1.81-1.92-2.12-2.30
-2.70-2.85-2.82-2.73-2.82
-2.99-2.95-2.74-2.66-2.39
-1.89-1.95-2.24-2.41-2.57
-2.99
JULYMAX
5.575.385.094.654.28
3.573.252.941.853.07
3.223.283.243.393.59
4.104.615.054.884.71
4.153.793.914.224.45
4.394.334.514.584.624.69
5.57
MIN
-2.68-2.76-2.79-2.84-2.91
-2.91-2.77-2.67-2.36-2.36
-1.84-2.10-2.44-2.67-2.80
-2.76-2.74-2.70-2.85-2.84
-2.85-2.78-2.57-2.32-2.24
-2.34-2.64-2.82-2.89-2.93-2.88
-2.93
AUGUSTMAX
4.785.084.483.773.40
3.463.393.373.323.05
3.183.443.683.954.31'
4.384.524.454.354.85
5.054.994.474.103.95
3.893.864.134.044.264.11
5.08
MIN
-2.76-2.44-2.51-2.58-2.50
-2.25-1.92-1.91-1.95-2.17
-2.55-2.64-2.88-2.94-2.98
-2.92-2.84-2.72-2.58-2.31
-2.01-2.23-2.33-2.57-2.70
-2.71-2.84-2.82-2.73-2.62-2.53
-2.98
SEPTEMBERMAX
3.853.553.473.823.86
3.643.443.343.233.46
3.744.224.574.484.69
5.375.745.775.234.70
4.363.853.743.743.82
3.763.824.034.354.36
5.77
MIN
-2.37-2.28-2.224-2.00-2.05
-2.06-2.22-2.23-2.25-2.46
-2.61-2.73-2.65-2.54-2.40
-2.21-2.34-2.52-2.43-2.64
-2.67-2.55-2.42-2.22-2.25
-2.27-2.12-1.95-1.85-2.14
-2.73
41
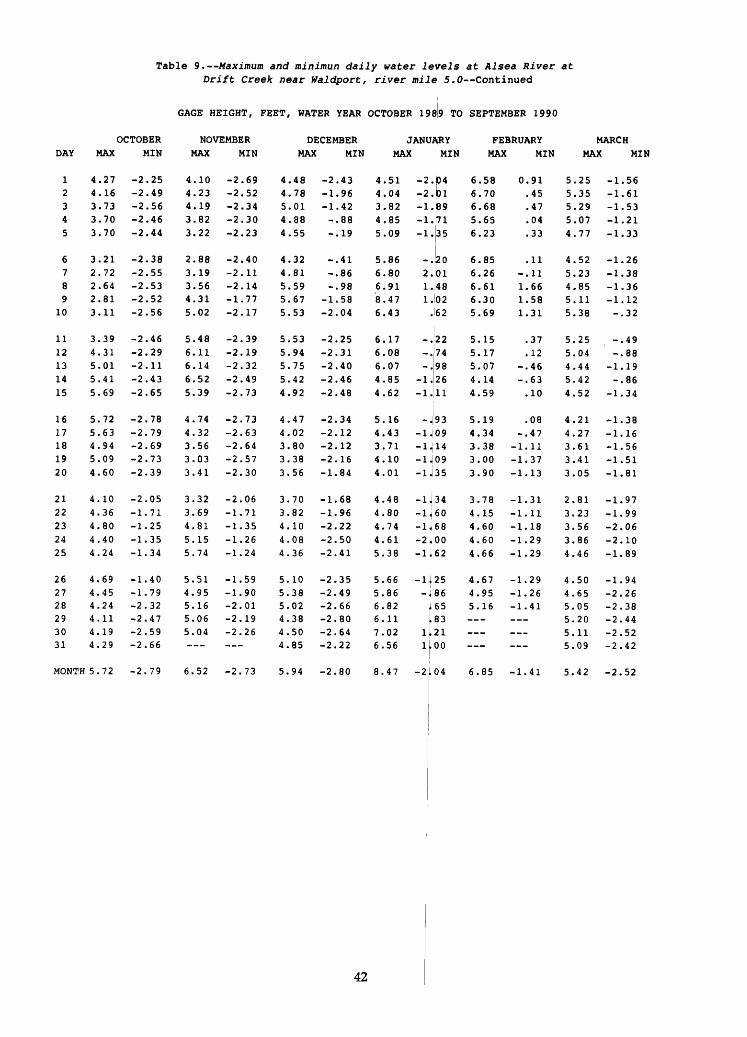
Table 9. Maximum and minimun daily water levels at Alsea River at Drift Creek near Waldport, river mile 5.0 Continued
GAGE HEIGHT, FEET, WATER YEAR OCTOBER 1989 TO SEPTEMBER 1990
OCTOBERDAY
12345
6789
10
1112131415
1617181920
2122232425
262728293031
MONTH
MAX
4.274.163.733.703.70
3.212.722.642.813.11
3.394.315.015.415.69
5.725.634.945.094.60
4.104.364.804.404.24
4.694.454.244.114.194.29
5.72
MIN
-2.25-2.49-2.56-2.46-2.44
-2.38-2.55-2.53-2.52-2.56
-2.46-2.29-2.11-2.43-2.65
-2.78-2.79-2.69-2.73-2.39
-2.05-1.71-1.25-1.35-1.34
-1.40-1.79-2.32-2.47-2.59-2.66
-2.79
NOVEMBERMAX
4.104.234.193.823.22
2.883.193.564.315.02
5.486.116.146.525.39
4.744.323.563.033.41
3.323.694.815.155.74
5.514.955.165.065.04
6.52
MIN
-2.69-2.52-2.34-2.30-2.23
-2.40-2.11-2.14-1.77-2.17
-2.39-2.19-2.32-2.49-2.73
-2.73-2.63-2.64-2.57-2.30
-2.06-1.71-1.35-1.26-1.24
-1.59-1.90-2.01-2.19-2.26
-2.73
DECEMBERMAX
4.484.785.014.884.55
4.324.815.595.675.53
5.535.945.755.424.92
4.474.023.803.383.56
3.703.824.104.084.36
5.105.385.024.384.504.85
5.94
MIN
-2.43-1.96-1.42-.88-.19
-.41-.86-.98
-1.58-2.04
-2.25-2.31-2.40-2.46-2.48
-2.34-2.12-2.12-2.16-1.84
-1.68-1.96-2.22-2.50-2.41
-2.35-2.49-2.66-2.80-2.64-2.22
-2.80
JANUARYMAX
4.514.043.824.855.09
5.866.806.918.476.43
6.176.086.074.854.62
5.164.433.714.104.01
4.484.804.744.615.38
5.665.866.826.117.026.56
8.47
MIN
-2.-2.-1.-1.-1.
0401B97135
-lo2.1011.481.02.62
-.22-.-.
-1.-1.
_ e
74982611
93-1.109-1,14-1409-1.35
-1J34-1^60-1^68-2.00-1J62
-1J25-.86
|65183
1 ,1 ,
2100
-2L04
FEBRUARYMAX
6.586.706.685.656.23
6.856.266.616.305.69
5.155.175.074.144.59
5.194.343.383.003.90
3.784.154.604.604.66
4.674.955.16
6.85
0....
-.
1.1.1.
.-.-.
.-.
-1.-1.-1.
-1.-1.-1.-1.-1.
-1.-1.-1.
-1.
MIN
9145470433
1111665831
3712466310
0847113713
3111182929
292641
41
MARCHMAX
5.255.355.295.074.77
4.525.234.855.115.38
5.255.044.445.424.52
4.214.273.613.413.05
2.813.233.563.864.46
4.504.655.055.205.115.09
5.42
MIN
-1.56-1.61-1.53-1.21-1.33
-1.26-1.38-1.36-1.12-.32
-.49-.88
-1.19-.86
-1.34
-1.38-1.16-1.56-1.51-1.81
-1.97-1.99-2.06-2.10-1.89
-1.94-2.26-2.38-2.44-2.52-2.42
-2.52
42

Table 9. Maximum and minimum daily water levels for Alsea River at Drift Creek near Waldport, river mile 5.0 Continued
GAGE HEIGHT, FEET, WATER YEAR OCTOBER 1989 TO SEPTEMBER 1990
DAY
12345
67
910
1112131415
16171 o
1920
2122232425
2700
293031
M
4.4.3.2.3.
3.3.3.3.4.
4.4.4.4.3.
3.3.2.3.3.
4.5.5.5.5.
6.6.5.4.3.
AX
7ft
06269530
6591949415
6011000175
5520630159
0530334476
2214ftd
9270
APR:i
-2-2-2-2-2
-2-1-2-2-2
-2-2-2-2-2
-2-2-2-2-1
-1-1-1-2-2
-2-1
-1-1
[L MIN
.41
.36
.424ft
.13
.02
.92
.01
.27
.19
.24
.53-
.49
.47
.34
.24
.24
.29
.12
.90
.91
.57
.62
.25
.26
.34
.26no
.90
IMAX
2 ft£
2.542 fin
3.433 /r o
3 fid
3.753 ft i
4.27
4.234.003.613.413.11
2.512.232 1 ft
4.574.77
5 fin
5.745.936.015.94
6.056.235.454.634.944.S8
1AY1
-2-2-2-1-1
-1
-2-2-2
-2-2-2-2-2
-2-2-2-1-1
-1-2-2-2-2
-2-2-2
-1
MIN
.13
.13
.11ft7
.67
Oft
00
.48
.49
.48
.55
.66
.71
.70
.75
.65
.48
.93
.37
pc
.22
.46
.63
.72
.64
.39
.26O ft
.65
.2fi
44444
44444
44333
34445
55654
43333
MA:
.17
.46
.53
.73on
.57
.49
.59
.75
.48
.31
.00
.70
.20
.27
oq
.24
.21
.67
.23
.93on
.14
.65
.99
.19co7ft
ft 7
.64
JUN1 <
-1.-1.-1.-1.-1.
-2.-2.-2.-2.-2.
-2.-2.
-2.-2.
-1.-1.-2.-2.
-2.
-2.-2.
-2.-2.-2.-1.-1.
I JULY AUGUST SEPTEMBER MIN MAX MIN MAX MIN MAX MIN
11 3.62 -2.01 25 3.58 -2.26 30 3.90 -2.51 69 4.50 -2.55 94 4.59 -2.43
09 4.57 -2.58 16 4.57 -2.71 23 4.47 -2.79 30 4.27 -2.83 40 3.91 -2.86
43 29 O ft
21 20
9264 24 67 on
79
70
73"7Q
79 67 30 00 ___
60
MONTH 6.22 -2.53 6.23 -2.75 6.14 -2.80
43

Table 10. Maximum and minimum daily water levels for Alsea River at Kozy Kove near Waldport, rivef mile 11.2
LOCATION. Lat 44°24'41", long 123°54'37", in NE 1/4 SW 1/4 County, Hydrologic Unit 17100205, on right bank, 10 miles PERIOD OF RECORD. April 1989 to current year, (gage height)
sec.28, T.13 S., R.10 W., Lincoln east of Waldport, and at mile 11.2.
GAGE. Water-stage recorder. Datum of gage is 0.00 feet ab 1929 (levels by Oregon Department of Transportation). Apr
REMARKS. Record is poor. Site is affected by tides. EXTREMES FOR PERIOD OF RECORD. Maximum gage height, 11.23 -3.24 feet July 28-30, Aug. 15, 1989.
GAGE HEIGHT, FEET, WATER YEAR OCTOBER 1
APRILDAY MAX MIN
1 2 3 4
5
6 7 8
910
11 12
1314
15
16 17 18
1920
21
22 5.10 -2.1523 5.17 -2.2024 5.02 -2.1225 5.00 -2.15
26 4.57 -2.2827 3.79 -2.3928 3.27 -2.3929 3.47 -2.4330 4.18 -2.1031
MONTH
MAYMAX
4.705.325.89 6.326.37
6.10 5.775.495.184.53
3.632.823.101.863.36
3.553.894.534.504.44
4.554.79
5.054.18
3.723.673.954.264.695.20
___
MIN
-1.96-1.91-2.34 -2.47-2.53
-2.60 -2.65-2.61-2.57-2.52
-2.49-2.49-2.26-1.97-1.79
-2.13-2.30-2.20-2.55-2.72
-2.77-2.77
-2.55-2.69
-2.75-2.49-2.24-2.14-2.18-2.57
___
JUNEMAX
5.715.835.88 6.016.07
5.79 5.034.243.413.47
3.593.704.194.424.65
4.715.175.175.435.57
4.944.724.674.584.77
5.245.365.846.246.14
6.24
MIN
-2.74-2.84-2.89 -2.91-2.77
-2.79 -2.77-2.68-2.72-2.38
-2.22-1.77-1.96-2.10-2.27
-2.70-2.86-2.74-2.67-2.74
-2.88-2.84-2.75-2.68-2.34
-1.89-1.96-2.24-2.44-2.55
-2.91
ave National Geodetic Vertical Dat il 21, 1989 to July 10, 1990.
feet Jan. 7, 1990; minimum gage h
»88 TO SEPTEMBER 1989
JUllYMAX
6.286.216.14 5.885.19
4.44 3.973.633.643.76
3.803.733.834.104.53
5.115.455.575.395.19
4.564.274.334.504.73
4.584.544.814.905.185.01
6.28
MIN
-2.65-2.72-^.74 -2.77-2.84
-£.85 -2.72-2.65-2.33-1.87
-1.84-2.17-2.52-2.77-2.92
-2.89-2.89-2.87-3.04-3.13
_-3.173.09
-2.99-2.80-2.77
_-----
2.883.173.243.243.243.09
-b. 24
AUGUSTMAX
5.395.675.06 4.354.11
4.17 4.013.943.743.38
3.603.844.194.464.76
4.865.155.135.255.66
5.715.525.004.544.40
4.324.364.654.524.764.60
5.71
MIN
-2.91-2.51-2.58 -2.71-2.63
-2.39 -2.06-2.03-2.10-2.32
-2.71-2.85-3.09-3.14-3.24
-3.13-3.05-2.92-2.70-2.50
-2.43-2.43.-2.50-2.73-2.89
-2.91-3.02-3.02-2.91-2.85-2.80
-3.24
SEPTEMBERMAX
4.434.234.14 4.504.48
4.16 3.953.853.773.99
4.244.805.285.515.62
6.286.616.566.065.52
5.124.594.444.534.62
4.755.015.235.245.18
6.61
MIN
-2.62-2.51-2.39 -2.14-2.19
-2.34 -2.31-2.31-2.53-2.70
-2.85-2.85-2.64-2.53-2.26
-2.22-2.36-2.58-2.62-2.65
-2.49-2.34-2.09-2.14-2.19
-2.08-1.94-1.71-1.82-2.11
-2.85
44

Table 10. Maximum and minimum daily water levels for Alsea River at Kozy Kove near Waldport, river mile 11.2 Continued
GAGE HEIGHT, FEET, WATER YEAR OCTOBER 1989 TO SEPTEMBER 1990
OCTOBERDAY
12345
6789
10
1112131415
1617181920
2122232425
262728293031
MAX
5.215.094.554.364.38
3.713.243.093.273.49
3.734.815.435.716.25
6.346.685.985.905.38
4.685.005.394.864.69
5.144.754.494.684.835.08
MIN
-2.19-2.45-2.56-2.48-2.51
-2.40-2.59-2.55-2.58-2.64
-2.74-2.63-2.61-2.59-2.58
-2.57-2.55-2.55-2.54-2.24
-1.90-1.59-1.28-1.57-1.66
-1.63-2.16-2.41-2.40-2.39-2.37
NOVEMBERMAX
4.965.395.314.834.13
3.724.014.325.035.71
6.197.006.827.296.41
6.165.554.684.124.42
4.174.415.525.766.23 '
5.945.235.485.495.87
MIN
-2.36-2.16-2.16-1.99-1.93
-2.08-1.88-2.05-1.83-2.24
-2.23-2.10-2.20-2.19-2.17
-2.17-2.15-2.11-2.13-2.08
-1.87-1.62-1.37-1.35-1.30
-1.71-2.02-2.01-1.99-1.98
DECEMBERMAX
5.455.956.075.936.99
5.265.646.496.536.45
6.476.836.646.566.17
5.685.295.174.514.65
4.684.774.934.845.13
6.026.26 5.945.285.275.69
MIN
-1.97-1.96-1.59-1.151.75
.76-.18-.08-.80
-1.36
-1.73-1.82-1.81-1.80-1.78
-1.78-1.77-1.59-1.71-1.39
-1.27-1.68-1.68-1.67-1.65
-1.64-1.63-1.61-1.60-1.60-1.59
JANUARYMAX
5.374.944.655.685.81
6.7411.2310.4610.248.19
7.477.056.875.615.22
5.624.793.744.454.32
4.885.225.225.076.01
6.526.687.687.968.377.87
MIN
-1.57-1.56-1.55-1.53-1.01
, >7 °5.795.744.153.61
1.84.70.02
-.57-.60
-.63-.89
-1.23-.87-.97
-.97-.97-.97-.97-.97
-.31
.461.873.233.972.83
FEBRUARYMAX
7.617.637.436.566.99
7.676.918.017.967.76
6.675.996.004.705.07
5.674.76
___
___
MIN
2.742.252.191.731.96
1.831.711.425.325.18
3.462.001.14.20.10
.75
.71
___ -
___
MARCHMAX
6.70
5.645.555.25
4.895.735.405.616.11
5.775.614.955.924.85
4.444.643.913.733.36
3.003.523.954.414.94
5.145.345.876.005.835.72
MIN
.04 -.89-.25-.55
-.67-.70-.77-.53
1.01
.47-.12-.48-.25-.86
-.86-.79-.87-.87-.87
-.88-.88-.88-.89-.89
-.89-.90-.90-.90-.90-.91
MONTH 6. 68 -2.74 7.29 -2.36 6.99 -1.97 11.23 -1.57
45

Table 10. Maximum and minimum daily water ievels for Alsea River at Kozy Kove near Waldport, river mile 11.2 Continued
GAGE HEIGHT, FEET, WATER YEAR OCTOBER 19$9 TO SEPTEMBER 1990
DAY
12345
67
910
1112131415
16171 Q
1920
712223?425
26?7O Q
293011
MAX
5.394.56Q 01
3.513 QQ
4.224.404 ai
4.704.76
5.334.794.684.554.35
4.073.673.043.604.20
4.725.995.996.126.41
6.846.746.845.504.13
APRIL MIN
-.91-.91-.92-.92-.92
-.93-.93-.93-.94-.94
-.94-.95-.95-.95-.95
-.96
-.97-.97
-.97ononon
-.99
-.99-.62
1.17-.57
-1.00
t>
3.3.3.3.4.
4.4.4.4.4.
4.4.4.3.3.
2.2.3.5.5.
6.6.6.6.6.
6.6.5.5.5.5.
f 1AX
3009229515
A Q
48344490
795613
55
9271272133
3633395245
597491013700
[AY MIN
-1.01-1.01-1.01-1.02-1.02
-1.02-1.02-1.03-1.03-1.03
-1.04-1.04-1.04-1.05-1.05
-1.05-1.06-1.06-1.06-1.07
-1.07-1.07.1 no
i no_ i nfl
-1.09-1.09-1.09-1.10-1.10-1.10
44455
44454
44433
44455
66665
54444
MAX
.52
.92O£
no1 O
no
ao
.94
.100 A
.70
.43
.06
.63
.43£O
.73
.26n i
.56
.59Q a
.53oc
.09CO
.73
.76
.49
JUN!M
-1.-1.-1.-1.-1.
-1.-1.-1.-1.-1.
-1.-1.-1.-1.-1.
-1.-1.-1.-1.-1.
-1.-1.-1.-1.-1.
-1.-1.-1.-1.-1.
! UN
1011111112
1212131313
1414141414
1414141414
1414141414
1414141414
JULY MAX M
4.56 -U
4.46 -1.4.83 -1.5.43 -1.5.53 -1.
5.63 -1.
5 £O 1
5.56 -1.5.39 -1.
"i
!
AUGUST SEPTEMBER IN MAX MIN MAX MIN
14 14 14 14 14
14 14 14 14
MONTH 6. 84 -1.00 6.74 -1.10 6.86 -1.14
46

Instrument shelter located on pier 6. Top shelf (left to right) velocity meter, data logger, depth sounder. Bottom shelf, telephone, flood tide velocity meter, and depth sounder.
Second instrument shelter located on work trestle.
47

Table 11. Discharge measurements taken in\ the Alsea River Estuary
TIDE DISCHARGI
LOCATION DATE TYPE CUBIC FBI
PER SECO1
MOUTH RM 0.0 4/13/88 EBB 35,100
MOUTH RM 0.0 4/14/88 FLOOD 38,900
RM 1.1 12/12/89 EBB 42,600
DRIFT CR RM 5.0 12/13/89 EBB 12,000
1 AREA MEAN VELOCITY
IT SQUARE FEET PER
ID FEET SECOND
7,290 4.81
8,120 4.79
19,200 2.22
5,300 2.26
48