Embed Size (px)
Citation preview

BRICS JOINT STATISTICAL PUBLICATION
2011
103
104
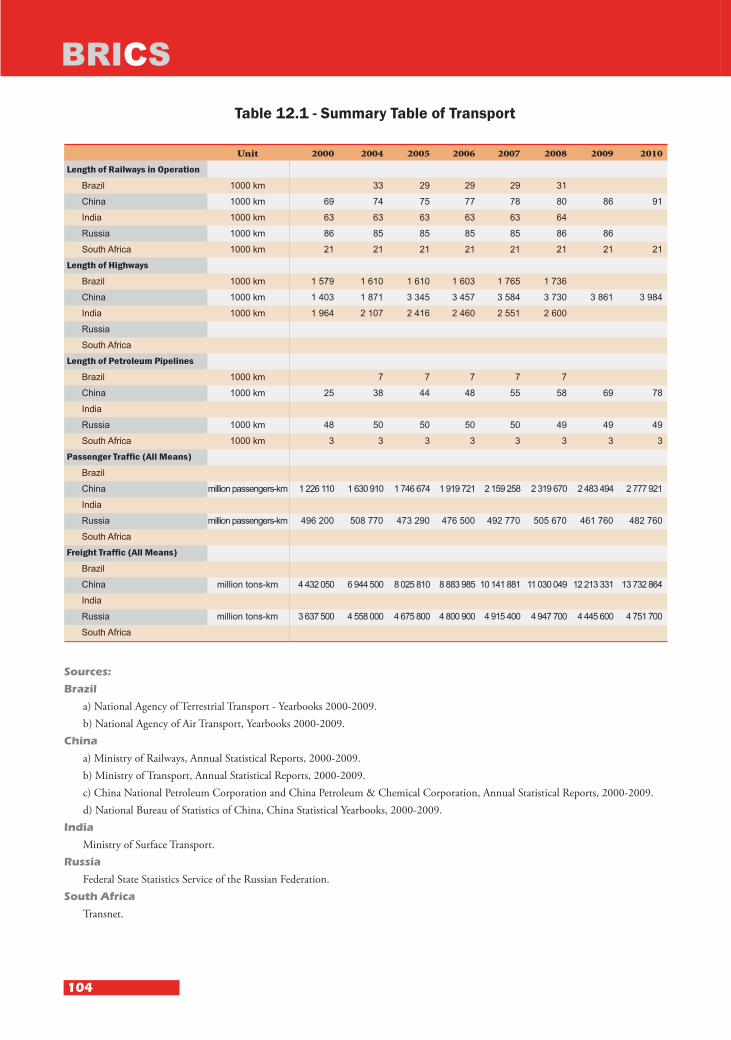
BRICSTable 12.1 - Summary Table of Transport
Sources:
Brazil
a) National Agency of Terrestrial Transport - Yearbooks 2000-2009. b) National Agency of Air Transport, Yearbooks 2000-2009.
China
a) Ministry of Railways, Annual Statistical Reports, 2000-2009. b) Ministry of Transport, Annual Statistical Reports, 2000-2009. c) China National Petroleum Corporation and China Petroleum & Chemical Corporation, Annual Statistical Reports, 2000-2009. d) National Bureau of Statistics of China, China Statistical Yearbooks, 2000-2009.
India
Ministry of Surface Transport. Russia
Federal State Statistics Service of the Russian Federation. SouthAfrica
Transnet.
Unit 2000 2004 2005 2006 2007 2008 2009 2010
Length of Railways in Operation Brazil 1000km 33 29 29 29 31 China 1000km 69 74 75 77 78 80 86 91India 1000km 63 63 63 63 63 64 Russia 1000km 86 85 85 85 85 86 86SouthAfrica 1000km 21 21 21 21 21 21 21 21
Length of Highways Brazil 1000km 1579 1610 1610 1603 1765 1736 China 1000km 1403 1871 3345 3457 3584 3730 3861 3984India 1000km 1964 2107 2416 2460 2551 2600 Russia SouthAfrica
Length of Petroleum Pipelines Brazil 1000km 7 7 7 7 7 China 1000km 25 38 44 48 55 58 69 78India Russia 1000km 48 50 50 50 50 49 49 49SouthAfrica 1000km 3 3 3 3 3 3 3 3
Passenger Traffic (All Means) BrazilChina millionpassengers-km 1226110 1630910 1746674 1919721 2159258 2319670 2483494 2777921India Russia millionpassengers-km 496200 508770 473290 476500 492770 505670 461760 482760SouthAfrica
Freight Traffic (All Means) Brazil China milliontons-km 4432050 6944500 8025810 888398510141881 11030049 12213331 13732864India Russia milliontons-km 3637500 4558000 4675800 4800900 4915400 4947700 4445600 4751700SouthAfrica

BRICS JOINT STATISTICAL PUBLICATION
2011
105
Table 12.2.1 - Selected Data on Transport – Brazil
Unit 2000 2002 2003 2004 2005 2006 2007 2008
TotalTraffic PassengerTrafficbyRoad(1) millionpersons 30 30 28 28 27PassengerTrafficbyRailway millionpersons-km 475 452 464 444TransportofGoodsbyRailway milliontons-km 205711 221633 238054 257118 266967PassengerTrafficbyAir(2) millionpersons-km 48 48 46 51 59 57 59 71TransportofGoodsbyAir(2) milliontons-km 6774 6796 6677 7343 8185 7725 7604 8535FreightTrafficofPetroleumPipelines milliontons 254 240 251 OwnershipofAutomobiles NumberofRegisteredAutomobiles 1000units 19973 23036 23669 24936 26309 27869 29852 32055PassengerCarsandBuses 1000units 20234 23332 23973 25257 26644 28222 30227RoadTrafficAccidentInvolvingPersonalInjuryorDeath Accidents numberofcases 378811 393434 461125 499770 539919 424137 508186NumberofInjured person 358762 374557 439065 474244 513510 404385 484900NumberofDeath person 20049 18877 22060 25526 26409 19752 23286
Sources:
a) National Agency of Terrestrial Transport - yearbook 2000-2009. b) National Agency of Air Transport, Yearbook 2000-2009.
Footnotes:
(1) It refers to the interstate and international collective passenger transport. (2) It refers to paid traffic domestic and international.
Graph 12.1.1 Length of Railways in Operation (2000-2010)

106
BRICS
Sources:
a) Ministry of Railways, Annual Statistical Reports, 2000-2009. b) Ministry of Transport, Annual Statistical Reports, 2000-2009. c) China National Petroleum Corporation and China Petroleum & Chemical Corporation, Annual Statistical Reports, 2000-2009. d) National Bureau of Statistics, China Statistical Yearbooks, 2000-2009. e) The Ministry of Public Security of the People's Republic of China, Annual Statistical Report, 2000-2009.
Table 12.2.2 - Selected Data on Transport – China
Unit 2000 2004 2005 2006 2007 2008 2009 2010
TotalTraffic PassengerTrafficbyRoad millionpersons-km 665742 874840 929208 1013085 1150677 1247611 1351144 1491389TransportofGoodsbyRoad milliontons-km 612940 784090 869320 975425 1135469 3286819 3718882 4300543PassengerTrafficbyRailway millionpersons-km 453259 571220 606196 662212 721631 777860 787889 876218TransportofGoodsbyRailway milliontons-km 1377050 1928880 2072600 2195441 2379700 2510628 2523917 2764413PassengerTrafficbyAir millionpersons-km 97054 178230 204493 237066 279173 288280 337524 403160TransportofGoodsbyAir milliontons-km 5027 7180 7890 9428 11639 11960 12623 17660LengthofDomesticCivilAviationRoutes 1000km 994 1155 1143 1147 1296 1342 1425FreightTrafficofPetroleumPipelines milliontons 187 247 310 334 406 439 446 500NumberofCivilAirports units 139 133 135 142 148 152 165 175OwnershipofAutomobiles NumberofRegisteredAutomobiles 1000units 16089 26937 31597 36974 43584 50996 62806 78018PassengerCars 1000units 15333 19187 23952 29616 35953 45913RoadTrafficAccidentInvolvingPersonalInjuryorDeath Accidents numberofcases 616971 517889 450254 378781 327209 265204 238351NumberofInjured person 418721 480864 469911 431139 380442 304919 275125NumberofDeath person 93853 107077 98738 89455 81649 73484 67759
BRICS JOINT STATISTICAL PUBLICATION
2011
107
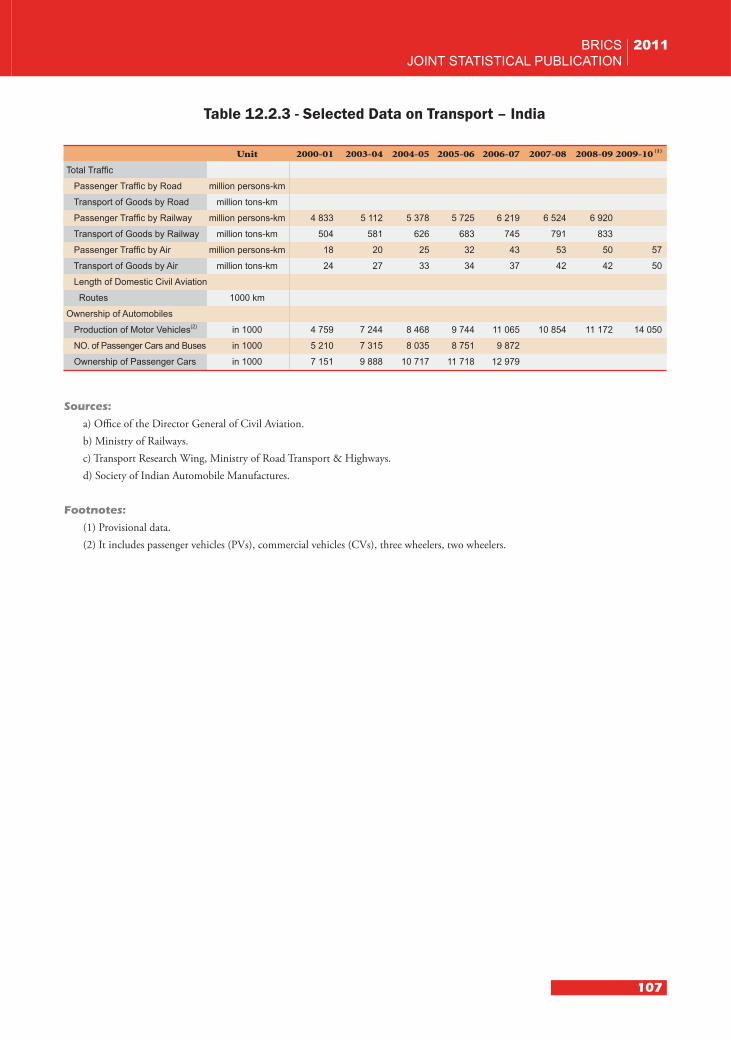
Table 12.2.3 - Selected Data on Transport – India
Unit 2000-01 2003-04 2004-05 2005-06 2006-07 2007-08 2008-09 2009-10 (1)
TotalTraffic PassengerTrafficbyRoad millionpersons-km TransportofGoodsbyRoad milliontons-km PassengerTrafficbyRailway millionpersons-km 4833 5112 5378 5725 6219 6524 6920TransportofGoodsbyRailway milliontons-km 504 581 626 683 745 791 833PassengerTrafficbyAir millionpersons-km 18 20 25 32 43 53 50 57TransportofGoodsbyAir milliontons-km 24 27 33 34 37 42 42 50LengthofDomesticCivilAviationRoutes 1000km OwnershipofAutomobiles ProductionofMotorVehicles(2) in1000 4759 7244 8468 9744 11065 10854 11172 14050NO.ofPassengerCarsandBuses in1000 5210 7315 8035 8751 9872 OwnershipofPassengerCars in1000 7151 9888 10717 11718 12979
Sources:
a) Office of the Director General of Civil Aviation. b) Ministry of Railways. c) Transport Research Wing, Ministry of Road Transport & Highways. d) Society of Indian Automobile Manufactures.
Footnotes:
(1) Provisional data. (2) It includes passenger vehicles (PVs), commercial vehicles (CVs), three wheelers, two wheelers.

108
BRICS
Source:
Federal State Statistics Service of the Russian Federation.
Footnotes:
(1) Transports of goods by all types of organizations. (2) Public roads. Local roads are included since 2006.(3) Number of cars in the property of physical and legal persons. (4) Since 2009 number of persons who was died within 30 days after accidents, before 2009 - persons who was died within 7 days.
Table 12.2.4 - Selected Data on Transport – Russia
Unit 2000 2004 2005 2006 2007 2008 2009 2010
TotalTraffic PassengerTrafficbyRoad millionpassengers-km 171869 161724 133476 126421 118135 115436 106947 102587TransportofGoodsbyRoad(1) milliontons-km 152735 182141 193597 198766 205849 216276 180136 199341PassengerTrafficbyRailway millionpassengers-km 167054 164272 172217 177838 174085 175872 151467 139028TransportofGoodsbyRailway milliontons-km 1373178 1801601 1858093 1950830 2090337 2116240 1865305 2011308PassengerTrafficbyAir millionpassengers-km 53410 82955 85774 93932 111002 122601 112469 147110TransportofGoodsbyAir milliontons-km 2515 3003 2830 2927 3424 3692 3558 4711FreightTrafficofPetroleumPipelines milliontons 295 442 454 461 462 456 474 492LengthofRoadsinOperation(2) 1000km 532 546 531 597 624 629 647OwnershipofAutomobiles(3) NumberofRegisteredLorries 1000units 4401 4770 4849 4929 5168 5349 5323 5414PassengerCarsandBuses 1000units 20993 24974 26362 27618 30287 32915 33980 35248RoadTrafficAccidentInvolvingPersonalInjuryorDeath Accidents numberofcases 157596 208558 223342 229140 233809 218322 203618 199431NumberofInjured person 179401 251386 274864 285362 292206 270883 255484 250635NumberofDeath(4) person 29594 34506 33957 32724 33308 29936 27659 26567

BRICS JOINT STATISTICAL PUBLICATION
2011
109
Sources:
a) Statistics South Africa. b) Passenger Rail Agency of South Africa. c) Transnet.
Footnotes:
(1) Passenger Rail Agency of South Africa. (2) Transit Pipelines. (3) These figures cover Metro rail only. (4) The Land Transport Survey is a monthly survey which covers passenger and freight transportation by rail and road in South Africa. This survey is based on a sample drawn from the 2010 Business Sampling Frame (BSF) that contains businesses registered for value-added tax. This survey has replaced the Land Freight Survey which was discontinued in 2003, and was re-engineered from 2008.(5) The data for 2010 are preliminary.
Table 12.2.5 - Selected Data on Transport – South Africa(4)
Unit 2003 2004 2005 2006 2007 2008 2009 2010(5)
TotalTraffic PassengerTrafficbyRoad millionpersons 283 288 288TransportofGoodsbyRoad milliontons 479 427 450PassengerTrafficbyRailway(1) millionpersons(3) 482 492 498 503 592 613 644 520TransportofGoodsbyRailway milliontons 183 183 186FreightTrafficofPetroleumPipelines(2) milliontons(4) 16430 16110 17032 16893 17216 17751OwnershipofPassengerCars PassengerCarsandBuses 1000units 4583 4863 5193 5477 5598 5739RoadTrafficAccidentInvolvingPersonalInjuryorDeath NumberofDeath person 10767 10753 11031 10946 12001 9346

110
BRICSExplanatoryNotes:
China
Length of Railways In Operation refers to the total length of the trunk line for passenger and freight transportation( including both full operation and temporary operation).Length of Highways refers to the length of highways which are built in conformity with the grades specified by the highway engineering standard [Highways WTBZ-Technical Standard JTJ01-88] formulated by the Ministry of Transport,and have been formally checked and accepted by the departments of highways and put into use.Length of Petroleum Pipelines refers to the actual transport distance of oil (or gas) products, which is in general calculated according to the length of single pipeline.Freight Ton-Kilometres (Passenger-kilometres) refers to the sum of the product of the volume of transported cargo (passengers) multiplied by the transport distance.Freight Traffic of Petroleum Pipelines refers to the total amount of oil (or gas) transported through petroleum pipelines. Number of Civil Airports refers to the total number of areas assigned for civil aviation flights to do take-off, landing, taxiing, parking and other actions.Ownership of Automobiles refers to the total number of vehicles that are registered and received vehicles license tags according to the Work Standard for Motor Vehicles Registration formulated by the Transport Management Office under the department of public security at the end of the reference period.
Russia
Public Roads refer to the federal roads of federal property; regional and intermunicipal roads of the property of constituent entities of the Russian Federation; local roads of the property municipalities as well as of property of settlements, municipal and city districts.


![[AW]policy BRICS - ITD · กลุ่มประเทศ brics จะก่อให้เกิดประโยชน์ทางเศรษฐกิจกับไทย”](https://img.dokumen.tips/doc/110x75/5eb6589d95ac763ff45c6af5/awpolicy-brics-aaaaaaaaaaa-brics-aaaaaafaaaaaaaaaaaaaaoeaaaaaaaaaaaaaaaaaa.jpg)


