Embed Size (px)
Citation preview

External control and red tape:
The mediating effects of client and organizational feedback
Gene A. Brewer Department of Public Administration and Policy
The University of Georgia [email protected]
Richard M. Walker
Department of Sociology & Kadoorie Institute University of Hong Kong
Barry Bozeman Department of Public Administration and Policy
The University of Georgia [email protected]
Gene A. Brewer Jr.
Department of Psychology Arizona State University
Claudia N. Avellaneda Department of Political Science
University of North Carolina at Charlotte [email protected]
Presented at the Public Management Research Conference 2-4th June 2011, Syracuse, NY.
1
External control and red tape:
The mediating effects of client and organizational feedback
Abstract
Bozeman’s (1993, 2000) external control model of red tape posits that organizations with higher
degrees of external control will have higher levels of red tape. According to the model, this is
compounded by entropy affecting the communication of rules and their results, limited discretion
over rules and procedures, and non-ownership of rules. However, the model predicts that red
tape will be mediated by communication from clients and within the organization. Bozeman’s
model is often cited in the literature, but it has not been subjected to empirical verification. This
study tests the model using data from a multiple informant survey of 136 upper tier English local
governments conducted in 2004 and several secondary sources. Statistical results show that
external control does indeed lead to higher levels of red tape. We then test a number of
organizational feedback mediators and find that client feedback does little to mediate the effects
of red tape; the major factor is trust between politicians and officers. We discuss these findings
and propose some changes to the model.
2
Given the apparent relevance of red tape to management and organization theory, the relative
youth of the topic is surprising. As late as the beginning of the 1990’s the empirical literature on
red tape consisted of a single published paper: Bruce Buchanan’s (1975) “Red Tape and the
Service Ethic.”1 But starting in the late 1980’s, the study of organizational red tape accelerated,
so much so that it is now viewed as one of the most popular and even defining topics for
empirical researchers in public management (for an intellectual history of red tape research see
Bozeman and Feeney 2011).
True, red tape research was not without its intellectual antecedents. Before empirical red
tape studies began to emerge, the organization research literature included a great many studies
of formalization (e.g. Hall, Johnson and Haas 1967; Pugh, et al. 1968; Hall 1968)—studies
typically based on analyses of the organizational structure of private firms. While there are
several closely related definitions of formalization, a serviceable one provided by Pugh and
colleagues (Pugh, et al. 1968, 75) is: “the extent to which rules, procedures, instructions and
communications are written.” If we consider the ordinary language use of the term “red tape,”
we see that formalization does not capture much of its meaning. Most citizens discuss red tape as
a negative attribute of bureaucratic organizations which implies time delays, waste and nuisance.
This is in contrast to formalization which is the number of rules in effect, some of which may be
perceived as effective.
Bozeman’s (2000) definition of red tape as “rules, regulations and procedures entailing a
compliance burden but not achieving the objective of the organization” has been widely used in
public management red tape research. The definition provides a sharp distinction from
1 Buchanan’s measure of red tape was identical to the measure that many other researchers had used as an index of formalization. It is perhaps more accurate to say that this is the first published work in the public administration literature to focus on formalization measures.

3
formalization inasmuch as it focuses not on the number of rules or on the extent to which they
are codified but rather on rules effectiveness.
Approximately fifteen years ago a body of red tape research began to develop from
Bozeman’s (1993) concept, which departed sharply from the formalization focus of Buchanan
(1975) and the organization structure researchers working in the sociological tradition. Since the
mid-1990’s, which marked the beginning of empirical research on red tape (e.g. Bozeman, Reed
and Scott 1992; Rainey, Pandey and Bozeman 1995; Pandey and Bretschneider 1997), empirical
studies have become increasingly common and have examined a wide range putative causes and
effects of red tape (for overviews see Pandey and Scott 2002; and Bozeman and Feeney 2011).
Considering only empirical studies employing red tape measures clearly separable from
formalization indices, the literature has grown to more than fifty published studies, making red
tape one of the most popular topics among public management researchers.
Let us hasten to add that red tape research, despite its plenitude, is not without its
knowledge gaps and not inured to sundry methodological problems and theory missteps. While
there has been a high degree of convergent validity concerning several important propositions
(see Coursey and Pandey 2007), some ancillary topics are subject to conflicting and even
confusing findings and some obvious theoretical topics have not yet been the focus of any
empirical research. Moreover, the red tape literature has not been as well integrated as one might
expect given that researchers have largely used common measures and methods. Distressingly,
theory has tended to develop along parallel lines from research. This is not uncommon in public
management research and other social science fields, but the divide seems especially prodigious
in the case of red tape theory and research. There are many likely reasons for this chasm between
theory and research (see Bozeman and Feeney 2011), but the one emphasized here is the

4
piecemeal nature of empirical research. In red tape studies, as in most areas of social science
research, empirical researchers take aim at small pieces of the puzzle, hopefully putting one or
two pieces in their proper place. This is understandable due to the need to use multiple methods
to test theories and the difficulty of finding data suitable to test large theoretical frameworks. .
Similarly, even good social science theories often present few clues about moving from nebulous
concepts to measurable constructs. Due to these factors and reliance on common data sources
(chiefly the three rounds of the National Administrative Studies Project), red tape research has
advanced in sudden fits, starts and bursts. For example, one study has focused on red tape and
risk culture (Bozeman and Kingsley 1998), another on information technology impacts of red
tape (Moon and Bretschneider 2002), and yet another on managers’ alienation because of red
tape (DeHart-Davis and Pandey 2005). Proceeding in this manner, research accumulates and,
with care, findings will eventually converge. But it is a piecemeal process.
While our paper resembles many others in the empirical red tape genre, it is a departure
in the sense that it seeks to test an entire component of red tape theory rather than one or two
hypotheses derived from the theory. In seeking to do so, we are faced with the same constraints
as others, chiefly data limitations, and we have sought to mitigate this constraint by bringing
together multiple data sources.
The component of red tape theory that we examine has received virtually no empirical
attention: Bozeman’s “external control model” of red tape (Bozeman 2000, 126-131). While
there are several explanatory models of red tape presented in this work, the external control
model is the broadest one and is designed to apply not only to government organizations, but in
any formal organization setting, public, private or non-profit. We briefly discuss the model
below and position it within later developments in red tape research and theory-building.
5
An External Control Model of Red Tape
The external control model of red tape assumes that any organization is potentially subject to red
tape because (1) all formal organizations have rules and (2) all rules are potentially subject to
being subverted, altered inappropriately, implemented poorly and, of course, some rules begin as
red tape (in the sense that, due to design flaws, they cannot obtain the organization’s objective
for the rule).
Any set of organizational rules can be viewed as having an underlying probability
distribution representing the propensity for rules to become red tape. With this view, one can
then consider “diagnostic indicators” for red tape. Certain characteristics of organizations and
their environments tend to increase the risk of rules becoming red tape. Other characteristics
reduce the propensity. To continue with the medical metaphor, there is a “good rules cholesterol”
and a “bad rules cholesterol”; one is associated with the red tape malady and the other acts to
protect against the malady. Generally, external control increases red tape and communications is
an excellent palliative.
The external control model assumes that a primary determinant of red tape is the extent to
which rules are external in origin. Externally-imposed rules provide greater opportunity for
slippage. This is less a matter of geography (though the proximity of controllers may sometimes
be important) than of social distances—differences in organizational culture, guiding practices
and norms, and social ties among organizational members. In many ways, rules imposed from a
greater distance are simply more difficult to monitor. This is one of the fundamental lessons of
another body of theory relevant to organizational performance, principal-agent theory.
If the distance of controllers and the tightness of their reins is one factor, another is the
characteristics of the organization’s stakeholders. Organizations with large numbers of
6
stakeholders, and especially diverse stakeholders, are more prone to red tape. Diverse
stakeholders ensure that the impacts of rules will differ according to stakeholder interests, and
relatedly, that organizations with many stakeholders will tend to have looser control on rules and
their implementation. This lack of precise control can also foster red tape.
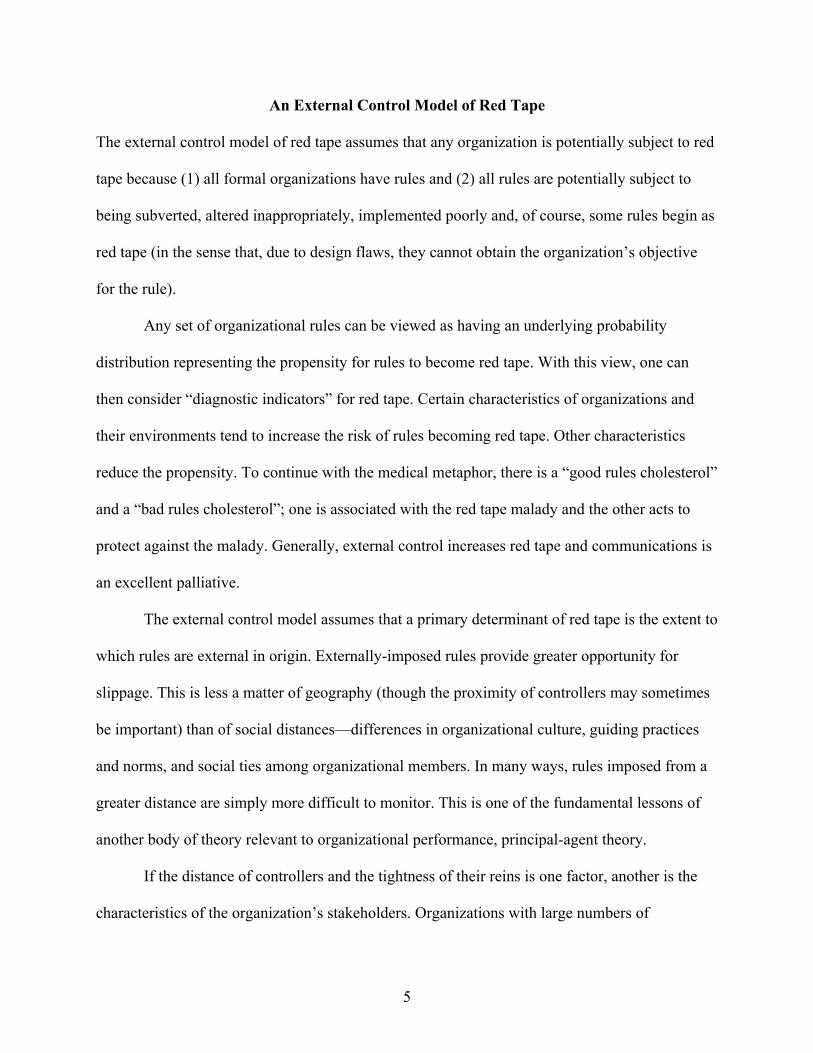
The external control model of red tape is presented below in Figure 1. The reasoning
behind the model is as follows. An organization’s red tape potential (its underlying probability
distribution) increases with increases in the number of organizational entities and sub-units
developing rules to be implemented by the organization. There are several reasons to expect this.
First, there is an increased opportunity for misapplication of rules. Second, the larger the
communications loop or the dissonance within this, the greater the possibility for
communications entropy. That is, distant or highly specialized parts of an organization may not
communicate very well. Finally, we assume that rule ownership increases when the proximity of
those promulgating the rules decreases. It follows that externally imposed rules (compared to
those adopted internally) are much more likely to be misunderstood, resented and ultimately
undermined.
[Figure 1 about here]
The model assumes that client feedback decreases red tape propensity and entropy
increases it. As the figure implies, managers can take steps to reduce the impact of external
control on red tape. The key to reducing red tape is effective communication between the
organization formulating and requiring rules and the organization actually implementing them.
Thus, if communication is more frequent, higher quality, and in both directions (rather than just
edicts from above), the likelihood of red tape is reduced.
Methods

7
Model
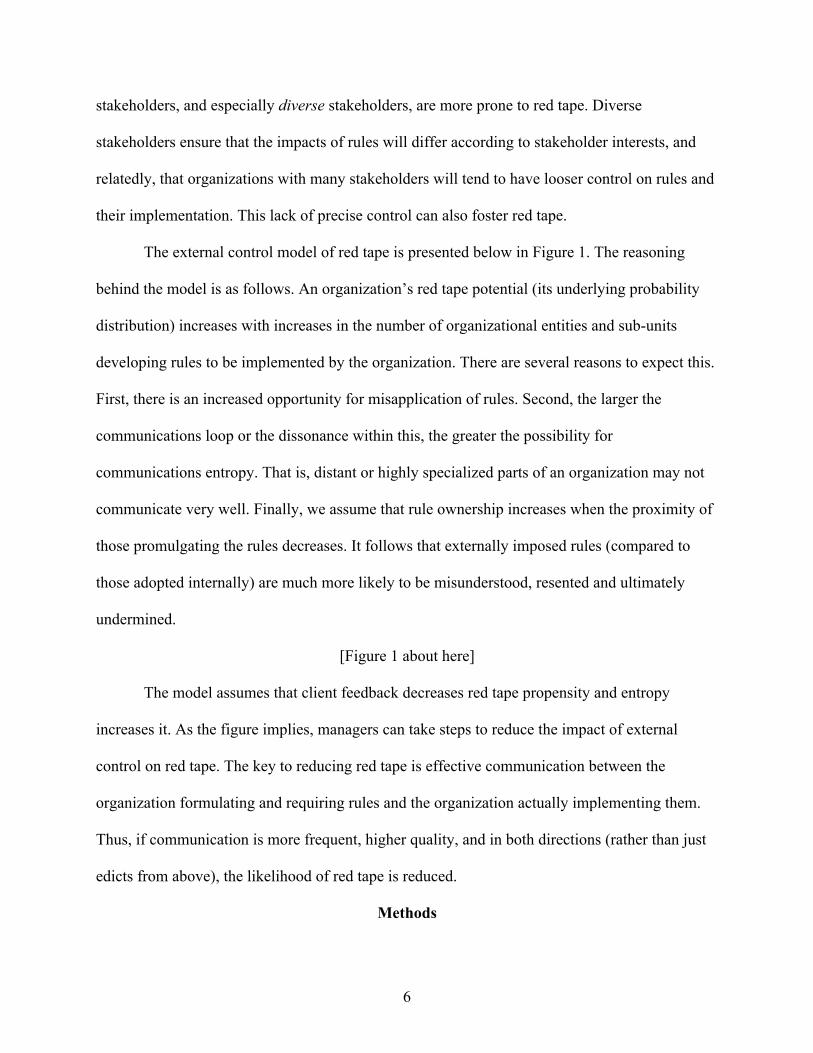
Bozeman (2000) posits that the high levels of red tape that arise from entropy and non-ownership
of rules can be mediated by feedback from clients and from within the organization to reduce red
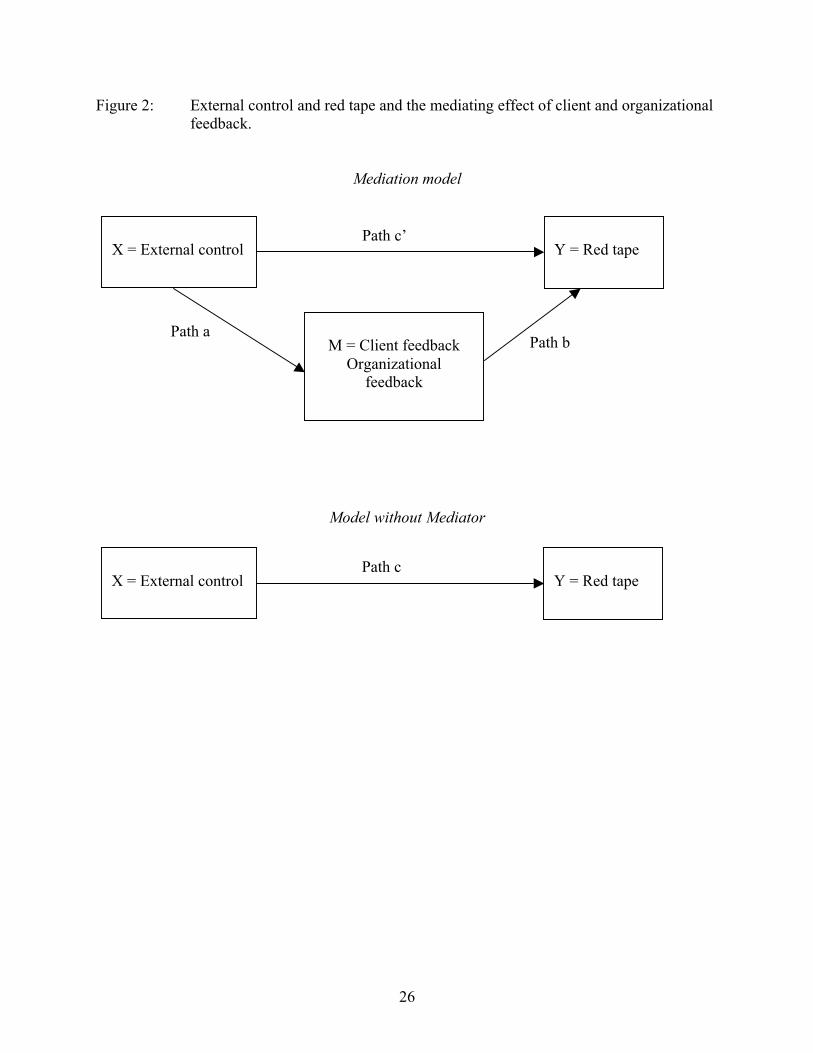
tape.2 Figure 2 depicts the mediated model. To demonstrate that there is a mediation effect it
would be expected that (1) the total effect of X on Y (c) must be significant, (2) the effect of X
on M (a) must be significant, the effect of M on Y controlled for X (c) must be significant and
the effect of X on Y controlled for M (c’) must be smaller than the total effect of X on Y (t^).
[Figure 2 about here]
Unit of Analysis and Data Sources
This study is situated in the English local government sector. English local governments are
politically elected bodies with a Westminster style cabinet system of political management. They
are multi-purpose authorities delivering education, social services, regulatory services (such as
land use planning), housing, libraries, leisure services, and welfare benefits in specific
geographical areas. London boroughs, metropolitan boroughs and unitary authorities deliver all
of these services in urban areas. In rural areas, a two-tier system prevails with county councils
administering education and social services, and district councils providing environmental and
welfare services, while some regulatory functions such as land-use planning are shared. In this
two-tier system, county councils’ expenditure is around three times that of district councils,
given their delivery of education and social services. Authorities are multi-purpose but not all-
purpose; for example, health care is provided by health authorities. Local authorities employ
professional career staff and receive around two-thirds of their income and guidance on the
implementation of legislation from the central government. For the purposes of this analysis we
2 The data set used for this study was not specifically designed to test the model. We could not, for example, measure and examine the effect of discretion in relation to rule application.
8
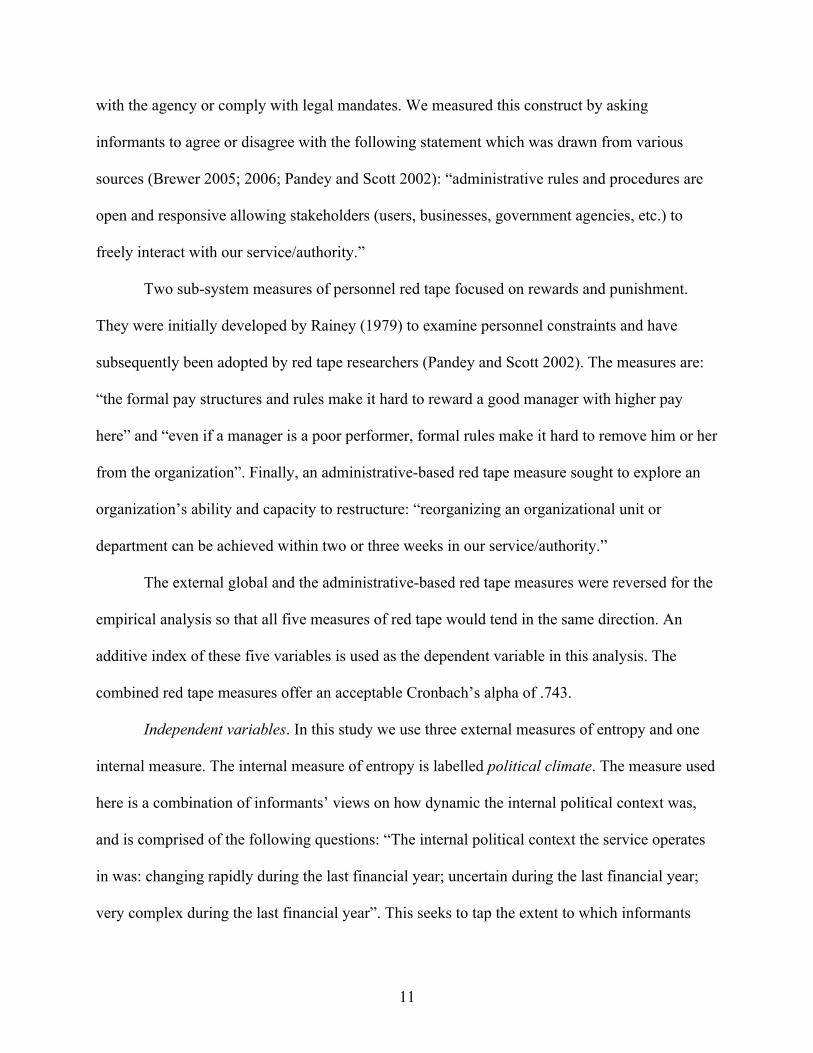
omitted district councils so we could focus on what are typically large-scale multi-purpose
organizations. The removal of district councils reduces the sample size; however an extant
analysis has shown that district councils differ from upper tier authorities on a number of
important measures, including budget, size and a range of management practices (Martin et al.
2003).
Data for this study are drawn from multiple sources. A survey of English local
government managers provides the dependent variable and a number of independent variables.
Other independent variables are taken from the UK census and manipulations thereof by
government departments, the Best Value Performance Indicators (BVPI) dataset, and the LGC
Elections Centre that collates and publishes detailed results of local government elections in
Great Britain on an annual basis (Rallings and Thrasher 2005).
The survey was conducted electronically and pretested in 17 local authorities (and 378
respondents) (Enticott 2003). The survey was then administered to a census of the 139 unitary
and upper-tier authorities. Usable responses were received from 136 authorities for a response
rate of 98%. Questionnaires were delivered as Excel files attached to an email and were,
therefore, self-coding. Informants had eight weeks to return the file by email, and during this
period, three reminders were sent to those who had not responded. There were no statistically
significant differences between the responses of the timely and late respondents.
The survey was a multiple informant survey, collecting data from informants from
several levels or “echelons” in the hierarchy. Echelons are social positions that have been
defined as “the level of stratum in the organization, the department or type of professional
activity” (Aiken and Hage 1968, 918). This approach addresses the weakness of prior studies that
have utilized elite surveys, which typically collect evidence on organizational leaders’

9
aspirations rather than actual organizational and managerial practices, and overlook the range of
different perceptions within organizations (Bowman and Ambrosini 1997; Phillips 1981). Two
echelons were identified and used in this study: corporate officers (including the chief executive
officers and corporate policy officers with cross-organizational responsibly for service delivery
and improvement) and service officers (chief officers who are the most senior officer with
specific service delivery responsibility; and service managers who are frontline supervisory
officers). Corporate and service officers were selected because research has shown that attitudes
differ between hierarchical levels of organizations generally and for this dataset in particular
(Aiken and Hage 1968; Brewer 2005; Walker and Brewer 2008; Walker and Enticott 2004;
Walker et al. 2007). In each authority, questionnaires were provided to three corporate
informants and four service officers in each service area.3 All survey questions were in the form
of a seven point Likert-type scale and informants were asked to rate their authority (for corporate
respondents) or service (for chief officers and service managers) on different dimensions of red
tape and management. A total of 1,056 informants responded to the survey of which 196 were
corporate officers and 860 service officers (48.4% and 22.7% response rates, respectively). To
calculate an organizational mean, we first calculated a mean of corporate officers and a mean of
service officers giving equal weight to each tier; the organizational score was then derived from
these two means. This procedure maintains variations across organizations and categorical data
are converted to continuous data. Furthermore, data from two tiers helps overcome the sample
bias problem faced in surveying informants from one organizational level only (Bowman and
Ambrosini 1997; Brewer 2006).
BVPIs are collected by central government, the major external stakeholder for local
3 Seven key services were surveyed: education, social care, land-use planning, waste management, housing, library and leisure, and benefits.

10
authorities in England. Central government creates and abolishes individual local government
units, provides around 75% of their funding, and bestows or removes service responsibilities.
The BVPIs are based on common definitions and data are obtained from councils for the same
time periods with uniform collection procedures. Local authorities are expected to collect and
collate these data in accordance with the Chartered Institute of Public Finance and Accountancy
“Best Value Accounting-Code of Practice”. The figures are then independently verified, and the
Audit Commission assesses whether the management systems in place are adequate for
producing accurate information.
Measures
Dependent variable. Five measures of red tape were collected in the survey. Two are global
measures and three are subsystem measures targeting specific aspects of personnel and
administrative red tape. In the survey, we followed Bozeman (2000) and others’ lead by defining
red tape as “burdensome rules and procedures that negatively affect performance.”4 Immediately
after reading this definition, informants were asked to agree or disagree with five statements on
red tape.
The first is a global measure of internal red tape. Internal red tape refers to bureaucratic
rules and routines that affect the internal operations of a public agency. Informants were asked to
agree or disagree with the following statement: “the level of red tape is high in our
service/authority”. The second is a global measure of external red tape that refers to bureaucratic
procedures and regulations that make it difficult for citizens and other stakeholders to interact
4 Pandey and Kingsley’s (2000, 782) definition of red tape was also useful in designing this study: “impressions on the part of managers that formalization (in the form of burdensome rules and regulations) is detrimental to the organization.” Simply put, red tape exists when managers view formalization as burdensome and detrimental to organizational purposes (Pandey and Scott, 2002, 565).
11
with the agency or comply with legal mandates. We measured this construct by asking
informants to agree or disagree with the following statement which was drawn from various
sources (Brewer 2005; 2006; Pandey and Scott 2002): “administrative rules and procedures are
open and responsive allowing stakeholders (users, businesses, government agencies, etc.) to
freely interact with our service/authority.”
Two sub-system measures of personnel red tape focused on rewards and punishment.
They were initially developed by Rainey (1979) to examine personnel constraints and have
subsequently been adopted by red tape researchers (Pandey and Scott 2002). The measures are:
“the formal pay structures and rules make it hard to reward a good manager with higher pay
here” and “even if a manager is a poor performer, formal rules make it hard to remove him or her
from the organization”. Finally, an administrative-based red tape measure sought to explore an
organization’s ability and capacity to restructure: “reorganizing an organizational unit or
department can be achieved within two or three weeks in our service/authority.”
The external global and the administrative-based red tape measures were reversed for the
empirical analysis so that all five measures of red tape would tend in the same direction. An
additive index of these five variables is used as the dependent variable in this analysis. The
combined red tape measures offer an acceptable Cronbach’s alpha of .743.
Independent variables. In this study we use three external measures of entropy and one
internal measure. The internal measure of entropy is labelled political climate. The measure used
here is a combination of informants’ views on how dynamic the internal political context was,
and is comprised of the following questions: “The internal political context the service operates
in was: changing rapidly during the last financial year; uncertain during the last financial year;
very complex during the last financial year”. This seeks to tap the extent to which informants
12
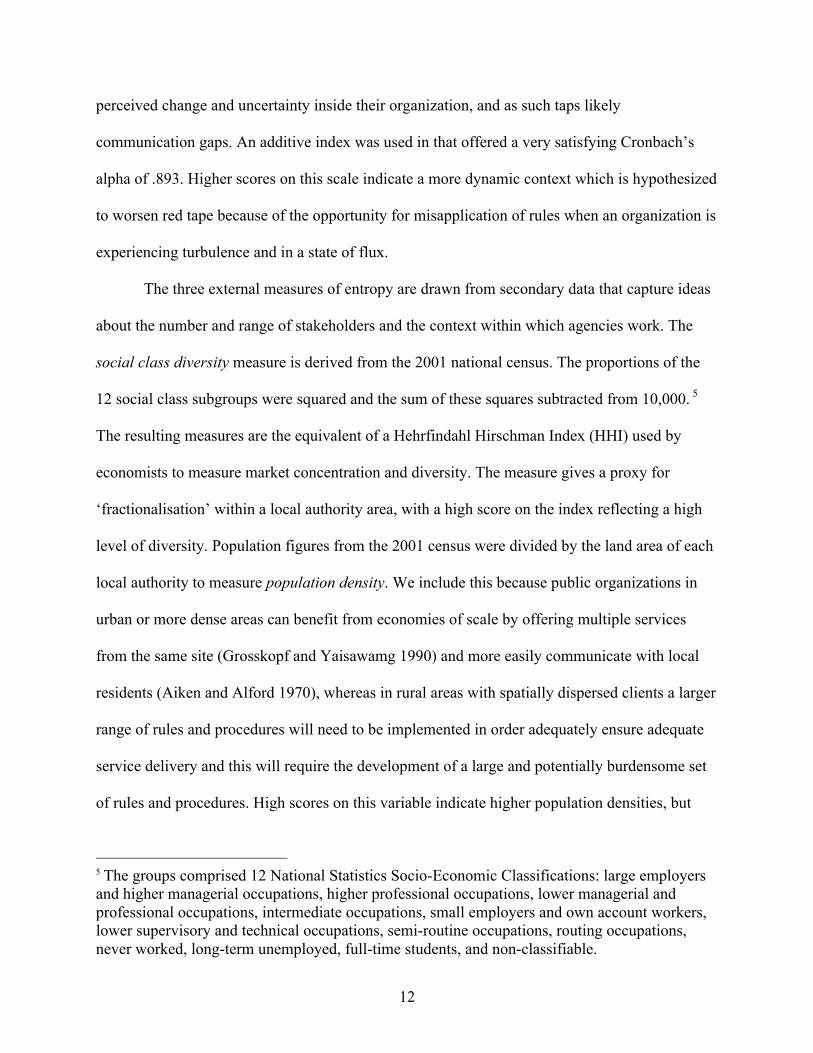
perceived change and uncertainty inside their organization, and as such taps likely
communication gaps. An additive index was used in that offered a very satisfying Cronbach’s
alpha of .893. Higher scores on this scale indicate a more dynamic context which is hypothesized
to worsen red tape because of the opportunity for misapplication of rules when an organization is
experiencing turbulence and in a state of flux.
The three external measures of entropy are drawn from secondary data that capture ideas
about the number and range of stakeholders and the context within which agencies work. The
social class diversity measure is derived from the 2001 national census. The proportions of the
12 social class subgroups were squared and the sum of these squares subtracted from 10,000. 5
The resulting measures are the equivalent of a Hehrfindahl Hirschman Index (HHI) used by
economists to measure market concentration and diversity. The measure gives a proxy for
‘fractionalisation’ within a local authority area, with a high score on the index reflecting a high
level of diversity. Population figures from the 2001 census were divided by the land area of each
local authority to measure population density. We include this because public organizations in
urban or more dense areas can benefit from economies of scale by offering multiple services
from the same site (Grosskopf and Yaisawamg 1990) and more easily communicate with local
residents (Aiken and Alford 1970), whereas in rural areas with spatially dispersed clients a larger
range of rules and procedures will need to be implemented in order adequately ensure adequate
service delivery and this will require the development of a large and potentially burdensome set
of rules and procedures. High scores on this variable indicate higher population densities, but
5 The groups comprised 12 National Statistics Socio-Economic Classifications: large employers and higher managerial occupations, higher professional occupations, lower managerial and professional occupations, intermediate occupations, small employers and own account workers, lower supervisory and technical occupations, semi-routine occupations, routing occupations, never worked, long-term unemployed, full-time students, and non-classifiable.

13
given our above reasoning we expect to observe a negative regression coefficient indicating that
more dense populations reduce red tape and more sparse ones accentuate it. Our final measure of
entropy is the non-employment rate. We include non-employment, rather than just
unemployment, because it includes a large number of non-working households, many of which
may place a range of demands upon local government through for example the education system
(for families with children) and social services for older households. This taps the notion of
deprivation which is an element of management difficulty. . It is anticipated that more complex
and difficult environments will create more demanding environments that are likely to generate
additional red tape. This variable is taken from the Annual Local Area Labour Force Surveys
(ALALFS) carried out by the Department of Work and Pensions. It provides figures of the
percentage of people aged 16-74 who are employed. In this analysis we reverse this measure.
Non-ownership is operationalized with a measure of labour vote share in LGC Elections
Centre datasets (Rallings and Thrasher 2005). Rules, regulations, and guidance on the
implementation of legislation are relatively constant and uniform in England. Laws are enacted
by central government. Government departments are then responsible for developing guidelines
for implementation, and implementation itself is expected to be uniform across local
governments. Similarly all services have an external regulator. Variation in the imposition of
rules is, however, likely to be seen in alternative ways by various political parties. In the UK, the
Labour Party was in power from 1997 through 2010. Labour’s absolute majorities over the last
decade of its rule in the House of Parliament means that local government legislation would
closely mirror the Labour Party’s agenda, and it is likely that political parties at the local level,
and particularly those of a different political persuasion, would view centralised legislation as the
implementation of someone else’s rules. Moreover, local officials would be likely to feel that

14
they did not have any ownership of these rules.
We explore two measures of client feedback: one is managers’ perceptions of the
importance of users; second is a measure of consumer satisfaction. In the 2004 survey
respondents were asked to agree with the following statement about the importance of users:
“Most managers place the needs of users first and foremost when planning and delivering
services”. We label this measure user focus. It is anticipated that organizations that place users at
their centre of operations will be working in their clients’ interests, rather than the interests of
political elites, professional groups or the bureaucracy. Given this, if these managers see
problems associated with red tape that frustrate service delivery attempts, they will act upon this
information to ensure services are not damaged by the potentially harmful effects of red tape.
Alongside the assessment of user focus by managers, we include a direct measure of client
feedback in our models as this again provides information to managers on the attitudes of the
citizens and users. The BVPI on consumer satisfaction is collected tri-annually, based upon a
random sample of local addresses drawn from the Post Office small users address file (PAF), and
we use the 2003/04 data. These surveys gauge the extent to which local authorities are having a
positive effect on the quality of life experienced by local residents. The survey includes an item
assessing residents’ satisfaction with “the way the authority runs things” as a whole (Department
of the Environment, Transport and Regions 1999 110). The surveys are conducted in accordance
with guidance provided by central government (Office of the Deputy Prime Minister 2003), with
the ensuing returns submitted to the government department responsible for local government
before the Audit Commission independently verifies them. The measure is labelled consumer
satisfaction.
A number of organizational feedback strategies that can help reduce red tape are
15
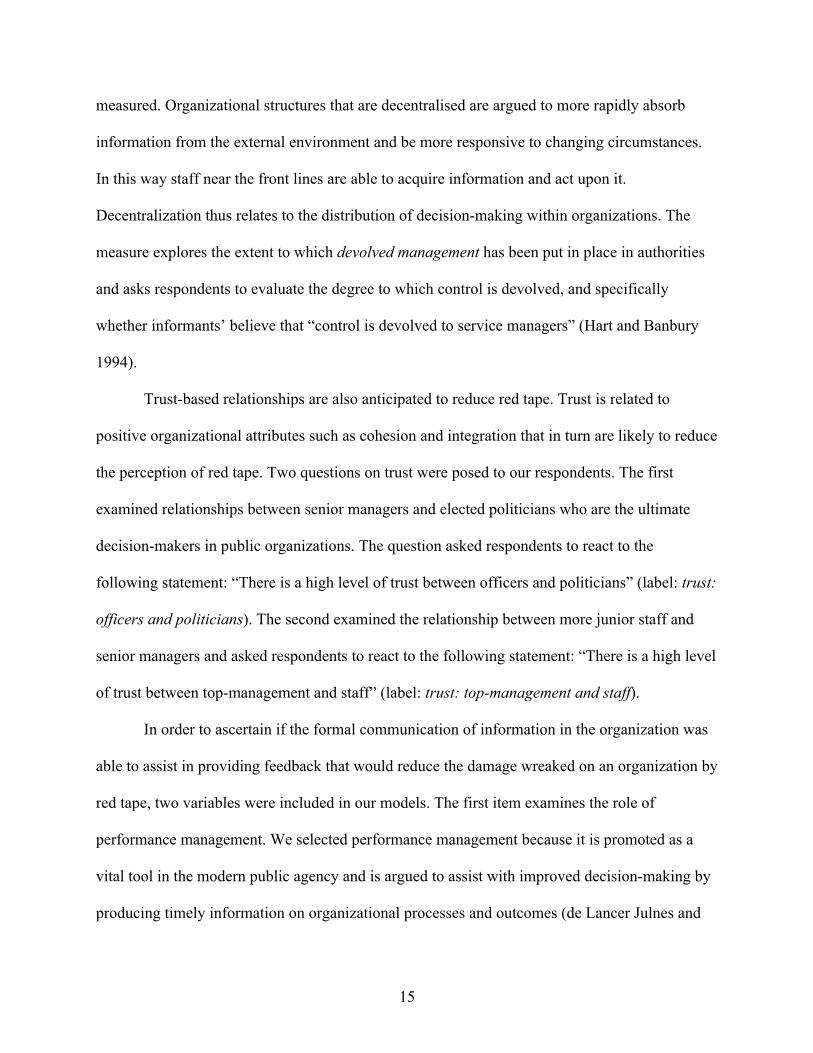
measured. Organizational structures that are decentralised are argued to more rapidly absorb
information from the external environment and be more responsive to changing circumstances.
In this way staff near the front lines are able to acquire information and act upon it.
Decentralization thus relates to the distribution of decision-making within organizations. The
measure explores the extent to which devolved management has been put in place in authorities
and asks respondents to evaluate the degree to which control is devolved, and specifically
whether informants’ believe that “control is devolved to service managers” (Hart and Banbury
1994).
Trust-based relationships are also anticipated to reduce red tape. Trust is related to
positive organizational attributes such as cohesion and integration that in turn are likely to reduce
the perception of red tape. Two questions on trust were posed to our respondents. The first
examined relationships between senior managers and elected politicians who are the ultimate
decision-makers in public organizations. The question asked respondents to react to the
following statement: “There is a high level of trust between officers and politicians” (label: trust:
officers and politicians). The second examined the relationship between more junior staff and
senior managers and asked respondents to react to the following statement: “There is a high level
of trust between top-management and staff” (label: trust: top-management and staff).
In order to ascertain if the formal communication of information in the organization was
able to assist in providing feedback that would reduce the damage wreaked on an organization by
red tape, two variables were included in our models. The first item examines the role of
performance management. We selected performance management because it is promoted as a
vital tool in the modern public agency and is argued to assist with improved decision-making by
producing timely information on organizational processes and outcomes (de Lancer Julnes and

16
Holzer 2001; Walker and Boyne 2006). We labelled this variable performance measurement and
asked: “There is a well developed framework of clear performance measurement and targets to
drive what we do”. The second item examines the role of information technology in assisting
managers to achieve organizational objectives. The question posed to informants was: “Our
management information systems enable service managers to judge their progress towards
meeting goals and targets” (labelled: management information systems). Management
information systems are an essential part of performance management regimes and linked to
processes of target setting in English local government (Boyne and Chen 2007).
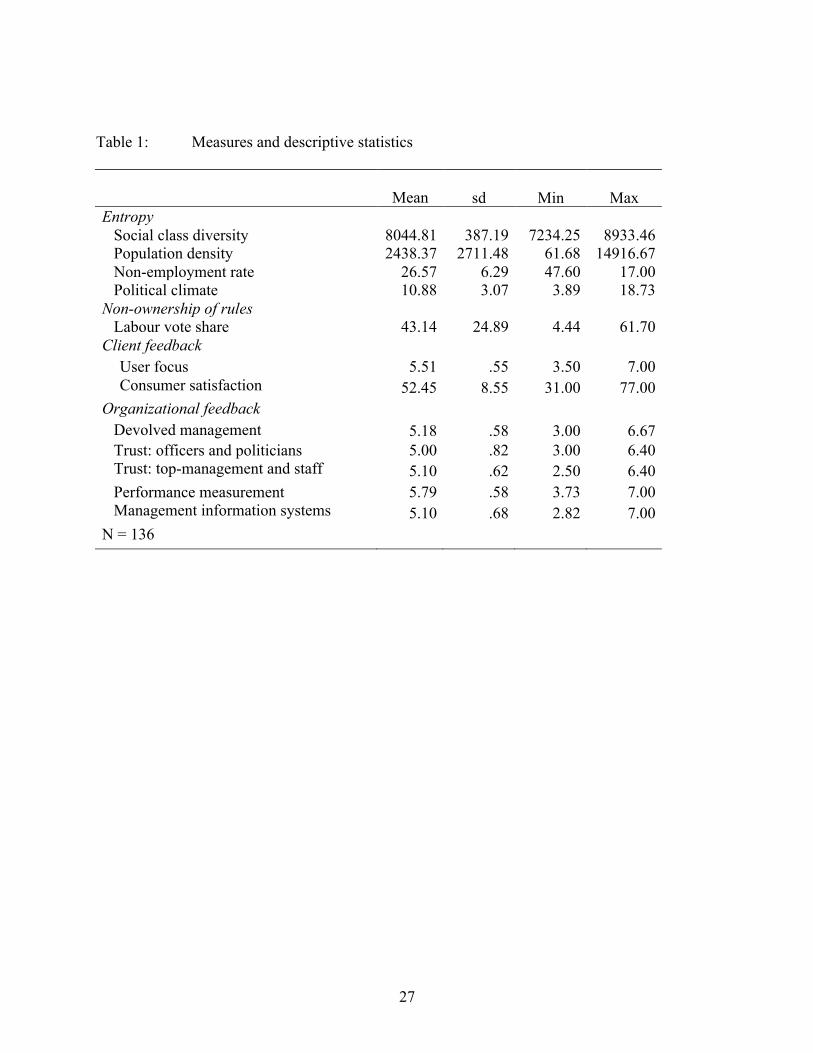
Table 1 lists the descriptive data for our independent variables.
[Table 1 about here]
Results
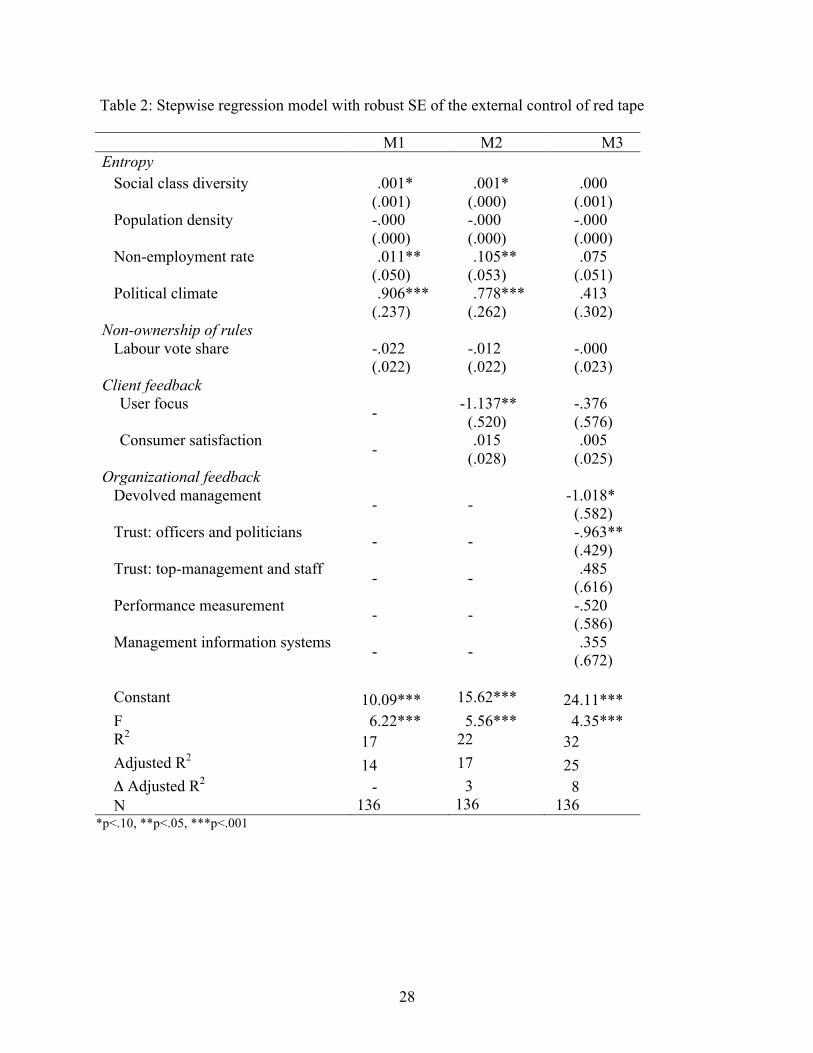
Table 2 presents the results of four multiple regression models. Model 1 includes only the
independent variables; that is, the measures of entropy and non-ownership of rules. Model 2 adds
one of the mediators: the measures of client feedback. Model 3 completes our analysis by
including the second mediator: the variables that operationalize organizational feedback. The
adjusted multiple coefficient of determination (or adjusted R2) rises from 14% in the first model
to 25% in the final model. While the proportion of the variance explained is relatively low, the
results do indicate that entropy (our IV) increases red tape while organizational feedback reduces
it. As we move from models 1 to 2 and from 2 to 3, the adjusted R2 rises by 3 and 8 percent
respectively. A joint-F test reveals that these increases are statistically significant, and therefore
warrants the inclusion of the additional stages and variables. The models are not troubled by
multicollinearity: the highest variance inflation factor recorded in all three models was 1.86 --
well below the level of 10 at which it can become a concern.

17
[Table 2 about here]
In model 1, three variables are statistically significant (one at the lower level of 10
percent). Social class diversity (p< .10), non-employment and political climate all have
statistically significant coefficients that are positive as hypothesised and result in higher levels of
red tape in this sample of English local authorities. In model 1 population density and non-
ownership of rules, as operationalized here, do not have a significant effect on red tape. Model 2
adds the first set of measures that operationalize client feedback variables, our first hypothesized
mediator. Of these two measures, user focus is statistically significant and the coefficient is
negative as anticipated. Model 3 adds the second set of measures that operationalize our next
hypothesized mediator—organizational feedback variables. Two of these variables achieve
statistical significance with the anticipated negative coefficient: devolved management (p<.10)
and trust between officers and politicians (p<.05). When these measures are entered into the
equation, they seem to mediate the positive effect of entropy on red tape. As a result, none of the
variables entered in the earlier models retain statistical significance. In fact, social class diversity
and political climate lose statistical significance, and their coefficients are reduced from .001 and
.906 in the first model to 0.000 and .413 respectively in the last model. These results suggest that
devolved decision-making and informal communication with politicians (or decision-makers)
mitigate entropy. However, the organizational feedback variables also reduce the client feedback
variables to statistical insignificance. We now go on to discuss the results of the mediation tests
to corroborate these preliminary results; that is, we now test whether social class diversity and
informal communication with politicians can mediate the negative impact that entropy, when
measured as political climate, has on red tape.
Generally speaking, mediation can be said to occur when (1) the independent variable

18
significantly affects the dependent variable in the absence of the mediator (path c); (2) the
independent variable significantly affects the mediator (path a); (3) the mediator has a significant
unique effect on the dependent variable (path b); and (4) the effect of the independent variable on
the dependent variable shrinks upon the addition of the mediator to the model (path c’). Table 3
reports the OLS coefficients for paths c, a, b and c’.
[Table 3 about here]
Estimations from path “c” show that political climate (independent variable) does affect
red tape (our dependent variable) in the absence of the mediator (trust: officers and politicians).
Indeed, its coefficient is positive and statistically significant at the 99% level of confidence.
Therefore, step 1 has been passed. Estimations from path “a” show that political climate (IV)
does affect the mediator (trust: officers and politicians) which in this model becomes the
dependent variable. The coefficient on political climate is negative and statistically significant at
the 99% level of confidence. As a result, step 2 has been passed. Results from paths “b” and “c’”
show that the mediator (trust: officers and politicians) statistically affects red tape (the dependent
variable) at the 95% level of confidence. Moreover, the effect of political climate on red tape
shrinks from .732 to .413. Consequently, steps 3 and 4 have passed. We ran the same steps for
the second and third measures of entropy—social class diversity and nonemployment—that also
showed a positive effect on red tape. However, the steps are not passed and these measures of
entropy cannot be confirmed as a viable mediator. Therefore, we are left with only one potential
mediator for one of our independent variables.
In order to corroborate that organizational feedback does mitigate the positive influence
of entropy on red tape, four mediation tests have been suggested (Baron and Kenny 1986; Sobel
1982; Goodman 1960; MacKinnon and Dwyer 1993; MacKinnon et al. 1995; Preacher and

19
Hayes 2008). More formally, the Sobel-Goodman tests are statistically based methods by which
mediation may be assessed. Table 4 reports the results for these tests.6 The mediation tests report
significant z values at the 0.05 level, meaning that trust between officers and politicians (one of
the measures of organizational feedback) indeed mediates the positive effect that entropy (when
measured as political conflict) has on red tape. Specifically, the mediation effect of trust between
officers and politicians was significant with approximately 44% of the total effect of political
climate on red tape being mediated. In addition, after obtaining the bootstrapped errors and based
on the 95% of confidence interval, the coefficient for the Sobel and Goodman statistical tests is
different from zero (see Table 5). Finally, following MacKinnon et al. (2002), the joint
significance test of the null hypothesis that the two effects comprising the intervening variable
effect (political climate and trust between officers and politicians) are simultaneously equal to
zero is rejected (Probability > F = 0.0011). We now go on to discuss the implications of these
results for the model of external control.
Conclusions
In summary, this study has tested Bozeman’s external control model of red tape using data from
a multiple informant survey of 136 upper tier English local governments conducted in 2004 and
several secondary data sources.. The model posits that organizations with higher degrees of
external control will have higher levels of red tape. According to the model, this is compounded
by entropy affecting the communication of rules and their results, limited discretion over rules
and procedures, and non-ownership of rules. The model further predicts that red tape will be
mediated by communication from clients and within the organization. Statistical results show
that external control does indeed generate higher levels of red tape in public organizations, and
6 These tests are performed using the Stata command sgmediation and specifying the option bootstrap.
20
that feedback mediates this effect. However, a closer look shows that feedback from clients does
little to mediate red tape, while informal communication within the organization is paramount.
One finding of importance is that informal rather than formal communication impacts red
tape. There is much in the organizational theory literature that lends support to this finding. From
a practical standpoint, we can tell policy-makers and public managers that structural reform is
not the best way to reduce red tape. Rather, the most effective strategy is exploitation of the
informal organization and the functioning of communication networks. That gives a different and
interesting bent to the reform aspects of red tape and pushes the external theory of red tape
generation into some new and previously uncharted areas.
These results suggest that feedback from clients does little to mediate the effects of red
tape; yet, managers’ attitudes towards clients can reduce red tape. This suggests that we should
modify the communications hypotheses to emphasize that communication between
administrators is key, and that encouraging public participation, while likely valuable for other
reasons, is not an effective countermeasure for red tape. Chiefly, when policy-makers and public
managers ponder reforms to cope with red tape, they should resist the urge to impose structural
reforms or reorganize public agencies. Rather, the most effective reforms will likely be those that
increase trust and improve inter-organizational communication.
This set of findings raises several questions. Does informal communication reduce red
because it exposes an aspect of organizational culture that might be called “integration” or
“cohesion” and the effect on red tape is only incidental? Does it reduce red tape directly because
client-serving managers are more in touch (an interpretation that is consistent with the theory)?
Or is the apparent reduction in red tape really related to agency function, with managers’
attitudes being a proxy for professionalism, client interaction, or other? Certainly these findings

21
help to underpin the theory of red tape, and in the future, researchers should try to firm up that
foundation by employing appropriate methodologies and data sets to answer the new questions
we have posed.
The usual disclaimers apply. This study has utilized a cross-sectional research design
which does not lend itself to making causal attributions. In addition, measurement of some
concepts may be less complete than desirable. Finally, we have relied heavily on managers’
perceptions of external control, red tape and related concepts. This raises questions about
common source bias. To help counter this threat, we have drawn data from several additional
sources but this does not completely alleviate our concern. Despite these limitations, this study
adds to the knowledge base of public management by confirming parts of Bozeman’s (2000)
external control model of red tape and spotlighting some weaknesses that need to be addressed.
22
References Aiken, M. and J. Hage. 1968. “Organizational Interdependence and Intra-organizational
Structure.” American Sociological Review 33(6): 912-930. Aiken, M. and R. R. Alford. 1970. “Community Structure and Innovation: The Case of Urban
Renewal.” American Sociological Review 64(4): 650-665. Baron, R. M., and Kenny, D. A. 1986. “The moderator-mediator variable distinction in social
psychological research: Conceptual, strategic, and statistical considerations.” Journal of Personality and Social Psychology 51(6): 1173-1182.
Bowman, Cliff, and Veronica Ambrosini. 1997. “Using Single Respondents in Strategy Research.” British Journal of Management 8(1): 119-132.
Boyne, G. and A. Chen. 2007. “Performance Targets and Public Service Improvement.” Journal of Public Administration Research and Theory 17(3): 455-478.
Bozeman, B. 1982. “Organizational Structure and the Effectiveness of Public Services.” International Journal of Public Administration 4(3): 235-296.
Bozeman, B. 1993. “A Theory of Government “Red Tape.” Journal of Public Administration Research and Theory 3(3): 273-303.
Bozeman, B. 2000. Bureaucracy and Red Tape. Upper Saddle River, NJ: Prentice Hall. Bozeman, B., and G. Kingsley. 1998. “Risk Culture in Public and Private Organizations.” Public
Administration Review 58(2): 109-118. Bozeman, B. 2007. “What‘s Wrong with Empirical Research in Public Management? Red Tape
Studies as a Case in Point” Paper prepared for Annual Meeting of the National Association of Schools of Public Affairs and Administration, Seattle, Washington, October, 2007.
Bozeman, B. and M. Feeney. 2011. Rules and Red Tape: Red Tape Research as a Prism for Public Administration Theory. Armonk, NY: M.E. Sharpe, Inc.
Bozeman, B., P. Reed and P. Scott 1992. “Red Tape and Task Delays in Public and Private Organizations,” Administration and Society, 24(3): 290-322.
Brewer, G. A. 2005. “In the Eye of the Storm: Frontline Supervisors and Federal Agency Performance.” Journal of Public Administration Research and Theory 15(4): 505-527.
Brewer, G. A. 2006. “All Measures of Performance are Subjective: More Evidence on U.S. Federal Agencies.” In George A. Boyne, Kenneth. J. Meier, Laurence J. O’Toole Jr., and Richard M. Walker (Eds.), Public Service Performance: Perspectives on Measurement and Management. Cambridge: Cambridge University Press.
Buchanan, B. 1975. “Red-Tape and the Service Ethic: Some Unexpected Differences between Public and Private Managers,” Administration and Society 6(4): 423-444.
Coursey, D., and Pandey, S. 2007. “Content Domain, Measurement, and Validity of the Red Tape Concept: A Second-order Confirmatory Factor Analysis.” American Review of Public Administration 37(3): 342-361.
DeHart-Davis, L., and S. K. Pandey 2005. “Red Tape and Public Employees: Does Perceived Rule Dysfunction Alienate Managers?” Journal of Public Administration Research and
23
Theory 15(1): 133-148. de Lancer Julnes, P., and M. Holzer. 2001. “Promoting the Utilization of Performance Measures
in Public Organizations.” Public Administration Review 61(6): 693-708. Department for Environment, Transport and Regions, 1999. Best Value and Audit Commission
Performance Indicators for 2000/2001. London, DETR Enticott, G. 2003. “Researching Local Government Using Electronic Surveys.” Local
Government Studies 29(2): 52-67. Goodman, L. A. 1960. “On the Exact Variance of Products.” Journal of the American Statistical
Association, 55:708-713. Grosskopf, S. and S. Yaisawamg. 1990. “Economies of Scope in the Provision of Local Public
Services’, National Tax Journal 43(1): 61–74. Hall, R. H. 1968. “Professionalism and Bureaucratization.” American Sociological Review 33(1):
92-1004 Hall, R.H., N. Johnson and J. Haas 1967. “Organizational Size, Complexity, and Formalization.”
American Sociological Review 32(6): 903-912. Hart, S. and C. Banbury. 1994. “How Strategy-making Processes can make a Difference.”
Strategic Management Journal 15(3): 251-269. Judd, C. M. and D. A. Kenny. 1981. Process Analysis. Estimating Mediation in Treatment
Evaluations. Evaluation Review, 5(5): 602-619. Martin, S., R. M. Walker, R. Ashworth, G. A. Boyne, G. Enticott, T. Entwistle, and L. Dawson.
2003. The Long Term Evaluation of Best Value and its Impact: Baseline Report. London: Office of the Deputy Prime Minister
MacKinnon, D. P., and J. H. Dwyer. 1993. “Estimating Mediated Effects in Prevention Studies”. Evaluation Review, 17(2): 144-158.
MacKinnon, D. P., G. Warsi and J. H. Dwyer, 1995. “A Simulation Study of Mediated Effect Measures.” Multivariate Behavioral Research, 30(1): 41-62.
MacKinnon D. P., C. M. Lockwood, J. M. Hoffman, S. G. West, and V. Sheets. 2002. “A comparison of methods to test mediation and other intervening variable effects.” Psychological Methods 7(1):83-104.
Moon, M. J., & S. I. Bretschneider. 2002. Does the Perception of Red Tape Constrain IT Innovativeness in Organizations? Unexpected Results from a Simultaneous Equation Model and Implications.” Journal of Public Administration Research and Theory 12(2): 273-291.
Office of the Deputy Prime Minister. 2003. Best Value Performance Indicators for 2003/2004. London: HMSO.
Office for National Statistics. 2003. Census 2001, National Report for England and Wales. London: ONS
Pandey, S. K. and S. Bretschneider 1997. “The Impact of Red Tape's Administrative Delay on Public Organizations’ Interest in New Information Technologies.” Journal of Public

24
Administration Research and Theory 7(1): 113-130. Pandey, S. K. and G. A., Kingsley. 2000. “Examining Red Tape in Public and Private
Organizations: Alternative Explanations from a Social Psychological Model.” Journal of Public Administration and Research and Theory 10(4): 779–799.
Pandey, S. K., and P. G. Scott. 2002. “Red Tape: A Review and Assessment of Concepts and Measures.” Journal of Public Administration Research and Theory 12(4): 553-580.
Phillips L. 1981. “Assessing Measurement Error in Key Informant Reports: A Methodological Note on Organizational Analysis in Marketing.” Journal of Marketing Research 18(3): 395-415.
Preacher, K. J., and A. F. Hayes. 2008. “Asymptotic and Resampling Strategies for Assessing and Comparing Indirect Effects in Multiples Mediator Models.” Behaviour Research Methods, 40:879-891.
Pugh, D. S., D. J. Hickson, C. R. Hinings and C. Turner. 1969. “The Context of Organizational Structures.” Administrative Science Quarterly 14(1): 91-114.
Rainey, H. G. 1979. “Perceptions of Incentives in Business and Government: Implications for Civil Service Reform.” Public Administration Review 29(5): 440-448.
Rainey, H. G., Pandey, S. K., and B. Bozeman 1995. “Research Note: Public and Private Managers’ Perceptions of Red Tape.” Public Administration Review 55(6): 567-574.
Rallings, C. and M. Thrasher. 2005. Local Elections Handbook 2005. Plymouth: LGC Elections Centre.
Sobel, M. E. 1982. “Asymptotic Intervals for Indirect Effects in Structural Equations Models.” In S. Leinhart (Ed.), Sociological Methodology 1982 (pp.290-312). San Francisco: Jossey-Bass.
Walker, R. M. and G. A. Boyne. 2006. “Public Management Reform and Organizational Performance: An Empirical Assessment of the UK Labour Government’s Public Service Improvement Strategy.” Journal of Policy Analysis and Management 25(2): 371-393.
Walker, R. M. and G. A. Brewer. 2008. “An Organizational Echelon Analysis of the Determinants of Red Tape in Public Organizations.” Public Administration Review 68(6): 1112-1127.
Walker, R. M., and G. Enticott. 2004. “Using Multiple-informants in Public Administration: Revisiting the Managerial Values and Actions Debate.” Journal of Public Administration Research and Theory 14(3): 417-434.
Walker, R. M., L. J. O’Toole and K. J. Meier. 2007. “It’s Where You Sit that Matters: The Networking Behaviour of Local Government Officers.” Public Administration 85(3): 739-756.

25
Figure 1: External control model of red tape
External
(-) (+) Entropy
Organizational
Feedback Focal (+) Discretion (+) (-)
(-)
(+) Entropy
(+) Nonownership
Client
(-) Client Feedback
(-) Client Feedback
Note: a plus indicates a factor facilitating the likelihood of red tape; a minus is a factor inhibiting red tape Source: Bozeman 1993, 292.
26
Figure 2: External control and red tape and the mediating effect of client and organizational feedback.
Mediation model
Model without Mediator
X = External control
Y = Red tape
M = Client feedback
Organizational feedback
Path c’
Path b Path a
X = External control
Y = Red tape
Path c
27
Table 1: Measures and descriptive statistics
Mean sd Min Max Entropy
Social class diversity 8044.81 387.19 7234.25 8933.46 Population density 2438.37 2711.48 61.68 14916.67 Non-employment rate 26.57 6.29 47.60 17.00 Political climate 10.88 3.07 3.89 18.73
Non-ownership of rules Labour vote share 43.14 24.89 4.44 61.70
Client feedback User focus 5.51 .55 3.50 7.00 Consumer satisfaction 52.45 8.55 31.00 77.00
Organizational feedback Devolved management 5.18 .58 3.00 6.67 Trust: officers and politicians 5.00 .82 3.00 6.40 Trust: top-management and staff 5.10 .62 2.50 6.40 Performance measurement 5.79 .58 3.73 7.00 Management information systems 5.10 .68 2.82 7.00
N = 136
28
Table 2: Stepwise regression model with robust SE of the external control of red tape M1 M2 M3 Entropy
Social class diversity .001* (.001)
.001* (.000)
.000 (.001)
Population density -.000 (.000)
-.000 (.000)
-.000 (.000)
Non-employment rate .011** (.050)
.105** (.053)
.075 (.051)
Political climate .906*** (.237)
.778*** (.262)
.413 (.302)
Non-ownership of rules Labour vote share -.022
(.022) -.012 (.022)
-.000 (.023)
Client feedback User focus - -1.137**
(.520) -.376 (.576)
Consumer satisfaction - .015 (.028)
.005 (.025)
Organizational feedback Devolved management - - -1.018*
(.582) Trust: officers and politicians - - -.963**
(.429) Trust: top-management and staff - - .485
(.616) Performance measurement - - -.520
(.586) Management information systems - - .355
(.672) Constant 10.09*** 15.62*** 24.11*** F 6.22*** 5.56*** 4.35*** R2 17 22 32 Adjusted R2 14 17 25 Δ Adjusted R2 N
- 136
3 136
8 136
*p<.10, **p<.05, ***p<.001

29
Table 3: Mediated regression results
Dependent Variable
Path c Red Tape
Path a Trust: Officers-
Politicians
Path b and c’ Red Tape
Independent Variables
Entropy Social class diversity .001*
(.001) -.001 (.000)
.000 (.001)
Population density -.000 (.000)
-.000 (.000)
-.000 (.000)
Non-employment rate .067 (.054)
.008 (.011)
.075 (.053)
Political climate .732*** (.243)
-.332*** (.528)
.413 (.274)
Non-ownership of rules Labour vote share -.010
(.022) .010
(.004) -.000 (.022)
Mediators Client feedback
User focus -.335 (.556)
-.042 (.120)
-.376 (.546)
Consumer satisfaction .002 (.027)
.003 (.005)
.005 (.026)
Organizational feedback Devolved management -1.314
(.523) .306
(.113) -1.018* (.528)
Trust: officers and politicians - -.963** (.406)
Trust: top-management and staff .180 (.553)
.316 (.119)
.485 (.558)
Performance measurement -.950 (.547)
.445 (.118)
-.520 (.566)
Management Information System .581 (.24)
-.234 (.092)
.355 (.427)
Constant 23.08*** 1.06*** 24.11*** F 4.47*** 15.29*** 4.71*** R2 28 57 32 Adjusted R2
N 22
136 53 136
25 136
Notes: *p<.10, **p<.05, ***p<.001 Path c: Model with Red Tape (DV) Regressed on Political Climate (IV), other variables acting as controls Path a: Model with Mediator (Trust: officers and politicians) regressed on Political Climate (IV), other variables acting as controls Path b and c’: Model with Red Tape (DV) regressed on Mediator (Trust: officers and politicians) and Political Climate (IV), other variables acting as controls

30
Table 4. Sobel-Goodman Mediation Tests Coef. SE p>|z| Sobel test .32 .144 0.26 Goodman-1 test .32 .146 0.28 Goodman-2 test .32 .143 0.24 Indirect effect: .32 Direct effect: .41 Total effect: .73 Proportion of total effect that is mediated: .44 Ratio of indirect to direct effect .77 Table 5. Percentile and Bias-correct bootstrap results for Sobel: 200 replications Obs. coef. Bias Bootstrap
SE 95% CI
Coef .320 .004 .158 .05357 .66214 (P) .05874 .66394 (BC) (P) percentile confidence interval (BC) bias-corrected confidence interval