Embed Size (px)
Citation preview
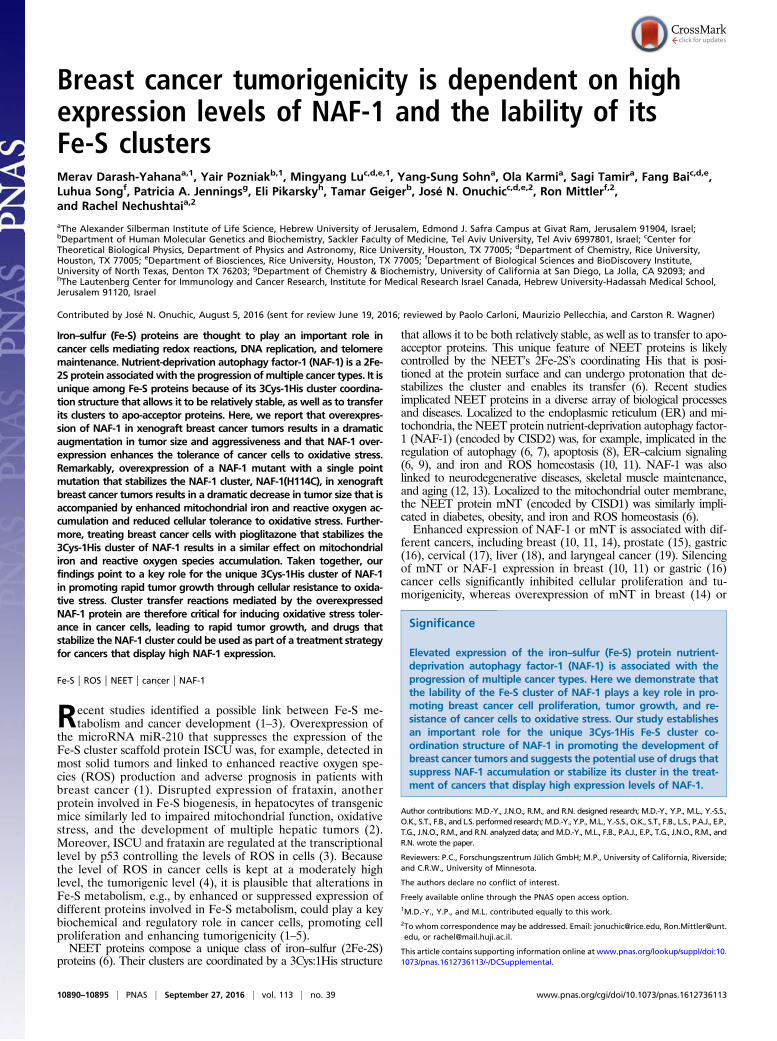
Breast cancer tumorigenicity is dependent on highexpression levels of NAF-1 and the lability of itsFe-S clustersMerav Darash-Yahanaa,1, Yair Pozniakb,1, Mingyang Luc,d,e,1, Yang-Sung Sohna, Ola Karmia, Sagi Tamira, Fang Baic,d,e,Luhua Songf, Patricia A. Jenningsg, Eli Pikarskyh, Tamar Geigerb, José N. Onuchicc,d,e,2, Ron Mittlerf,2,and Rachel Nechushtaia,2
aThe Alexander Silberman Institute of Life Science, Hebrew University of Jerusalem, Edmond J. Safra Campus at Givat Ram, Jerusalem 91904, Israel;bDepartment of Human Molecular Genetics and Biochemistry, Sackler Faculty of Medicine, Tel Aviv University, Tel Aviv 6997801, Israel; cCenter forTheoretical Biological Physics, Department of Physics and Astronomy, Rice University, Houston, TX 77005; dDepartment of Chemistry, Rice University,Houston, TX 77005; eDepartment of Biosciences, Rice University, Houston, TX 77005; fDepartment of Biological Sciences and BioDiscovery Institute,University of North Texas, Denton TX 76203; gDepartment of Chemistry & Biochemistry, University of California at San Diego, La Jolla, CA 92093; andhThe Lautenberg Center for Immunology and Cancer Research, Institute for Medical Research Israel Canada, Hebrew University-Hadassah Medical School,Jerusalem 91120, Israel
Contributed by José N. Onuchic, August 5, 2016 (sent for review June 19, 2016; reviewed by Paolo Carloni, Maurizio Pellecchia, and Carston R. Wagner)
Iron–sulfur (Fe-S) proteins are thought to play an important role incancer cells mediating redox reactions, DNA replication, and telomeremaintenance. Nutrient-deprivation autophagy factor-1 (NAF-1) is a 2Fe-2S protein associatedwith the progression ofmultiple cancer types. It isunique among Fe-S proteins because of its 3Cys-1His cluster coordina-tion structure that allows it to be relatively stable, as well as to transferits clusters to apo-acceptor proteins. Here, we report that overexpres-sion of NAF-1 in xenograft breast cancer tumors results in a dramaticaugmentation in tumor size and aggressiveness and that NAF-1 over-expression enhances the tolerance of cancer cells to oxidative stress.Remarkably, overexpression of a NAF-1 mutant with a single pointmutation that stabilizes the NAF-1 cluster, NAF-1(H114C), in xenograftbreast cancer tumors results in a dramatic decrease in tumor size that isaccompanied by enhanced mitochondrial iron and reactive oxygen ac-cumulation and reduced cellular tolerance to oxidative stress. Further-more, treating breast cancer cells with pioglitazone that stabilizes the3Cys-1His cluster of NAF-1 results in a similar effect on mitochondrialiron and reactive oxygen species accumulation. Taken together, ourfindings point to a key role for the unique 3Cys-1His cluster of NAF-1in promoting rapid tumor growth through cellular resistance to oxida-tive stress. Cluster transfer reactions mediated by the overexpressedNAF-1 protein are therefore critical for inducing oxidative stress toler-ance in cancer cells, leading to rapid tumor growth, and drugs thatstabilize the NAF-1 cluster could be used as part of a treatment strategyfor cancers that display high NAF-1 expression.
Fe-S | ROS | NEET | cancer | NAF-1
Recent studies identified a possible link between Fe-S me-tabolism and cancer development (1–3). Overexpression of
the microRNA miR-210 that suppresses the expression of theFe-S cluster scaffold protein ISCU was, for example, detected inmost solid tumors and linked to enhanced reactive oxygen spe-cies (ROS) production and adverse prognosis in patients withbreast cancer (1). Disrupted expression of frataxin, anotherprotein involved in Fe-S biogenesis, in hepatocytes of transgenicmice similarly led to impaired mitochondrial function, oxidativestress, and the development of multiple hepatic tumors (2).Moreover, ISCU and frataxin are regulated at the transcriptionallevel by p53 controlling the levels of ROS in cells (3). Becausethe level of ROS in cancer cells is kept at a moderately highlevel, the tumorigenic level (4), it is plausible that alterations inFe-S metabolism, e.g., by enhanced or suppressed expression ofdifferent proteins involved in Fe-S metabolism, could play a keybiochemical and regulatory role in cancer cells, promoting cellproliferation and enhancing tumorigenicity (1–5).NEET proteins compose a unique class of iron–sulfur (2Fe-2S)
proteins (6). Their clusters are coordinated by a 3Cys:1His structure
that allows it to be both relatively stable, as well as to transfer to apo-acceptor proteins. This unique feature of NEET proteins is likelycontrolled by the NEET’s 2Fe-2S’s coordinating His that is posi-tioned at the protein surface and can undergo protonation that de-stabilizes the cluster and enables its transfer (6). Recent studiesimplicated NEET proteins in a diverse array of biological processesand diseases. Localized to the endoplasmic reticulum (ER) and mi-tochondria, the NEET protein nutrient-deprivation autophagy factor-1 (NAF-1) (encoded by CISD2) was, for example, implicated in theregulation of autophagy (6, 7), apoptosis (8), ER–calcium signaling(6, 9), and iron and ROS homeostasis (10, 11). NAF-1 was alsolinked to neurodegenerative diseases, skeletal muscle maintenance,and aging (12, 13). Localized to the mitochondrial outer membrane,the NEET protein mNT (encoded by CISD1) was similarly impli-cated in diabetes, obesity, and iron and ROS homeostasis (6).Enhanced expression of NAF-1 or mNT is associated with dif-
ferent cancers, including breast (10, 11, 14), prostate (15), gastric(16), cervical (17), liver (18), and laryngeal cancer (19). Silencingof mNT or NAF-1 expression in breast (10, 11) or gastric (16)cancer cells significantly inhibited cellular proliferation and tu-morigenicity, whereas overexpression of mNT in breast (14) or
Significance
Elevated expression of the iron–sulfur (Fe-S) protein nutrient-deprivation autophagy factor-1 (NAF-1) is associated with theprogression of multiple cancer types. Here we demonstrate thatthe lability of the Fe-S cluster of NAF-1 plays a key role in pro-moting breast cancer cell proliferation, tumor growth, and re-sistance of cancer cells to oxidative stress. Our study establishesan important role for the unique 3Cys-1His Fe-S cluster co-ordination structure of NAF-1 in promoting the development ofbreast cancer tumors and suggests the potential use of drugs thatsuppress NAF-1 accumulation or stabilize its cluster in the treat-ment of cancers that display high expression levels of NAF-1.
Author contributions: M.D.-Y., J.N.O., R.M., and R.N. designed research; M.D.-Y., Y.P., M.L., Y.-S.S.,O.K., S.T., F.B., and L.S. performed research;M.D.-Y., Y.P., M.L., Y.-S.S., O.K., S.T., F.B., L.S., P.A.J., E.P.,T.G., J.N.O., R.M., and R.N. analyzed data; and M.D.-Y., M.L., F.B., P.A.J., E.P., T.G., J.N.O., R.M., andR.N. wrote the paper.
Reviewers: P.C., Forschungszentrum Jülich GmbH; M.P., University of California, Riverside;and C.R.W., University of Minnesota.
The authors declare no conflict of interest.
Freely available online through the PNAS open access option.1M.D.-Y., Y.P., and M.L. contributed equally to this work.2To whom correspondence may be addressed. Email: [email protected], [email protected], or [email protected].
This article contains supporting information online at www.pnas.org/lookup/suppl/doi:10.1073/pnas.1612736113/-/DCSupplemental.
10890–10895 | PNAS | September 27, 2016 | vol. 113 | no. 39 www.pnas.org/cgi/doi/10.1073/pnas.1612736113

NAF-1 in gastric (16) cancer cells significantly enhanced cellularproliferation. Moreover, patients with gastric and liver cancer withhigh NAF-1 expression displayed a shorter survival and higherrecurrence rate compared with patients with low NAF-1 expres-sion (16, 18). Taken together, these studies point to a potential keyrole for the NEET proteins NAF-1 and mNT in promoting theproliferation of different epithelial cancers. Nevertheless, it isunknown what role the NEET’s 2Fe-2S clusters play in promotingcancer cell proliferation and tumorigenicity.Here we report that the lability of the NAF-1 cluster plays a key
role in promoting rapid tumor growth through enhancing cellularresistance to oxidative stress. We further demonstrate that a drugthat increases the stability of the NAF-1 cluster [pioglitazone(PGZ)] could be used to target cancer cells with high levels ofNAF-1 overexpression.
ResultsNAF-1 Overexpression Results in a Dramatic Augmentation in XenograftTumor Growth and Proliferation. Enhanced expression of the 2Fe-2Sprotein NAF-1 is associated with the onset and progression ofmultiple cancer types (10, 11, 14–19). To determine whether ele-vated NAF-1 levels play a direct role in tumor development, westably overexpressed NAF-1 in MDA-MB-231 cells [NAF-1(+)] andgenerated xenograft tumors in nude mice. As controls we generatedxenograft tumors using MDA-MB-231 cells having native levels ofNAF-1 (control), as well as MDA-MB-231 cells in which NAF-1expression was suppressed via shRNA [NAF-1(−)] (10, 11). Asshown in Fig. 1A, the endogenous expression of NAF-1 in controlMDA-MB-231 cells is significantly higher compared with that ofnonmalignant epithelial breast cells (MCF-10A), and over-expression of NAF-1 in MDA-MB-231 cells [NAF-1(+)] resulted ina further elevation of NAF-1 expression. Remarkably, xenografttumors that developed from NAF-1(+) MDA-MB-231 cells weresignificantly larger and developed significantly faster than xeno-graft tumors that developed from control or NAF-1(−) cells (Fig.1B). In agreement with their increased aggressiveness, NAF-1(+)
tumors displayed elevated levels of cellular markers for cancer cellproliferation, including nuclear membrane and rough ER defor-mations and Golgi accumulation (Fig. S1). Furthermore, theycontained fewer cells with elevated levels of the DNA damagemarker protein γH2AX (Fig. 1C), suggesting that the enhancedexpression of NAF-1 protected cancer cells from nuclear DNAdamage. These results demonstrate that overexpression of the2Fe-2S NAF-1 protein is directly involved in promoting the rapidgrowth and aggressiveness of breast cancer tumors.
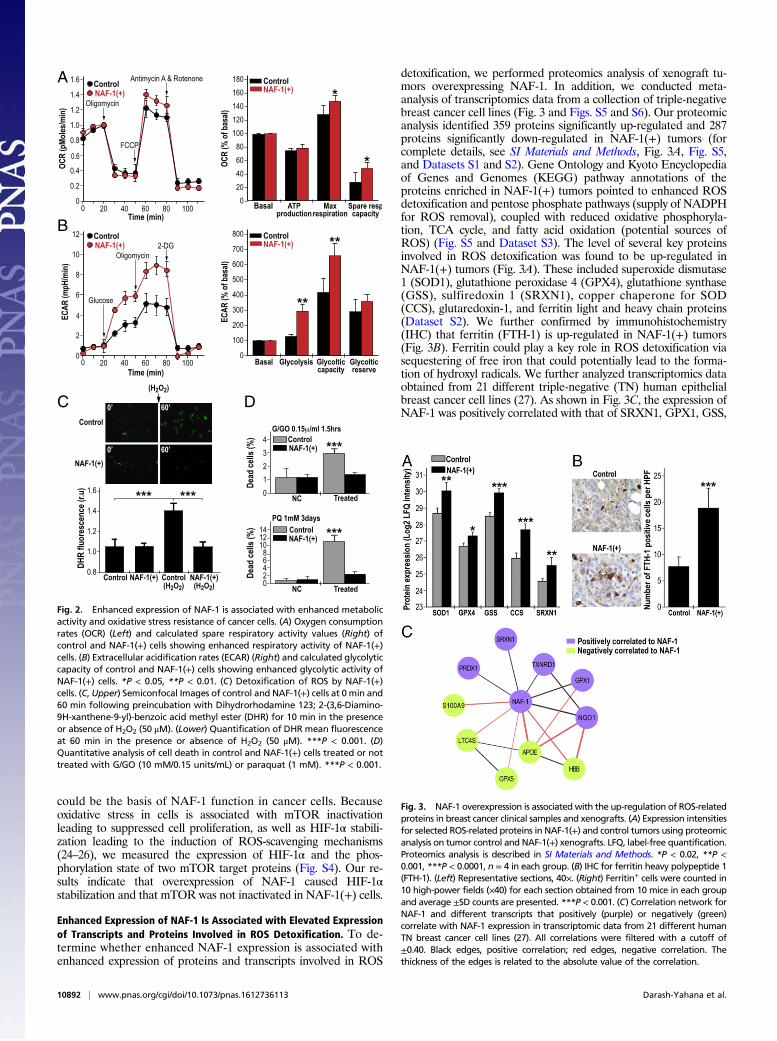
Enhanced Expression of NAF-1 Is Associated with Enhanced MetabolicActivity of Breast Cancer Cells and Enhanced Tolerance to OxidativeStress. Enhanced proliferation of cancer cells is associated with el-evated metabolic activity, metabolic stress, and enhanced ROSproduction (4, 20). Overexpression of NAF-1 in cancer cells couldpromote cellular proliferation by alleviating metabolic stress, as wellas preventing metabolic stress-derived ROS accumulation. To de-termine whether enhanced NAF-1 expression promoted cellularproliferation via reducing metabolic stress we tested respiration,glycolysis, and ROS accumulation in NAF-1–overexpressing cells.Overexpression of NAF-1 resulted in enhanced respiration andglycolytic activity, supporting the possible production of excessmetabolic ROS (Fig. 2 A and B) (4, 20–23). Remarkably, we wereunable, however, to detect elevated levels of ROS in NAF-1(+)cells, compared with controls (Fig. 2C). Moreover, NAF-1(+) cellswere able to detoxify H2O2 more efficiently than control cells (Fig.2C) and had a higher survival rate compared with control cells whenchallenged with H2O2 or superoxide (Fig. 2D), suggesting that theycould contain elevated levels of ROS detoxifying mechanisms.Similar resistance to oxidative stress was observed in MCF-7, adifferent human epithelial breast cancer cell line, overexpressingNAF-1 (Fig. S2). Moreover, the application of the iron chelatordeferiprone (DFP) or the antioxidant N-acetyl cysteine (NAC) hada protective effect similar to that of NAF-1 overexpression oncontrol cancer cells challenged with oxidative stress (Fig. S3), fur-ther demonstrating that an enhanced potential for ROS scavenging
Fig. 1. Enhanced expression of NAF-1 in humanMDA-MB-231 breast cancer cells is associated withsignificant xenograft tumor growth in vivo. (A) Ex-pression of NAF-1 in in noncancerous epithelial breastcells (MCF-10A), MDA-MB-231 (control), NAF-1(+), andNAF-1(−) measured as described in ref. 11. (B, I) Meanplot of tumor size (cm2) change over time comparingcontrol, NAF-1(+), and NAF-1(−) xenograft tumors.Average ± SD tumor size for each time point is pre-sented. (II) Bar graph showing xenograft tumor size at5.5 wk following tumor injection. *P < 0.05, ***P <0.001, n = 30 (10 in each group). (C, I) IHC for NAF-1showing increase in the number of NAF-1+ cells in NAF-1(+) compared with control and NAF-1(−) tumors. (II) IHCfor γH2AX, a marker for cellular senescence, showing adecrease in the number of γH2AX+ cells in NAF-1(+)compared with control and NAF-1(−) tumors. (Left)Representative sections 40×. (Right) Quantificationof positive cells. Cells were counted in 10 high-power fields (40×) for each section obtained from fivemice in each group and average ± SD counts arepresented. ***P < 0.001.
Darash-Yahana et al. PNAS | September 27, 2016 | vol. 113 | no. 39 | 10891
BIOPH
YSICSAND
COMPU
TATIONALBIOLO
GY
could be the basis of NAF-1 function in cancer cells. Becauseoxidative stress in cells is associated with mTOR inactivationleading to suppressed cell proliferation, as well as HIF-1α stabili-zation leading to the induction of ROS-scavenging mechanisms(24–26), we measured the expression of HIF-1α and the phos-phorylation state of two mTOR target proteins (Fig. S4). Our re-sults indicate that overexpression of NAF-1 caused HIF-1αstabilization and that mTOR was not inactivated in NAF-1(+) cells.
Enhanced Expression of NAF-1 Is Associated with Elevated Expressionof Transcripts and Proteins Involved in ROS Detoxification. To de-termine whether enhanced NAF-1 expression is associated withenhanced expression of proteins and transcripts involved in ROS
detoxification, we performed proteomics analysis of xenograft tu-mors overexpressing NAF-1. In addition, we conducted meta-analysis of transcriptomics data from a collection of triple-negativebreast cancer cell lines (Fig. 3 and Figs. S5 and S6). Our proteomicanalysis identified 359 proteins significantly up-regulated and 287proteins significantly down-regulated in NAF-1(+) tumors (forcomplete details, see SI Materials and Methods, Fig. 3A, Fig. S5,and Datasets S1 and S2). Gene Ontology and Kyoto Encyclopediaof Genes and Genomes (KEGG) pathway annotations of theproteins enriched in NAF-1(+) tumors pointed to enhanced ROSdetoxification and pentose phosphate pathways (supply of NADPHfor ROS removal), coupled with reduced oxidative phosphoryla-tion, TCA cycle, and fatty acid oxidation (potential sources ofROS) (Fig. S5 and Dataset S3). The level of several key proteinsinvolved in ROS detoxification was found to be up-regulated inNAF-1(+) tumors (Fig. 3A). These included superoxide dismutase1 (SOD1), glutathione peroxidase 4 (GPX4), glutathione synthase(GSS), sulfiredoxin 1 (SRXN1), copper chaperone for SOD(CCS), glutaredoxin-1, and ferritin light and heavy chain proteins(Dataset S2). We further confirmed by immunohistochemistry(IHC) that ferritin (FTH-1) is up-regulated in NAF-1(+) tumors(Fig. 3B). Ferritin could play a key role in ROS detoxification viasequestering of free iron that could potentially lead to the forma-tion of hydroxyl radicals. We further analyzed transcriptomics dataobtained from 21 different triple-negative (TN) human epithelialbreast cancer cell lines (27). As shown in Fig. 3C, the expression ofNAF-1 was positively correlated with that of SRXN1, GPX1, GSS,
1.6
1.4
1.2
0.8
1.0
2O22O2
2O2
*** ***
0’ 60’
0’ 60’
0
8
NC
14 ***1210
642
0
2
NC
4 ***3
1
**
A 1.6
1.4
1.2
00 60 80
0.4
0.8
0.6
100
1.0
0.2
160
020
ATP
140
180
80
Oligomycin
FCCP
Oligomycin
Antimycin A & Rotenone
20 40
4060
100120
*
*
B
C D
12
10
00 60 80
6
4
100
8
2
0
100
700
800
400Glucose
2-DG
20 40
200
300
500
600
**
Fig. 2. Enhanced expression of NAF-1 is associated with enhanced metabolicactivity and oxidative stress resistance of cancer cells. (A) Oxygen consumptionrates (OCR) (Left) and calculated spare respiratory activity values (Right) ofcontrol and NAF-1(+) cells showing enhanced respiratory activity of NAF-1(+)cells. (B) Extracellular acidification rates (ECAR) (Right) and calculated glycolyticcapacity of control and NAF-1(+) cells showing enhanced glycolytic activity ofNAF-1(+) cells. *P < 0.05, **P < 0.01. (C) Detoxification of ROS by NAF-1(+)cells. (C, Upper) Semiconfocal Images of control and NAF-1(+) cells at 0 min and60 min following preincubation with Dihydrorhodamine 123; 2-(3,6-Diamino-9H-xanthene-9-yl)-benzoic acid methyl ester (DHR) for 10 min in the presenceor absence of H2O2 (50 μM). (Lower) Quantification of DHR mean fluorescenceat 60 min in the presence or absence of H2O2 (50 μM). ***P < 0.001. (D)Quantitative analysis of cell death in control and NAF-1(+) cells treated or nottreated with G/GO (10 mM/0.15 units/mL) or paraquat (1 mM). ***P < 0.001.
Fig. 3. NAF-1 overexpression is associated with the up-regulation of ROS-relatedproteins in breast cancer clinical samples and xenografts. (A) Expression intensitiesfor selected ROS-related proteins in NAF-1(+) and control tumors using proteomicanalysis on tumor control and NAF-1(+) xenografts. LFQ, label-free quantification.Proteomics analysis is described in SI Materials and Methods. *P < 0.02, **P <0.001, ***P < 0.0001, n = 4 in each group. (B) IHC for ferritin heavy polypeptide 1(FTH-1). (Left) Representative sections, 40×. (Right) Ferritin+ cells were counted in10 high-power fields (×40) for each section obtained from 10 mice in each groupand average ±SD counts are presented. ***P < 0.001. (C) Correlation network forNAF-1 and different transcripts that positively (purple) or negatively (green)correlate with NAF-1 expression in transcriptomic data from 21 different humanTN breast cancer cell lines (27). All correlations were filtered with a cutoff of±0.40. Black edges, positive correlation; red edges, negative correlation. Thethickness of the edges is related to the absolute value of the correlation.
10892 | www.pnas.org/cgi/doi/10.1073/pnas.1612736113 Darash-Yahana et al.

NAD(P)H dehydrogenase quinone 1 (NQO1), peroxiredoxin 1(PRX1), and thioredoxin reductase 1 (TXNRD1), all involved inROS metabolism and detoxification. NAF-1 accumulation was alsoassociated with the enhanced accumulation of transcripts encodingcell cycle control proteins (Fig. S6). The findings presented inFig. 3, Fig. S5, and Dataset S1 suggest that NAF-1 overexpressionis associated with resistance of cells to oxidative stress, a possiblemechanism that could promote rapid tumor cell growth (21–23).
A Mutation That Stabilizes the NAF-1 2Fe-2S Clusters (H114C) AbolishesIts Tumor-Promoting and Oxidative Stress Protection Functions inCancer Cells. To determine whether the function of NAF-1 in pro-moting tumor growth (Fig. 1) is dependent on the function of theNAF-1 clusters, we overexpressed in MDA-MB-231 cells a mu-tated form of NAF-1 in which the 3Cys-1His cluster coordinationstructure was changed into a 4-Cys cluster (H114C) (Fig. 4 A, I).The NAF-1(H114C) mutant protein is 25-fold more stable and hasa reducing potential (Em) that is ∼300 mVmore negative than thatof wild-type NAF-1 (28). In addition, the NAF-1(H114C) mutantwas unable to donate its cluster to an acceptor protein (28). Theoverexpression of H114C in cancer cells is expected to completelyor partially replace the native NAF-1 protein with the H114C in-active variant and/or inhibit NAF-1 function via the formation ofinactive NAF-1/H114C dimers (i.e., a dominant-negative effect)(6). As shown in Fig. 4 A, II, the H114C protein was stable inNAF-1(H114C) MDA-MB-231 cancer cells and accumulated tothe same level as the overexpressed wild-type NAF-1 in NAF-1(+)cells. Remarkably, xenograft tumors that developed from NAF-1(H114C) cells were significantly smaller than those developed fromcontrol or NAF-1(+) cells (Fig. 4 B and C). This finding clearlyindicates that the lability of the 2Fe-2S NAF-1 cluster is critical forits tumor-promoting function. NAF-1 was previously shown toregulate the levels of mitochondrial iron and ROS in cells (10, 11).To determine whether the lability of the NAF-1 cluster is requiredfor this function in cancer cells we measured mitochondrial ironand ROS in NAF-1(H114C) cells. Compared with control or NAF-1(+) cells, the mitochondria of NAF-1(H114C) cells accumu-lated significant levels of iron and ROS (Fig. 4D). To determinewhether the lability of the NAF-1 cluster is also required for en-hancing the ROS detoxification capacity of cells, we challenged NAF-1(H114C) cells with H2O2. In contrast to untreated controlor NAF-1(+) cells, untreated NAF-1(H114C) cells accumulated
significant levels of ROS (Fig. 4D). Moreover, whereas NAF-1(+)cells were able to detoxify H2O2 that was added to their culture,control and NAF-1(H114C) cells were unable to do so (Fig. 4D).These findings provided an important link between mitochondrialiron accumulation, the function of NAF-1 in mediating Fe-S clustertransfer reactions in cells, and the overall resistance of cells to ox-idative stress. In addition, they strongly support a role for the labile2Fe-2S cluster of NAF-1 in alleviating ROS stress in cancer cells.
Treatment with PGZ, a Drug That Stabilizes the Native 3Cys-1His 2Fe-2S Cluster of NAF-1, Inhibits the Function of NAF-1 in Cancer Cells andResults in the Overaccumulation of Mitochondrial Iron and ROS. Thethiazolidinedione (TZD) class of peroxisome proliferator-acti-vated receptor gamma (PPAR-γ) ligand drugs is known for itsability to induce adipocyte differentiation, to increase insulinsensitivity, and to have anticancer properties (29, 30). We pre-viously showed that PGZ, a TZD drug, inhibits NAF-1’s abilityto transfer its cluster to apo-acceptor proteins (31). To testwhether stabilizing the NAF-1 cluster via treatment with TZDhas an effect on cancer cells similar to that of overexpressing thecluster-stable NAF-1(H114C) mutant, we treated control, NAF-1(+),and NAF-1(H114C) cells with 100 μM PGZ overnight. As shown inFig. 5 A, I, treatment of control or NAF-1(+) cells with PGZ resultedin the accumulation of mitochondrial iron to levels similar to thatobserved for untreated NAF-1(H114C) cells. In contrast, no furtherincrease in mitochondrial iron could be obtained by treatment ofNAF-1(H114C) cells with PGZ (Fig. 5 A, I). Treatment of NAF-1(+)cells with PGZ also resulted in a significant increase in mitochondrialROS levels (Fig. 5 A, II). In contrast, treatment of control cells withPGZ did not alter the level of mitochondrial ROS. In addition, nofurther increase in mitochondrial ROS could be obtained by treat-ment of NAF-1(H114C) cells with PGZ (Fig. 5 A, II). These findingssuggested that in contrast to control cells that have a native level ofNAF-1 protein, NAF-1(+) cells that overexpress NAF-1 are moresensitive to PGZ. Furthermore, cells that overexpress the NAF-1(H114C) protein and already have high levels of mitochondrial ironand ROS are insensitive to treatment with PGZ. To further study thebinding of PGZ to NAF-1 we used our in-house molecular dockingmethod iFitDock (32) to dissect their interaction. In our model, PGZbinds to NAF-1 (PDB ID code 4OO7) with a binding energy of −42kJ/mol. PGZ binding is accompanied by both hydrophobic inter-actions and the formation of four hydrogen bonds between PGZ
Fig. 4. Overexpression of a NAF-1 mutant NAF-1(H114C) with a single amino acid mutation exchanging 3Cys-1His to a 4Cys cluster resulted in a dramatic decrease intumor size in vivo, accompanied by reduced tolerance to oxidative stress. (A, I) Structure of the NAF-1 3Cys-1His cluster vs. the NAF-1(H114C) mutant with a 4Cys cluster.(II) Expression of NAF-1 in MDA-MB-231 (control), NAF-1(+), and NAF-1(H114C) cells measured as described in ref. 11. (B) Mean plot of tumor size (cm2) change over timecomparing control, NAF-1(+), and NAF-1(H114C) xenograft tumors. Average ± SD tumor size for each time point is presented. (C) Bar graph showing xenograft tumorsize at 5 wk following tumor injection. ***P < 0.001, n = 30 (10 in each group). (D) Detoxification of ROS by control, NAF-1(+), and NAF-1(H114C) cells. (Upper)Semiconfocal images of control, NAF-1(+), and NAF-1(H114C) cells at 0 min and 60 min following preincubation with DHR for 10min in the presence or absence of H2O2
(50 μM). (Magnification: 600×.) (Lower) Quantification of DHR mean fluorescence at 60 min in the presence or absence of H2O2 (50 μM). **P < 0.01, ***P < 0.001.
Darash-Yahana et al. PNAS | September 27, 2016 | vol. 113 | no. 39 | 10893
BIOPH
YSICSAND
COMPU
TATIONALBIOLO
GY

and residues Y98, K81, H114, and N115 (Fig. 5B). Thus, ourmodel predicts that PGZ binds to NAF-1 in the vicinity of itsclusters, shielding His114 and preventing it from undergoingprotonation that would cause cluster destabilization. The findingspresented in Fig. 5 highlight a potential use of drugs that stabilizethe clusters of NEET proteins in the treatment of cancers withhigh expression level of NAF-1.
DiscussionMaintaining the biogenesis of Fe-S clusters was shown to be im-portant for cancer cell proliferation, suggesting that Fe-S–contain-ing proteins could play an important role in cancer cell metabolism(1–5). Here, we identified the 2Fe-2S protein NAF-1 as a keyprotein that promotes tumorigenicity when overexpressed in cancercells (Fig. 1). Thus, overexpression of NAF-1 in xenograft breastcancer tumors resulted in a dramatic enhancement in tumorsize and aggressiveness in vivo, as well as enhanced the toleranceof cancer cells to oxidative stress (Figs. 1–3). Remarkably, over-expression of a NAF-1 mutant, with a single amino acid mutation,NAF-1(H114C), that stabilizes its 2Fe-2S cluster 25-fold over thatof the native NAF-1 cluster in cancer cells, resulted in a dramaticdecrease in tumor size in vivo, accompanied by enhanced mito-chondrial iron and ROS accumulation and reduced tolerance tooxidative stress (Figs. 4 and 5). Furthermore, treatment of NAF-1(+)cells with PGZ, a drug that stabilizes the 3Cys-1His cluster ofNAF-1, resulted in a similar phenotype to that of overexpressingthe stable mutant of NAF-1 in cells [NAF-1(H114C)] (Fig. 5).Taken together, these findings point to a key role for the3Cys-1His cluster coordination structure of NAF-1 in promotingrapid tumor growth, probably through enhanced cellular re-sistance to oxidative stress.
Proliferating breast cancer cells are thought to accumulate highlevels of iron and ROS in their mitochondria, up to levels thatcould potentially limit their growth and proliferation (23). Ourfindings that overexpression of the NAF-1(H114C) protein failedto attenuate the mitochondrial levels of iron and ROS and resultedin suppressed tumor growth (to below that of normal cancer cells;Fig. 4) provide direct evidence for a key role for the NAF-1 2Fe-2Scluster in these functions. NAF-1 could therefore be preventing thebuildup of labile iron in mitochondria and its adverse consequencesof enhanced ROS formation in proliferating breast cancer cells, viareactions that are mediated by NAF-1’s 2Fe-2S cluster. The ac-cumulation of labile iron in the mitochondria could therefore berate limiting for breast cancer cell proliferation, and the function ofthe labile 2Fe-2S cluster of the overexpressed NAF-1 protein couldbe key to inducing a state of enhanced tolerance to oxidative stressin cancer cells and tumors.Alterations in NAF-1 cluster lability by PGZ or the H114C
mutation resulted in the overaccumulation of iron and ROS inmitochondria of cancer cells (Figs. 4 and 5). These findings sup-port our previous report that NAF-1 could be one of the cellulartargets of a mitocan that affects its cluster stability and causes anincrease in mitochondrial iron and ROS accumulation (33). Takentogether, our findings suggest that any drastic change in the labilityof the NAF-1 cluster would impair its function in maintaining thelevels of iron and ROS in mitochondria under control. AlteringNAF-1 cluster lability via different drugs could therefore be usedto treat different cancers that depend on NAF-1 overexpressionfor their proliferation (10, 11, 14–19).From the mechanistic standpoint, we demonstrate that at least
two different components are required for NAF-1 to promotebreast cancer tumorigenicity: a high level of NAF-1 protein ex-pression and a unique cluster coordination structure that allowscluster lability. Only together do these two components create acellular environment that promotes cancer cell tumorigenicityand enhances tolerance to oxidative stress. The high levels ofNAF-1 protein coupled with the lability of its cluster achievetherefore a cellular threshold that enables cancer cells to main-tain a high energetic state without the overaccumulation of ironand ROS in their mitochondria. In addition, they promote ROSresistance through the stabilization of HIF-1α and the accumu-lation of many antioxidative proteins and transcripts (Fig. 3 andFigs. S4–S6). Our findings establish a key role for NAF-1 over-expression in promoting the tumorigenicity of breast cancer cells(Fig. 1). Furthermore, they provide a mechanistic foundation forthe role of NAF-1 overexpression in multiple cancer types, in-cluding breast (10, 11), prostate (15), gastric (16), cervical (17),liver (18), and laryngeal cancers (19).
ConclusionElevated expression of NAF-1 is associated with the progressionof multiple cancer types. Here we show that NAF-1 over-expression in xenograft tumors results in a dramatic augmenta-tion in tumor size and aggressiveness and that at least twodifferent components are required for NAF-1 to promote breastcancer tumorigenicity: high levels of NAF-1 protein expressionand a unique cluster coordination structure that conveys clusterlability. We propose that together these two components protectcancer cells from oxidative stress by preventing the buildup oflabile iron and ROS in mitochondria. Drugs that alter NAF-1cluster stability and/or NAF-1 protein level could therefore beused to treat multiple cancers that express high levels of NAF-1.
Materials and MethodsAnimal Studies. Animal experiments were performed in compliance with theHebrew University Authority for biological and biomedical models (NS-13-13911-4). MDA-MB-231 human breast cancer cells (2.5 × 10⁵) with normalNAF-1 (control), suppressed NAF-1 [shRNA; NAF-1(−)], or overexpressedNAF-1 [NAF-1(+) or NAF-1(H114C)] were injected s.c. into female athymicnude (FOXN1NU) 5- to 6-wk-old mice. Mouse weight and tumor size weremeasured twice weekly throughout the experiment.
Fig. 5. Treatment with PGZ, a drug that stabilizes the 3Cys-1His clustersof NAF-1, inhibits the function of NAF-1 in cancer cells and results in theoveraccumulation of mitochondrial iron and ROS. (A) Accumulation of mito-chondrial iron measured with rhodamine B-[(1,10-phenanthrolin-5-yl amino-carbonyl] benzyl ester (RPA) (A, I) and mitochondrial ROS measured withmitoSOX (Mitochondrial Superoxide Indicator Red) (II) in control, NAF-1(+), andNAF-1(H114C) MDA-MB-231 cells treated overnight with PGZ (100 μM). The bargraph represents mean fluorescence values as relative unit (r.u.) of more than10 cells per field, calculated for the initial images and images after 1 h andnormalized to the initial fluorescence (f/f0) *P < 0.05, **P < 0.01, ***P < 0.001,n = 30 (10 in each group). (B) The predicated binding mode of PGZ to NAF-1.PGZ binds in the vicinity of the 2Fe-2S cluster of NAF-1 (binding free energy of−42 kJ/mol). The pink stick-ball model is the PGZ compound. Hydrogen bondsbetween PGZ and NAF-1 are shown as red dashed lines. The list of NAF-1 aminoacids that interact with PGZ by π–π interactions or hydrogen bonding is pro-vided in the table on the left side of the structure.
10894 | www.pnas.org/cgi/doi/10.1073/pnas.1612736113 Darash-Yahana et al.
Cell Culture Analysis and Drug Treatment. MDA-MB-231 and MCF-7 cells weregrown as described in ref. 10. Plasmid for suppressing NAF-1 expression[shRNA; NAF-1(−)] (10) was pGFP-RS vector, and plasmid for overexpressingNAF-1 [NAF-1(+) or NAF-1(H114C)] was pEGFP-N1 vector. GenJuice (EMDMillipore) was used for transfection (10). Stable cell lines were obtained byFACS sorting, and protein expression was confirmed by protein blots (10, 11).Fluorescence microscopy was performed as described in refs. 10 and 11.
IHC and Transmission Electron Microscopy. s.c. tumors were recovered fromnecropsy, measured for weight and size, and fixed for IHC and transmissionelectron microscopy (TEM) and analyzed as described in refs. 10 and 11. Thehistological examination was performed by a pathologist (E.P.). Anti-CISD2(NAF-1; HPA015914; Sigma) and antiphospho-Histone H2A.X (Ser139; cloneJBW301; Merck) were used for IHC as described in ref. 11.
Cell Viability, Metabolic Activity, and Growth Measurements. Alamar-blue(Invitrogen) was used to determine cell viability, and a Moxi Z cell counter(ORFLO Technologies) was used to measure cell growth (10). Paraquat (1 mM;0–3 d) and glucose/glucose oxidase (G/GO; 10 mM/0.15 units/mL; 0–2 h) wereused to induce oxidative stress. Oxygen consumption and extracellularacidification rates were measured using a Seahorse XF24 analyzer (SeahorseBioscience) as described in ref. 10.
Meta-Analysis of Transcriptomics Data from 21 TN (ER-, PR-, Her2-) Human BreastCancer Cell Lines. Transcriptomics data for HCC70, HCC1143, HCC1187, BT20,SUM185PE, SUM1315MO2, MCF12A, MCF10a, MCF10F, MDA-MB-157, MDA-MB-231, HS578T, HCC1806, HCC3153, SUM149PT, HCC38, HCC2185, BT549,HCC1937, SUM159PT, and HCC1395 were obtained from ref. 27. Pearson
correlation was calculated between the expression levels of NAF-1 and the ex-pression levels of different transcripts encoding ROS detoxification [antioxidantactivity: Gene Ontology (GO): 0016209] or cell cycle regulation (cell cycle: GO:0007049). A correlation network was constructed with a cutoff of ±0.4 and vi-sualized with Cytoscape (www.cytoscape.org/). The following criterion was used:Two randomly sampled datasets (from Gaussian distribution) have no more than4% chance of having Pearson correlation above the cutoff value.
Proteomic Analysis. Paraffin blocks from four different xenograft tumors ofeither control or overexpressed NAF-1 were cut and subjected to proteomicsand statistical analysis as described in SI Materials and Methods.
Computational Calculations. The druggable binding site on NAF-1 was iden-tified by a four-step computational scheme in our previous work (33). Basedon this finding, the binding of PGZ to NAF-1 was studied by our in-housedocking molecular tool iFitDock (details in SI Materials and Methods).
ACKNOWLEDGMENTS. This work was supported by Israel Science Founda-tion Grant 865/13 (to R.N.); the University of North Texas College of Arts andSciences (R.M.); and the Israel Cancer Research Fund (T.G.). Work at theCenter for Theoretical Biological Physics is sponsored by the National ScienceFoundation (Grants PHY-1427654) and by the Cancer Prevention and ResearchInstitute of Texas (CPRIT) (R1110). M.L. is supported by a training fellowshipfrom the Keck Center for Interdisciplinary Bioscience Training of the Gulf CoastConsortia (CPRIT Grant RP140113); F.B. was partially supported by the WelchFoundation (Grant C-1792); and P.A.J. is supported by National Institutes ofHealth Grant GM101467.
1. Gee HE, Ivan C, Calin GA, Ivan M (2014) HypoxamiRs and cancer: From biology to
targeted therapy. Antioxid Redox Signal 21(8):1220–1238.2. Thierbach R, et al. (2005) Targeted disruption of hepatic frataxin expression causes
impaired mitochondrial function, decreased life span and tumor growth in mice. Hum
Mol Genet 14(24):3857–3864.3. Funauchi Y, et al. (2015) Regulation of iron homeostasis by the p53-ISCU pathway. Sci
Rep 5:16497.4. Sullivan LB, Chandel NS (2014) Mitochondrial reactive oxygen species and cancer.
Cancer Metab 2:17.5. Gari K, et al. (2012) MMS19 links cytoplasmic iron-sulfur cluster assembly to DNA
metabolism. Science 337(6091):243–245.6. Tamir S, et al. (2015) Structure-function analysis of NEET proteins uncovers their role
as key regulators of iron and ROS homeostasis in health and disease. Biochim Biophys
Acta 1853(6):1294–1315.7. Du X, et al. (2015) NAF-1 antagonizes starvation-induced autophagy through AMPK
signaling pathway in cardiomyocytes. Cell Biol Int 39(7):816–823.8. Vento MT, et al. (2010) Praf2 is a novel Bcl-xL/Bcl-2 interacting protein with the ability
to modulate survival of cancer cells. PLoS One 5(12):e15636.9. Wang CH, Tsai TF, Wei YH (2015) Role of mitochondrial dysfunction and dysregulation of
Ca(2+) homeostasis in insulin insensitivity of mammalian cells.AnnN YAcad Sci 1350:66–76.10. Sohn YS, et al. (2013) NAF-1 and mitoNEET are central to human breast cancer pro-
liferation by maintaining mitochondrial homeostasis and promoting tumor growth.
Proc Natl Acad Sci USA 110(36):14676–14681.11. Holt SH, et al. (2016) Activation of apoptosis in NAF-1-deficient human epithelial
breast cancer cells. J Cell Sci 129(1):155–165.12. Chang NC, et al. (2012) Bcl-2-associated autophagy regulator Naf-1 required for
maintenance of skeletal muscle. Hum Mol Genet 21(10):2277–2287.13. Wu CY, et al. (2012) A persistent level of Cisd2 extends healthy lifespan and delays
aging in mice. Hum Mol Genet 21(18):3956–3968.14. Salem AF, Whitaker-Menezes D, Howell A, Sotgia F, Lisanti MP (2012) Mitochondrial
biogenesis in epithelial cancer cells promotes breast cancer tumor growth and confers
autophagy resistance. Cell Cycle 11(22):4174–4180.15. Ge YZ, et al. (2014) Pathway analysis of genome-wide association study on serum
prostate-specific antigen levels. Gene 551(1):86–91.16. Wang L, et al. (2016) Overexpressed CISD2 has prognostic value in human gastric
cancer and promotes gastric cancer cell proliferation and tumorigenesis via AKT
signaling pathway. Oncotarget 7(4):3791–3805.17. Liu L, et al. (2014) CISD2 expression is a novel marker correlating with pelvic lymph node
metastasis and prognosis in patients with early-stage cervical cancer.MedOncol 31(9):183.18. Chen B, et al. (2015) CISD2 associated with proliferation indicates negative prognosis
in patients with hepatocellular carcinoma. Int J Clin Exp Pathol 8(10):13725–13738.19. Yang L, et al. (2016) A novel prognostic score model incorporating CDGSH Iron Sulfur
Domain2 (CISD2) predicts risk of disease progression in laryngeal squamous cell car-
cinoma. Oncotarget 7(16):22720–22732.
20. Poillet-Perez L, Despouy G, Delage-Mourroux R, Boyer-Guittaut M (2015) Interplaybetween ROS and autophagy in cancer cells, from tumor initiation to cancer therapy.Redox Biol 4:184–192.
21. Tong L, Chuang CC, Wu S, Zuo L (2015) Reactive oxygen species in redox cancertherapy. Cancer Lett 367(1):18–25.
22. Manda G, et al. (2015) The redox biology network in cancer pathophysiology andtherapeutics. Redox Biol 5:347–357.
23. Torti SV, Torti FM (2013) Iron and cancer: More ore to be mined. Nat Rev Cancer 13(5):342–355.
24. Wu SB, Wu YT, Wu TP, Wei YH (2014) Role of AMPK-mediated adaptive responses inhuman cells with mitochondrial dysfunction to oxidative stress. Biochim Biophys Acta1840(4):1331–1344.
25. Sofer A, Lei K, Johannessen CM, Ellisen LW (2005) Regulation of mTOR and cellgrowth in response to energy stress by REDD1. Mol Cell Biol 25(14):5834–5845.
26. Movafagh S, Crook S, Vo K (2015) Regulation of hypoxia-inducible factor-1a by reactiveoxygen species: New developments in an old debate. J Cell Biochem 116(5):696–703.
27. Costello JC, et al.; NCI DREAM Community (2014) A community effort to assess andimprove drug sensitivity prediction algorithms. Nat Biotechnol 32(12):1202–1212.
28. Tamir S, et al. (2014) A point mutation in the [2Fe-2S] cluster binding region of the NAF-1protein (H114C) dramatically hinders the cluster donor properties. Acta Crystallogr D BiolCrystallogr 70(Pt 6):1572–1578.
29. Nadarajan K, Balaram P, Khoo BY (January 11, 2016) MK886 inhibits the pioglitazone-induced anti-invasion of MDA-MB-231 cells is associated with PPARα/γ, FGF4 and5LOX. Cytotechnology, 10.1007/s10616-015-9930-5.
30. Kole L, Sarkar M, Deb A, Giri B (2016) Pioglitazone, an anti-diabetic drug requiressustained MAPK activation for its anti-tumor activity in MCF7 breast cancer cells, in-dependent of PPAR-γ pathway. Pharmacol Rep 68(1):144–154.
31. Tamir S, et al. (2013) Nutrient-deprivation autophagy factor-1 (NAF-1): Biochemicalproperties of a novel cellular target for anti-diabetic drugs. PLoS One 8(5):e61202.
32. Bai F, et al. (2013) Free energy landscape for the binding process of Huperzine A toacetylcholinesterase. Proc Natl Acad Sci USA 110(11):4273–4278.
33. Bai F, et al. (2015) The Fe-S cluster-containing NEET proteins mitoNEET and NAF-1 aschemotherapeutic targets in breast cancer. Proc Natl Acad Sci USA 112(12):3698–3703.
34. Cox J, et al. (2014) Accurate proteome-wide label-free quantification by delayednormalization and maximal peptide ratio extraction, termed MaxLFQ. Mol CellProteomics 13(9):2513–2526.
35. Tyanova S, et al. (2016) The Perseus computational platform for comprehensiveanalysis of (prote)omics data. Nat Methods 13(9):731–740.
36. Pozniak Y, et al. (2016) System-wide clinical proteomics of breast cancer reveals globalremodeling of tissue homeostasis. Cell Syst 2(3):172–184.
37. Sastry GM, Adzhigirey M, Day T, Annabhimoju R, Sherman W (2013) Protein and ligandpreparation: Parameters, protocols, and influence on virtual screening enrichments.J Comput Aided Mol Des 27(3):221–234.
38. Lang PT, et al. (2009) DOCK 6: Combining techniques to model RNA-small moleculecomplexes. RNA 15(6):1219–1230.
39. Mills N (2006) ChemDraw Ultra 10.0. J Am Chem Soc 128(41):13649–13650.
Darash-Yahana et al. PNAS | September 27, 2016 | vol. 113 | no. 39 | 10895
BIOPH
YSICSAND
COMPU
TATIONALBIOLO
GY