Embed Size (px)
Citation preview
SESSION ID:SESSION ID:
#RSAC
Evan Wheeler
Break the Risk Paradigms - Overhauling Your Risk Program
GRC-T11
MUFG Union BankDirector, Information Risk Management
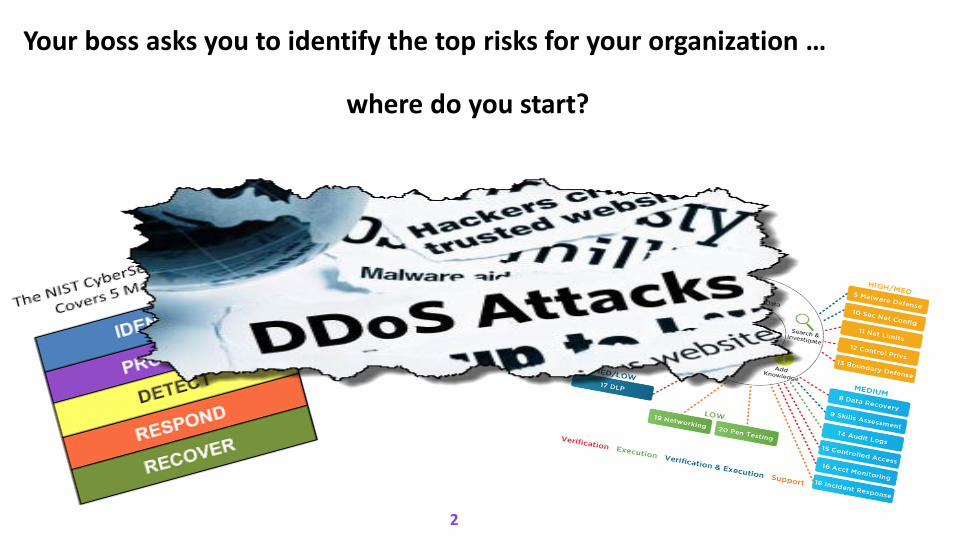
Your boss asks you to identify the top risks for your organization …
where do you start?
2
#RSAC
Goals of Risk Management
Minimizing uncertainties for the business
Aligning and controlling organizational components to produce the maximum output
Providing governance and oversight
Cost effective
3
#RSAC
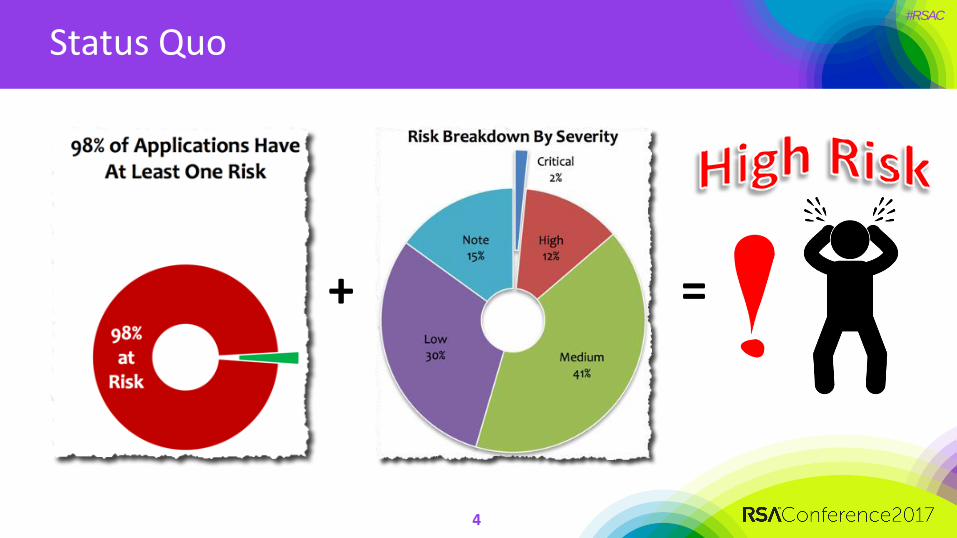
Status Quo
+ =
4
#RSAC
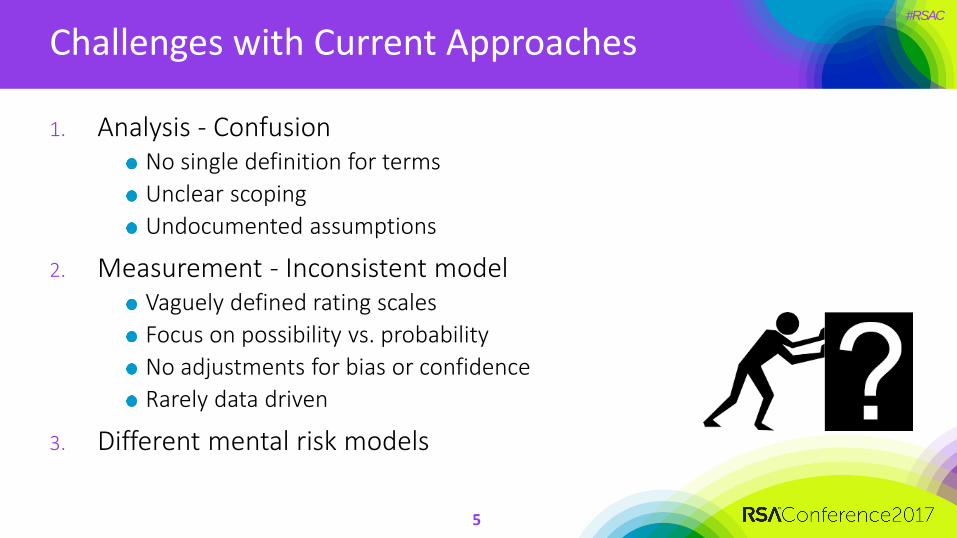
Challenges with Current Approaches
1. Analysis - ConfusionNo single definition for terms
Unclear scoping
Undocumented assumptions
2. Measurement - Inconsistent modelVaguely defined rating scales
Focus on possibility vs. probability
No adjustments for bias or confidence
Rarely data driven
3. Different mental risk models
5
#RSAC
Breaking the Mold
Implementing FAIR
6
#RSAC
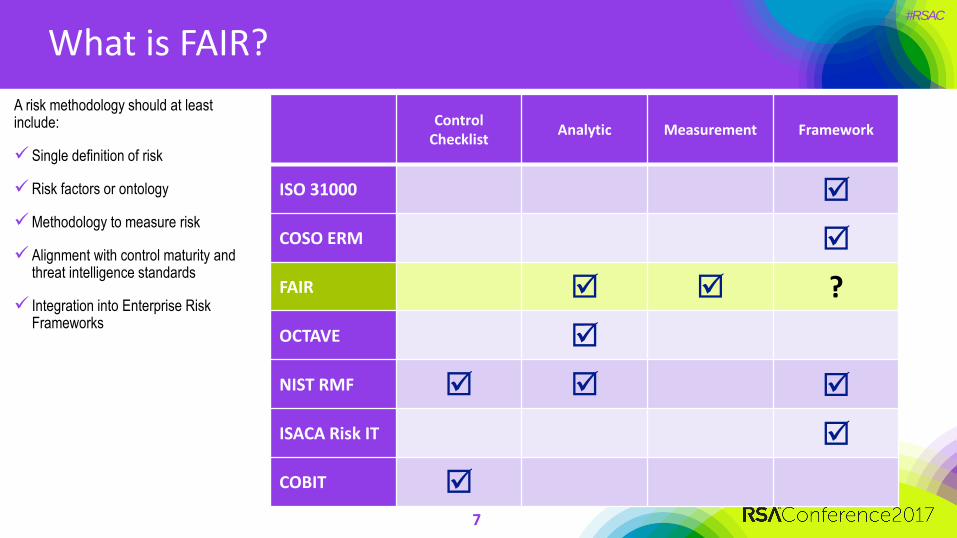
What is FAIR?
A risk methodology should at least include:
Single definition of risk
Risk factors or ontology
Methodology to measure risk
Alignment with control maturity and threat intelligence standards
Integration into Enterprise Risk Frameworks
ControlChecklist
Analytic Measurement Framework
ISO 31000
COSO ERM
FAIR ?
OCTAVE
NIST RMF
ISACA Risk IT
COBIT
7
Benefits of Using FAIR
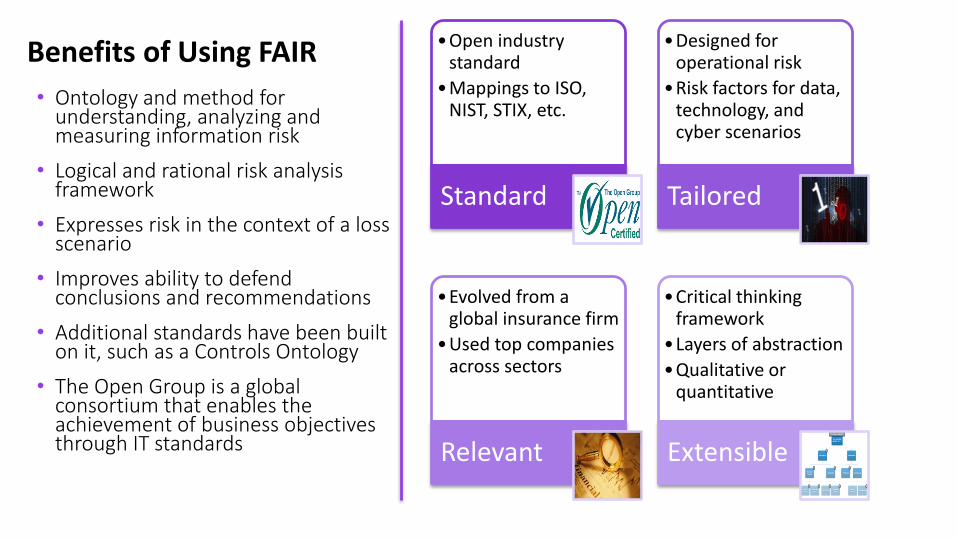
• Ontology and method for understanding, analyzing and measuring information risk
• Logical and rational risk analysis framework
• Expresses risk in the context of a loss scenario
• Improves ability to defend conclusions and recommendations
• Additional standards have been built on it, such as a Controls Ontology
• The Open Group is a global consortium that enables the achievement of business objectives through IT standards
•Open industry standard
•Mappings to ISO, NIST, STIX, etc.
Standard
•Designed for operational risk
•Risk factors for data, technology, and cyber scenarios
Tailored
•Evolved from a global insurance firm
•Used top companies across sectors
Relevant
•Critical thinking framework
•Layers of abstraction
•Qualitative or quantitative
Extensible
#RSAC
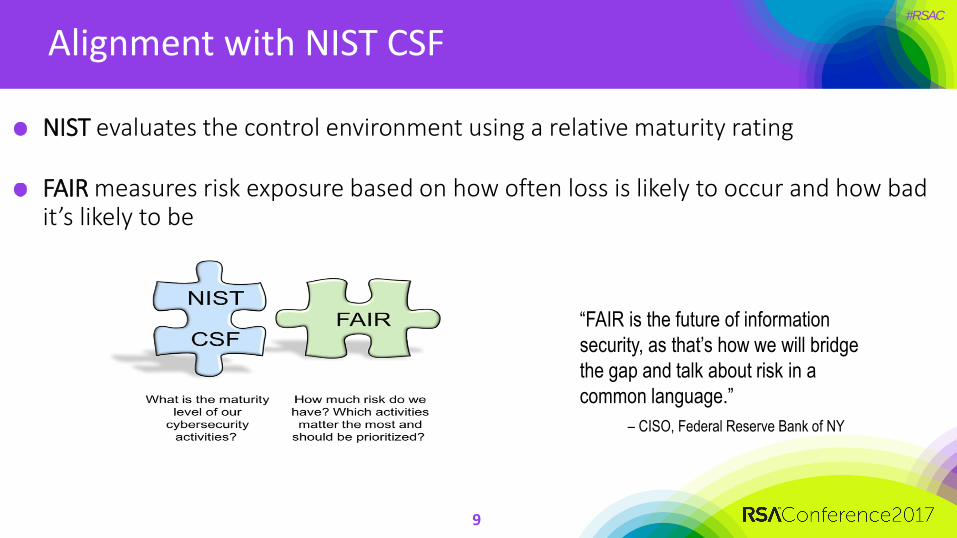
Alignment with NIST CSF
NIST evaluates the control environment using a relative maturity rating
FAIR measures risk exposure based on how often loss is likely to occur and how bad it’s likely to be
“FAIR is the future of information
security, as that’s how we will bridge
the gap and talk about risk in a
common language.”
– CISO, Federal Reserve Bank of NY
9
#RSAC
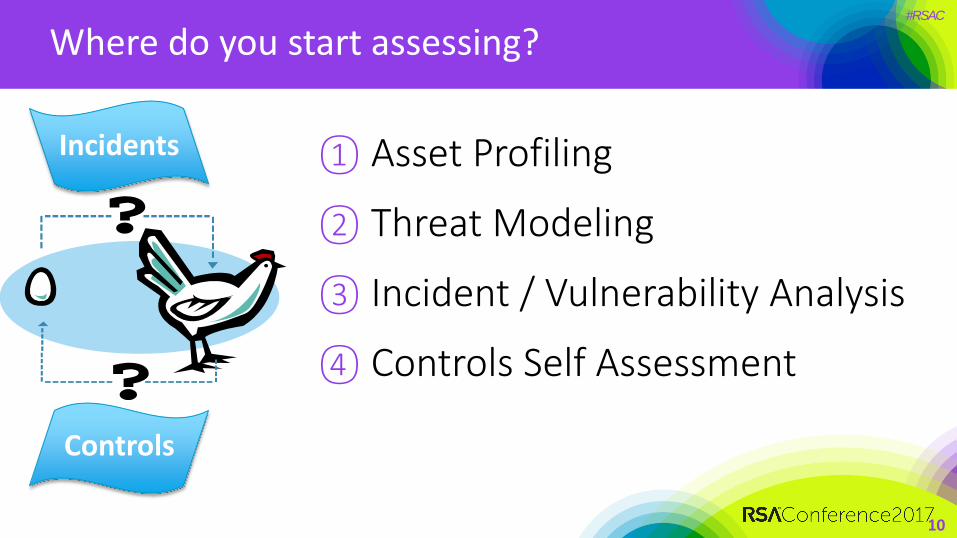
Where do you start assessing?
① Asset Profiling
② Threat Modeling
③ Incident / Vulnerability Analysis
④ Controls Self Assessment
10
Incidents
Controls
#RSAC
Iterative Adoption Approach
11
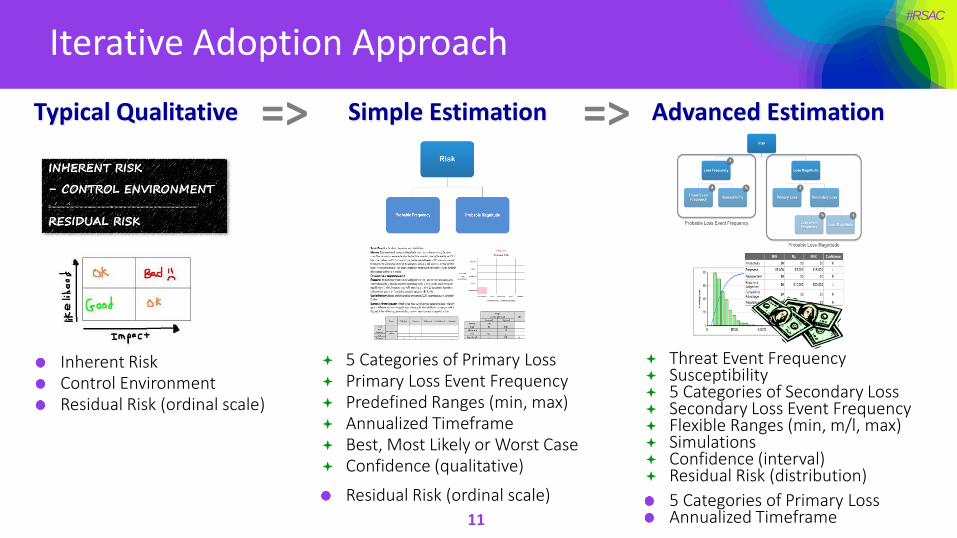
Typical Qualitative Simple Estimation Advanced Estimation=> =>
Inherent RiskControl EnvironmentResidual Risk (ordinal scale)
5 Categories of Primary Loss Primary Loss Event Frequency Predefined Ranges (min, max) Annualized Timeframe Best, Most Likely or Worst Case Confidence (qualitative)
Residual Risk (ordinal scale)
Threat Event Frequency Susceptibility 5 Categories of Secondary Loss Secondary Loss Event Frequency Flexible Ranges (min, m/l, max) Simulations Confidence (interval) Residual Risk (distribution)
5 Categories of Primary LossAnnualized Timeframe
#RSAC
Prep & Scoping
Simple Estimation
12
#RSAC
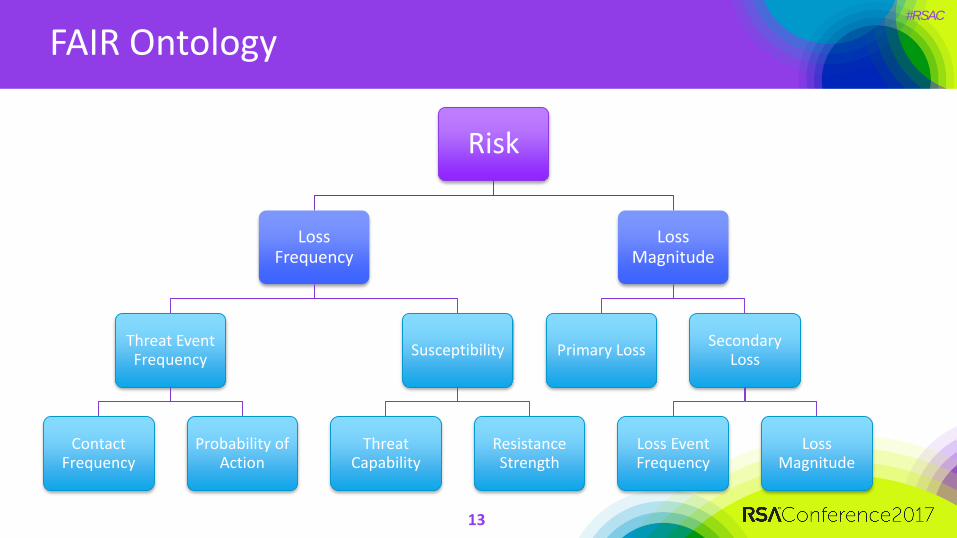
FAIR Ontology
Risk
Loss Frequency
Threat Event Frequency
Contact Frequency
Probability of Action
Susceptibility
Threat Capability
Resistance Strength
Loss Magnitude
Primary LossSecondary
Loss
Loss Event Frequency
Loss Magnitude
13
#RSAC
Risk Model – Basic Factor Analysis
14
Risk
Probable Loss Event Frequency
(#)
Probable Loss Magnitude
($)
Def: the probable
magnitude of loss
resulting from a loss
event
Def: the probable frequency,
within a given timeframe, that
threat agent will inflict harm
upon an asset
Def: the probable frequency
and magnitude of future loss
How much risk is
associated with … ?
#RSAC
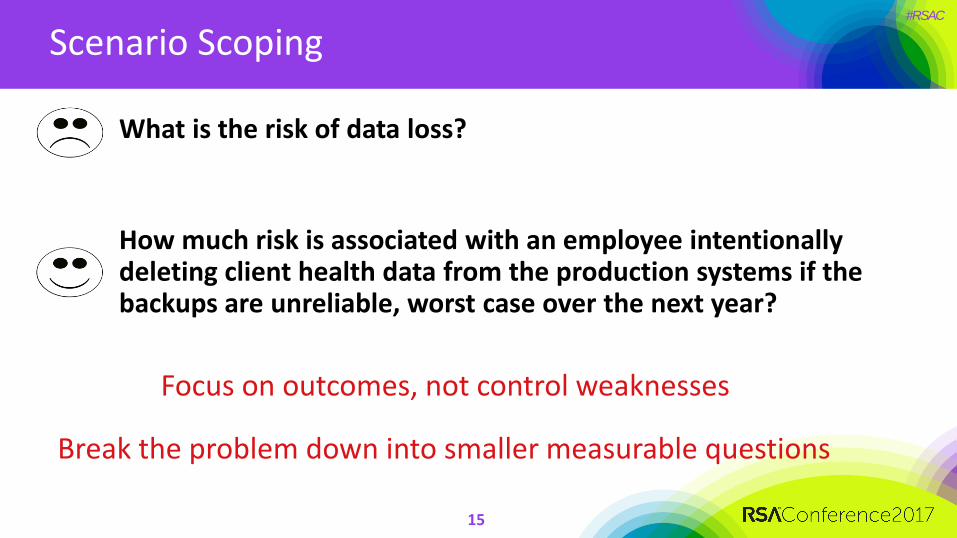
Scenario Scoping
15
What is the risk of data loss?
How much risk is associated with an employee intentionally deleting client health data from the production systems if the backups are unreliable, worst case over the next year?
Focus on outcomes, not control weaknesses
Break the problem down into smaller measurable questions
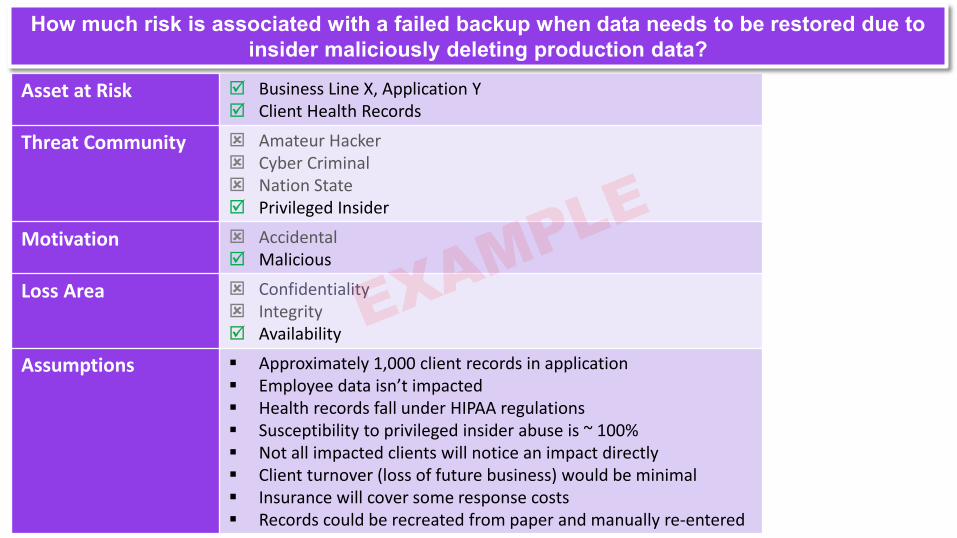
Asset at Risk Business Line X, Application Y Client Health Records
Threat Community Amateur Hacker Cyber Criminal Nation State Privileged Insider
Motivation Accidental Malicious
Loss Area Confidentiality Integrity Availability
Assumptions Approximately 1,000 client records in application Employee data isn’t impacted Health records fall under HIPAA regulations Susceptibility to privileged insider abuse is ~ 100% Not all impacted clients will notice an impact directly Client turnover (loss of future business) would be minimal Insurance will cover some response costs Records could be recreated from paper and manually re-entered
How much risk is associated with a failed backup when data needs to be restored due to
insider maliciously deleting production data?
#RSAC
Measurement & Analysis
Simple Estimation
#RSAC
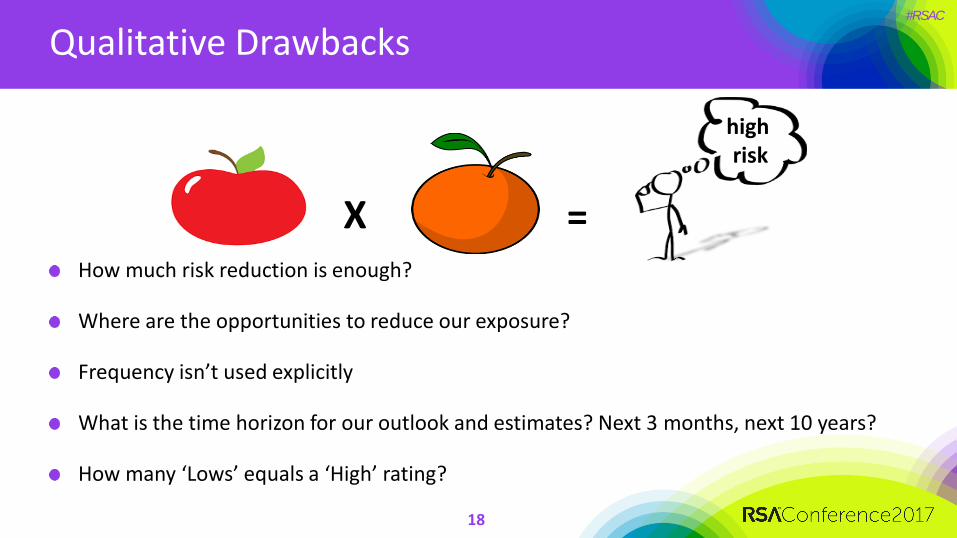
Qualitative Drawbacks
18
How much risk reduction is enough?
Where are the opportunities to reduce our exposure?
Frequency isn’t used explicitly
What is the time horizon for our outlook and estimates? Next 3 months, next 10 years?
How many ‘Lows’ equals a ‘High’ rating?
X =
high risk
#RSAC
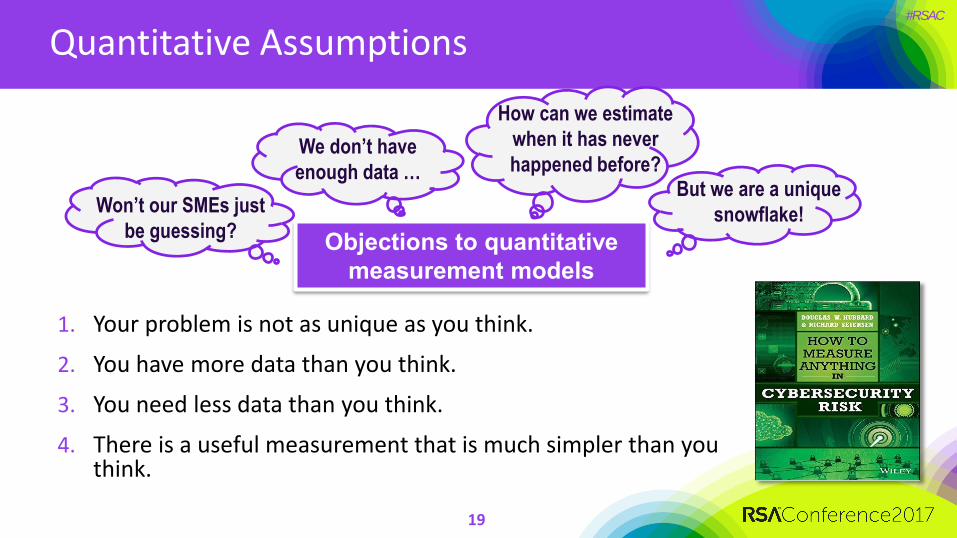
Quantitative Assumptions
19
1. Your problem is not as unique as you think.
2. You have more data than you think.
3. You need less data than you think.
4. There is a useful measurement that is much simpler than you think.
But we are a unique
snowflake!
We don’t have
enough data …
How can we estimate
when it has never
happened before?
Won’t our SMEs just
be guessing?Objections to quantitative
measurement models
#RSAC
Measuring Risk
20
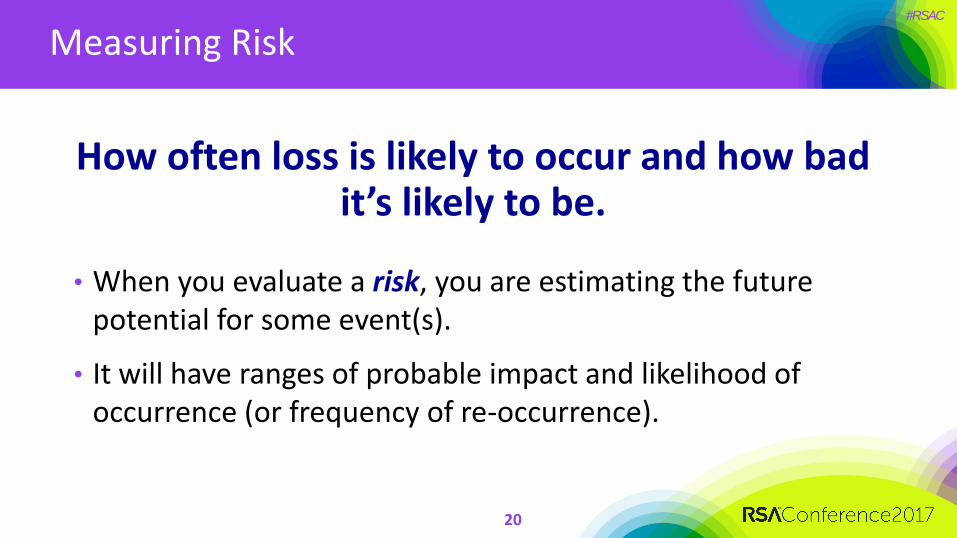
How often loss is likely to occur and how bad it’s likely to be.
• When you evaluate a risk, you are estimating the future potential for some event(s).
• It will have ranges of probable impact and likelihood of occurrence (or frequency of re-occurrence).
#RSAC
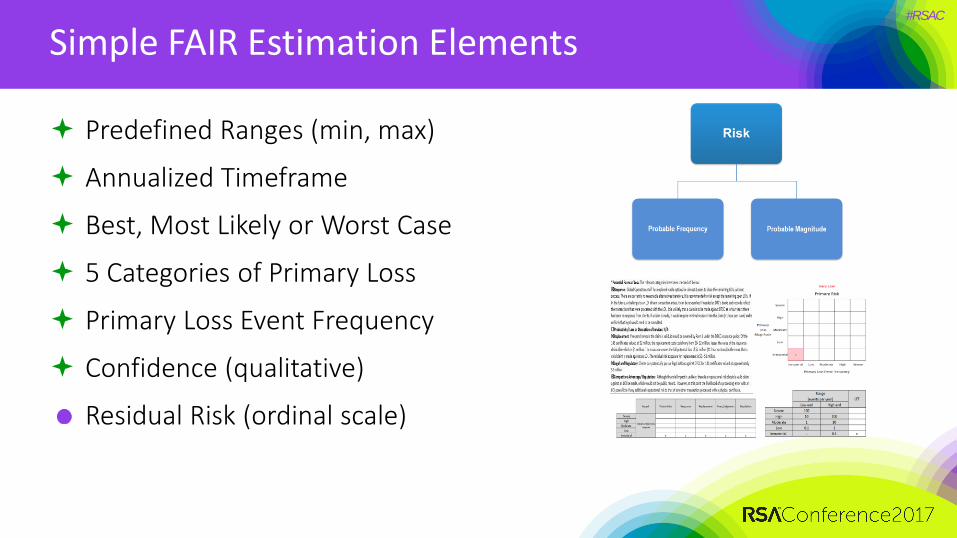
Simple FAIR Estimation Elements
Predefined Ranges (min, max)
Annualized Timeframe
Best, Most Likely or Worst Case
5 Categories of Primary Loss
Primary Loss Event Frequency
Confidence (qualitative)
Residual Risk (ordinal scale)
#RSAC
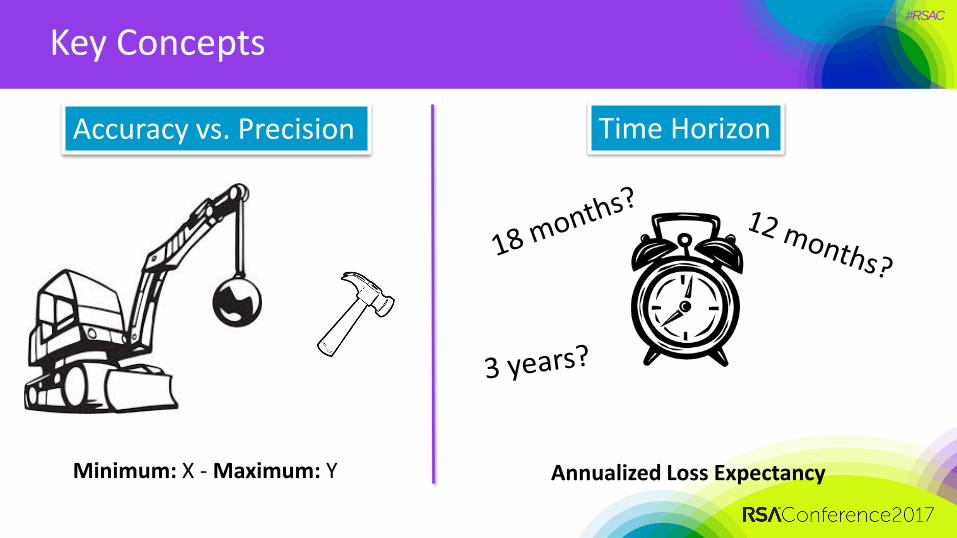
Key Concepts
Accuracy vs. Precision Time Horizon
Minimum: X - Maximum: Y Annualized Loss Expectancy
#RSAC
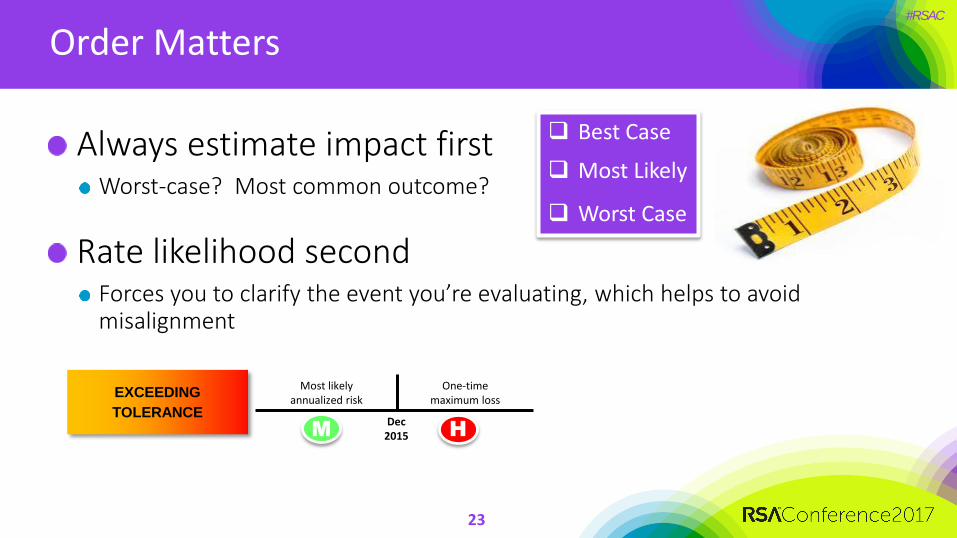
Order Matters
Always estimate impact firstWorst-case? Most common outcome?
Rate likelihood secondForces you to clarify the event you’re evaluating, which helps to avoid misalignment
23
Most likely annualized risk
One-time maximum loss
Dec2015
EXCEEDING
TOLERANCE
M H
Best Case
Most Likely
Worst Case
Probable Loss Magnitude
Loss Event Frequency 2 Residual Risk Exposure3
1
#RSAC
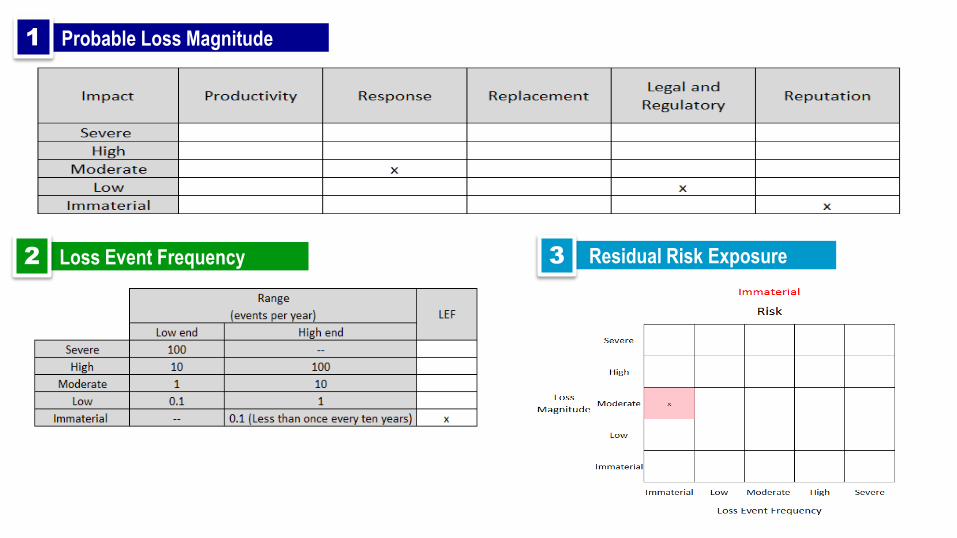
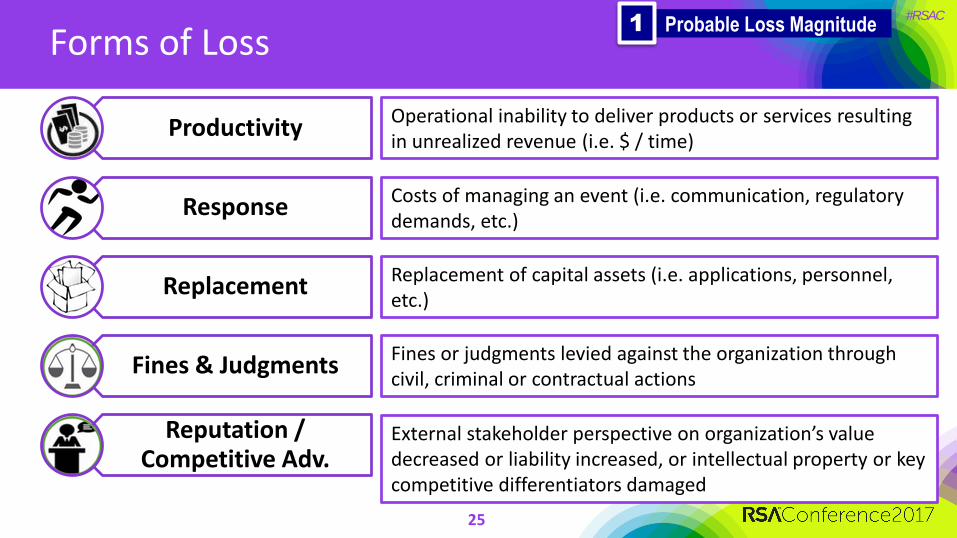
Forms of Loss
Productivity
Response
Replacement
Fines & Judgments
Reputation / Competitive Adv.
Probable Loss Magnitude1
Operational inability to deliver products or services resulting in unrealized revenue (i.e. $ / time)
Costs of managing an event (i.e. communication, regulatory demands, etc.)
Replacement of capital assets (i.e. applications, personnel, etc.)
Fines or judgments levied against the organization through civil, criminal or contractual actions
External stakeholder perspective on organization’s value decreased or liability increased, or intellectual property or key competitive differentiators damaged
25
#RSAC
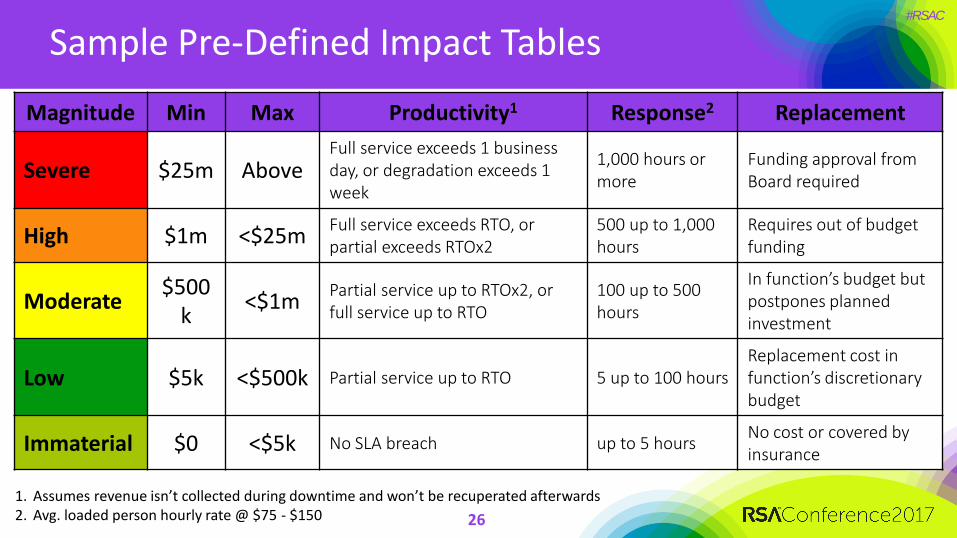
Sample Pre-Defined Impact Tables
Magnitude Min Max Productivity1 Response2 Replacement
Severe $25m AboveFull service exceeds 1 business day, or degradation exceeds 1 week
1,000 hours or more
Funding approval from Board required
High $1m <$25mFull service exceeds RTO, or partial exceeds RTOx2
500 up to 1,000 hours
Requires out of budget funding
Moderate$500
k<$1m
Partial service up to RTOx2, or full service up to RTO
100 up to 500 hours
In function’s budget but postpones planned investment
Low $5k <$500k Partial service up to RTO 5 up to 100 hoursReplacement cost in function’s discretionary budget
Immaterial $0 <$5k No SLA breach up to 5 hoursNo cost or covered by insurance
26
1. Assumes revenue isn’t collected during downtime and won’t be recuperated afterwards2. Avg. loaded person hourly rate @ $75 - $150
#RSAC
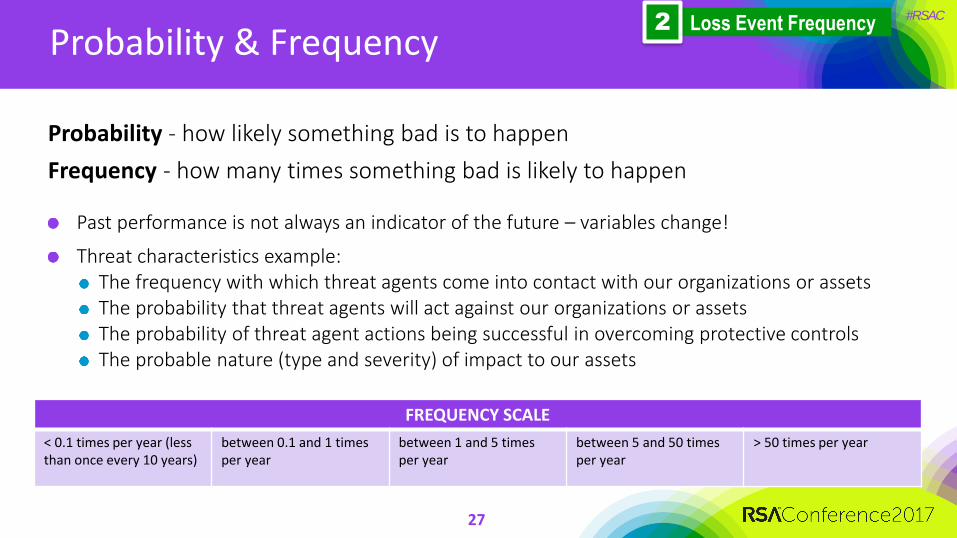
Probability & Frequency
Probability - how likely something bad is to happen
Frequency - how many times something bad is likely to happen
Past performance is not always an indicator of the future – variables change!
Threat characteristics example:The frequency with which threat agents come into contact with our organizations or assetsThe probability that threat agents will act against our organizations or assetsThe probability of threat agent actions being successful in overcoming protective controlsThe probable nature (type and severity) of impact to our assets
27
FREQUENCY SCALE
< 0.1 times per year (less than once every 10 years)
between 0.1 and 1 times per year
between 1 and 5 times per year
between 5 and 50 times per year
> 50 times per year
Loss Event Frequency 2
#RSAC
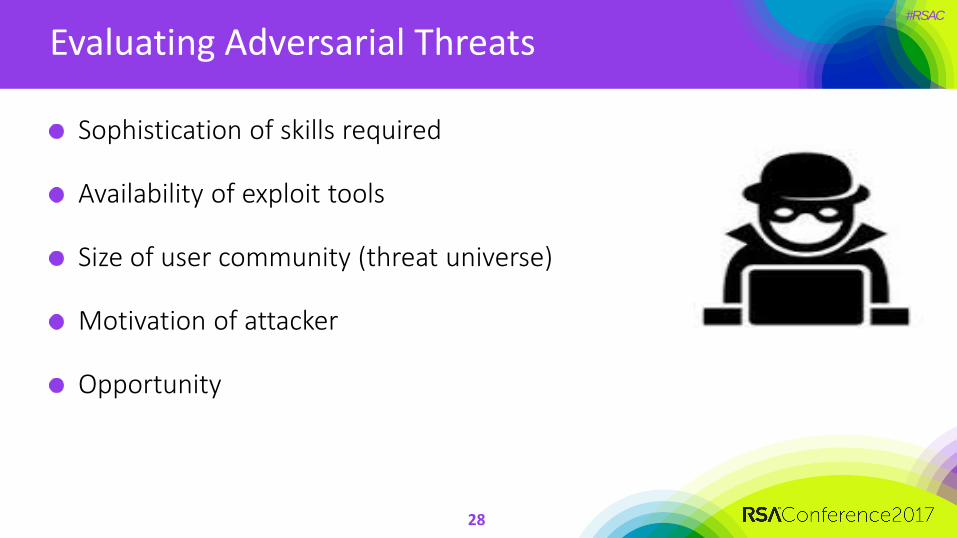
Evaluating Adversarial Threats
Sophistication of skills required
Availability of exploit tools
Size of user community (threat universe)
Motivation of attacker
Opportunity
28
#RSAC
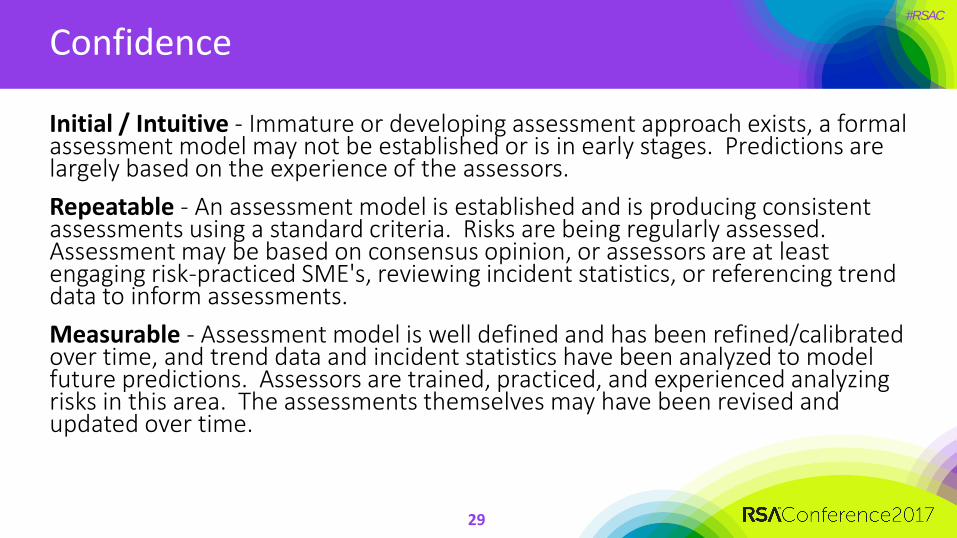
Confidence
Initial / Intuitive - Immature or developing assessment approach exists, a formal assessment model may not be established or is in early stages. Predictions are largely based on the experience of the assessors.
Repeatable - An assessment model is established and is producing consistent assessments using a standard criteria. Risks are being regularly assessed. Assessment may be based on consensus opinion, or assessors are at least engaging risk-practiced SME's, reviewing incident statistics, or referencing trend data to inform assessments.
Measurable - Assessment model is well defined and has been refined/calibrated over time, and trend data and incident statistics have been analyzed to model future predictions. Assessors are trained, practiced, and experienced analyzing risks in this area. The assessments themselves may have been revised and updated over time.
29

Probable Loss Magnitude
Loss Event Frequency 2 Residual Risk Exposure3
1
#RSAC
Program Development
31
#RSAC
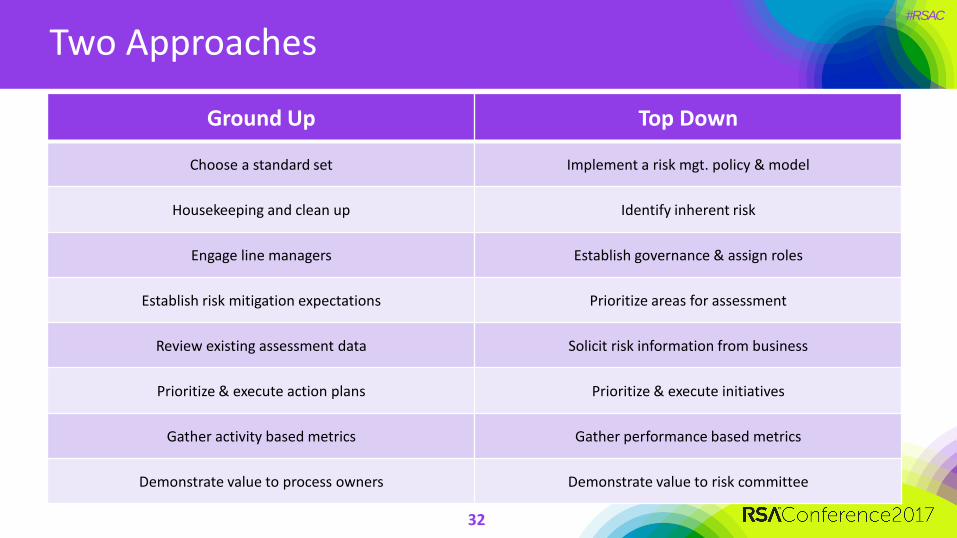
Two Approaches
Ground Up Top Down
Choose a standard set Implement a risk mgt. policy & model
Housekeeping and clean up Identify inherent risk
Engage line managers Establish governance & assign roles
Establish risk mitigation expectations Prioritize areas for assessment
Review existing assessment data Solicit risk information from business
Prioritize & execute action plans Prioritize & execute initiatives
Gather activity based metrics Gather performance based metrics
Demonstrate value to process owners Demonstrate value to risk committee
32
#RSAC
Program Maturity
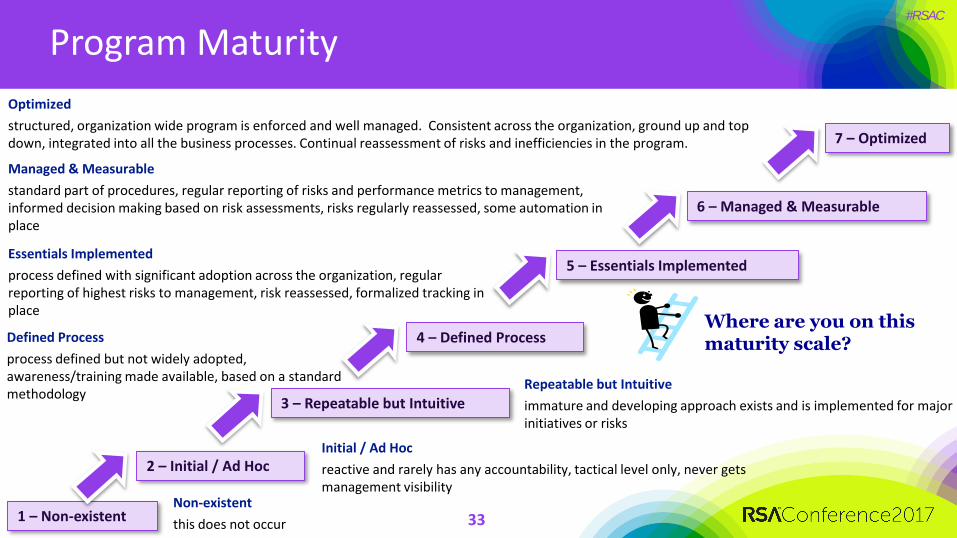
1 – Non-existent
2 – Initial / Ad Hoc
3 – Repeatable but Intuitive
4 – Defined Process
5 – Essentials Implemented
6 – Managed & Measurable
7 – Optimized
Initial / Ad Hoc
reactive and rarely has any accountability, tactical level only, never gets management visibility
Repeatable but Intuitive
immature and developing approach exists and is implemented for major initiatives or risks
Defined Process
process defined but not widely adopted, awareness/training made available, based on a standard methodology
Essentials Implemented
process defined with significant adoption across the organization, regular reporting of highest risks to management, risk reassessed, formalized tracking in place
Managed & Measurable
standard part of procedures, regular reporting of risks and performance metrics to management, informed decision making based on risk assessments, risks regularly reassessed, some automation in place
Optimized
structured, organization wide program is enforced and well managed. Consistent across the organization, ground up and top down, integrated into all the business processes. Continual reassessment of risks and inefficiencies in the program.
Where are you on this maturity scale?
Non-existent
this does not occur 33
#RSAC
Mature Program Elements
Formal risk responsibilities and escalation process documented
Embedded in key processes throughout organization
Performance indicators for the risk program itself
Ensure that the scope and focus of the program is reviewed regularly
Risk training program and outreach
Recognize employees for identifying risks
34
#RSAC
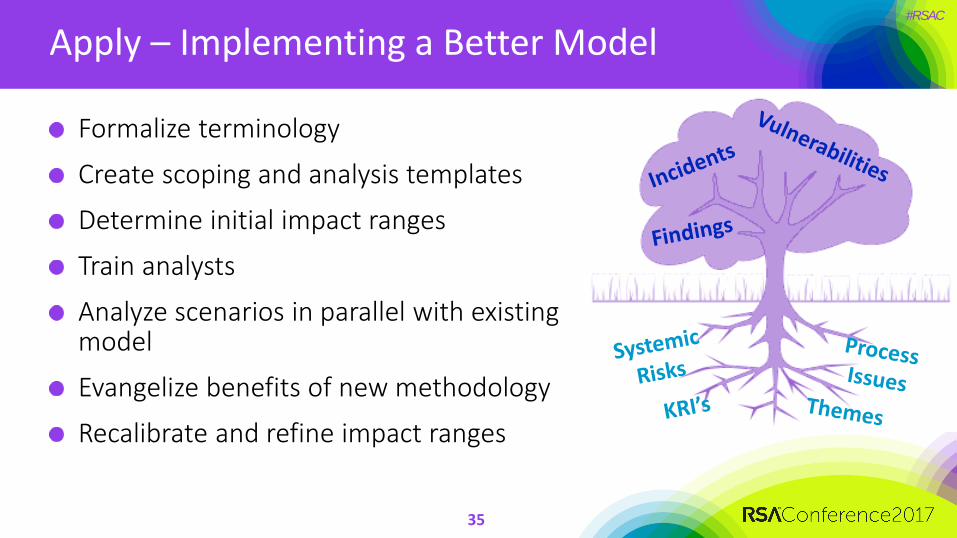
Apply – Implementing a Better Model
35
Formalize terminology
Create scoping and analysis templates
Determine initial impact ranges
Train analysts
Analyze scenarios in parallel with existing model
Evangelize benefits of new methodology
Recalibrate and refine impact ranges
#RSAC
Recommended Reading
36
Security Risk Management: Building an Information Security Risk Management Program from the Ground Up
ISBN: 9781597496155
Amazon Link: http://amzn.to/hyrMvC
Measuring and Managing Information Risk: A FAIR Approach
ISBN: 978-0124202313
Amazon Link: http://amzn.com/0124202314
The content of this presentation does not reflect the views or opinions of MUFG Union Bank.
#RSAC
Appendix - Example Analysis Using FAIRHurricane – Call Center
37
#RSAC
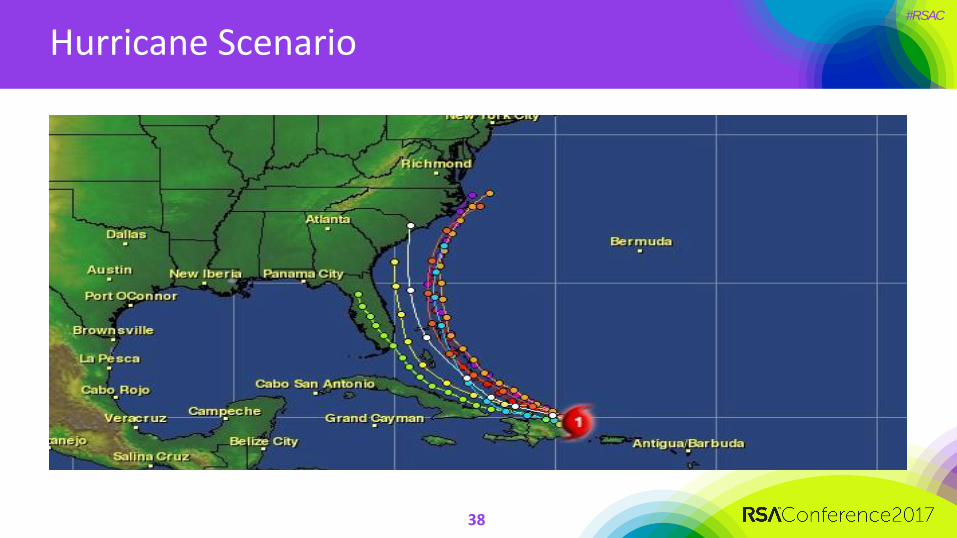
Hurricane Scenario
38
#RSAC
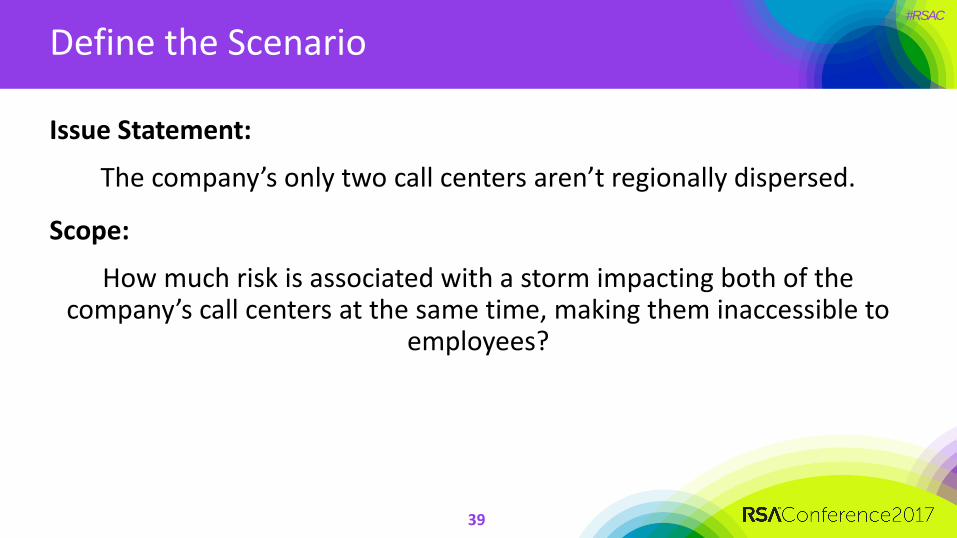
Define the Scenario
Issue Statement:
The company’s only two call centers aren’t regionally dispersed.
Scope:
How much risk is associated with a storm impacting both of the company’s call centers at the same time, making them inaccessible to
employees?
39
#RSAC
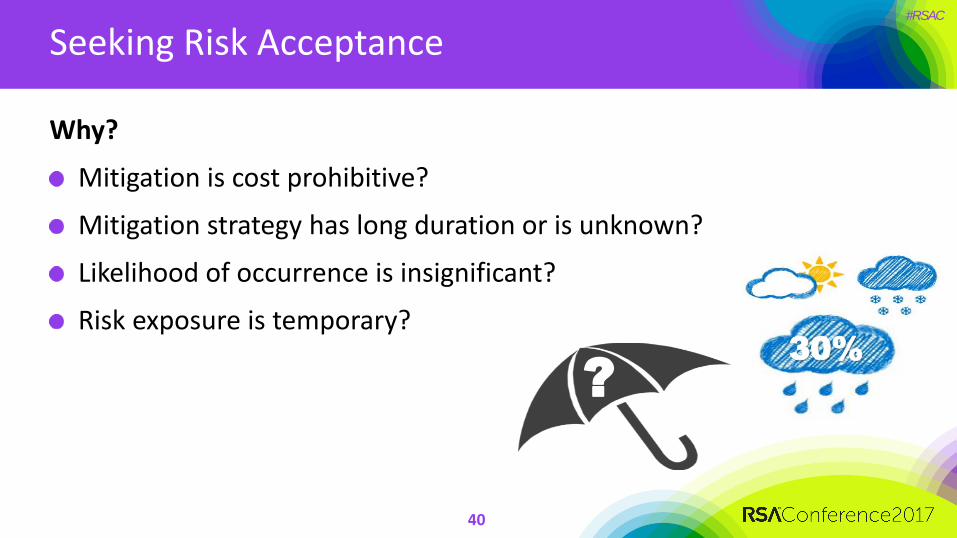
Seeking Risk Acceptance
Why?
Mitigation is cost prohibitive?
Mitigation strategy has long duration or is unknown?
Likelihood of occurrence is insignificant?
Risk exposure is temporary?
40
?
30%
#RSAC
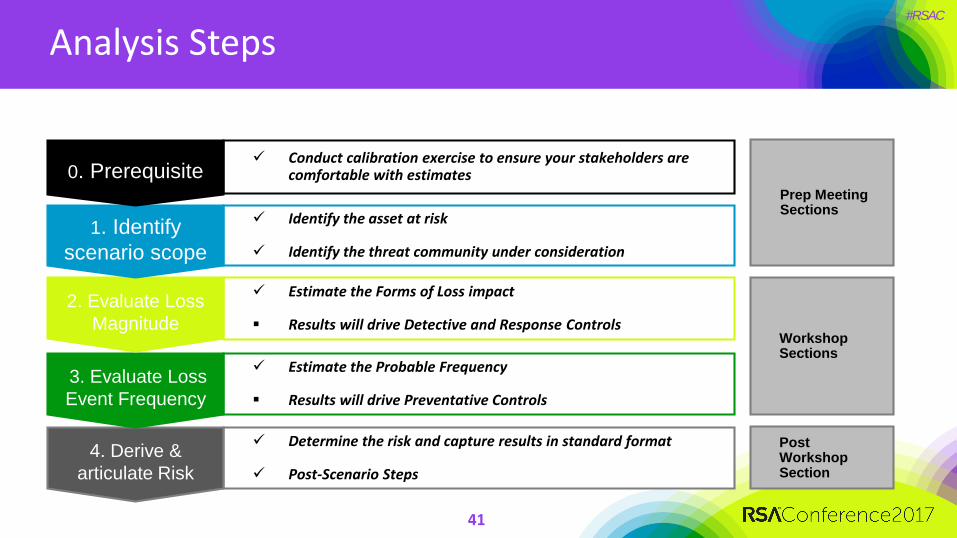
Analysis Steps
Estimate the Forms of Loss impact
Results will drive Detective and Response Controls
Identify the asset at risk
Identify the threat community under consideration
Determine the risk and capture results in standard format
Post-Scenario Steps
Estimate the Probable Frequency
Results will drive Preventative Controls
Conduct calibration exercise to ensure your stakeholders are comfortable with estimates
Workshop Sections
Post Workshop Section
Prep Meeting Sections
4. Derive &
articulate Risk
3. Evaluate Loss
Event Frequency
2. Evaluate Loss
Magnitude
1. Identify
scenario scope
0. Prerequisite
41
#RSAC
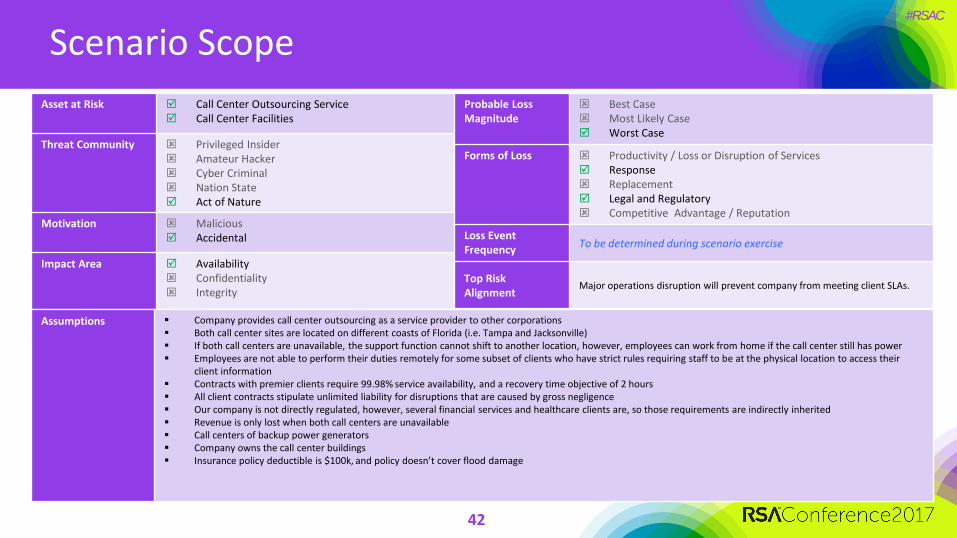
Scenario Scope
Asset at Risk Call Center Outsourcing Service Call Center Facilities
Threat Community Privileged Insider Amateur Hacker Cyber Criminal Nation State Act of Nature
Motivation Malicious Accidental
Impact Area Availability Confidentiality Integrity
Probable Loss Magnitude
Best Case Most Likely Case Worst Case
Forms of Loss Productivity / Loss or Disruption of Services Response Replacement Legal and Regulatory Competitive Advantage / Reputation
Loss Event Frequency
To be determined during scenario exercise
Top Risk Alignment
Major operations disruption will prevent company from meeting client SLAs.
Assumptions Company provides call center outsourcing as a service provider to other corporations Both call center sites are located on different coasts of Florida (i.e. Tampa and Jacksonville) If both call centers are unavailable, the support function cannot shift to another location, however, employees can work from home if the call center still has power Employees are not able to perform their duties remotely for some subset of clients who have strict rules requiring staff to be at the physical location to access their
client information Contracts with premier clients require 99.98% service availability, and a recovery time objective of 2 hours All client contracts stipulate unlimited liability for disruptions that are caused by gross negligence Our company is not directly regulated, however, several financial services and healthcare clients are, so those requirements are indirectly inherited Revenue is only lost when both call centers are unavailable Call centers of backup power generators Company owns the call center buildings Insurance policy deductible is $100k, and policy doesn’t cover flood damage
42
#RSAC
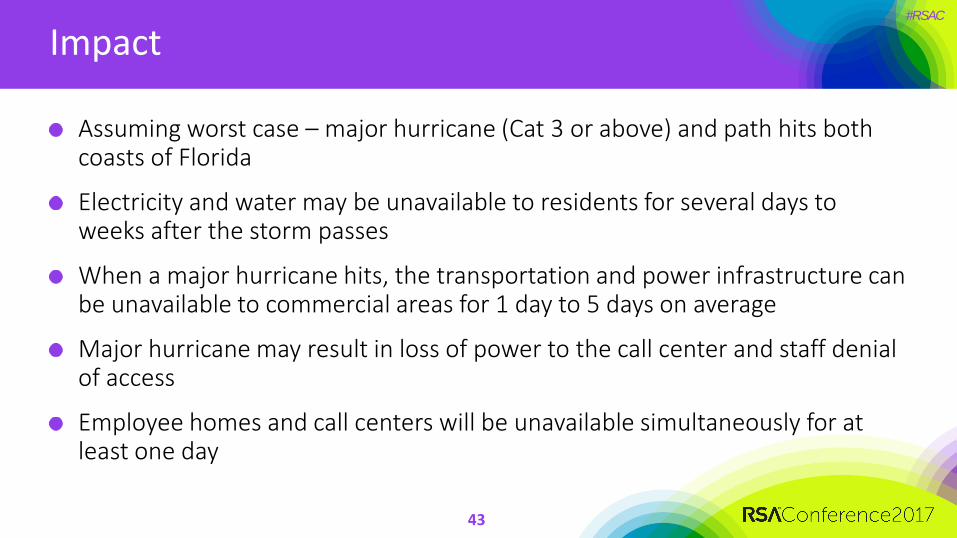
Impact
Assuming worst case – major hurricane (Cat 3 or above) and path hits both coasts of Florida
Electricity and water may be unavailable to residents for several days to weeks after the storm passes
When a major hurricane hits, the transportation and power infrastructure can be unavailable to commercial areas for 1 day to 5 days on average
Major hurricane may result in loss of power to the call center and staff denial of access
Employee homes and call centers will be unavailable simultaneously for at least one day
43
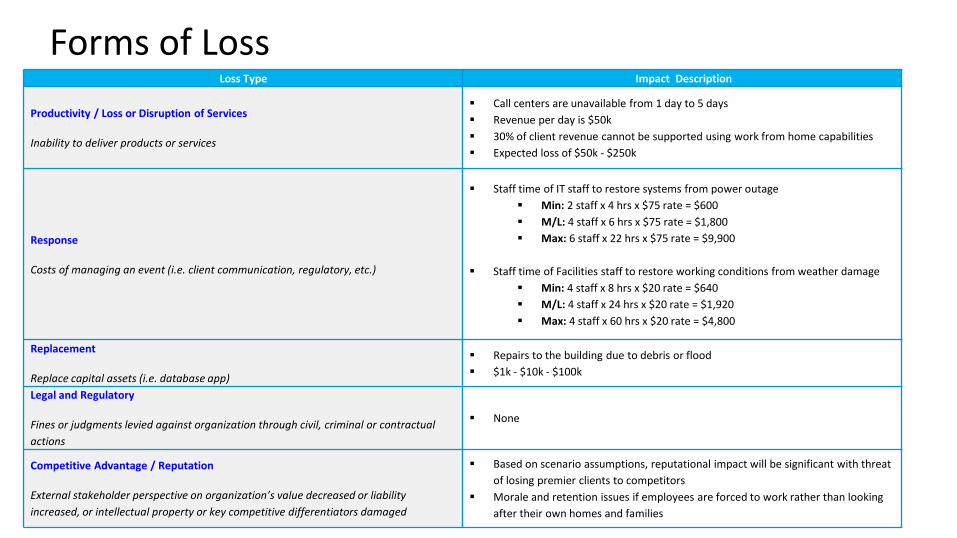
Forms of Loss
44
Loss Type Impact Description
Productivity / Loss or Disruption of Services
Inability to deliver products or services
Call centers are unavailable from 1 day to 5 days
Revenue per day is $50k
30% of client revenue cannot be supported using work from home capabilities
Expected loss of $50k - $250k
Response
Costs of managing an event (i.e. client communication, regulatory, etc.)
Staff time of IT staff to restore systems from power outage
Min: 2 staff x 4 hrs x $75 rate = $600
M/L: 4 staff x 6 hrs x $75 rate = $1,800
Max: 6 staff x 22 hrs x $75 rate = $9,900
Staff time of Facilities staff to restore working conditions from weather damage
Min: 4 staff x 8 hrs x $20 rate = $640
M/L: 4 staff x 24 hrs x $20 rate = $1,920
Max: 4 staff x 60 hrs x $20 rate = $4,800
Replacement
Replace capital assets (i.e. database app)
Repairs to the building due to debris or flood
$1k - $10k - $100k
Legal and Regulatory
Fines or judgments levied against organization through civil, criminal or contractual
actions
None
Competitive Advantage / Reputation
External stakeholder perspective on organization’s value decreased or liability
increased, or intellectual property or key competitive differentiators damaged
Based on scenario assumptions, reputational impact will be significant with threat
of losing premier clients to competitors
Morale and retention issues if employees are forced to work rather than looking
after their own homes and families
#RSAC
Frequency Data
45
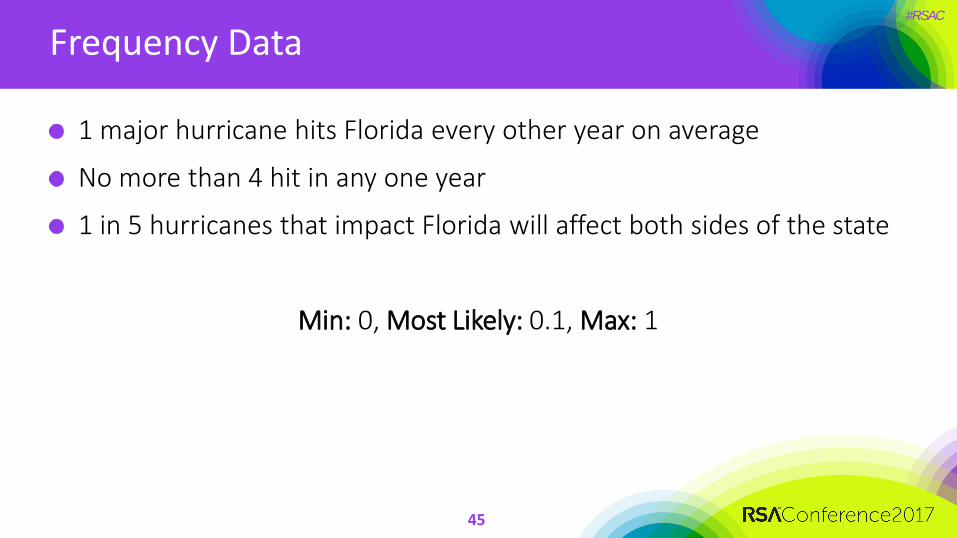
1 major hurricane hits Florida every other year on average
No more than 4 hit in any one year
1 in 5 hurricanes that impact Florida will affect both sides of the state
Min: 0, Most Likely: 0.1, Max: 1
#RSAC
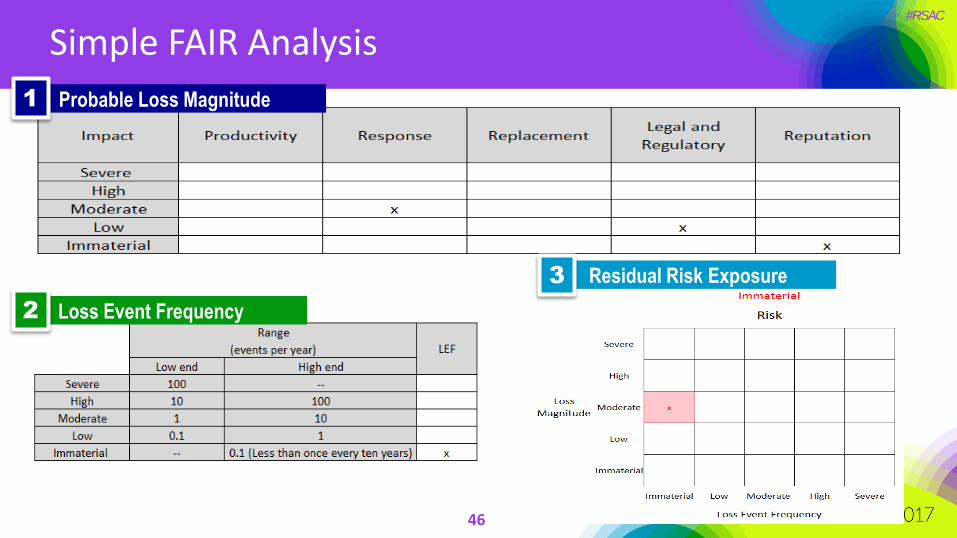
Simple FAIR Analysis
1 in 7 hurricanes that impact Florida will affect both sides of the state
46
Probable Loss Magnitude
Loss Event Frequency 2
Residual Risk Exposure3
1
#RSAC
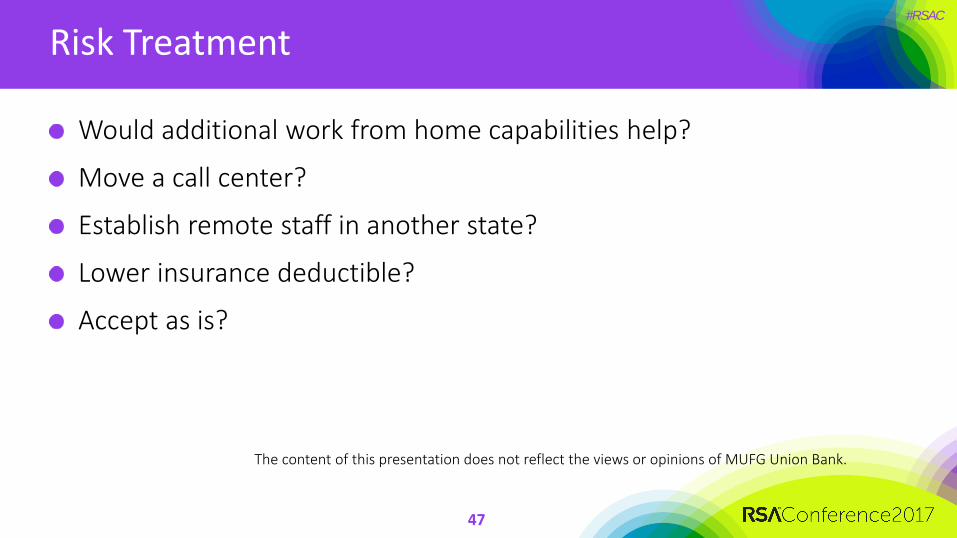
Risk Treatment
Would additional work from home capabilities help?
Move a call center?
Establish remote staff in another state?
Lower insurance deductible?
Accept as is?
47
The content of this presentation does not reflect the views or opinions of MUFG Union Bank.