Embed Size (px)
Citation preview
BRCM COLLEGE OF
ENGINEERING & TECHNOLOGY Practical Experiment Instructions Sheet
Lab
Manual
Exp. Title FLUID MECHANICS- I LAB Syllabus
FM-I Lab Semester-4th
Page No. 1 of 1
Internal Marks: 25 L T P
External Marks: 25 0 0 2
Total Marks: 50
1. To determine the met centric height of a floating body
2. To Verify Bernoullis Theorem
3. To Determine The Discharge Coefficient For Orifice Meter
4. To Determine The Coefficient Of Discharge For A Vee-Notch Or Rectangular Notch
5. To Find Critical Reynolds Number For a Pipe Flow
6. To Determine The Discharge Coefficient For Venturi Meter Meter
7. To Determine The Friction Factor For The Pipes.
8. To Determine The Minor Losses Due To Sudden Enlargement, Sudden Contraction And
Bends.
9. To determine the coefficient of discharge, contraction & velocity of an orifice.
10. To determine the coefficient of impact for vanes.

BRCM COLLEGE OF
ENGINEERING & TECHNOLOGY
BAHAL, BHIWANI Practical Experiment Instructions Sheet
Lab
Manual
Exp. Title To Determine The Metacentric Height Of A Floating Body EXP. NO. 1
FM-I Lab Semester-4th
Page No. 1 of
4
Theory
A body floating in a fluid is subjected to the following system of forces:
1.The downward force of gravity acting on each particle that goes to make up the weight of
body, We acting through centre of gravity G.
2.The upward buoyant force of the fluid acting on the various elements of the
submerged surface of the floating body FB, acting through centre of buoyancy B
For a body to be in equilibrium on the liquid surface, the two forces Wc and Fn must lie in the
same vertical line i.e. these two forces must be collinear, equal and opposite.
When the vessel has been tilted through an angle , the centre of gravity C of the body G,
is usually remains unchanged in its position, but B i.e. centre of buoyancy will generally change
its position, thus Wc and FB forms a couple. The line of action of FB in the new position cuts the
axis of the body at M, which is called the metacentre and the distance CM is called the
metacentric height. The metacentric height is a measure of the static stability of the floating
bodies. The metacentric height can be obtained by equating righting couple and applied moment
where, Wc is the weight of vessel, Wm the weight of unbalanced mass causing moment on the
body, Xd is the distance of the unbalanced mass from the centre of the cross bar.

BRCM COLLEGE OF
ENGINEERING & TECHNOLOGY
BAHAL, BHIWANI Practical Experiment Instructions Sheet
Lab
Manual
Exp. Title To Determine The Metacentric Height Of A Floating Body EXP. NO. 1
FM-I Lab Semester-4th
Page No. 2 of
4
Objective
To determine experimentally the metacentric height of a flat bottomed pontoon.
The experimental set up consists of a pontoon (flat bottomed vessel), which is allowed to float
in a M. S. tank having a transparent side. Removable steel strips are placed in the model for the
purpose of changing the weight of the vessel. By means of a pendulum (consisting of a weight
suspended to a long pointer), the angle of tilt can be measured on a graduated arc, For tilting
the ship model a cross bar with two movable hangers is fixed on the model. Pendulum and
graduated arc are suitably fixed at the centre of the cross bar.

BRCM COLLEGE OF
ENGINEERING & TECHNOLOGY
BAHAL, BHIWANI Practical Experiment Instructions Sheet
Lab
Manual
Exp. Title To Determine The Metacentric Height Of A Floating Body EXP. NO. 1
FM-I Lab Semester-4th
Page No. 3 of
4
Suggested Experimental Work:
Step1: Note down the relevant dimensions as area of collecting tank, mass density of water etc.
Step2: Note down the water level in the tank when pontoon is not in the tank.
Step3: Pontoon is allowed to float in the tank. Note down the reading of water level in the tank.
Mass of pontoon can be obtained by the help of Archmidie’s principle.
Step4: Position of unbalanced mass, weight of unbalanced mass and the angle of heel can be
noted down. Calculated the metacentric height of the pontoon.
Step5: The procedure is repeated for other positions and value of unbalanced mass.
Step6: Also the above procedure is repeated while changing the weight of the pontoon by
changing the number of strips in the pontoon.
.
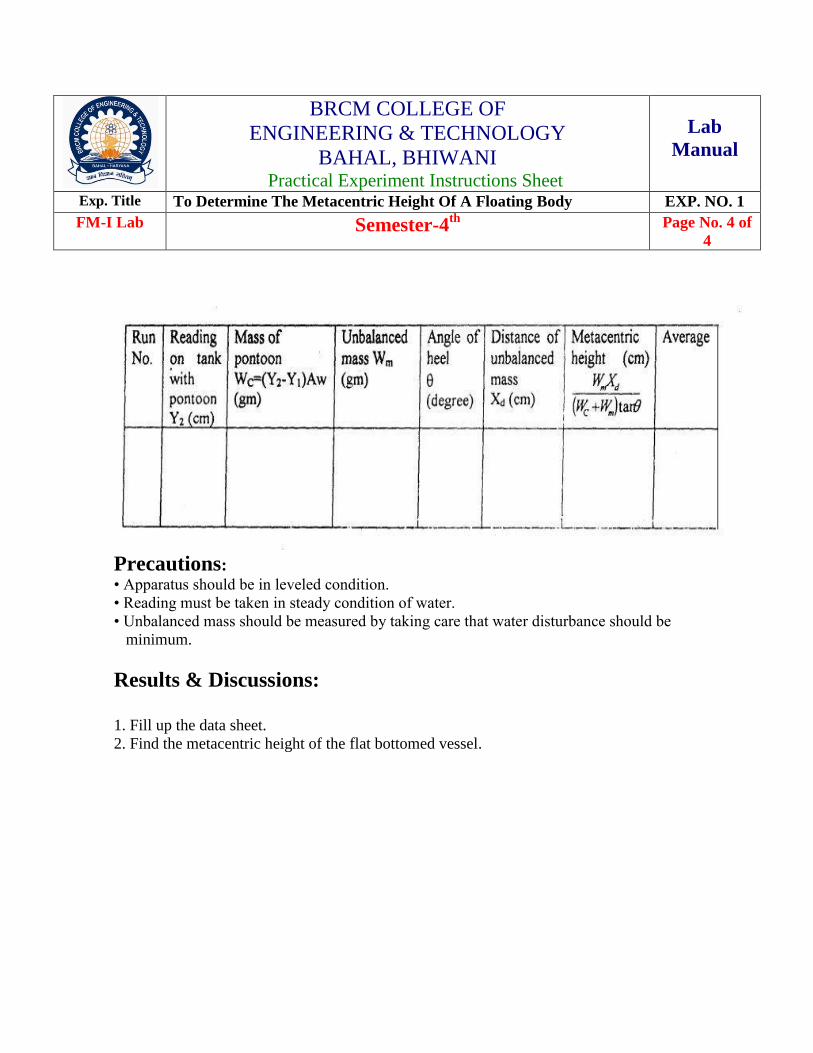
Sample Data Sheet:
Area of tank, A (cm2) =
Water level (without pontoon), Y1 (cm) =
Unit weight of water w =
BRCM COLLEGE OF
ENGINEERING & TECHNOLOGY
BAHAL, BHIWANI Practical Experiment Instructions Sheet
Lab
Manual
Exp. Title To Determine The Metacentric Height Of A Floating Body EXP. NO. 1
FM-I Lab Semester-4th
Page No. 4 of
4
Precautions: • Apparatus should be in leveled condition.
• Reading must be taken in steady condition of water.
• Unbalanced mass should be measured by taking care that water disturbance should be
minimum.
Results & Discussions:
1. Fill up the data sheet.
2. Find the metacentric height of the flat bottomed vessel.

BRCM COLLEGE OF
ENGINEERING & TECHNOLOGY
BAHAL, BHIWANI
Practical Experiment Instructions Sheet
Lab
Manual
Exp. Title To Verify Bernoullis Theorem EXP. NO. 2
FM-I Lab Semester-4th
Page No. 1 of
4
Objective : To verify the Bernoulli’s Theorem Experimentally.
Experimental Set-Up :
The experimental set up consists of a horizontal Perspex duct of smooth variable cross
section of convergent and divergent type. The section is 40mm x 40mm at the entrance and
exit and 40mm x 20mm at middle. The total length of duct is 90 cm. The piezometric
pressure P at the locations of pressure tappings is measured by means of 11 piezometer tubes
installed at an equal distance of 7.5 cm long the length of conduit. The duct is connected with
supply tanks at its entrance and exit end with means of varying the flow rate. A collecting
tank is used to find the actual discharge.
Theory :
Considering friction less flow along a variable area duct the law of conservation of energy
states “for an in viscid incompressible, irrotational and steady flow along a stream line the
total energy (or head) remains the same”. This is called Bernoulli’s equation.

BRCM COLLEGE OF
ENGINEERING & TECHNOLOGY
BAHAL, BHIWANI Practical Experiment Instructions Sheet
Lab
Manual
Exp. Title To Verify Bernoullis Theorem EXP. NO. 2
FM-I Lab Semester-4th
Page No. 2 of
4
The total head of flowing fluid consists of pressure head, velocity head and
elevation head. Hence
P1 + V12
+ Z1 = P2 + V22
+ Z2
2g 2g
Where P, V and Z refer to the pressure, velocity and position of the liquid relative
to some datum at any section.
Suggested Experimental Work :
Step 1: Note down the piezometers distance from inlet section of the Perspex duct.
Step 2: Note down the cross sectional area of Perspex duct at each of the piezometer
tapping points.
Step 3: The datum head is treated as constant through out the duct.
Step 4: By maintaining suitable amount of steady head or near by study head conditions in
the supply tanks there establish a steady non uniform flow in the conduit.
Step 5: The discharge flowing in the conduit is recorded together with the water levels in
each piezometer tubes.
Step 6: This procedure is repeated for other value of discharge.

BRCM COLLEGE OF
ENGINEERING & TECHNOLOGY
BAHAL, BHIWANI Practical Experiment Instructions Sheet
Lab
Manual
Exp. Title To Verify Bernoullis Theorem EXP. NO. 2
FM-I Lab Semester-4th
Page No. 3 of
4
Results And Discussions :
1. If V is the velocity of flow a particular section of the duct and Q is the discharge, then
by continuity equation.
Q
V = ________________
Area of section
2. Calculate velocity head and total head.
3. Plot piezometric head (P/ + Z), velocity head (V2/2g), total head (P/ + Z+V
2/2g) v/s
distance of piezometer tubes from same reference point.
Sample Data Sheet :
Area of collecting tank, cm A = 40 x 40 cm2
Increase in depth of water, cm = 14.5 cm
Time, sec = 15 sec
Discharge, cm3/sec = 40x40x14.5 m
2/s
15
Tube
No.
Distance
from
inlet
section
(cm)
Area of
c/s of
conduit
A
(cm2)
Velocity
of flow
(cm/sec)
V=
(Q/A)
cm/sec
V2/2g
(cm) P/
+ Z
(cm)
P/
+Z+V2/2g
(cm)
1. 7.5 14.67 22.3
2. 15.0 13.33 20.5
3. 22.5 12.0 18.2
4. 30.0 10.67 16.0
5. 37.5 9.33 12.8
6. 45.0 8.0 9.5
7. 52.5 9.33 10.6
8. 60.0 10.67 12.9
9. 67.5 12.0 14.2
10. 75.0 13.33 15.4
11. 82.5 14.67 16.4
BRCM COLLEGE OF
ENGINEERING & TECHNOLOGY
BAHAL, BHIWANI Practical Experiment Instructions Sheet
Lab
Manual
Exp. Title To Verify Bernoullis Theorem EXP. NO. 2
FM-I Lab Semester-4th
Page No. 4 of
4
Comments :
Since the conduit is horizontal, the total energy at any section with reference to the datum
line of the conduit is the sum of P/ and V2/2g (here is the weight density of the fluid and
g is the acceleration due to gravity). One can compare the values of the total energy at
different sections and comment about the constancy of energy in converging and diverging
conduit.
Precautions :
Apparatus should be in leveled condition.
Reading must be taken in steady or near by steady conditions and it should be noted that
water level in the inlet supply tank should reach the overflow condition.
There should not be any air bubble in the piezometer and in the Perspex duct.
By closing the regulating valve, open the control valve slightly such that the water level
in the inlet supply tank reaches the overflow conditions. At this stage check the pressure
head in each piezometer tube is equal. If not adjust the piezometers to bring it equal.

BRCM COLLEGE OF
ENGINEERING & TECHNOLOGY
BAHAL, BHIWANI Practical Experiment Instructions Sheet
Lab
Manual
Exp. Title To Determine The Discharge Coefficient For Orifice Meter EXP. NO. 3
FM-I Lab Semester-4th
Page No. 1 of
4
Theory
Orificemeter are devices used for measurement of rate of flow of fluid through a pipe. The
basic principle on which orificemeter works is that by reducing the cross- sectional area of
flow passage, a pressure difference is created and the measurement of the pressure
difference enables the determination of the discharge through the pipe.
An orificemeter is a cheaper arrangement for measurement of discharge through pipes and
its installation requires a smaller length as compared with other flow. The opening in the
form of orifice is provided at the centre of the plate.
An orifice meter consists of a flat circular plate with a circular hole called orifice with is
concentric with the pipe axis. The upstream face of the plate is be leveled at an angle lying
between 300
and 450. The plate is clamped between the two pipe flanges with be leveled
surface facing downstream. Two pressure tappings are provided one on the upstream side of
plate and other on the downstream side of the orifice plate. The pressure difference exists
between two sections which, can be measured by connecting a differential manometer to the
two pressure taps.
BRCM COLLEGE OF
ENGINEERING & TECHNOLOGY
BAHAL, BHIWANI Practical Experiment Instructions Sheet
Lab
Manual
Exp. Title To Determine The Discharge Coefficient For Orifice Meter EXP. NO. 3
FM-I Lab Semester-4th
Page No. 2 of
4
The discharge coefficient can be calculated using formula.
2
0
2
1
1 2
aa
hgaaCQ
bd
Where Cd is coefficient of orifice, a0 is cross- sectional area of orifice, a1 is cross-sectional
area of pipe, g is the acceleration due to the gravity and z h is the difference of head in terms
of water.
The value of Cd, in general, depends on the shape of the orifice, d/D, location of pressure
tappings (1) and (2), and the Reynolds number, Re Since the first three parameters are fixed
in an experimental set- up in a laboratory, Cd can be said to depend only on the Reynolds
number. The Reynolds number is defined as equal to Vd/v where V is the velocity of flow at
tile orifice (=Q/a). It should also be noted that Cd attains a constant value at higher Reynolds
number (greater than 105).
Experimental Set Up
The experimental set up consists of a circuit through which the water is circulated
continuously. The circuit is having two parallel pipelines of 25 mm diameter. A pipeline is
connected with a venturimeter while other is connected with a orificemeter. Venturimeter
and orificemeter are having a d/D =0.6 and are provided with two pressure tappings one at
upstream and other at downstream side (or throat). An U tube differential manometer is
provided to measure the pressure difference between two sections of venturimeter and
orificemeter. A regulating valve is provided on the downstream side of each pipe to regulate
the flow. A collecting tank is used to find the actual discharge through the circuit.
BRCM COLLEGE OF
ENGINEERING & TECHNOLOGY
BAHAL, BHIWANI Practical Experiment Instructions Sheet
Lab
Manual
Exp. Title To Determine The Discharge Coefficient For Orifice Meter EXP. NO. 3
FM-I Lab Semester-4th
Page No. 3 of
4
Suggested Experimental Work
Step1: Note down the relevant dimension as diameter of the pipe, diameter of
orifice/throat, area of collecting tank, room temperature etc.
Step2: Regulating valve of a pipeline is kept open while for other it is closed.
Measurement Of Flow By Orificemeter
Step8 : Pressure tappings of a orificemeter are kept open while for venturimeter are kept
closed.
Step9 : Open the inlet flow control valve and regulate the valve to allow a steady flow
through the pipe. Check if there is any air bubble in the manometer tube. If so,
remove the same.
Step10: The flow rate was adjusted to its maximum value. By maintaining suitable
amount of steady flow or near by steady flow in the pipe circuit, there establishes
a steady non-uniform flow in the circuit. Time is allowed to stabilize the levels in
the manometer tube.
Step11: The discharge flowing in the circuit is recorded together with the water levels in
left and right limbs of manometer tube.
Stepl2: The flow rate is reduced in stages by means of flow control valve and the
discharge & readings of manometer are recorded for every stage.
Sample Data Sheet
Name of Experiment: Measurement of flow by venturimeter and orificemeter.
Name of the student: Semester Batch Session
Type of flowmeter =
Diameter of pipe line, D, cm =
Cross sectional area of the pipe line, A, cm2
=
Diameter of throat/orifice section, d, mm =
Cross sectional area of the throat/orifice section, a, cm2 =
Area of collecting tank, a’, cm2 =
Temperature of water, °C =
Kinematic viscosity of water,v, m2/sec =

BRCM COLLEGE OF
ENGINEERING & TECHNOLOGY
BAHAL, BHIWANI Practical Experiment Instructions Sheet
Lab
Manual
Exp. Title To Determine The Discharge Coefficient For Orifice Meter EXP. NO. 3
FM-I Lab Semester-4th
Page No. 4 of
4
Run
No. Discharge Measurement Manometer Reading Cd Re =
Initial
(cm)
Final
(cm)
Time
(sec)
Discharge
Q
(cm3
/ sec)
Left limb
h1
(cm)
Right
Limb
h2
(cm)
Diff. Of Head
h = 12.6(h1-h2)
(cm)
Q d a v
Appendix-1: Critical data of experiment
Diameter of pipe line, ID, cm = 2.5
Cross sectional area of the pipe line, A, cm2 = 4.9086
Diameter of throat/orifice section, d, cm = 1.5
Cross sectional area of the throat/orifice section, a, cm2
= 1.767
Results & Discussions
1. Fill up the data sheet.
2. Calculate the discharge, difference of manometer reading and Cd for different sets of
readings for orificemeter.
3. Plot Q v/s Δh on a log graph paper and fit in a straight line for the plotted points. This is
the calibration curve.
4. Plot Cd v/s Re for the observed data.
Precautions
• Remove all entrapped air from two limbs of manometer.
• Maintain constant discharge for one set.
• Take a number of readings to obtain accurate result.

BRCM COLLEGE OF
ENGINEERING & TECHNOLOGY
BAHAL, BHIWANI Practical Experiment Instructions Sheet
Lab
Manual
Exp. Title To Determine The Coefficient Of Discharge For A Vee-Notch Or
Rectangular Notch
EXP. NO. 4
FM-I Lab Semester-4th
Page No. 1 of
4
Objectives : Determination of discharge coefficient of :
900 V-notch
Rectangular notch
Experimental Set Up :
The experimental set up consists of a tank whose inlet section is provided with 2 nos. of
baffles for streamline flow, while at the downstream portion of the tank one can fix a notch of
either rectangular or V-notch. A point gauge is used to measure the head of water over the
model. A collecting tank is used to find the actual discharge through the notch.
Theory :
Different types of models are available to find discharge in an open channel as notch,
venturiflume, weir etc. For calibration of rectangular notch, trapezoidal notch or v notch
some flow is allowed in the flume. Once the flow becomes steady, uniform discharge
coefficients can be determined for any model.
In general, sharp crested notches are preferred where highly accurate discharge
measurements are required. For example in hydraulic laboratories, industry and irrigation pilot
schemes, which do not carry debris and sediments.
Notches are those overflow structures whose length of crest in the direction of flow is
accurately shaped. They may be rectangular, trapezoidal, v notch etc. The V-notch is one of
the most precise discharge measuring device suitable for a wide range of flow. Making the
following assumptions as to the flow behaviour can develop the relationship between
discharge and head over the weir :
a) Upstream of the weir, the flow is uniform and the pressure varies with depth
according to the hydrostatic equation p = pgh
b) The free surface remains horizontal as far as the plane of the weir, and all particles
passing over the weir move horizontally.
c) The pressure through out the sheet of liquid or nappe, which passes over the crest of the
weir, is atmospheric.
d) The effect of viscosity and surface tension are negligible.
e) The velocity in the approach channel is negligible.
A triangular or V notch is having a triangular or V shaped opening provided in its body so that
water is discharged through this opening only. The line which bisects the angle of the notch

should be vertical and at the same distance from both sides of the channel. The discharge
coefficient Cd of a V notch may be determined by applying formula.
BRCM COLLEGE OF
ENGINEERING & TECHNOLOGY
BAHAL, BHIWANI Practical Experiment Instructions Sheet
Lab
Manual
Exp. Title To Determine The Coefficient Of Discharge For A Vee-Notch Or
Rectangular Notch
EXP. NO. 4
FM-I Lab Semester-4th
Page No. 2 of
4
Q
Cd = __________________
8 2gH 5/2
tan /2
15
Where Q is the discharge over a triangular notch, is the apex angle of notch and H is
head over the crest of the notch.
A rectangular notch, symmetrically located in a vertical thin plate, which is placed
perpendicular to sides and bottom of a straight channel, is defined as rectangular sharp crested
weir. The discharge coefficient Cd of a rectangular notch may be determined by applying
formula.
Q
Cd = ______________
2 2g BH 3/2
3
Where Q is the discharge over a rectangular notch, B is the width of notch, H is the head
over the crest of the notch, and g is acceleration due to gravity.
Suggested Experimental Work :
Step 1 : The notch under test was positioned at the end of the tank, in a vertical plane, and
with the sharp edge on the upstream side.
Step 2 : The tank was filled with water up to the crest level and subsequently note down the
crest level of the notch by the help of a point gauge.
Step 3: The flow regulating valve was adjusted to give the maximum possible discharge
without flooding the notch.
Step 4: Conditions were allowed to steady before the rate of discharge and H were taken.
Step 5 : The flow rate is reduced in stages and the readings of discharge and H were taken.
Step 6 : The above procedure is repeated for other type of notch.
Results And Discussions :
1. Note down the apex angle of V notch and width of the Rectangular notch.
2. Calculate the discharge and head over the notch.
3. Find out the coefficient of discharge Cd of each notch.
BRCM COLLEGE OF
ENGINEERING & TECHNOLOGY
BAHAL, BHIWANI Practical Experiment Instructions Sheet
Lab
Manual
Exp. Title To Determine The Coefficient Of Discharge For A Vee-Notch Or
Rectangular Notch
EXP. NO. 4
FM-I Lab Semester-4th
Page No. 3 of
4
Sample Data Sheet :
(a) Triangular or V notch
Apex angle of notch, =
Crest level of V notch , H1, cm =
Area of collecting tank, a, cm2 =
Average Cd =
(b) Rectangular notch
Width of notch, B cm =
Crest level of notch, H1 cm =
Area of collecting tank, a cm2 =
S.No. Discharge Measurement Final
reading
of water
level
above the
notch H2
(cm)
Head over
notch
H = H1-H2
(cm)
Q
Cd = _______________
8 2g H5/2
tan /2
15
Initial
h1
(cm)
Final
h2
(cm)
Time
(sec)
Discharge
Q
(cm3/sec)

BRCM COLLEGE OF
ENGINEERING & TECHNOLOGY
BAHAL, BHIWANI Practical Experiment Instructions Sheet
Lab
Manual
Exp. Title To Determine The Coefficient Of Discharge For A Vee-Notch Or
Rectangular Notch
EXP. NO. 4
FM-I Lab Semester-4th
Page No. 4 of
4
S. No. Discharge Measurement Final
reading
of water
level
above
the
notch
H2 (cm)
Head over
notch
H = H1-H2
(cm)
Q
Cd = _________
2 2g BH3/2
3
Initial
h1 (cm)
Final h2
(cm)
Time
(sec)
Discharg
e Q
(cm3/sec)
Average Cd =
Precautions :
Reading must be taken in steady or near steady conditions.
For the measurement of correct discharge there must not be any leakage near the
notch and take care that notch is not running in overflow conditions.
For measurement of correct head over the notch the point gauge must be installed
little distance away from the crest of the notch.
Discharge must be varied very gradually from a higher value to smaller values.

BRCM COLLEGE OF
ENGINEERING & TECHNOLOGY
BAHAL, BHIWANI Practical Experiment Instructions Sheet
Lab
Manual
Exp. Title To Find Critical Reynolds Number For a Pipe Flow EXP. NO. 5
FM-I Lab Semester-4th
Page No. 1 of 3
Theory :
Depending upon the relative magnitudes of viscous and internal forces, flow can occur in
two different manner viz. Laminar flow and turbulent flow. In laminar flow viscous
effect are more predominant than the internal effects. But when shear and normal stresses
are added with the increase in velocity of flow the flow is turbulent. To identify the
laminar and turbulent ranges of flow a dimensionless parameter is being utilizes which is
a measure of the relative importance of inertial forces and viscous force prevailing in the
flow of a fluid, which is known as Reynolds number. It is equal to the ratio of the inertial
forces to the viscous force per unit volume. This mean that a large value of Reynolds’s
number signifies less viscous effects and vice versa. For determine the different flow
conditions, equipment first used by professor Osborne Reynolds after whose name
Reynold’s number (Re) exists.
The motion is laminar or turbulent according as the value of Re is less than or greater
than a certain value. If a liquid such as water is allowed to flow through a glass tubes, and
if one of the liquid filament is made visible by means of dye, then by watching this
filament we may get insight into the actual behavior of the liquid as it moves along. After
the water in the supply tank has stood for several hours to allow it to come completely to
rest. The outlet valve is slightly opened. The central thread of dye carried along by the
slow stream of water in the glass tube is seen to be nearly as steady and well defined as
the indicating column in an alcohol thermometer. But when, as a result of further opening
of the valve, the water velocity passes a specific limit, a change occurs, the rigid thread of
dye begins to break up and to group momentarily ill-defined. The moment the dye
deviates from its straight line pattern corresponds to the condition when the flow in the
conduit is no longer in laminar conditions. The discharge, Q flowing in the conduit at this
moment is measured and the Reynolds number = 4Q
dv
(in which d is the diameter of the conduit and is the kinematics viscosity of water) is
computed. This is the lower critical Reynolds number. Finally, at high velocities the dye
mixes completely with the water and the colored mixture fills the tube.
BRCM COLLEGE OF
ENGINEERING & TECHNOLOGY
BAHAL, BHIWANI Practical Experiment Instructions Sheet
Lab
Manual
Exp. Title To Find Critical Reynolds Number For a Pipe Flow EXP. NO. 5
FM-I Lab Semester-4th
Page No. 2 of 3
Objectives :
1. To study different flow conditions.
2. To obtain the Reynolds number in different flow conditions.
Experimental Set Up :
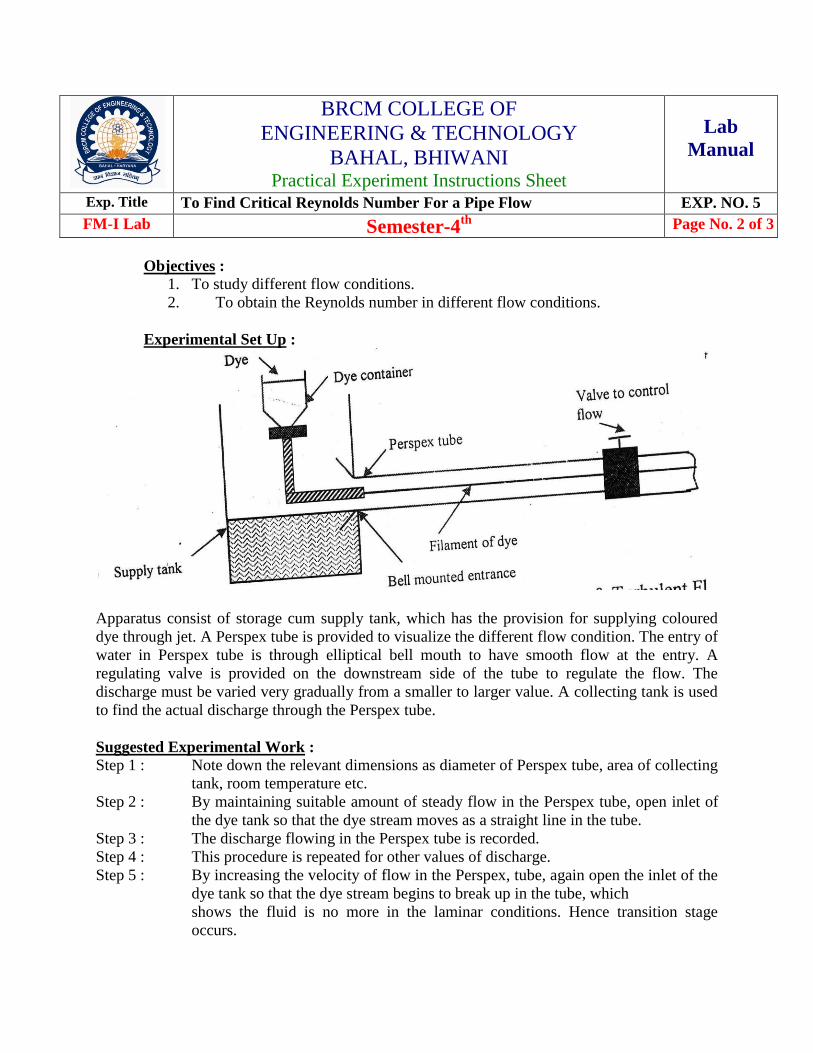
Apparatus consist of storage cum supply tank, which has the provision for supplying coloured
dye through jet. A Perspex tube is provided to visualize the different flow condition. The entry of
water in Perspex tube is through elliptical bell mouth to have smooth flow at the entry. A
regulating valve is provided on the downstream side of the tube to regulate the flow. The
discharge must be varied very gradually from a smaller to larger value. A collecting tank is used
to find the actual discharge through the Perspex tube.
Suggested Experimental Work :
Step 1 : Note down the relevant dimensions as diameter of Perspex tube, area of collecting
tank, room temperature etc.
Step 2 : By maintaining suitable amount of steady flow in the Perspex tube, open inlet of
the dye tank so that the dye stream moves as a straight line in the tube.
Step 3 : The discharge flowing in the Perspex tube is recorded.
Step 4 : This procedure is repeated for other values of discharge.
Step 5 : By increasing the velocity of flow in the Perspex, tube, again open the inlet of the
dye tank so that the dye stream begins to break up in the tube, which
shows the fluid is no more in the laminar conditions. Hence transition stage
occurs.
BRCM COLLEGE OF
ENGINEERING & TECHNOLOGY
BAHAL, BHIWANI Practical Experiment Instructions Sheet
Lab
Manual
Exp. Title To Find Critical Reynolds Number For a Pipe Flow EXP. NO. 5
FM-I Lab Semester-4th
Page No. 3 of 3
Step 6 : The discharge flowing in the Perspex tube is recorded.
Step 7 : This procedure is repeated for other values of discharge.
Step 8 : On further increase in the velocity of flow in the Perspex tube, again open the
inlet of dye tank so that the dye mixes completely in the tube which shows fluid is
no more in the transition stage. Hence turbulent flow occurs in the tube.
Step 9 : The discharge flowing in the Perspex tube is recorded.
Step 10 : This procedure is repeated for other values of discharge.
Results And Discussions :
Calculate the discharge in different flow conditions.
Also calculate the Reynolds number for different flow conditions.
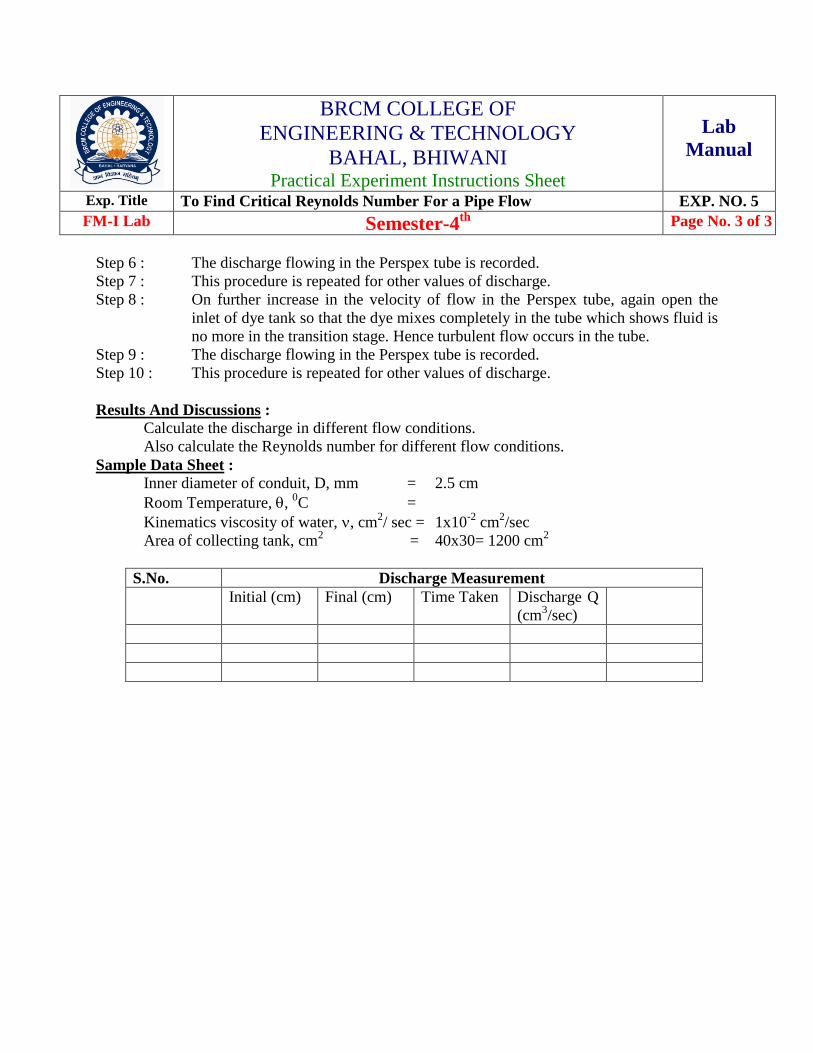
Sample Data Sheet :
Inner diameter of conduit, D, mm = 2.5 cm
Room Temperature, , 0C =
Kinematics viscosity of water, , cm2/ sec = 1x10
-2 cm
2/sec
Area of collecting tank, cm2
= 40x30= 1200 cm2
S.No. Discharge Measurement
Initial (cm) Final (cm) Time Taken Discharge Q
(cm3/sec)

BRCM COLLEGE OF
ENGINEERING & TECHNOLOGY
BAHAL, BHIWANI Practical Experiment Instructions Sheet
Lab
Manual
Exp. Title To Determine The Discharge Coefficient For Venturi Meter Meter EXP. NO. 6
FM-I Lab Semester-4th
Page No. 1 of 4
Theory
Venturimeter are devices used for measurement of rate of flow of fluid through a pipe. The
basic principle on which venturimeter works is that by reducing the cross- sectional area of
flow passage, a pressure difference is created and the measurement of the pressure
difference enables the determination of the discharge through the pipe.
A venturi meter consists of (1) an inlet section followed by a convergent cone, (2) a
cylindrical throat and (3) a gradually divergent cone. Since the cross- sectional area of the
throat is smaller than the cross sectional area of the inlet section, the velocity of flow at the
throat will become greater than that at the inlet section, according to continuity equation.
The increase in the velocity of flow at the throat results in the decrease in the pressure at this
section. A pressure difference is created between the inlet section and throat section which
can be determined by connecting a differential U- tube manometer between the pressure taps
provided at these sections. The measurement of pressure difference between these sections
enables the rate of flow of fluid (Q) to be calculated as
Q = Cd 2)/(1
2
Aa
hga
Where a is the area of cross section of throat, A is the area of cross section of inlet section, g
is the acceleration due to the gravity, Δh is the difference of head in terms of water and Cd is
the coefficient of discharge of venturi meter.

BRCM COLLEGE OF
ENGINEERING & TECHNOLOGY
BAHAL, BHIWANI Practical Experiment Instructions Sheet
Lab
Manual
Exp. Title To Determine The Discharge Coefficient For Venturi Meter EXP. NO. 6
FM-I Lab Semester-4th
Page No. 2 of 4
The coefficient Cd accounts for viscous effects of the flow and depends upon the Reynolds
number, Re (which is equal to V. d/v where, V=Q/a; d is the diameter of throat) and the ratio
d/D. For the given experimental set-up, d/D is fixed. Usually C varies between 0.96 and
0.99 for Reynolds number greater than 105
Experimental Set Up
The experimental set up consists of a circuit through which the water is circulated
continuously. The circuit is having two parallel pipelines of 25 mm diameter. A pipeline is
connected with a venturimeter while other is connected with a orificemeter. Venturimeter
and orificemeter are having a d/D =0.6 and are provided with two pressure tappings one at
upstream and other at downstream side (or throat). An U tube differential manometer is
provided to measure the pressure difference between two sections of venturimeter and
orificemeter. A regulating valve is provided on the downstream side of each pipe to regulate
the flow. A collecting tank is used to find the actual discharge through the circuit.
Suggested Experimental Work
Step1: Note down the relevant dimension as diameter of the pipe, diameter of
orifice/throat, area of collecting tank, room temperature etc.
Step2: Regulating valve of a pipeline is kept open while for other it is closed.
Measurement Of Flow By Venturimeter
Step3: Pressure tappings of a venturimeter are kept open while for orificemeter are kept
closed.
Step4: Open the inlet flow control valve and regulate the valve to allow a steady flow
through the pipe. Check if there is any air bubble in the manometer tube. If so,
remove the same.
Step5: The flow rate was adjusted to its maximum value. By maintaining suitable
amount of steady flow or near by steady flow in the pipe circuit, there establishes
a steady non-uniform flow in the circuit. Time is allowed to stabilize the levels in
the manometer tube.
Step6: The discharge flowing in the circuit is recorded together with the water levels in
left and right limbs of manometer tube.
Step7: The flow rate is reduced in stages by means of flow control valve and the
discharge & readings of manometer are recorded for every stage.

BRCM COLLEGE OF
ENGINEERING & TECHNOLOGY
BAHAL, BHIWANI Practical Experiment Instructions Sheet
Lab
Manual
Exp. Title To Determine The Discharge Coefficient For Venturi Meter EXP. NO. 6
FM-I Lab Semester-4th
Page No. 3 of 4
Suggested Experimental Work
Step1: Note down the relevant dimension as diameter of the pipe, diameter of
orifice/throat, area of collecting tank, room temperature etc.
Step2: Regulating valve of a pipeline is kept open while for other it is closed.
Measurement Of Flow By Venturimeter
Step3: Pressure tappings of a venturimeter are kept open while for orificemeter are kept
closed.
Step4: Open the inlet flow control valve and regulate the valve to allow a steady flow
through the pipe. Check if there is any air bubble in the manometer tube. If so,
remove the same.
Step5: The flow rate was adjusted to its maximum value. By maintaining suitable
amount of steady flow or near by steady flow in the pipe circuit, there establishes
a steady non-uniform flow in the circuit. Time is allowed to stabilize the levels in
the manometer tube.
Step6: The discharge flowing in the circuit is recorded together with the water levels in
left and right limbs of manometer tube.
Step7: The flow rate is reduced in stages by means of flow control valve and the
discharge & readings of manometer are recorded for every stage.
Sample Data Sheet
Name of Experiment: Measurement of flow by venturimeter and orificemeter.
Name of the student: Semester Batch Session
Type of flowmeter =
Diameter of pipe line, D, cm =
Cross sectional area of the pipe line, A, cm2
=
Diameter of throat/orifice section, d, mm =
Cross sectional area of the throat/orifice section, a, cm2 =
Area of collecting tank, a’, cm2 =
Temperature of water, °C =
Kinematic viscosity of water,v, m2/sec

BRCM COLLEGE OF
ENGINEERING & TECHNOLOGY
BAHAL, BHIWANI Practical Experiment Instructions Sheet
Lab
Manual
Exp. Title To Determine The Discharge Coefficient For Venturi Meter EXP. NO. 6
FM-I Lab Semester-4th
Page No. 4 of 4
Run
No. Discharge Measurement Manometer Reading Cd Re =
Initial
(cm)
Final
(cm)
Time
(sec)
Discharge
Q
(cm3
/ sec)
Left limb
h1
(cm)
Right
Limb
h2
(cm)
Diff. Of Head
h = 12.6(h1-h2)
(cm)
Q d a v
Results & Discussions
1. Fill up the data sheet.
2. Calculate the discharge, difference of manometer reading and Cd for different sets of
readings for venturimeter.
3. Plot Q v/s Δh on a log graph paper and fit in a straight line for the plotted points. This is
the calibration curve.
4. Plot Cd v/s Re for the observed data.
Precautions
• Remove all entrapped air from two limbs of manometer.
• Maintain constant discharge for one set.
• Take a number of readings to obtain accurate result.
BRCM COLLEGE OF
ENGINEERING & TECHNOLOGY
BAHAL, BHIWANI Practical Experiment Instructions Sheet
Lab
Manual
Exp. Title To Determine The Friction Factor For The Pipes. EXP. NO. 7
FM-I Lab Semester-4th
Page No. 1 of 3
Theory :
When liquid flows through a pipe under pressure, some head is lost in overcoming the
friction between the pipe wall and flowing fluid. The frictional resistance offered to flow
depends on type of flow. Mostly the flow of fluids in pipes lies in turbulent zone. On the
basis of the experimental observations the laws of fluid friction for turbulent flow are as
under:-
The frictional resistance in the case of turbulent flow is
(i) proportional to (velocity)n where n varies from 1.72 to 2.0.
(ii) independent of pressure
(iii) proportional to density of the flowing fluid.
(iv) slightly affected by variation of temperature of the fluid.
(v) proportional to area of surface in contact.
(vi) dependent on the nature of the surface in contact.
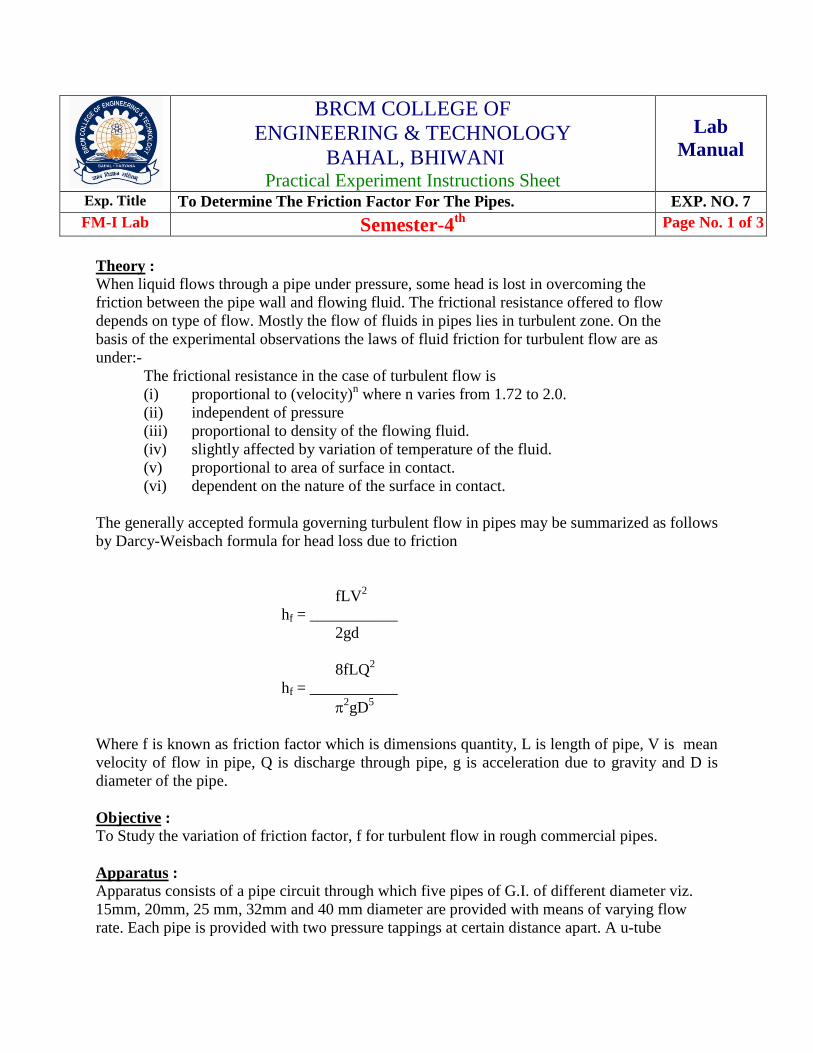
The generally accepted formula governing turbulent flow in pipes may be summarized as follows
by Darcy-Weisbach formula for head loss due to friction
fLV2
hf = ___________
2gd
8fLQ2
hf = ___________
2gD
5
Where f is known as friction factor which is dimensions quantity, L is length of pipe, V is mean
velocity of flow in pipe, Q is discharge through pipe, g is acceleration due to gravity and D is
diameter of the pipe.
Objective :
To Study the variation of friction factor, f for turbulent flow in rough commercial pipes.
Apparatus :
Apparatus consists of a pipe circuit through which five pipes of G.I. of different diameter viz.
15mm, 20mm, 25 mm, 32mm and 40 mm diameter are provided with means of varying flow
rate. Each pipe is provided with two pressure tappings at certain distance apart. A u-tube

BRCM COLLEGE OF
ENGINEERING & TECHNOLOGY
BAHAL, BHIWANI Practical Experiment Instructions Sheet
Lab
Manual
Exp. Title To Determine The Friction Factor For The Pipes. EXP. NO. 7
FM-I Lab Semester-4th
Page No. 2 of 3
differential manometer is provided to find the difference of head between two pressure
tappings. The tappings may be connected to a manometer turn by turn. A collecting tank is
used to find the discharge of water through the pipes.
Suggested Experimental Work :
Step 1 : Note down the relevant dimensions as diameter of the pipe, length of pipe
between the pressure tappings, area of collecting tank etc.
Step 2 : Pressure tappings of a pipe are kept open while for other pipes it is kept closed.
Step 3 : Open the inlet flow control valve and regulate the value to allow a steady flow
through the pipe. Check if there is any air bubble in the manometer tube. If so,
remove the same.
Step 4 : The flow rate was adjusted to its maximum value. By maintaining suitable
amount of steady flow or near by steady flow in the pipe circuit, there establishes
a steady non uniform flow in the circuit. Time is allowed to stabilize the levels in
the manometer tube.
Step 5 : The discharge flowing in the circuit is recorded together with the water levels in
left and right limbs of manometer tube.
Step 6 : The flow rate is reduced in stages by means of flow control valve and the
discharge & readings of manometer are recorded.
Step 7: This procedure is repeated by closing the pressure tappings of this pipe and for
opening of another pipe.
Results & Discussions :
1. Fill up the data sheet.
2. Calculate the discharge, difference of manometer reading and f friction factor for
different pipes for different sets of readings.
3. Find the average friction factor ‘f’.
4. The observation shows that the coefficient f is not a constant but its value depends on the
roughness condition of the pipe surface and the Reynold’s number of the flow.
Sample Data Sheet:
Name of Experiment : To study the variation of friction factor, f for turbulent flow in the
rough commercial pipes.
BRCM COLLEGE OF
ENGINEERING & TECHNOLOGY
BAHAL, BHIWANI Practical Experiment Instructions Sheet
Lab
Manual
Exp. Title To Determine The Friction Factor For The Pipes. EXP. NO. 7
FM-I Lab Semester-4th
Page No. 3 of 3
Name of the student : Semester Batch Session
Diameter of pipe, D, cm =
Length of pipe between two pressure tappings, L, cm
Area of collecting tank, a, cm2
=
Temperature of water, 0C =
Kinematic viscosity of water, , m2/sec =
Material of pipe =
Run
No.
Manometer readings Discharge Measurement
Left
limb
h1
(cm)
Left
limb
h2
(cm)
Difference
of head in
terms of
water hf=
12.6
(h1-h2)
Initial
(cm)
Final
(cm)
Time
(Sec)
Discharge
Q
(cm3/sec)
2gD
5
f = ______ hf
8 LQ2
1.
2.
3.
Precautions :
Apparatus should be in leveled condition.
Reading must be taken in steady or near by steady conditions.
There should not be any air bubble in the manometer.
Discharge must be varied very gradually from a higher to smaller values.
APPROVED BY :-
HOD (M.E. DEPTT.)

BRCM COLLEGE OF
ENGINEERING & TECHNOLOGY
BAHAL, BHIWANI Practical Experiment Instructions Sheet
Lab
Manual
Exp. Title To Determine The Minor Losses Due To Sudden Enlargement,
Sudden Contraction And Bends.
EXP. NO. 8
FM-I Lab Semester-4th
Page No. 1 of
4
Theory :
In long pipes, the major loss of energy in pipe flow is due to friction while the minor losses
are those, which are caused on account of the change in the velocity of flowing fluid (either
in magnitude or direction). Losses due to change in cross- section, bends, valves & fittings of
all types are categorized as minor losses. In short pipes, above losses may sometimes
outweigh the friction losses.
The minor energy head lose hL in terms of the velocity head can be expressed as
V2
hL = k __________
2g
Where, k is loss coefficient, which is practically constant at high Renold’s number for a
particular flow geometry, V is velocity of flow in the pipe and g is acceleration due to gravity.
However , for sudden enlargement of the section, the simultaneous application of continuity ,
Bernoulli’s and momentum equation shows that
(V-V1)2
hL = k __________
2g
Where V and V1 are velocities of flow in the smaller and larger diameter pipes
respectively.
Objective :
To determine the minor head loss coefficient for different pipe fittings.
Experimental Set Up :
The experimental set up consists of a pipe circuit of 25 mm diameter fitted with
following fittings with means of varying flow rate.
Large bend
Sudden enlargement to 50 mm dia
Small bend
Sudden contraction from 50 mm dia to 25 mm dia.
BRCM COLLEGE OF
ENGINEERING & TECHNOLOGY
BAHAL, BHIWANI Practical Experiment Instructions Sheet
Lab
Manual
Exp. Title To Determine The Minor Losses Due To Sudden Enlargement,
Sudden Contraction And Bends.
EXP. NO. 8
FM-I Lab Semester-4th
Page No. 2 of 4
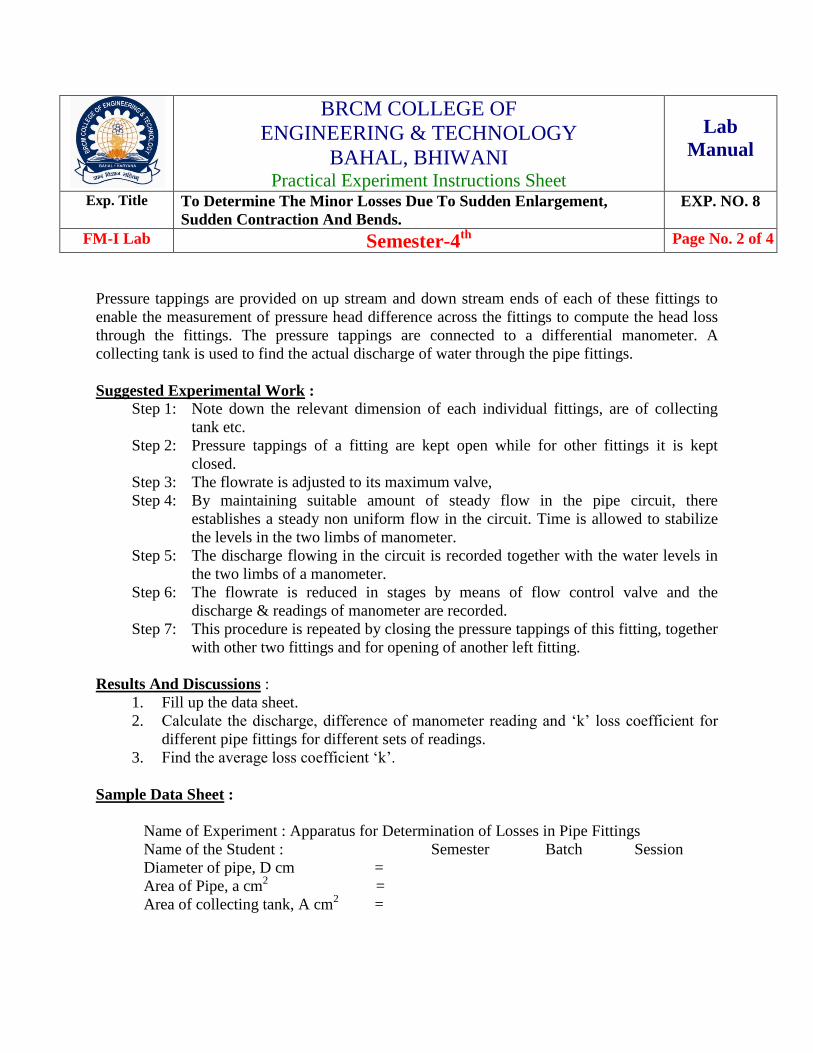
Pressure tappings are provided on up stream and down stream ends of each of these fittings to
enable the measurement of pressure head difference across the fittings to compute the head loss
through the fittings. The pressure tappings are connected to a differential manometer. A
collecting tank is used to find the actual discharge of water through the pipe fittings.
Suggested Experimental Work :
Step 1: Note down the relevant dimension of each individual fittings, are of collecting
tank etc.
Step 2: Pressure tappings of a fitting are kept open while for other fittings it is kept
closed.
Step 3: The flowrate is adjusted to its maximum valve,
Step 4: By maintaining suitable amount of steady flow in the pipe circuit, there
establishes a steady non uniform flow in the circuit. Time is allowed to stabilize
the levels in the two limbs of manometer.
Step 5: The discharge flowing in the circuit is recorded together with the water levels in
the two limbs of a manometer.
Step 6: The flowrate is reduced in stages by means of flow control valve and the
discharge & readings of manometer are recorded.
Step 7: This procedure is repeated by closing the pressure tappings of this fitting, together
with other two fittings and for opening of another left fitting.
Results And Discussions :
1. Fill up the data sheet.
2. Calculate the discharge, difference of manometer reading and ‘k’ loss coefficient for
different pipe fittings for different sets of readings.
3. Find the average loss coefficient ‘k’.
Sample Data Sheet :
Name of Experiment : Apparatus for Determination of Losses in Pipe Fittings
Name of the Student : Semester Batch Session
Diameter of pipe, D cm =
Area of Pipe, a cm2 =
Area of collecting tank, A cm2 =
BRCM COLLEGE OF
ENGINEERING & TECHNOLOGY
BAHAL, BHIWANI Practical Experiment Instructions Sheet
Lab
Manual
Exp. Title To Determine The Minor Losses Due To Sudden Enlargement,
Sudden Contraction And Bends.
EXP. NO. 8
FM-I Lab Semester-4th
Page No. 3 of 4
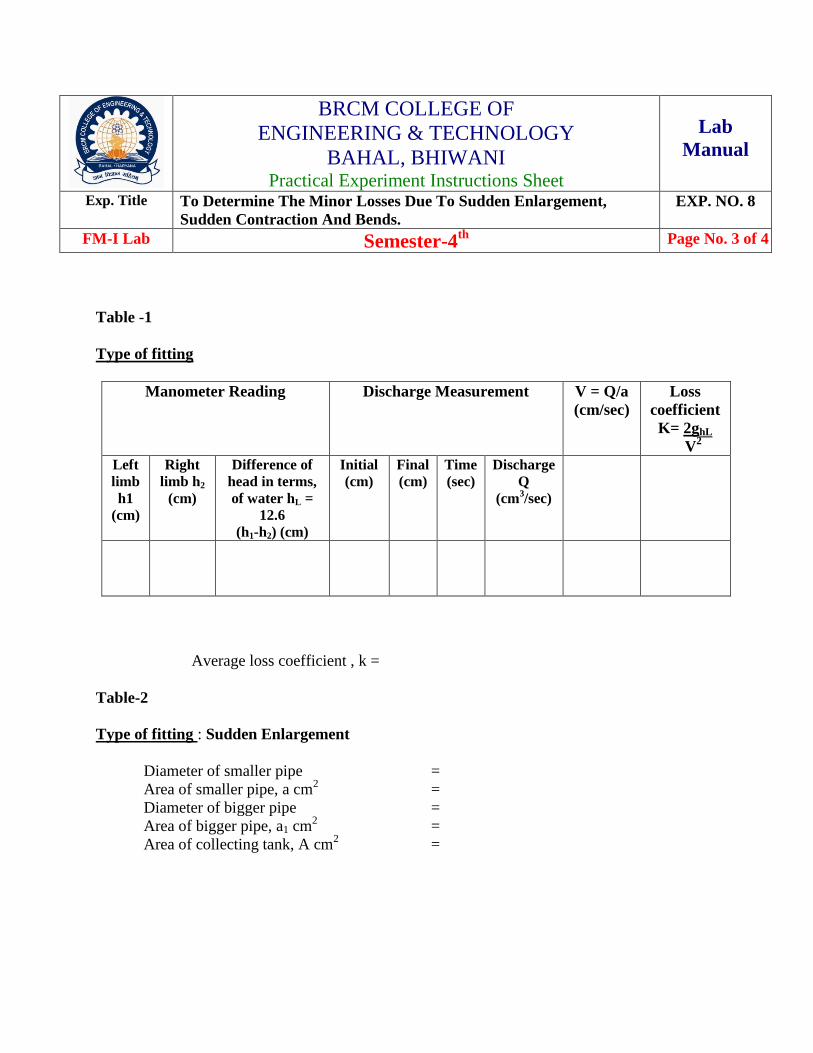
Table -1
Type of fitting
Manometer Reading Discharge Measurement V = Q/a
(cm/sec)
Loss
coefficient
K= 2ghL
V2
Left
limb
h1
(cm)
Right
limb h2 (cm)
Difference of
head in terms,
of water hL =
12.6 (h1-h2) (cm)
Initial
(cm) Final
(cm) Time
(sec) Discharge
Q
(cm3/sec)
Average loss coefficient , k =
Table-2
Type of fitting : Sudden Enlargement
Diameter of smaller pipe =
Area of smaller pipe, a cm2 =
Diameter of bigger pipe =
Area of bigger pipe, a1 cm2
=
Area of collecting tank, A cm2 =
BRCM COLLEGE OF
ENGINEERING & TECHNOLOGY
BAHAL, BHIWANI Practical Experiment Instructions Sheet
Lab
Manual
Exp. Title To Determine The Minor Losses Due To Sudden Enlargement,
Sudden Contraction And Bends.
EXP. NO. 8
FM-I Lab Semester-4th
Page No. 4 of 4
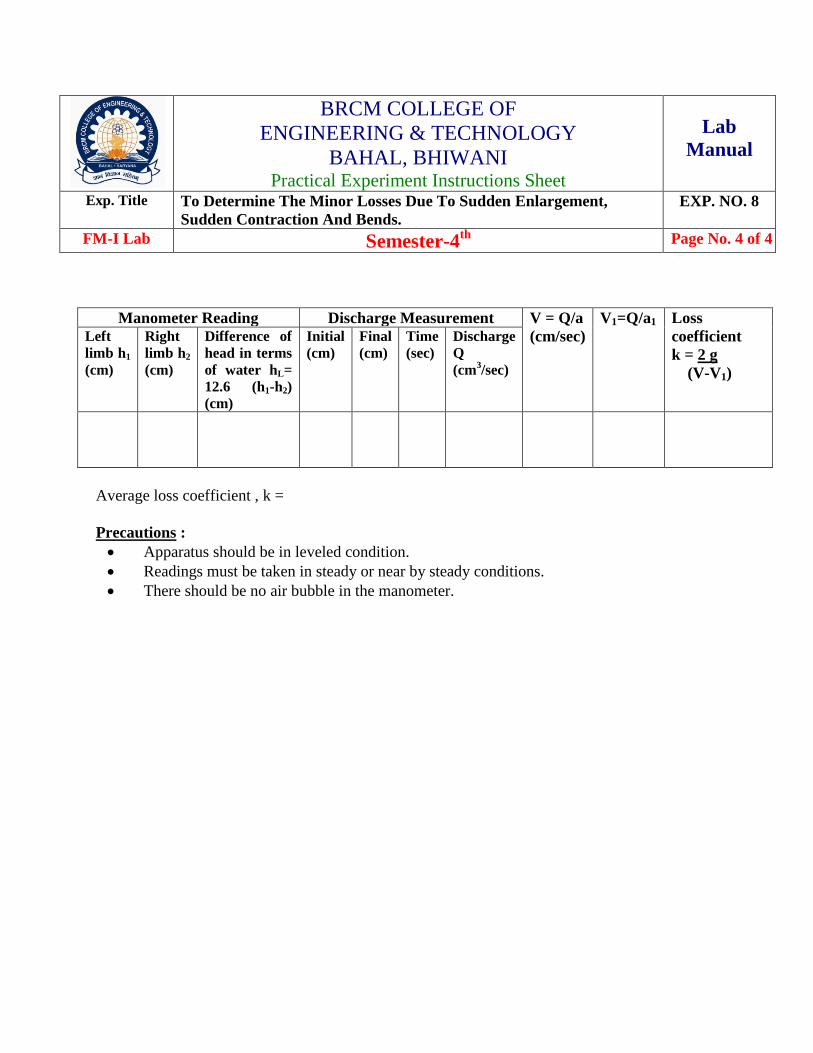
Manometer Reading Discharge Measurement V = Q/a
(cm/sec)
V1=Q/a1 Loss
coefficient
k = 2 g
(V-V1)
Left
limb h1
(cm)
Right
limb h2
(cm)
Difference of
head in terms
of water hL=
12.6 (h1-h2)
(cm)
Initial
(cm) Final
(cm) Time
(sec) Discharge
Q
(cm3/sec)
Average loss coefficient , k =
Precautions :
Apparatus should be in leveled condition.
Readings must be taken in steady or near by steady conditions.
There should be no air bubble in the manometer.

BRCM COLLEGE OF
ENGINEERING & TECHNOLOGY Practical Experiment Instructions Sheet
Lab
Manual
Exp. Title To determine the coefficient of discharge, contraction & velocity of
an orifice.
EXP. NO. 9
FM-I Lab Semester-4th
Page No. 1 of
5
Theory:
An orifice is an opening in the wall of a tank, while a mouthpiece is a short pipe fitted in the
same opening. A mouthpiece will be running full if its length does not exceed two to three times
the diameter Both orifice and mouthpiece are used for discharge measurement. The jet
approaching the orifice continues to converge beyond the orifice till the streamlines becomes
parallel. This section of the jet is then a section of minimum area and is known as vena contracta.
If Vc is the true horizontal velocity at the vena contracta, then the properties of jet trajectory give
the following relationship:
2
2.
2x
v
gy
e
2/12
2
y
gxVc
BRCM COLLEGE OF
ENGINEERING & TECHNOLOGY
BAHAL, BHIWANI Practical Experiment Instructions Sheet
Lab
Manual
Exp. Title To determine the coefficient of discharge, contraction & velocity of an
orifice.
EXP. NO. 9
FM-I Lab Semester-4th
Page No. 2 of 5
The theoretical velocity in the plane of the vena contracta Vo is given by
hg
V
2
2
0
i.e. Vo = (2gh)1/2
Now coefficient velocity C = actual velocity
the critical velocity
yh
xCv
2
In which h is the constant head in the supply tank and x & y are coordinates of jet
with respect to centre of opening.
The actual discharge Q when divided by agh2
yield the coefficient of discharge Cd Here is the
area of cross section of the orifice (or the mouthpiece) and g is the acceleration due to gravity.
Once Cd and Cv are known, the coefficient or contraction Cc can be obtained by dividing Cd
with Cv
Cc = F
d
C
C
The coefficient of discharge can be also be computed by falling head method in which the supply
is kept closed after filling he tank to a suitable level and fall in the head from h1 to h2 in time T is
noted. The coefficient or discharge is then obtained from
2/1
2
2/1
12.
2hh
gaT
ACd
Objective:
To determine the coefficients of discharge Cd velocity Cv and contraction Cc of various types of
orifices and mouth pieces.
Apparatus:
The experimental set up consists of an supply tank with overflow arrangement and gauge glass
tube for water level measurement in the tank, There is also provision for fixing the various

BRCM COLLEGE OF
ENGINEERING & TECHNOLOGY
BAHAL, BHIWANI Practical Experiment Instructions Sheet
Lab
Manual
Exp. Title To determine the coefficient of discharge, contraction & velocity of an
orifice.
EXP. NO. 9
FM-I Lab Semester-4th
Page No. 3 of 5
orifices and mouthpieces (interchangeable) installed in the vertical plane of the tank side. A set
of orifice consisting of 10 mm dia and 15 mm dia orifice is provided with the apparatus. Further
a set of mouth piece is also provided which consists of(i) 10 mm dia x 25 mm length, (ii) 10 mm
dia x 40mm length, (iii) 10 mm x 25 mm x 25 mm long divergent and (iv) 25x 10 x25 mm long
convergent mouthpiece. Arrangement is made such that the water passes only through this
attached opening. Water comes out of the opening in the form of jet.
A horizontal scale on which is mounted a vertical scale with a hook gauge is attached to the
supply tank. Thus hook gauge can be moved horizontally as well as vertically in x and y
direction and its corresponding movement can be read on horizontal and vertical scales
respectively. A collecting tank is used to find the actual discharge of water through the jet.
Suggested Experimental Work:
Step1: Note down the relevant dimensions as area of collecting tank and supply tank.
Step2: Attach a orifice mouthpiece and note down its diameter.
Step3: The water supply was admitted to the supply tank and conditions were allowed to steady
to give a constant head. The lowest point of the orifice mouthpiece is used as the datum
for the measurement of h and y.
Step4: The discharge flowing through the jet is recorded together with the water level in the
supply tank.
Step5: A series of readings of dimensions x and was taken along the trajectory of the jet.
Step6: The above procedure is repeated by means of flow control valve.
Step7: The above procedure is repeated for other types of orifice mouthpiece.

BRCM COLLEGE OF
ENGINEERING & TECHNOLOGY
BAHAL, BHIWANI Practical Experiment Instructions Sheet
Lab
Manual
Exp. Title To determine the coefficient of discharge, contraction & velocity of an
orifice.
EXP. NO. 9
FM-I Lab Semester-4th
Page No. 4 of 5
Results & Discussions:
1. Fill up the data sheet.
2. Calculate the Cd Cv and Cv
Sample Data Sheet:
Name of Experiment: Determination of coefficients of discharge Cd, velocity Cv and
contraction Cc of various types of orifices and mouth piece.
Name of the student: Semester Batch Session
Size & shape of the mouth piece/ orifice =
Area of cross- section of mouth piece Orifice, a, cm2 =
Area of cross section of collecting tank, cm2 =
Area of cross section of supply tank, A, cm2 =
Reading on the piezometer at the level on the centre of mouth piece / orifice h0 =
A. Constant Head Method:
(i) Determination of Cd

BRCM COLLEGE OF
ENGINEERING & TECHNOLOGY
BAHAL, BHIWANI Practical Experiment Instructions Sheet
Lab
Manual
Exp. Title To determine the coefficient of discharge, contraction & velocity of
an orifice.
EXP. NO. 9
FM-I Lab Semester-4th
Page No. 5 of
5
(ii) Determination of Cv
Reading horizontal scale at exit of orifice/ mouthpiece x0 =
Reading vertical scale at exit orifice / mouthpiece y0 =
Average Cv =
Therefore, Cc = Cd= Cv
B. Falling Head Method:
Reading on the piezometer at the level on the centre of mouth piece/ orifice h0 =
ga
Ak
2
2
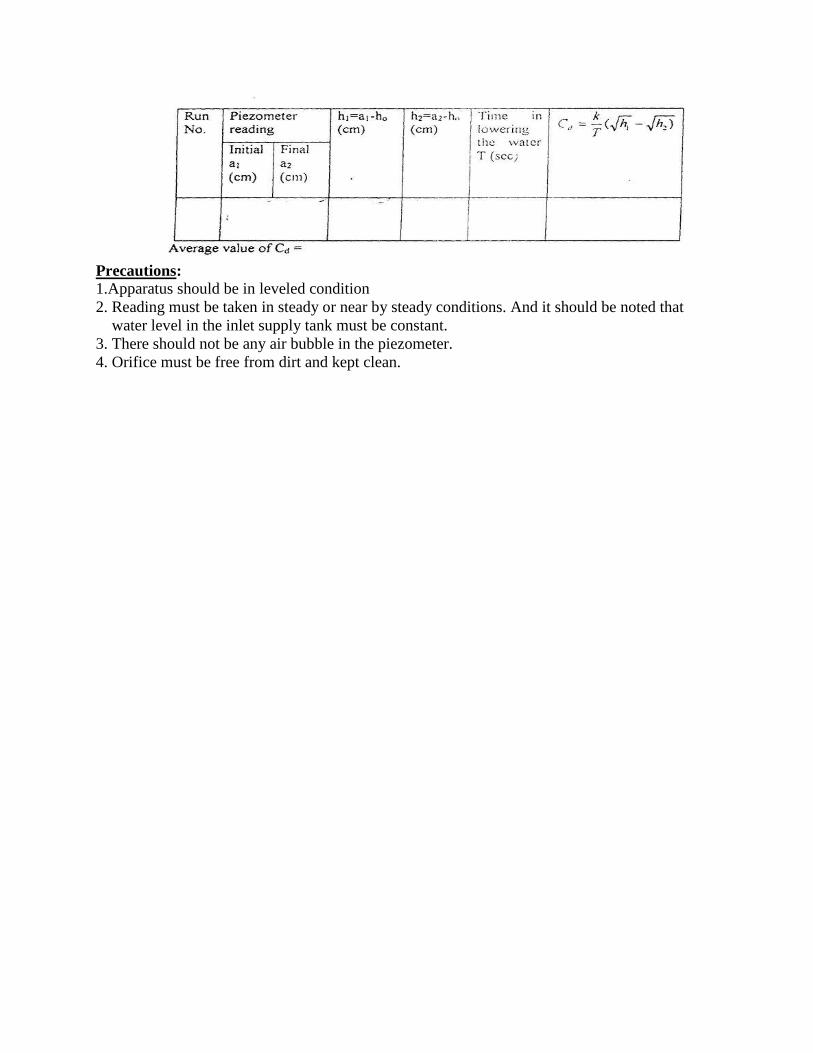
Precautions:
1.Apparatus should be in leveled condition
2. Reading must be taken in steady or near by steady conditions. And it should be noted that
water level in the inlet supply tank must be constant.
3. There should not be any air bubble in the piezometer.
4. Orifice must be free from dirt and kept clean.

BRCM COLLEGE OF
ENGINEERING & TECHNOLOGY
BAHAL, BHIWANI Practical Experiment Instructions Sheet
Lab
Manual
Exp. Title To determine the co efficient of impact for vanes EXP. NO. 10
FM-I Lab Semester-4th
Page No. 1 of 3
Theory
Momentum equation is based on Newton’s second law of motion which states that thealgebraic
sum of external forces applied to control volume of fluid in any direction is equal to the rate ofch
ange of
momentum in that direction. The external forces include the component of the weight of the fluid
& of the
forces exerted externally upon the boundary surface of the control volume. If a vertical water jet
moving
with velocity is made to strike a target, which is free to move in the vertical direction then aforce
will be exerted on the target by the impact of jet, according to momentum
equation this force (whichis also equal to
the force required to bring back the target in its original position) must be equal to therate of cha
nge of momentum of the jet flow in that direction.

BRCM COLLEGE OF
ENGINEERING & TECHNOLOGY
BAHAL, BHIWANI Practical Experiment Instructions Sheet
Lab
Manual
Exp. Title To determine the co efficient of impact for vanes EXP. NO. 10
FM-I Lab Semester-4th
Page No. 2 of 3
Formula Used:
F=ρ Q v(1-cosβ)
F=ρ Q2 (1-cosβ)/A as v=Q/A
Where
F =force (calculated)
ρ = density of water
β=angle of vane
V =velocity of jet
Q =discharge
A =area of nozzle( π/4d2)
(i) for flat vane β=90o
F’ = ρQ2/A

(ii) for hemispherical vane β=180o
for % error =F- F'/ F'x100
F’ = 2 ρQ2/A
F = Force (due to putting of weight)
(iii) for inclined vane
F'=ρ Q v(1-cosβ)
F'=ρ Q2 (1-cosβ)/A
BRCM COLLEGE OF
ENGINEERING & TECHNOLOGY
BAHAL, BHIWANI Practical Experiment Instructions Sheet
Lab
Manual
Exp. Title To determine the co efficient of impact for vanes EXP. NO. 10
FM-I Lab Semester-4th
Page No. 3 of 3
Procedure:
1. Note down the relevant dimension or area of collecting tank, dia of nozzle, and density of
water.
2. Install any type of vane i.e. flat, inclined or curved.
3. Note down the position of upper disk, when jet is not running.
4. Note down the reading of height of water in the collecting tank.
5. As the jet strike the vane, position of upper disk is changed, note the reading in the scale to
which vane is raised.
6. Put the weight of various values one by one to bring the vane to its initial position.
7. At this position finds out the discharge also.
8. The procedure is repeated for each value of flow rate by reducing the water supply.
9. This procedure can be repeated for different type of vanes and nozzle.
Observations & Calculations:
Dia of nozzle =
Mass density of water ρ =
Area of collecting tank =
Area of nozzle =

Horizontal flat vane
When jet is not running, position of upper disk is at =
SNO
Discharge measurement Balancing Theoretical
Force F'=
ρQ2/A
Error in %
= F-F'/F' Initial
(cm)
Final
(cm)
Time
(sec)
Discharge
(cm3/sec) Q
Mass
W (gm)
Force
F


![Untitled-4 [] · Standard lamineret (8 meter / *4 meter) Neon lamineret - 5 meter Mat lamineret - 8 meter / **5 meter) Metallic lamineret - 8 meter Ulamineret - 8 meter Fleksibel](https://img.dokumen.tips/doc/110x75/5f3a768af7b8e86a6437cff7/untitled-4-standard-lamineret-8-meter-4-meter-neon-lamineret-5-meter.jpg)