Embed Size (px)
Citation preview

Fabio Meneghin
BRAZILIAN SUGAR / ETHANOL
MARKETSTefla´s India Sugar Summit
Feb 2nd 2018

• Brazil´s macroeconomic current situation
• Petrobras new fuel policy and the new federal taxation
• Basics scenarios for ethanol/sugar
• Costs and Margins
• The indebtedness and real value of sugar/ethanol Assets
• Forecast for brazilian season 18/19
SUMMARY | TOPICS
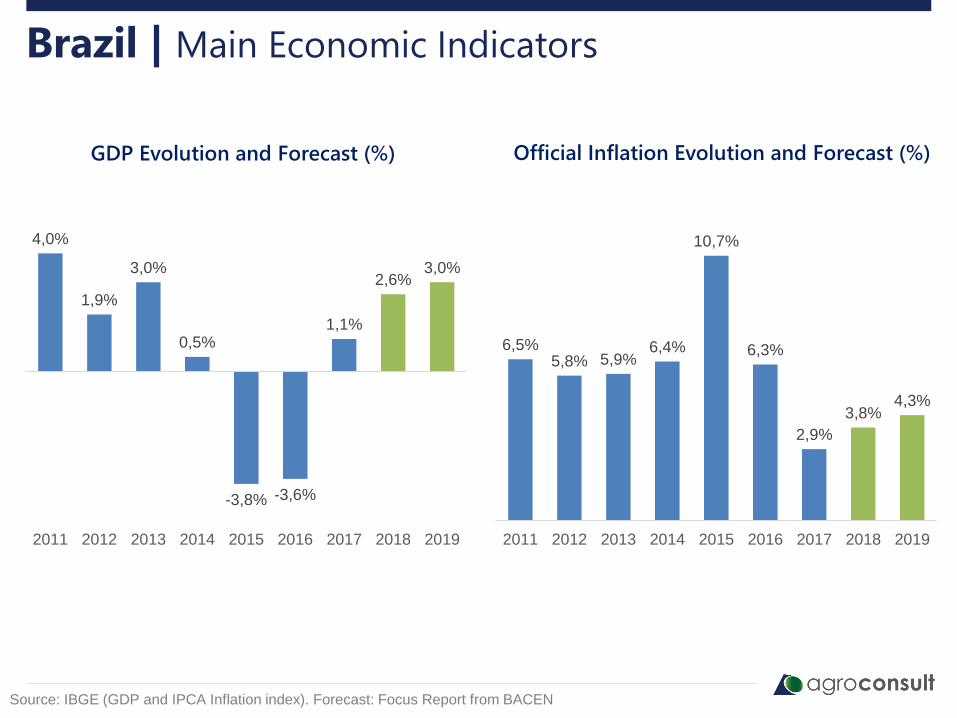
4,0%
1,9%
3,0%
0,5%
-3,8% -3,6%
1,1%
2,6%3,0%
2011 2012 2013 2014 2015 2016 2017 2018 2019
6,5%5,8% 5,9%
6,4%
10,7%
6,3%
2,9%
3,8%4,3%
2011 2012 2013 2014 2015 2016 2017 2018 2019
Brazil | Main Economic Indicators
GDP Evolution and Forecast (%) Official Inflation Evolution and Forecast (%)
Source: IBGE (GDP and IPCA Inflation index). Forecast: Focus Report from BACEN
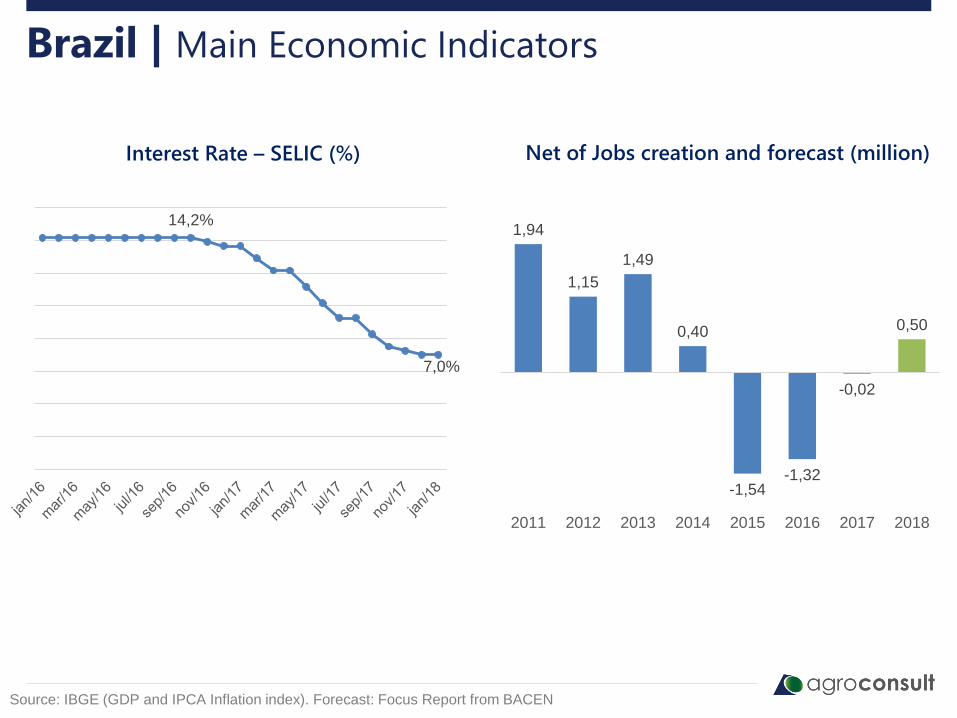
Brazil | Main Economic Indicators
Interest Rate – SELIC (%) Net of Jobs creation and forecast (million)
Source: IBGE (GDP and IPCA Inflation index). Forecast: Focus Report from BACEN
14,2%
7,0%
1,94
1,15
1,49
0,40
-1,54-1,32
-0,02
0,50
2011 2012 2013 2014 2015 2016 2017 2018
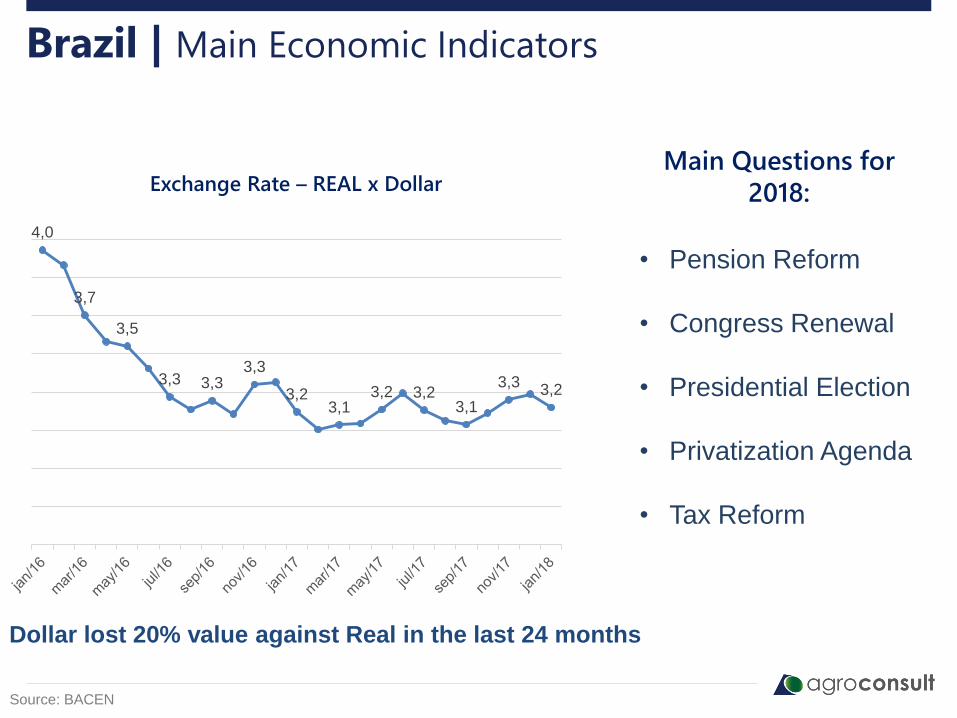
Exchange Rate – REAL x Dollar
4,0
3,7
3,5
3,3 3,33,3
3,23,1
3,2 3,23,1
3,33,2
Brazil | Main Economic Indicators
Main Questions for
2018:
• Pension Reform
• Congress Renewal
• Presidential Election
• Privatization Agenda
• Tax Reform
Dollar lost 20% value against Real in the last 24 months
Source: BACEN

Brazil | New Policy and taxes for Wholesale Gasoline PricesB
RL
/ L
ite
r
Source: EIA, Petrobras and B3 (PETR4)
1,60
1,49
Jan
-16
Feb
-16
Mar
-16
Ap
r-16
May
-16
Jun
-16
Jul-
16
Au
g-1
6
Sep
-16
Oct
-16
No
v-1
6
De
c-1
6
Jan
-17
Feb
-17
Mar
-17
Ap
r-17
May
-17
Jun
-17
Jul-
17
Au
g-1
7
Sep
-17
Oct
-17
No
v-1
7
CIDE + PIS/COFINS Gasoline BR Gasoline NYFederal Tax
0.48
0.89
Gasoline Prices at refiners and Federal Tax
4,5
19,0
Petrobras´ Shares at B3 (PETR4) - BRL
New taxes on gasoline are favoring
ethanol consumptionIPO of Petrobras subsidiary “BR
Distribuidora” BRDT3 in December 2017
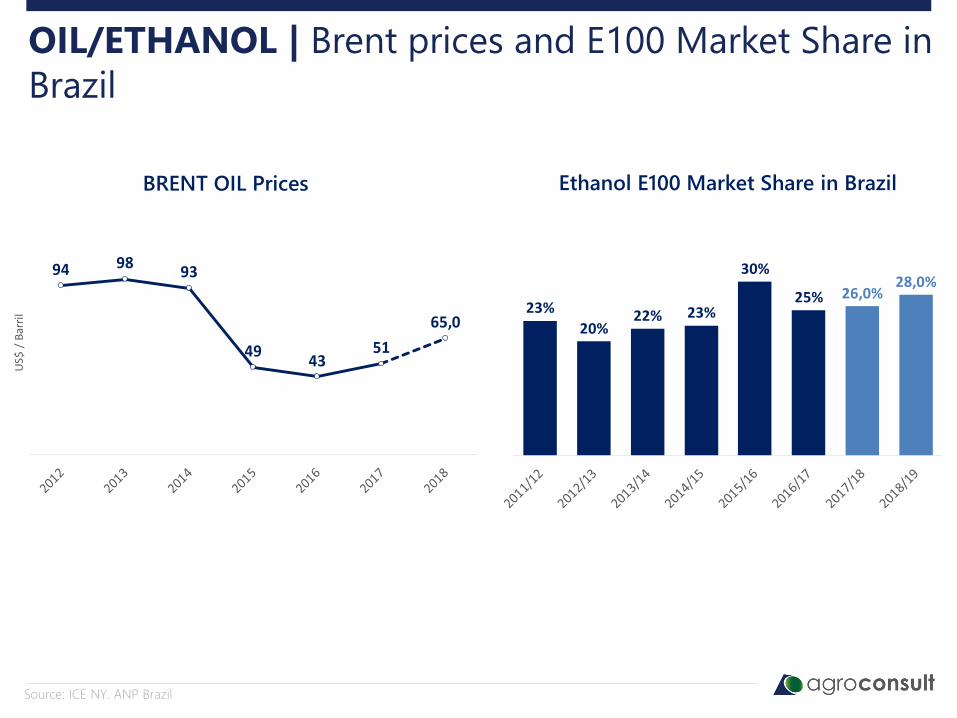
OIL/ETHANOL | Brent prices and E100 Market Share in
Brazil
Source: ICE NY. ANP Brazil
94 9893
4943
51
65,0
US$
/ B
arri
l 23%
20%22% 23%
30%
25% 26,0%28,0%
BRENT OIL Prices Ethanol E100 Market Share in Brazil
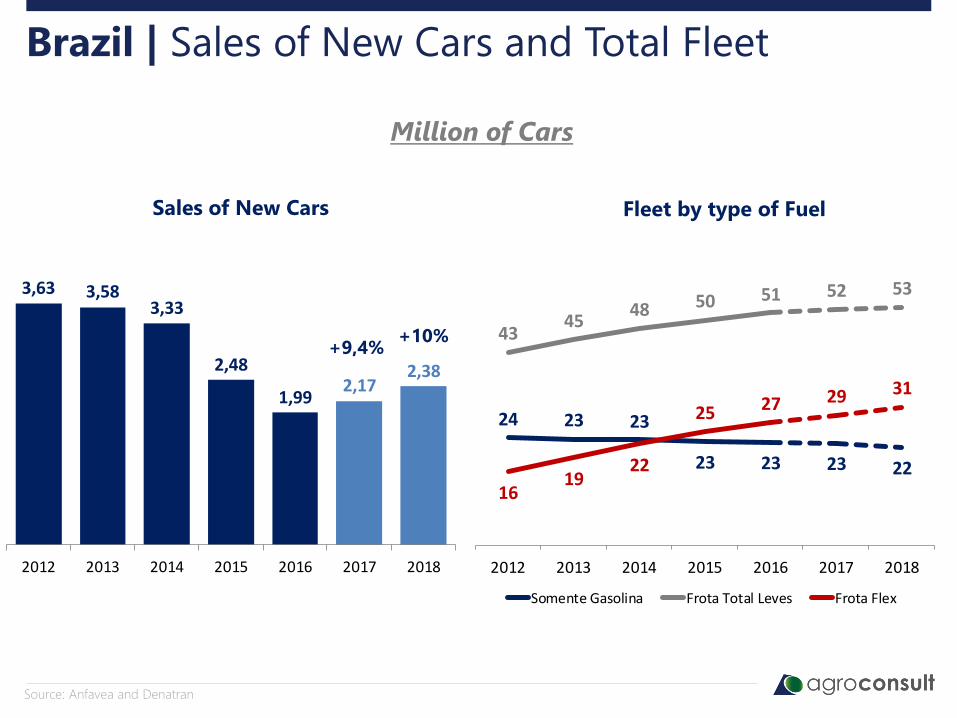
3,63 3,583,33
2,48
1,992,17
2,38
2012 2013 2014 2015 2016 2017 2018
24 23 23
23 23 23 22
4345
48 50 51 52 53
1619
22
25 27 29 31
2012 2013 2014 2015 2016 2017 2018
Somente Gasolina Frota Total Leves Frota Flex
Sales of New Cars Fleet by type of Fuel
Brazil | Sales of New Cars and Total Fleet
Source: Anfavea and Denatran
Million of Cars
+9,4%+10%

10,1 9,911,3
13,0
17,9
14,615,8
18,0
8,2 8,010,4 11,0 11,1 11,6 11,7 11,5
28,5
31,9 31,9 33,3
30,031,4 31,6 31,0
Gasoline A
“pure”
Ethanol
Hydrous
Ethanol
Anhydrous
25%20%20% 25%Blend on
Gasoline27%
Brazil | Fuel Consumption
Fonte: ANP e Agroconsult.
Bill
ion
oflit
ers
27% 27% 27%

38% 36%33%
36% 36%
13,5
16,617,5
15,016,0
14/15 15/16 16/17 17/18 18/19
Estoque/Uso NY (USD. ¢/lb)
8
-3 -1
71
14
/15
15
/16
16
/17
17
/18
18
/19
176
167171
182 178
168
170 172
175 178
Produção Consumo
Supply and Demand (mmt) NY Prices (U.S. ¢/pound) and Stock/Use Ratio
Sugar/World | Scenario for 2018/19
Source: USDA. Forecast: Agroconsult. Calendar: Oct-Sep.
Output Consumption
Ratio

Center-South | Cost of Production
Source: Agroconsult.. (Exchange Rate 18/19: BRL 3.20/USD)
Sugar Costs – São Paulo
(US¢/pound)Ethanol Costs in Sugar
Equivalent (US¢/pound)
11,812,9 12,5
13,214,5 14,2
0
2
4
6
8
10
12
14
16
2016/17 2017/18 2018/19
Cost at Mills FOB Costs
13,4
14,6
14,2
12,8
13
13,2
13,4
13,6
13,8
14
14,2
14,4
14,6
14,8
2016/17 2017/18 2018/19

Center-South | Sugar Logistics Costs for Export
Source: Agroconsult..
Santos
Paranaguá
US$ cents
1.56/pound
+18%
+35%
+2%
+38%
Sugar Transportation Costs – 17/18
(US¢/pound)
1,61,6
1,0
1,1
1,2
1,3
1,4
1,5
1,6
1,7
1,8
1,9
2,0
2010 2011 2012 2013 2014 2015 2016 2017 2018
Evolution of the Transportation
Costs in São Paulo (US¢/pound)

14,4
17,5
12,0
13,0
14,0
15,0
16,0
17,0
18,0
NY 11 Anidro SP Hidratado SP
Brazil | Sugar / Ethanol Price Parity in domestic marketU
SD
ce
nts
/ pound
Hydrous
Ethanol SP Anhydrous
Ethanol SP
VHP Sugar
FOB
Source: Ice Futures, Cepea.
Higher taxation over
gasoline to consumer

Brazil | Mix of Production and Ebit Margin
Mix of Production Theoretic Ebit Margin
Source: Agroconsult.
17%14%
7%
25%
19%
24%
16%
-1%
12%
8%
23% 21%
12%
18%
12
/13
13
/14
14
/15
15
/16
16
/17
17
/18
18
/19
Açúcar EtanolSugar Ethanol
50%46%
43%
40%
46% 45%
42%
50%
54%
57%
60%
54% 55%
58%
12
/13
13
/14
14
/15
15
/16
16
/17
17
/18
18
/19
Sugar Ethanol

Sugar/Ethanol Net Revenues – Sector´s
Average
USD / t of cane crushed
EBIT – Sector´s Average
USD / t of cane crushed
Brazil | Mills Net Revenues and EBIT Margin
Source: Agroconsult. Margem Ebit: (Net Revenues / Operational Costs including depreciation)
Admnistrative, Sales and General expenses are not included. Eletric energy not included.
5446
42
3440
44 40
12
/13
13
/14
14/1
5
15
/16
16
/17
17
/18
18
/19
5,16,2
3,3
8,1 8,1 8,07,0
12/1
3
13
/14
14
/15
15
/16
16/1
7
17
/18
18
/19
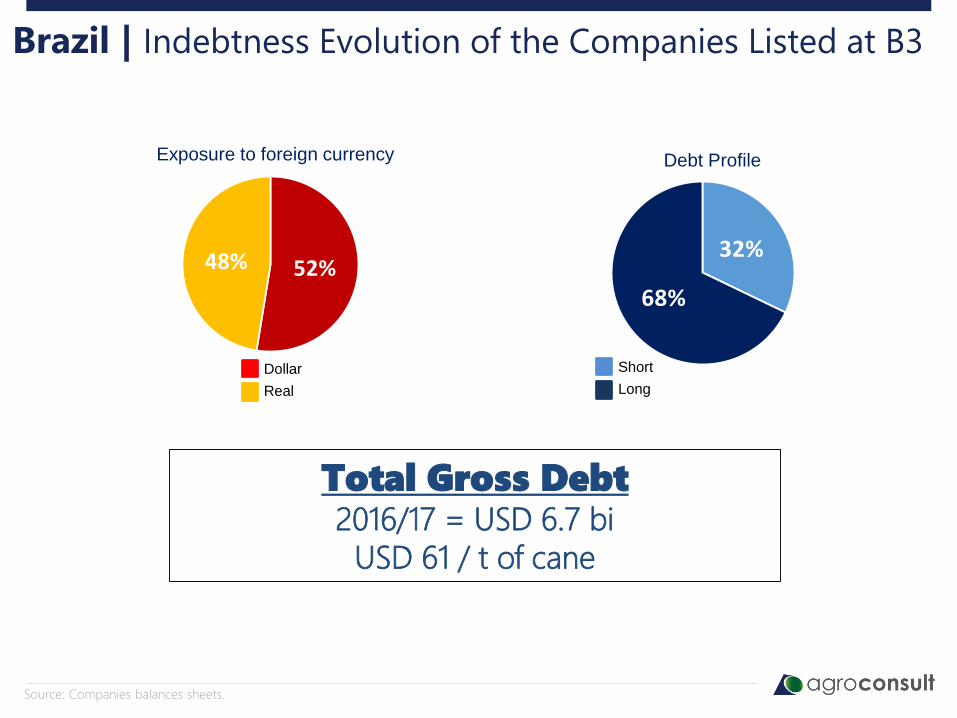
Brazil | Indebtness Evolution of the Companies Listed at B3
Source: Companies balances sheets.
Total Gross Debt2016/17 = USD 6.7 bi
USD 61 / t of cane
52%48%32%
68%
Dollar
Real
Exposure to foreign currency Debt Profile
Short
Long
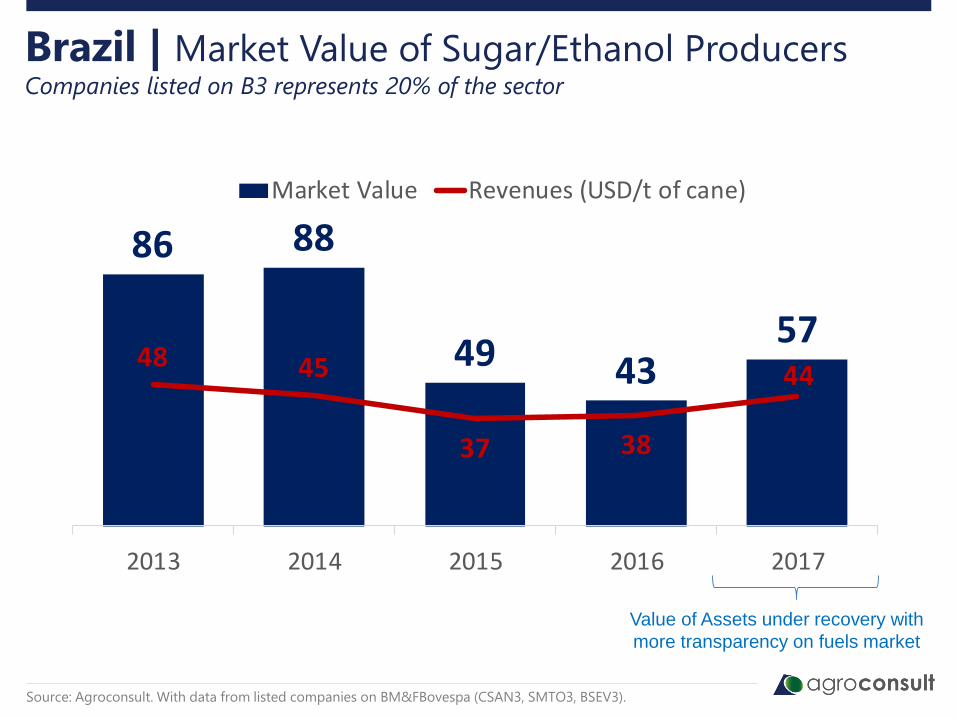
86 88
49 4357
48 45
37 38
44
2013 2014 2015 2016 2017
Market Value Revenues (USD/t of cane)
Brazil | Market Value of Sugar/Ethanol ProducersCompanies listed on B3 represents 20% of the sector
Source: Agroconsult. With data from listed companies on BM&FBovespa (CSAN3, SMTO3, BSEV3).
Value of Assets under recovery with
more transparency on fuels market

Center-South | Margins of Sugarcane Suppliers
against competitors crops (R$/ha)
Source: Agroconsult
1.047
1.469
829
0
200
400
600
800
1.000
1.200
1.400
1.600
1.800
R$
/ h
ecta
re
Soja + Milho 2ª (MS) Soja + Milho 2ª (GO) Cana-de-açúcar (CS)Soybean + Corn 2nd (GO)Soybean + Corn 2nd (MS) Sugarcane (Center-South)

Sugarcane Fields | Average Age
5,4 – 6,4
5,2 – 5,4
5,0 – 5,2
4,8 – 5,0
2,9 – 4,8
n/a
Age (nº of cuts):
Source: Agrosatélite, based Canasat 2017/18 data. Microrregions with planted area higher than 1000 ha.
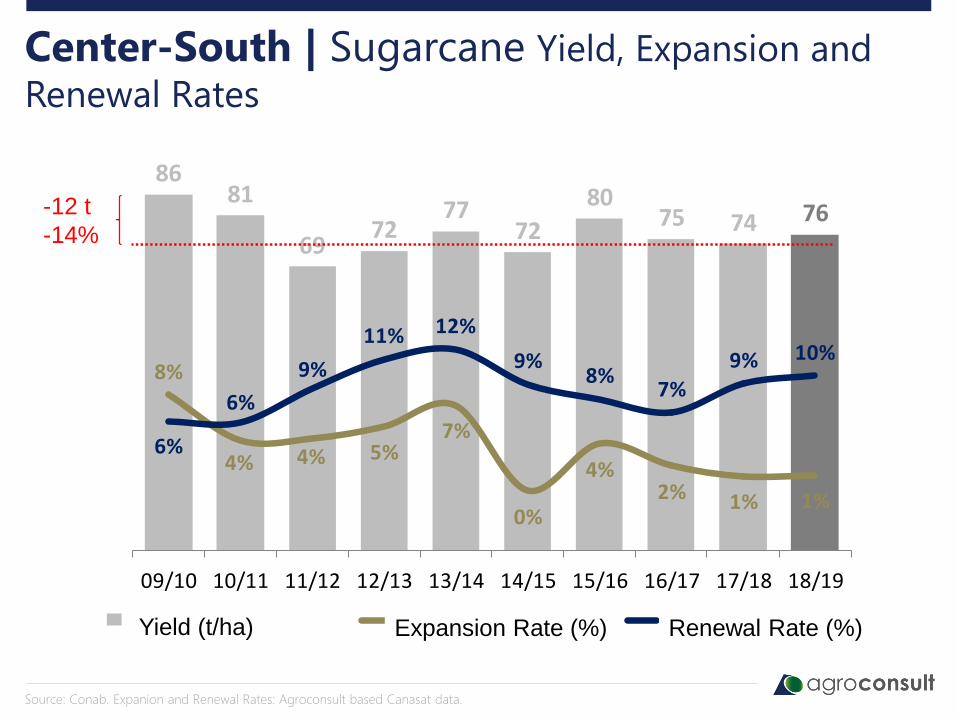
8681
6972
7772
8075 74 76
8%
4% 4% 5%7%
0%
4%2% 1% 1%
6%
6%
9%
11% 12%
9%8%
7%
9% 10%
09/10 10/11 11/12 12/13 13/14 14/15 15/16 16/17 17/18 18/19
Produtividade (t/ha) Taxa de Expansão (%) Taxa de Renovação (%)
Center-South | Sugarcane Yield, Expansion and
Renewal Rates
Source: Conab. Expanion and Renewal Rates: Agroconsult based Canasat data.
-12 t
-14%
Yield (t/ha)Yield (t/ha) Expansion Rate (%) Renewal Rate (%)

533597 575 617 612 594 601
5657 59
49 45 47 49589654 635
666 657 641 650
12/13 13/14 14/15 15/16 16/17 17/18 18/19
CS N-NE
Source: CONAB. Agroconsult. 18/19: Another 0.5 billion liters will come from corn (MT and GO states)
Brazil | Sugarcane Crushing. Sugar/Ethanol Output
35,9
32,9
2,4
2,2
38,4
35,1
2017/18 2018/19
mm
t
Centro-Sul N-NE
26,027,5
2,3
2,028,3
29,5
2017/18 2018/19
bil
hõ
es d
e li
tro
s
Centro-Sul N-NE
MM
T
Bill
ion
oflit
ers

RENOVABIO
• Long-term plan (2030) to incentive the use of renewable energy in the light
fuels market, with emphasis on ethanol.
• Brazilian commitment to the COP21 Climate Agreement, which aims to
reduce CO2 emissions by 43% (on a 2005 basis) until 2030.
• The proposal predicts the need for 54 billion ethanol by 2030.
• Plan Guidelines:
1. Maintain the gasoline price policy in line with the international market
2. Recognition of the positive externalities of ethanol with clear environmental
taxation on fossil fuels (CIDE)
3. Implementation of an emission certificate system (CDBios - Fuel Savings
Credit - Similar to US RINs)

AGROCONSULT
Agribusiness services for banks, investment funds, M&A operations.
• Market analysis and sizing
• Analysis of Investments
• Assets and Land Valuation
• Due Diligences (Agricultural and Industrial)

agroconsult.com.br+55 48 3209-1650


![SUCDEN SUGAR MARKET REPORT€¦ · CS Brazilian production [Apr/March, Left: Mt sugar & Mm3 ethanol - Right: Mt cane] CS: CANE AND SUGAR MIX QUITE STABLE CS Brazilian cumulative rains](https://img.dokumen.tips/doc/110x75/5f31ee5d18ddf7479c1ba381/sucden-sugar-market-report-cs-brazilian-production-aprmarch-left-mt-sugar-.jpg)