Embed Size (px)
Citation preview
8/3/2019 Brazil Economic Comment 11-03-2010
http://slidepdf.com/reader/full/brazil-economic-comment-11-03-2010 1/16
Macroeconomic
Research
Eduardo Loyo
Economist
+55 21 3262 9707
Claudio FerrazEconomist
+55 21 3262 9758
Rodrigo Melo
Economist
+55 21 3262 8883
Livio Ribeiro
Economist
Livio [email protected]
+55 21 3262 9660
Marcelo Castello Branco
Economist
marcelo.castello @btgpactual.com
+55 21 3262 8774
Brazil Economic Comment 3 November 2010
Fundamentally speaking: The response of the BRL totaxation of capital inflows
In this report, we reexamine in greater detail the impacts of the recent set of FX
policy measures – specifically, the higher taxation of capital inflows – on the
behavior of the BRL. For this purpose, we use once again our traditional rolling
regression framework, and evaluate the relationship between the actual FX rate
and its model-based daily tracking. We still do not find evidence that highertaxation, either recently or back in October 2009, has led to large or sustained
depreciation in excess of that driven by fundamentals. In fairness, however, we
do find some evidence consistent with a modest temporary weakening of the
currency as a consequence of those tax measures, arguably more so in
association with the latest episode. But it is exactly with regard to the latest
episode that we need to be the most cautious, as the post-tax data sample is still
small and it is also hard to distinguish between the impact of the measures
actually enacted and the effect on the currency of prevailing uncertainty about
possible additional restrictions.
Background
Over the last several weeks, the Brazilian government announced a series of
measures with the common objective of curbing the appreciation of the BRL.
One group of measures purportedly served to boost the government’s ability to
intervene in local FX markets, as was the case with the permission for Brazil’s
Sovereign Wealth Fund to invest in foreign currency and the allowance for the
Treasury to buy dollars in the market to honor payment obligations maturing up
to 1,500 days later (previously the limit was 750 days). Except possibly for
operational features, it is not clear whether these new or enhanced channels for
official purchases of foreign currency should be very different from concentrating
intervention at the Central Bank’s foreign exchange desk.
The second group of measures raised barriers against capital inflows, through a
higher IOF tax rate on certain inbound FX operations. On October 4, it was
announced that the IOF tax on inflows into foreign fixed income investments
would be raised from 2% to 4%. As officials interpreted the rule, the higher tax
would also apply to inflows into debentures, equity funds and multi-strategy
funds, while keeping investments in equities proper or in derivatives markets
subject to the preexisting rates. On October 18, the IOF tax rate was raised once
again: inflows recently subjected to the new 4% rate would now pay 6% instead.
In addition, the government announced that the 6% rate would also apply to
foreign investors’ margin deposits for futures markets operations, while it
8/3/2019 Brazil Economic Comment 11-03-2010
http://slidepdf.com/reader/full/brazil-economic-comment-11-03-2010 2/16
Brazil Economic Comment3 November 2010
page 2
proceeded to close certain loopholes that would have allowed the new rates to
be legally circumvented. Officials made a point of stating that the door remained
open to further measures along the same lines, with the maintained objective of
discouraging the carry trade and containing short-term capital inflows.
We recall that the same approach had already been used last year. Up to that
point, the IOF tax on foreign portfolio investment had a lower rate (1.5%) and
was not applicable to equity investments. On October 20, 2009, in response to
the strengthening of the BRL, the IOF tax on foreign portfolio investment was
raised to 2%, applicable not only on fixed income but also on equity investments.
Method
Claims are often made about the effectiveness of such tax measures on the
basis of whether or not the currency depreciated in their wake – or, at least,
appreciated less than it was doing before. Indeed, the appreciation trend of late
2009 halted following the October 2009 IOF rate hike, which was then
considered a success (if only partial, as the currency did not visibly de preciate).
More recently, right after the IOF tax rates were increased to 4%, the currency
actually went on another bout of strengthening, which was taken in some
quarters as evidence that, this time around, the measure was a failure. Then,
when the rates were again increased to 6% and certain loopholes closed, the
currency did depreciate some, suggesting that, once duly reinforced, the
measures had finally worked.
We have long insisted that none of these judgments is appropriate, as the value
of the currency depends on several determinants other than the prevailing IOF
tax rate, and those determinants can very well move (or stop moving) at thesame time as the IOF rates are changed. In order to identify the true effect of the
taxation measure, one should thus “control” for the oscillations of the currency
that would normally have occurred in the absence of the tax measure, as
determined by the regular drivers of the FX rate.
We have been doing this since last year on the basis of our traditional tracking
model for the BRL, on which we regularly report in our Latam Daily at the
beginning of each month. The model correlates the currency with a parsimonious
set of fundamentals – namely commodity prices (measured by the CRB index),
the value of the USD against other major currencies (represented by the DXY
index) and Brazil’s risk premium (10-year CDS spreads). We use a rolling
regression framework to allow the model parameters to vary over time (weactually find value in the information about the variations of the BRL’s elasticities
with respect to each fundamental driver). While the changes in coefficients can
be significant, they tend to be gradual as we use a one-year sample window of
daily data.
Our daily tracking model contains an autoregressive component – that is, we
include among the explanatory variables, alongside the contemporaneous values
of the fundamental drivers, the actual value of the BRL/USD on the previous day.
Indeed, the pattern of residuals in a regression that includes just the

8/3/2019 Brazil Economic Comment 11-03-2010
http://slidepdf.com/reader/full/brazil-economic-comment-11-03-2010 3/16
Brazil Economic Comment3 November 2010
page 3
contemporaneous values of the fundamentals strongly suggests that the
autoregressive specification should be adopted. While the autoregressive
specification is clearly preferable from a statistical standpoint, the autoregressive
term turns out not to be overpowering, in the sense that its coefficient is not very
high and, most of the time, contemporaneous changes in fundamentals keep
playing a key role in determining the daily fluctuations of the currency.
In any case, the presence of an autoregressive component signifies that the
currency tends to respond only gradually to any given change in the values of
fundamentals. Considering this inertia – presumably, a property of the actual FX
rate that the tracking model is merely trying to emulate – we may also be
interested in knowing the value towards which, at any given point in time, the
fundamentals are pulling the currency. We refer to such values as the BRL’s
stochastic trend , i.e., the point to which the currency would eventually converge if
fundamentals (and their estimated regression coefficients) remained indefinitely
constant at their current levels.1
Considering both the evolving elasticities and the actual trajectory of the
fundamental drivers, our daily BRL tracking and the corresponding stochastic
trend behave as shown in chart 1. The tracking closely matches the actual
USD/BRL bilateral rate – the gap between the two is usually no wider than 2
centavos – revealing that swings in our small set of explanatory variables do
account for the bulk of the movements in the currency. In fact, within the last 12
months, the only period when this gap seemed to be consistently wider than 2
centavos was around May 2010, on the back of significant swings in the
fundamentals themselves, due to the European sovereign debt jitters. The
stochastic trend is more volatile, as it should be since it disregards the
“smoothing” autoregressive component. While not as close a day-to-day match
for the actual currency movements (which it is not supposed to be), one notes
that the stochastic trend does capture the major swings of the FX rate.
1 If is our autoregressive tracking model, the stochastic trend is simply
.

8/3/2019 Brazil Economic Comment 11-03-2010
http://slidepdf.com/reader/full/brazil-economic-comment-11-03-2010 4/16

8/3/2019 Brazil Economic Comment 11-03-2010
http://slidepdf.com/reader/full/brazil-economic-comment-11-03-2010 5/16
Brazil Economic Comment3 November 2010
page 5
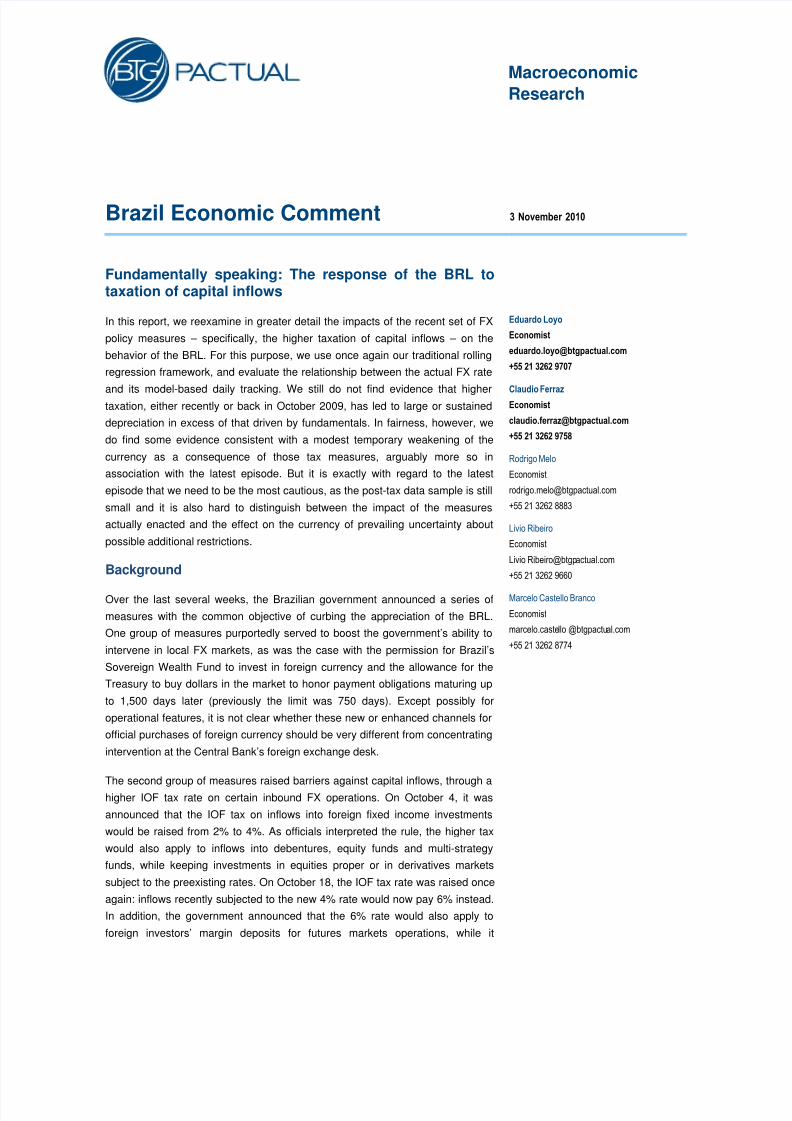
Chart 2: Daily BRL tracking (September 1, 2009 to January 31, 2010)
Source: Bloomberg and BTG Pactual
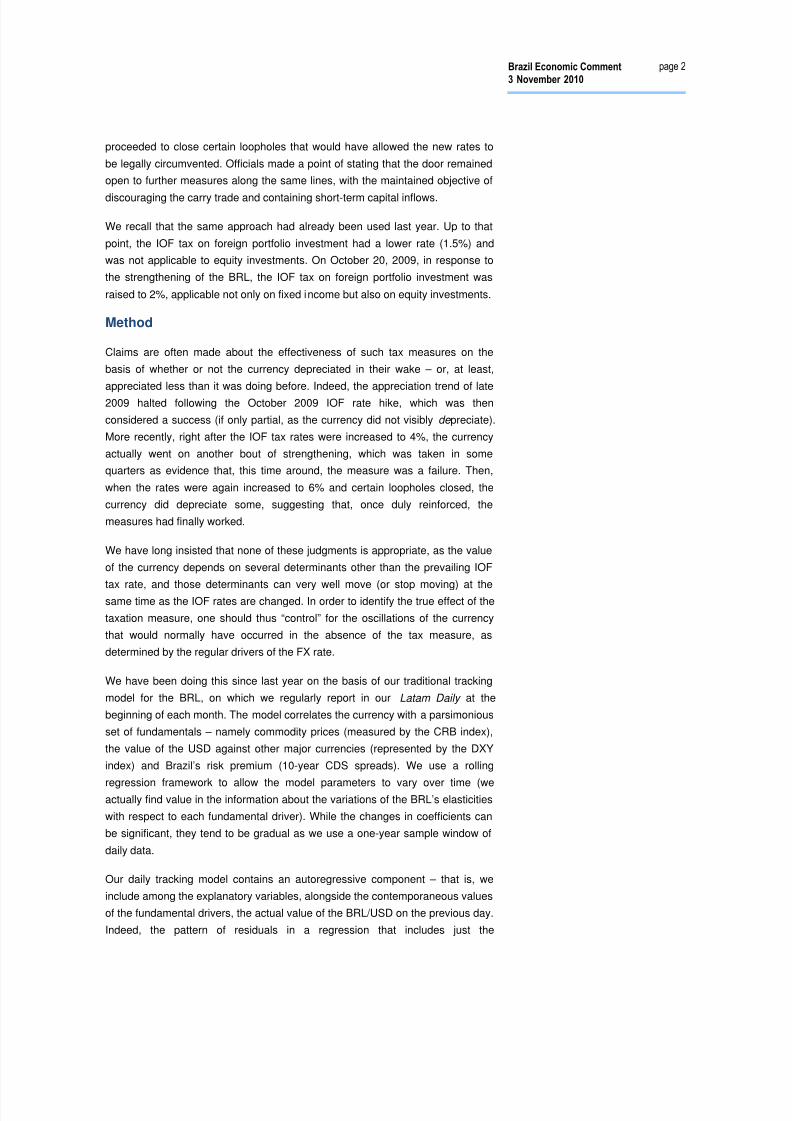
Indeed, neither the interruption of the earlier appreciation trend nor the new wave
of depreciation early this year is a puzzle in light of the behavior of the
fundamental drivers. The CRB index had been recovering throughout October,
but then remained broadly stable until mid-December 2009 (chart 3 ). It went up
further between the end of December 2009 and the first half of January 2010, but
then capitulated, closing the month below the range where it had been for most
of 4Q09. The CDS spread oscillated strongly up until October 2009, but kept
relatively stable between then and the turn of the year, and finally hitched on an
upward trend in the latter part of January 2010 (chart 4 ). The DXY index
continued to slide down until November, in a rather mild movement, after whichthe USD started to gain ground against other major currencies (chart 5 ). Those
drivers combined to keep the model-based tracking of the BRL roughly stable
until the end of 2009, thus accounting for the stability of the currency during that
period without any reference to the higher IOF rate. In turn, it was once again the
movement of fundamentals that led to BRL depreciation in the beginning of
2010.

8/3/2019 Brazil Economic Comment 11-03-2010
http://slidepdf.com/reader/full/brazil-economic-comment-11-03-2010 6/16
Brazil Economic Comment3 November 2010
page 6
Chart 3: CRB index Chart 4: CDS spreads
Source: Bloomberg and BTG Pactual Source: Bloomberg and BTG Pactual
Chart 5: DXY index
Source: Bloomberg and BTG Pactual
Then consider what has happened around the more recent changes in capital
inflow taxation. The currency had been appreciating and continued to do so for
several days after the first tax change was enacted; then it reversed course and
continued to depreciate after the second round of tax changes ( chart 6 ). More
importantly for our purposes, however, is the corresponding behavior of the
model-based tracking exercise, which followed the same approximate pattern.The gaps between the model-based estimates and the actual behavior of the
currency did not become atypically wide following the policy moves.
240
250
260
270
280
290
300
0 1 - S e p - 0 9
0 7 - S e p - 0 9
1 3 - S e p - 0 9
1 9 - S e p - 0 9
2 5 - S e p - 0 9
0 1 - O c t - 0 9
0 7 - O c t - 0 9
1 3 - O c t - 0 9
1 9 - O c t - 0 9
2 5 - O c t - 0 9
3 1 - O c t - 0 9
0 6 - N o v - 0 9
1 2 - N o v - 0 9
1 8 - N o v - 0 9
2 4 - N o v - 0 9
3 0 - N o v - 0 9
0 6 - D e c - 0 9
1 2 - D e c - 0 9
1 8 - D e c - 0 9
2 4 - D e c - 0 9
3 0 - D e c - 0 9
0 5 - J a n - 1 0
1 1 - J a n - 1 0
1 7 - J a n - 1 0
2 3 - J a n - 1 0
2 9 - J a n - 1 0
CRB
IOF 2%
130
135
140
145
150
155
160
165
170
175
180
0 1 - S e p - 0 9
0 7 - S e p - 0 9
1 3 - S e p - 0 9
1 9 - S e p - 0 9
2 5 - S e p - 0 9
0 1 - O c t - 0 9
0 7 - O c t - 0 9
1 3 - O c t - 0 9
1 9 - O c t - 0 9
2 5 - O c t - 0 9
3 1 - O c t - 0 9
0 6 - N o v - 0 9
1 2 - N o v - 0 9
1 8 - N o v - 0 9
2 4 - N o v - 0 9
3 0 - N o v - 0 9
0 6 - D e c - 0 9
1 2 - D e c - 0 9
1 8 - D e c - 0 9
2 4 - D e c - 0 9
3 0 - D e c - 0 9
0 5 - J a n - 1 0
1 1 - J a n - 1 0
1 7 - J a n - 1 0
2 3 - J a n - 1 0
2 9 - J a n - 1 0
CDS
IOF 2%
74
75
76
77
78
79
80
0 1 - S e p - 0 9
0 7 - S e p - 0 9
1 3 - S e p - 0 9
1 9 - S e p - 0 9
2 5 - S e p - 0 9
0 1 - O c t - 0 9
0 7 - O c t - 0 9
1 3 - O c t - 0 9
1 9 - O c t - 0 9
2 5 - O c t - 0 9
3 1 - O c t - 0 9
0 6 - N o v - 0 9
1 2 - N o v - 0 9
1 8 - N o v - 0 9
2 4 - N o v - 0 9
3 0 - N o v - 0 9
0 6 - D e c - 0 9
1 2 - D e c - 0 9
1 8 - D e c - 0 9
2 4 - D e c - 0 9
3 0 - D e c - 0 9
0 5 - J a n - 1 0
1 1 - J a n - 1 0
1 7 - J a n - 1 0
2 3 - J a n - 1 0
2 9 - J a n - 1 0
DXY
IOF 2%
8/3/2019 Brazil Economic Comment 11-03-2010
http://slidepdf.com/reader/full/brazil-economic-comment-11-03-2010 7/16
Brazil Economic Comment3 November 2010
page 7
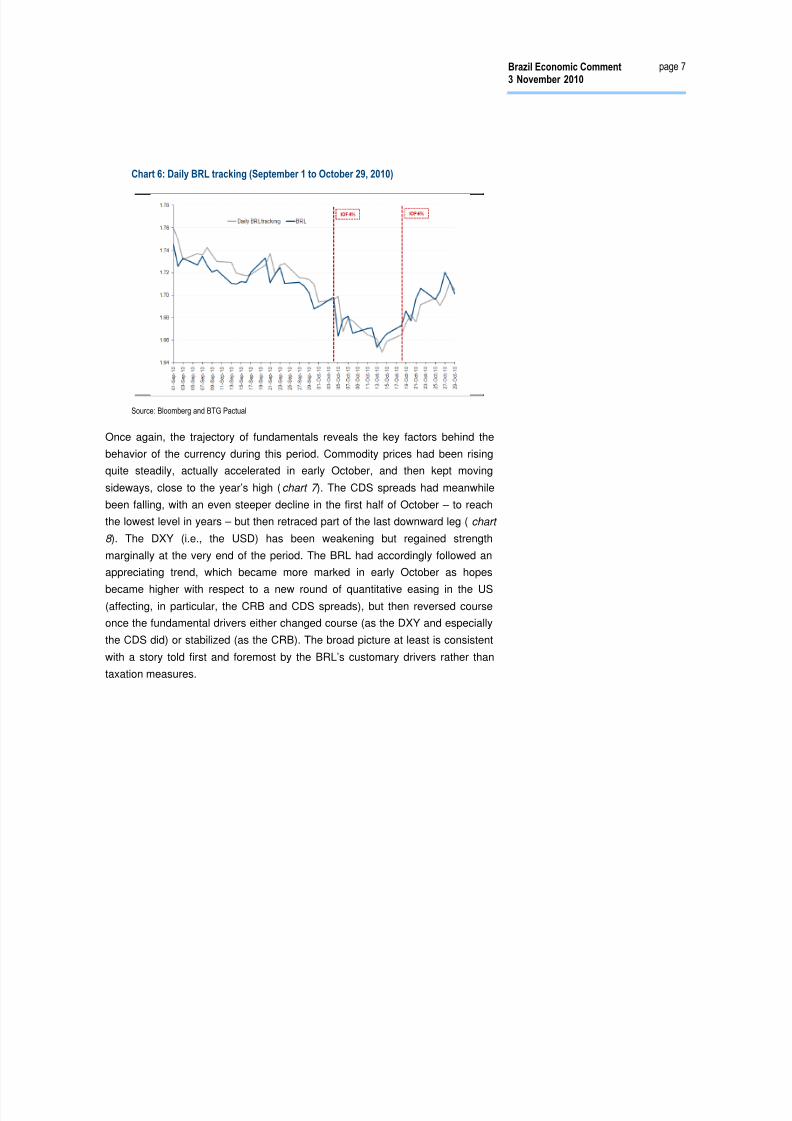
Chart 6: Daily BRL tracking (September 1 to October 29, 2010)
Source: Bloomberg and BTG Pactual
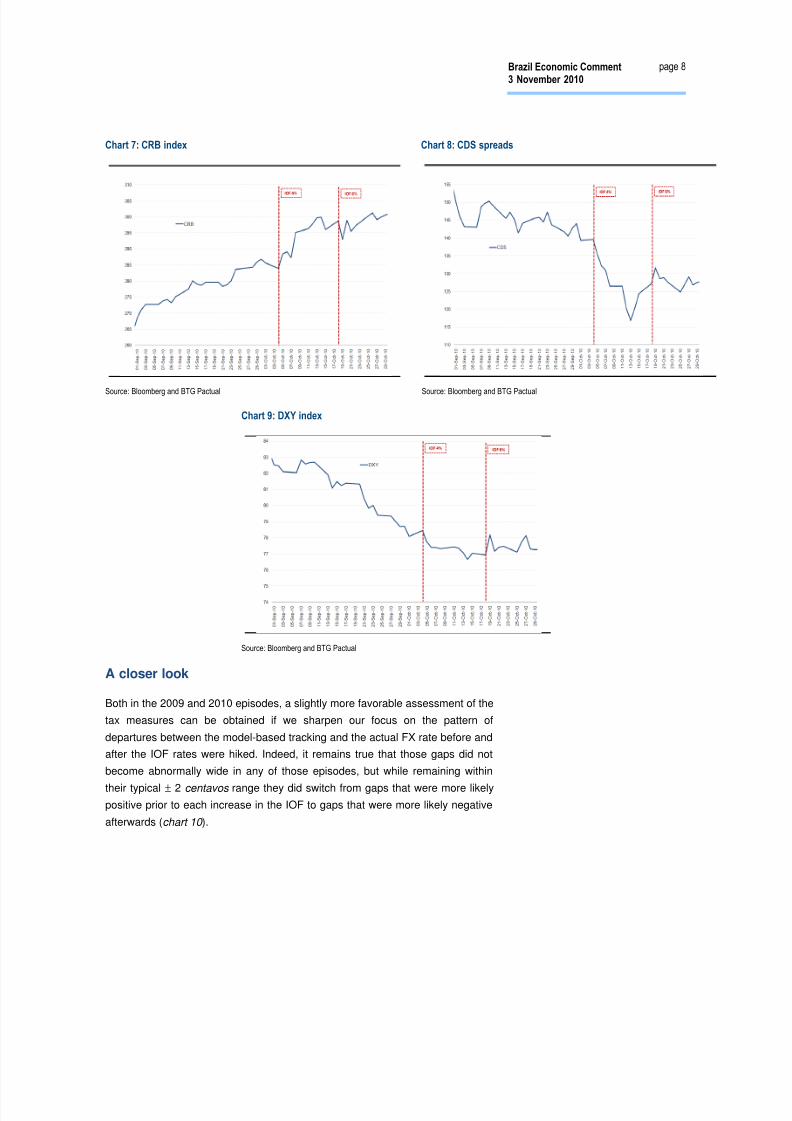
Once again, the trajectory of fundamentals reveals the key factors behind the
behavior of the currency during this period. Commodity prices had been rising
quite steadily, actually accelerated in early October, and then kept moving
sideways, close to the year’s high (chart 7 ). The CDS spreads had meanwhile
been falling, with an even steeper decline in the first half of October – to reach
the lowest level in years – but then retraced part of the last downward leg ( chart
8 ). The DXY (i.e., the USD) has been weakening but regained strength
marginally at the very end of the period. The BRL had accordingly followed an
appreciating trend, which became more marked in early October as hopes
became higher with respect to a new round of quantitative easing in the US(affecting, in particular, the CRB and CDS spreads), but then reversed course
once the fundamental drivers either changed course (as the DXY and especially
the CDS did) or stabilized (as the CRB). The broad picture at least is consistent
with a story told first and foremost by the BRL’s customary drivers rather than
taxation measures.
8/3/2019 Brazil Economic Comment 11-03-2010
http://slidepdf.com/reader/full/brazil-economic-comment-11-03-2010 8/16
Brazil Economic Comment3 November 2010
page 8
Chart 7: CRB index Chart 8: CDS spreads
Source: Bloomberg and BTG Pactual Source: Bloomberg and BTG Pactual
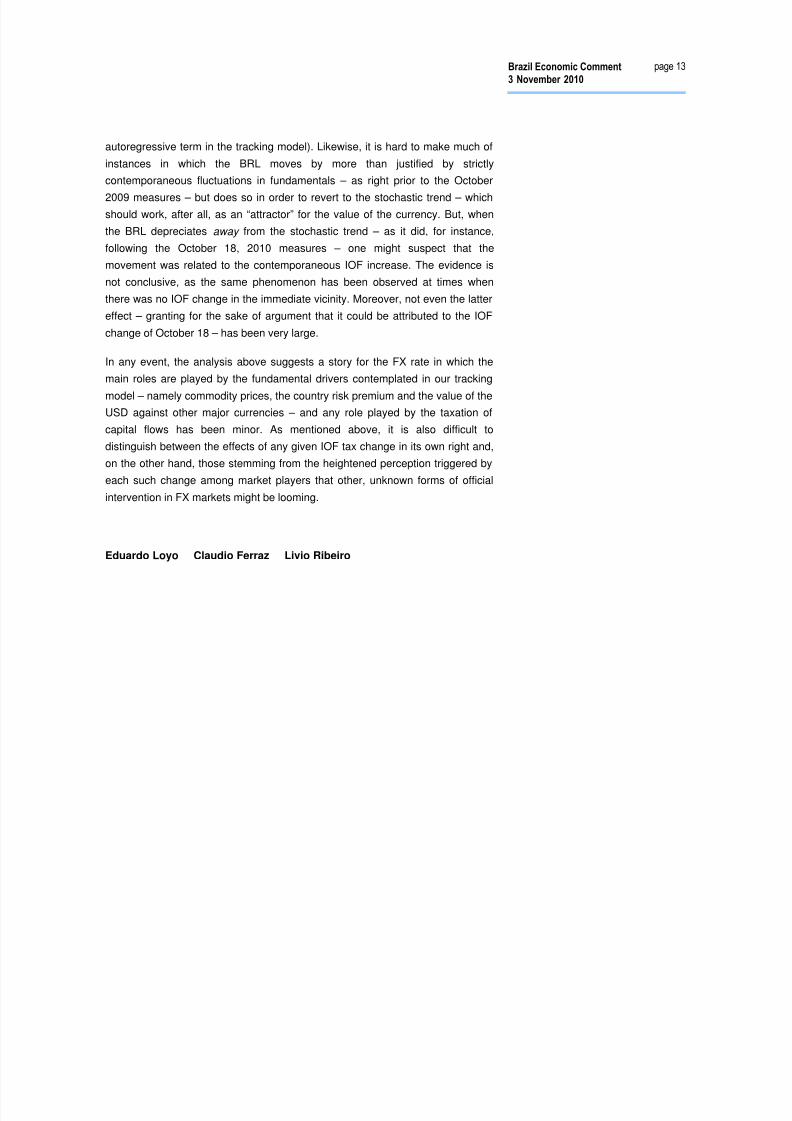
Chart 9: DXY index
Source: Bloomberg and BTG Pactual
A closer look
Both in the 2009 and 2010 episodes, a slightly more favorable assessment of the
tax measures can be obtained if we sharpen our focus on the pattern of
departures between the model-based tracking and the actual FX rate before and
after the IOF rates were hiked. Indeed, it remains true that those gaps did not
become abnormally wide in any of those episodes, but while remaining within
their typical ± 2 centavos range they did switch from gaps that were more likely
positive prior to each increase in the IOF to gaps that were more likely negative
afterwards (chart 10 ).

8/3/2019 Brazil Economic Comment 11-03-2010
http://slidepdf.com/reader/full/brazil-economic-comment-11-03-2010 9/16
Brazil Economic Comment3 November 2010
page 9
Chart 10: Tracking gaps
Source: Bloomberg and BTG Pactual
One may reasonably be tempted to ascribe these changes in the patterns to the
IOF rate hikes. Indeed, the tracking gaps did remain consistently negative for
some time after the October 2009 modifications, for instance, while for most of
the last 12 months the gaps have more often been positive. Little time has
elapsed since the more recent tax measures but the sequence of negative gaps
already seems more persistent than the standard for the remainder of the one-
year sample. Moreover, the switches in the pattern of tracking gaps precisely
coincided with the dates when the IOF was modified in October 2009 and then
again when the more recent sequence of changes started.
In any case, although the IOF may have been indeed the explanatory factor, the
effect was in both instances rather small – at most a couple of BRL centavos onaverage in the BRL/USD rate. Furthermore, as suggested by the visual
inspection made above of the actual BRL trajectories and their model-based
tracking, swings of this size in tracking gaps are quite small compared to the
fluctuations of the currency, and also compared to the portion of those
fluctuations that can be accounted for by fundamentals alone. Judging from the
2009 episode, the impact is not very lasting either – three months later, the
tracking gaps returned to positive territory. Regarding the more recent policy
measures, of course, the jury is still out with respect to the persistence of these
effects.
A different angle
So far, we have been focusing exclusively on the comparison between our daily
tracking model and the actual trajectory of the BRL/USD bilateral FX rate. But
one may be able to shed additional light on the issue by considering also the
behavior of our stochastic trend for the currency. As it turns out, while that
additional piece of information does not seem to change the verdict on the
October 2009 measures and on the first batch of IOF changes more recently
(that is, when the rate went from 2% to 4%), with some goodwill it may paint a
more positive picture when one examines the behavior of the FX rate following
the latest batch of tax changes (when the IOF rate went to 6%).

8/3/2019 Brazil Economic Comment 11-03-2010
http://slidepdf.com/reader/full/brazil-economic-comment-11-03-2010 10/16
Brazil Economic Comment3 November 2010
page 10
Consider first what happened in October 2009 (chart 11). Prior to the increase in
the IOF, the stochastic trend had been pointing at appreciation, but the actual
currency and the model-based tracking were actually moving ahead of it. That
was mainly the consequence of a temporary bout of depreciation that the
stochastic trend had displayed about a month before, which was not followed
either by the currency itself or by the daily tracking. The increase of the IOF rate
coincided quite exactly with a reversal of fundamentals in the direction of
depreciation, as shown by the stochastic trend, while the currency itself had
started to reverse course about a week before, tugging the daily tracking along
by the autoregressive component. Here it is not easy to distinguish between
some arguable anticipation effect of the IOF change and a mere reassertion of
the fundamental value of the currency (the stochastic trend, which had been
trailing the actual movements of the currency, eventually reigning back in an FX
rate that had gotten ahead of itself). In any case, there is no surprise in the fact
that, immediately following the IOF change, the currency itself and the model-
based tracking, given their autoregressive character, should not have fully
reflected the depreciation bout coincidentally displayed by the stochastic trend at
that juncture. The evidence adduced by the stochastic trend, therefore, seems
consistent with the earlier verdict of no major effect from the IOF on that
occasion.
Chart 11: Daily BRL tracking and stochastic trend (September 1, 2009 to January 31,
2010)
Source: Bloomberg and BTG Pactual
Now consider the effect of the changes announced on October 4, 2010 (chart
12 ). The currency had been appreciating, again ahead of its stochastic trend.
Following the announcement, the stochastic trend happened to nosedive (by
sheer coincidence, as there is presumably no channel for such an effect from the
IOF to the fundamental drivers, and hence to the stochastic trend), but the actual
BRL and the daily tracking responded in a more muted way to the extra
fundamental push for appreciation. That is again no surprise given their
autoregressive behavior. By mid-October, the BRL, the daily tracking and the
stochastic trend all turned around at the exact same time, the reversal being

8/3/2019 Brazil Economic Comment 11-03-2010
http://slidepdf.com/reader/full/brazil-economic-comment-11-03-2010 11/16
Brazil Economic Comment3 November 2010
page 11
naturally more marked for the stochastic trend than for the two other series.
Again, none of these movements seems inconsistent with the IOF having had no
major effect on FX rate dynamics.
Chart 12: Daily BRL tracking and stochastic trend (September 1 to October 29, 2010)
Source: Bloomberg and BTG Pactual
The more interesting piece of evidence, in our view, is that presented by the
stochastic trend right after the October 18 announcement. As can be seen in
chart 12 – or, in a further magnified version, in chart 13 – the stochastic trend
remained rather stable at its prior level, while the actual BRL did depreciate and
the daily tracking followed suit (although naturally trailing to some extent, as
indicated by the tracking gaps turning more clearly negative). Stability of the
stochastic trend means that fundamentals, as they jointly matter for the daily
tracking, remained stable as well. Therefore, during the period the daily tracking
has been depreciating mainly as a result of the tugging power of its
autoregressive term, which is in turn driven by the actual depreciation of the
BRL. One may note that, just prior to the October 2009 IOF announcement for
instance, the BRL also moved without contemporaneous justification from
fundamentals. But it was then reverting to the stochastic trend (as can be seen in
chart 11 above), which might have been just a belated reflection of the current
position of fundamentals, whereas more recently it moved away from that
fundamental “attractor” level. All this suggests that the latest depreciation
movement, while closely followed by the daily tracking, has not been truly
fundamental in nature (at least not as far as the fundamentals considered in ourmodel are concerned). The coincident timing of the latest IOF changes may
suggest, in principle, that these changes are the explanatory factor.
1.60
1.62
1.64
1.66
1.68
1.70
1.72
1.74
1.76
1.78
1.80
1.82
1.84
1.86
1.88
0 1 - J u l - 1 0
0 6 - J u l - 1 0
1 1 - J u l - 1 0
1 6 - J u l - 1 0
2 1 - J u l - 1 0
2 6 - J u l - 1 0
3 1 - J u l - 1 0
0 5 - A u g - 1 0
1 0 - A u g - 1 0
1 5 - A u g - 1 0
2 0 - A u g - 1 0
2 5 - A u g - 1 0
3 0 - A u g - 1 0
0 4 - S e p - 1 0
0 9 - S e p - 1 0
1 4 - S e p - 1 0
1 9 - S e p - 1 0
2 4 - S e p - 1 0
2 9 - S e p - 1 0
0 4 - O c t - 1 0
0 9 - O c t - 1 0
1 4 - O c t - 1 0
1 9 - O c t - 1 0
2 4 - O c t - 1 0
2 9 - O c t - 1 0
Daily BRL tracking
BRL
Stochastic trend
IOF 4% IOF 6%

8/3/2019 Brazil Economic Comment 11-03-2010
http://slidepdf.com/reader/full/brazil-economic-comment-11-03-2010 12/16
Brazil Economic Comment3 November 2010
page 12
Chart 13: Daily BRL tracking (October 1 to October 29, 2010)
Source: Bloomberg and BTG Pactual
It is important not to get carried away by that observation, however. So far, the
gap between the level suggested by our stochastic trend and the actual value of
the BRL has remained quite modest (on October 29, the stochastic trend stood
at BRL1.68/USD while the actual FX rate was BRL1.70/USD). There have also
been prior occasions in which the BRL depreciated away from the stochastic
trend, being partially followed by the daily tracking thanks to its autoregressive
term, but such movement was neither associated with contemporaneous
changes in the IOF taxes nor, for that matter, was it very lasting either (one suchexample can be seen in the second half of December 2009, in chart 11 above).
Conclusions
A cursory comparison between the actual trajectory of the BRL and its
fundamentals-based daily tracking shows little scope for the changes in IOF
taxation since 2009 to have had a significant effect on the FX rate. Looking more
closely at the pattern of gaps between the tracking and the actual FX rate, one
may find evidence of a small effect. But it is exactly because the effect is indeed
small – a couple of centavos in the BRL price of one US dollar – both in absolute
terms and in relation to the overall fluctuations of the currency, that it does not
stand out in the more cursory comparison between the tracking and the actualFX rate. Judging from the 2009 experience, this effect is also short-lived.
Bringing in evidence from the stochastic trend for the currency (the value to
which it should converge, according to the daily tracking model, if the
fundamentals remained forever at their current level), the case for effectiveness
of the IOF measures gets a little reinforcement. In this connection, one can
hardly make much of instances – as around the October 4, 2010 measures – in
which the BRL (together with its daily tracking) moved by less than the stochastic
trend, given the characteristic inertial behavior of the FX rate (captured by the
8/3/2019 Brazil Economic Comment 11-03-2010
http://slidepdf.com/reader/full/brazil-economic-comment-11-03-2010 13/16
Brazil Economic Comment3 November 2010
page 13
autoregressive term in the tracking model). Likewise, it is hard to make much of
instances in which the BRL moves by more than justified by strictly
contemporaneous fluctuations in fundamentals – as right prior to the October
2009 measures – but does so in order to revert to the stochastic trend – which
should work, after all, as an “attractor” for the value of the currency. But, when
the BRL depreciates away from the stochastic trend – as it did, for instance,
following the October 18, 2010 measures – one might suspect that the
movement was related to the contemporaneous IOF increase. The evidence is
not conclusive, as the same phenomenon has been observed at times when
there was no IOF change in the immediate vicinity. Moreover, not even the latter
effect – granting for the sake of argument that it could be attributed to the IOF
change of October 18 – has been very large.
In any event, the analysis above suggests a story for the FX rate in which the
main roles are played by the fundamental drivers contemplated in our tracking
model – namely commodity prices, the country risk premium and the value of the
USD against other major currencies – and any role played by the taxation of
capital flows has been minor. As mentioned above, it is also difficult to
distinguish between the effects of any given IOF tax change in its own right and,
on the other hand, those stemming from the heightened perception triggered by
each such change among market players that other, unknown forms of official
intervention in FX markets might be looming.
Eduardo Loyo Claudio Ferraz Livio Ribeiro

8/3/2019 Brazil Economic Comment 11-03-2010
http://slidepdf.com/reader/full/brazil-economic-comment-11-03-2010 14/16
Brazil Economic Comment3 November 2010
page 14
Required DisclaimerThis report has been prepared by Banco BTG Pactual S.A. The figures contained inperformance charts refer to the past; past performance is not a reliable indicator of futureresults. Additional information will be made available upon request.
Analyst Certification
Each research analyst primarily responsible for the content of this investment researchreport, in whole or in part, hereby certifies that:
- all of the views expressed accurately reflect his or her personal views about thosesecurities or issuers, and such recommendations were elaborated independently, includingin relation to Banco BTG Pactual S.A. and/or its affiliates, as the case may be;
- no part of his or her compensation was, is, or will be, directly or indirectly, related to theany specific recommendations or or views contained herein or linked to the pricing of anyof the securities discussed herein.
Research analysts contributing to this report who are employed by a non-US Broker dealerare not registered/qualified as research analysts with the NASD and NYSE and thereforeare not subject to the restrictions contained in the NASD and NYSE rules oncommunications with a subject company, public appearances, and trading securities heldby a research analyst account.

8/3/2019 Brazil Economic Comment 11-03-2010
http://slidepdf.com/reader/full/brazil-economic-comment-11-03-2010 15/16
Brazil Economic Comment3 November 2010
page 15
Global Disclaimer
This report has been prepared by Banco BTG Pactual S.A. (“BTG Pactual S.A.”). BTG Pactual US Capital Corp. (“BTG”),a broker-dealer registered with the U.S. Securities and Exchange Commission and a member of the Financial IndustryRegulatory Authority and the Securities Investor Protection Corporation, is distributing this report in the United States.BTG assumes responsibility for this research for purposes of U.S. law. Any U.S. person receiving this report and wishing
to effect any transaction in a security discussed in this report should do so with BTG at 212-293-4600, 623 Fifth Avenue,New York, NY 10022-6831. BTG Pactual Europe LLP (“BTG UK”), a firm regulated and authorised by the FinancialServices Authority, is distributing this report in the United Kingdom and elsewhere in the European Economic Area.
References herein to BTG include BTG Pactual S.A. and BTG UK, as applicable.
This report is for distribution only under such circumstances as may be permitted by applicable law. This report is notdirected at you if BTG is prohibited or restricted by any legislation or regulation in any jurisdiction from making it availableto you. You should satisfy yourself before reading it that BTG is permitted to provide research material concerninginvestments to you under relevant legislation and regulations.
Nothing in this report constitutes a representation that any investment strategy or recommendation contained herein issuitable or appropriate to a recipient’s individual circumstances or otherwise constitutes a personal recommendation. It ispublished solely for information purposes, it does not constitute an advertisement and is not to be construed as asolicitation, offer, invitation or inducement to buy or sell any securities or related financial instruments in any jurisdiction.Prices in this report are believed to be reliable as of the date on which this report was issued and are derived from one ormore of the following: (i) sources as expressly specified alongside the relevant data; (ii) the quoted price on the mainregulated market for the security in question; (iii) other public sources believed to be reliable; or (iv) BTG's proprietarydata or data available to BTG. All other information herein is believed to be reliable as of the date on which this reportwas issued and has been obtained from public sources believed to be reliable. No representation or warranty, eitherexpress or implied, is provided in relation to the accuracy, completeness or reliability of the information contained herein,except with respect to information concerning BTG Pactual S.A., its subsidiaries and affiliates, nor is it intended to be acomplete statement or summary of the securities, markets or developments referred to in the report. In all cases,investors should conduct their own investigation and analysis of such information before taking or omitting to take anyaction in relation to securities or markets that are analyzed in this report.
BTG does not undertake that investors will obtain profits, nor will it share with investors any investment profits nor acceptany liability for any investment losses. Investments involve risks and investors should exercise prudence in making theirinvestment decisions. BTG accepts no fiduciary duties to recipients of this report and in communicating this report is notacting in a fiduciary capacity. The report should not be regarded by recipients as a substitute for the exercise of their own
judgment. Opinions, estimates, and projections expressed herein constitute the current judgment of the analystresponsible for the substance of this report as of the date in which was issued and are therefore subject to changewithout notice and may differ or be contrary to opinions expressed by other business areas or groups of BTG as a resultof using different assumptions and criteria. Any such opinions, estimates, and projections must not be construed as arepresentation that the matters referred to therein will occur. Prices and availability of financial instruments are indicativeonly and subject to change without notice.
Research will initiate, update and cease coverage solely at the discretion of BTG Investment Bank ResearchManagement. The analysis contained herein is based on numerous assumptions. Different assumptions could result inmaterially different results. The analyst(s) responsible for the preparation of this report may interact with trading deskpersonnel, sales personnel and other constituencies for the purpose of gathering, synthesizing and interpreting marketinformation. BTG is under no obligation to update or keep current the information contained herein, except whenterminating coverage of the companies discussed in the report. BTG relies on information barriers to control the flow ofinformation contained in one or more areas within BTG, into other areas, units, groups or affiliates of BTG. Thecompensation of the analyst who prepared this report is determined by research management and senior management(not including investment banking). Analyst compensation is not based on investment banking revenues, however,compensation may relate to the revenues of BTG Investment Bank as a whole, of which investment banking, sales andtrading are a part.
The securities described herein may not be eligible for sale in all jurisdictions or to certain categories of investors.Options, derivative products and futures are not suitable for all investors, and trading in these instruments is considered
risky. Mortgage and asset-backed securities may involve a high degree of risk and may be highly volatile in response tofluctuations in interest rates and other market conditions. Past performance is not necessarily indicative of future results.If a financial instrument is denominated in a currency other than an investor’s currency, a change in rates of exchangemay adversely affect the value or price of or the income derived from any security or related instrument mentioned in thisreport, and the reader of this report assumes any currency risk.
This report does not take into account the investment objectives, financial situation or particular needs of any particularinvestor. Investors should obtain independent financial advice based on their own particular circumstances beforemaking an investment decision on the basis of the information contained herein. For investment advice, trade executionor other enquiries, clients should contact their local sales representative. Neither BTG nor any of its affiliates, nor any oftheir respective directors, employees or agents, accepts any liability for any loss or damage arising out of the use of all orany part of this report.
Any prices stated in this report are for information purposes only and do not represent valuations for individual securitiesor other instruments. There is no representation that any transaction can or could have been effected at those prices andany prices do not necessarily reflect BTG Pactual S.A. internal books and records or theoretical model-based valuationsand may be based on certain assumptions. Different assumptions, by BTG Pactual S.A. or any other source, may yieldsubstantially different results.
This report may not be reproduced or redistributed to any other person, in whole or in part, for any purpose, without theprior written consent of BTG Pactual S.A. and BTG accepts no liability whatsoever for the actions of third parties in thisrespect.
Additional information relating to the financial instruments discussed in this report is available upon request.
Opinions, estimates, and projections expressed herein constitute the current judgment of the analyst responsible for the
substance of this report as of the date in which was issued and are therefore subject to change without notice and maydiffer or be contrary to opinions expressed by other business areas or groups of BTG as a result of using differentassumptions and criteria.
Because the personal views of analysts may differ from one another, BTG, BTG Pactual S.A., its subsidiaries andaffiliates may have issued or may issue reports that are inconsistent with, and/or reach different conclusions from, theinformation presented herein.
BTG and its affiliates have in place arrangements to manage conflicts of interest that may arise between them and theirrespective clients and among their different clients. BTG and its affiliates are involved in a full range of financial andrelated services including banking, investment banking and the provision of investment services. As such, any of BTG orits affiliates may have a material interest or a conflict of interest in any services provided to clients by BTG or suchaffiliate. Business areas within BTG and among its affiliates operate independently of each other and restrict access bythe particular individual(s) responsible for handling client affairs to certain areas of information where this is necessary inorder to manage conflicts of interest or material interests.
Any of BTG and its affiliates may: (a) have other business relationships, including investment banking relationships, withthe companies, or related entities, that are analyzed in this report; (b) be a financial adviser to the companies, or relatedentities, that are analyzed in this report, or be acting for such entities in a takeover bid by or for any of them; (c) producethis report pursuant to an agreement with any company that is analyzed in this report; (d) have disclosed this report tocompanies that are analyzed herein and subsequently amended this report prior to publication; (e) give investment advice

8/3/2019 Brazil Economic Comment 11-03-2010
http://slidepdf.com/reader/full/brazil-economic-comment-11-03-2010 16/16
Brazil Economic Comment3 November 2010
page 16
or provide other services to another person about or concerning any securities that are discussed in this report, whichadvice may not necessarily be consistent with or similar to the information in this report; (f) act as first purchaser,underwriter, manager or arranger and/or buy, offer, place or sell securities as principal or as agent, in relation to securitiesthat are discussed in this report; (g) trade (or have traded) for its own account (or for or on behalf of clients), have ei ther along or short position in the securities that are discussed in this report (and may buy or sell such securities), or otherwisepursue its legitimate business as a market maker or dealer (including entering into an agreement for the underwriting ofan issue of financial ins truments) in connection with the securities that are discussed i n this report; and/or (h) buy and sellunits in a collective investment scheme where it is the trustee or operator (or an adviser) to the scheme, which units mayreference securities that are discussed in this report.
Any director, employee or agent of any of BTG or its affiliates may receive remuneration that is tied to investment bankingtransactions performed by BTG or an affiliate, and/or may, although not involved in the preparation of this report, beaware of conflicts of interests of BTG or an affiliate in relation to securities or companies discussed in this report that havenot been disclosed by the individuals involved in the preparation of this report.
This report is for distribution only to persons who (i) have professional experience in matters relating to investments fallingwithin Article 19(5) of the Financial Services and Markets Act 2000 (Financial Promotion) Order 2005 (as amended, the"Financial Promotion Order"), (ii) are persons falling within Article 49(2)(a) to (d) ("high net worth companies,unincorporated associations etc") of the Financial Promotion Order, (iii) are outside the United Kingdom, or (iv) arepersons to whom an invitation or inducement to engage in investment activity (within the meaning of section 21 of theFinancial Services and Markets Act 2000) in connection with the issue or sale of any securities may otherwise lawfully becommunicated or caused to be communicated (all such persons together being referred to as "relevant persons"). Thisreport is directed only at relevant persons and must not be acted on or relied on by persons who ar e not relevant persons.Any investment or investment activity to which this report re lates is available only to relevant persons and will be engagedin only with relevant persons.