Embed Size (px)
Citation preview

Brazil-China: Social ExchangesBrazil-China: Social Exchanges
Marcelo Neri Minister of Strategic Affairs

• Brazil: Middle of the World & the Middle Path• Quality of Development• Public Policies Agenda
Brazil-China: Social ExchangesBrazil-China: Social Exchanges

% Population with Income % Population with Income Below Below U$ 1.25 per day PPPU$ 1.25 per day PPP
Source: IPEA / SAE from PNUD
Brazil: Middle of the World
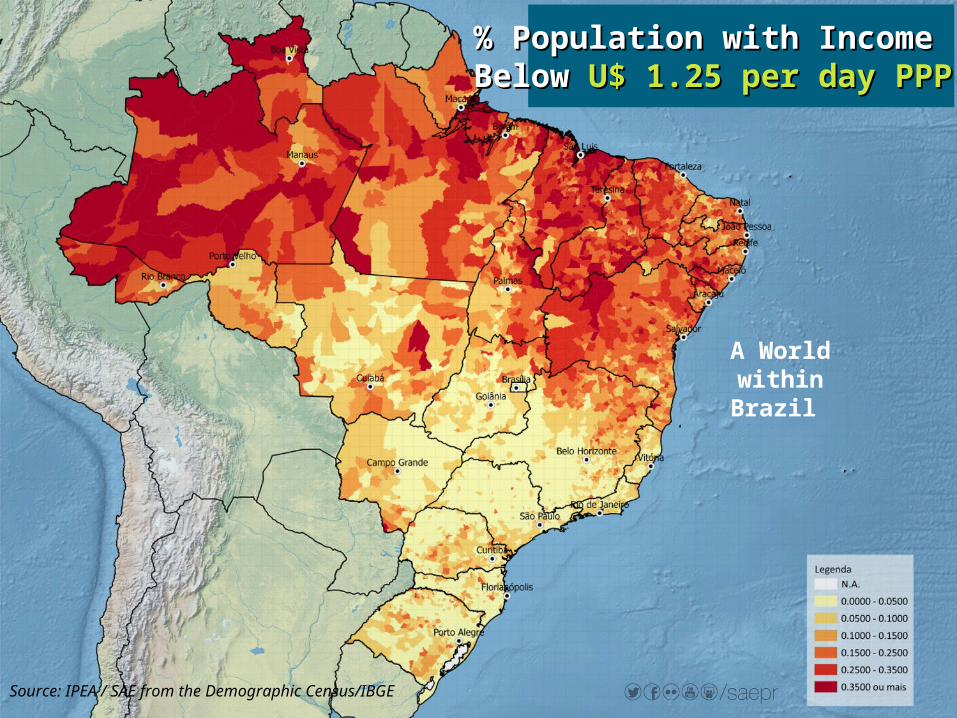
Source: IPEA / SAE from the Demographic Census/IBGE
% Population with Income % Population with Income Below Below U$ 1.25 per day PPPU$ 1.25 per day PPP
A World within Brazil

US
ChinaBrazil
Russia
India
1
10
20
30
40
50
60
70
80
90
100
Perc
entil
e of
the
Wor
ld In
com
e D
istr
ibuti
on
1 25 50 75 100
Each CountrySource: Milanovic (2011); see Neri (2011)
Income Distribution Income Distribution Relative to the WorldRelative to the World
Brazilian Per Capita GDP (PPP) is93.7% of the World GDP
*

Source: Milanovic (2011); see Neri (2011)
Brazil Brazil is a Small World (photo & Movie)is a Small World (photo & Movie)
1950 1960 1970 1980 1990 20092011
20002001
Year
Gin
i Coe
ffici
ent
.75
.65
.55
.45
0.535
0.5810.589
0.607
0.527
0.539
0.594
China Effect Chindia Effect
Inequality Across Nations
*

Fonte: IPEA a partir dos microdados da PNAD/IBGE
Cumulative growth rates of per capita income vintiles between 2001-2012(%)
Income Distribution ChangesIncome Distribution Changes

Income Distribution DynamicsRates of Changes Per YearEvolution 2000s Circa 2007
20% Less 20% RichestBrazil 6,30% 1,70%India 1% 2,80%China 8,50% 15%South Africa 5,80% 7,60%
Brazil X BRICS
Copyright © marcelo neri

Component that Explains
Proportion of Extremely Poor
% of Total Fall (69,3%)
Income Growth 50.5%
Inequality Fall 49.5%
Dynamic Decomposition of Extreme Poverty fall of 69,3% in
Brazil Between 2002-2012
Source: Ipea/Sae from Pnad/IBGE microdata
What best explains Inclusion?What best explains Inclusion? Growth or Equity?Growth or Equity?
The Middle PathThe Middle Path

ProsperityGrowth in mean income and
consumption (not only GDP/National
Accounts but also look to
Household Surveys data).
Sustainability
Ability to maintain the standards of living
achieved. Stocks of human,
environmental,
physical , cultural and social assets.
EquityLooking at the distribution among
individuals and social groups of
income flows, stocks of assets and
rights.
SensibilityThe last dimension is subjective, based on
people’s percepction about the
country, the public services and life
quality.
Inclusive Sustainable Development?Inclusive Sustainable Development?
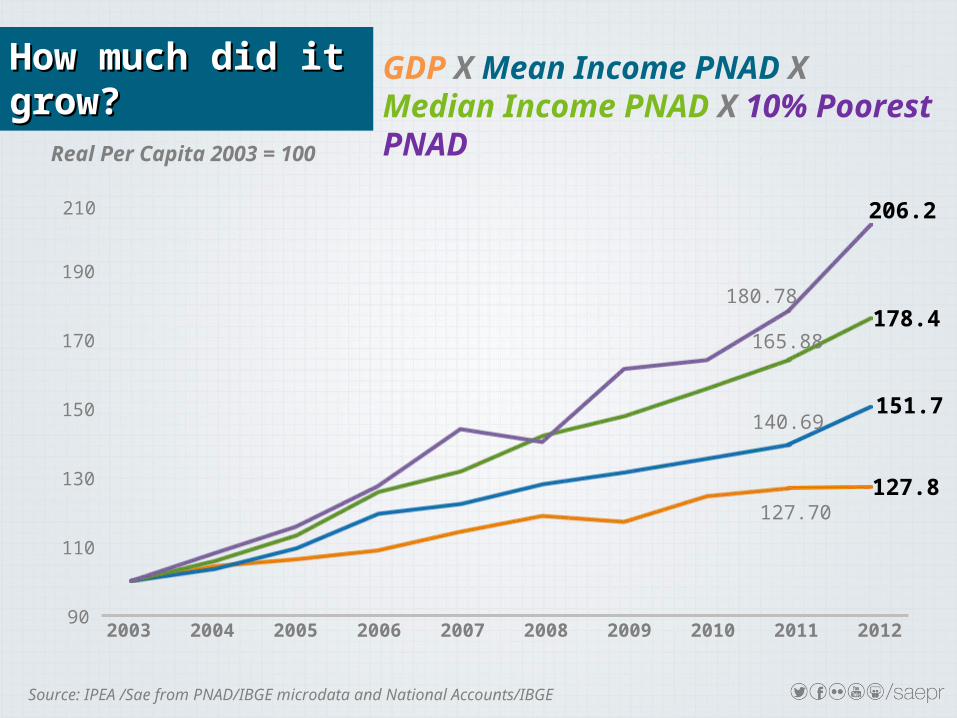
GDP X Mean Income PNAD X Median Income PNAD X 10% Poorest PNAD
190
170
150
130
110
2004 2005 2007 20122003
210
902006 2008 2009 2010 2011
Real Per Capita 2003 = 100
127.70
140.69
165.88
180.78
127.8
151.7
178.4
206.2
How much did it grow? How much did it grow?
Source: IPEA /Sae from PNAD/IBGE microdata and National Accounts/IBGE
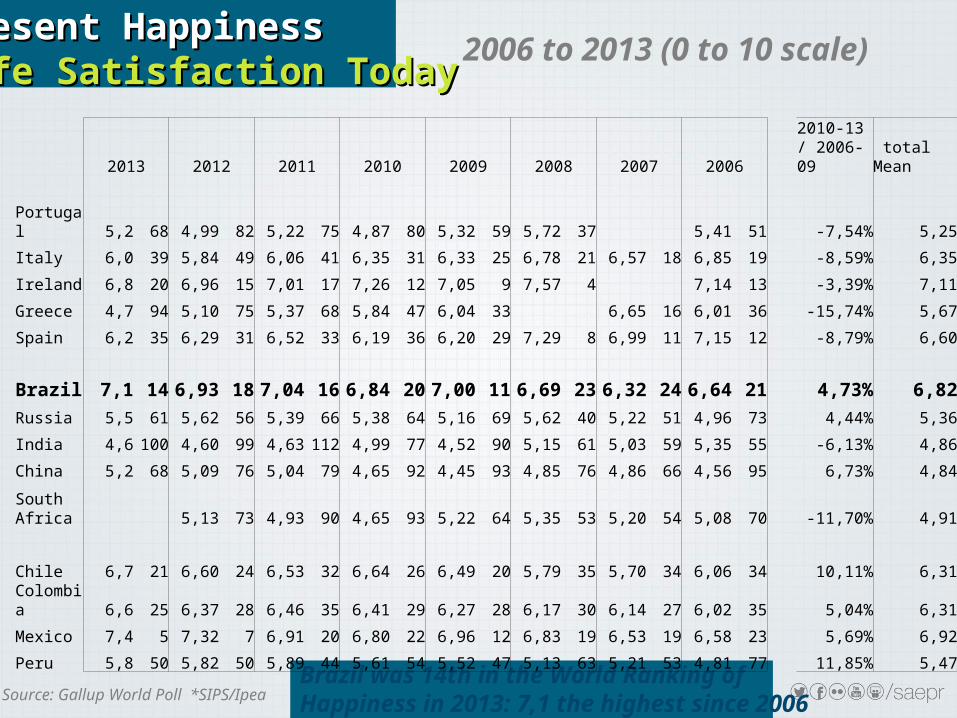
Brazil was 14th in the World Ranking of Happiness in 2013: 7,1 the highest since 2006
Present HappinessPresent HappinessLife Satisfaction TodayLife Satisfaction Today
2006 to 2013 (0 to 10 scale)
Source: Gallup World Poll *SIPS/Ipea
2013 2012 2011 2010 2009 2008 2007 20062010-13 / 2006-09 total Mean
Portugal 5,2 68 4,99 82 5,22 75 4,87 80 5,32 59 5,72 37 5,41 51 -7,54% 5,25
Italy 6,0 39 5,84 49 6,06 41 6,35 31 6,33 25 6,78 21 6,57 18 6,85 19 -8,59% 6,35
Ireland 6,8 20 6,96 15 7,01 17 7,26 12 7,05 9 7,57 4 7,14 13 -3,39% 7,11
Greece 4,7 94 5,10 75 5,37 68 5,84 47 6,04 33 6,65 16 6,01 36 -15,74% 5,67
Spain 6,2 35 6,29 31 6,52 33 6,19 36 6,20 29 7,29 8 6,99 11 7,15 12 -8,79% 6,60
Brazil 7,1 14 6,93 18 7,04 16 6,84 20 7,00 11 6,69 23 6,32 24 6,64 21 4,73% 6,82Russia 5,5 61 5,62 56 5,39 66 5,38 64 5,16 69 5,62 40 5,22 51 4,96 73 4,44% 5,36
India 4,6 100 4,60 99 4,63 112 4,99 77 4,52 90 5,15 61 5,03 59 5,35 55 -6,13% 4,86
China 5,2 68 5,09 76 5,04 79 4,65 92 4,45 93 4,85 76 4,86 66 4,56 95 6,73% 4,84
South Africa 5,13 73 4,93 90 4,65 93 5,22 64 5,35 53 5,20 54 5,08 70 -11,70% 4,91
Chile 6,7 21 6,60 24 6,53 32 6,64 26 6,49 20 5,79 35 5,70 34 6,06 34 10,11% 6,31
Colombia 6,6 25 6,37 28 6,46 35 6,41 29 6,27 28 6,17 30 6,14 27 6,02 35 5,04% 6,31
Mexico 7,4 5 7,32 7 6,91 20 6,80 22 6,96 12 6,83 19 6,53 19 6,58 23 5,69% 6,92
Peru 5,8 50 5,82 50 5,89 44 5,61 54 5,52 47 5,13 63 5,21 53 4,81 77 11,85% 5,47

Are you satisfied with the city or area where you live?
varabsolute relative absolute relative absolute relative absolute relative 2006-09 x 2010-12
Brazil 76,33% 75 65% 79,31% 69 57% 78,35% 83 56% 73,25% 96 74% -2,26%Russia 80,07% 66 57% 76,24% 81 66% 73,40% 103 70% 76,70% 86 66% -4,86%India 83,93% 45 39% 82,28% 56 46% 83,21% 65 44% 76,42% 89 68% -7,60%China 75,86% 77 67% 77,78% 78 64% 79,29% 77 52% 80,83% 69 53% 0,68%South Africa 54,75% 109 95% 58,66% 116 95% 62,86% 136 92% 55,11% 127 98% -11,08%
Portugal 89,34% 23 20% 89,33% 27 22% 89,15% 32 22% 88,66% 33 25% -1,47%Italy 83,07% 51 44% 79,72% 67 55% 77,82% 88 59% 76,51% 88 68% -3,16%Ireland 92,77% 9 8% 90,76% 16 13% 93,89% 11 7% 91,09% 25 19% -1,94%Greece 81,92% 57 50% 81,23% 63 52% 74,96% 98 66% 80,51% 71 55% -4,10%Spain 91,95% 15 13% 88,63% 29 24% 88,34% 39 26% 88,67% 32 25% -3,63%
Chile 83,11% 50 43% 81,76% 60 49% 81,19% 72 49% 83,30% 60 46% 4,95%Colombia 84,33% 43 37% 82,40% 55 45% 83,95% 63 43% 85,56% 47 36% -0,33%Mexico 80,19% 65 57% 72,91% 89 73% 78,20% 85 57% 81,01% 68 52% -6,19%Peru 73,94% 84 73% 77,45% 79 65% 76,14% 93 63% 75,12% 94 72% 4,52%first 96,88% Turkmenistan 95,10% Luxembourg 97,72% Turkmenistan 95,62% Turkmenistanlast 41,53% Senegal 44,51% Sierra Leone 25,36% Senegal 39,85% Syriatotal number of countries
2009 2010rank
115 122 148 130
2011 2012rank rank rank

Is the city or area where you live a good place to live for immigrants from other countries?
Is the city or area where you live a good place or not a good place to live for immigrants from other countries?Yes var
absolute relative absolute relative absolute relative 2006-09 x 2010-12
Brazil . 80,74% 17 15% 80,86% 17 14% 75,76% 31 24% -3,01%Russia 59,68% 69,59% 47 41% 68,86% 47 39% 65,92% 62 48% 4,26%India . 64,87% 60 52% 41,53% 111 92% 41,40% 119 93% -36,09%China . . . . 53,53% 94 78% 60,62% 79 62% #DIV/0!South Africa . 64,10% 62 54% 56,73% 90 74% 58,23% 90 70% -10,33%
Portugal 81,04% 75,29% 29 25% 85,04% 10 8% 83,10% 15 12% 7,56%Italy . 71,56% 39 34% 67,25% 55 45% 74,67% 35 27% -0,84%Ireland 88,25% 87,87% 6 5% 87,16% 5 4% 87,26% 8 6% -0,97%Greece . . . . 62,40% 74 61% 41,92% 118 92% #DIV/0!Spain . 86,53% 7 6% 84,54% 11 9% 83,56% 14 11% -2,87%
Chile 75,62% 70,08% 44 38% 71,07% 40 33% 73,88% 38 30% -0,52%Colombia 77,07% 61,37% 70 61% 70,07% 44 36% 69,91% 51 40% 1,11%Mexico . 61,33% 71 62% 53,14% 97 80% 55,67% 99 77% -11,29%Peru 66,99% 60,63% 74 64% 69,53% 46 38% 69,81% 52 41% 9,19%first 90,11% 91,65% Canada 91,29% Australia 93,18% Canadalast 30,95% 16,85% Thailand 20,60% Malaysia 20,07% Malaysiatotal number of countries
2010rank rank rank
87 115 121 128
20122006 2008

• Macro: Savings and Productivity
• Demographic Transition & Urbanization (avoid Brazilianization): Youth and Immigration
• Exchange of Integrated Social Policies: Poverty and the New Middle Class
• Countries groups: BRICS, BIGs & Chisil
Main Challenges: Main Challenges: Strategic AgendaStrategic Agenda
References & Links
Comunicado do Ipea nº 158 http://www.ipea.gov.br/portal/images/stories/PDFs/comunicado/121218_comunicadoipea158.pdf e http://www.cps.fgv.br/cps/Pesquisas/miseria_queda_grafico_clicavel/FLASH/index.htm
Comunicado do Ipea nº 159 http://www.ipea.gov.br/portal/images/stories/PDFs/comunicado/131001_comunicado159.pdf
Human Development Map – Brazilian Cities (English)http://atlasbrasil.ipea.gov.br/
Report on the Millenium Development Goals (MDGs) (English) http://www.sae.gov.br/site/?p=23274
Bolsa Família Program (English)http://www.sae.gov.br/site/?p=22177 e7www.wwp.org.br
The New Middle Class (English)http://www.cps.fgv.br/cps/livroncm/ & ttp://www.sae.gov.br/site/?p=22297
Short Videohttps://www.youtube.com/watch?feature=player_embedded&v=g8I-0kwFCTI


![Neri SAE DIS Curto CAM.ppt [Modo de Compatibilidade] · Desenvolvimento Inclusivo Sustentável? As Novas Transformações Brasileiras Marcelo Neri –SAE macneri@gmail.com Roteiro:](https://img.dokumen.tips/doc/110x75/5f0b0c747e708231d42e98b4/neri-sae-dis-curto-camppt-modo-de-compatibilidade-desenvolvimento-inclusivo-sustentvel.jpg)