Embed Size (px)
Citation preview

Bra
nd
sm
c 3
01

Contents
Equity 4-7
Derivatives 8-9
Commodity 10-13
Currency 14
IPO 15
FD Monitor 16
Mutual Fund 17-18
SMC RESEARCH TEAM
REGISTERED OFFICES:
11 / 6B, Shanti Chamber, Pusa Road, New Delhi 110005.
Tel: 91-11-30111000, Fax: 91-11-25754365
MUMBAI OFFICE:
Dheeraj Sagar, 1st Floor, Opp. Goregaon sports Club, Link Road
Malad (West), Mumbai 400064
Tel: 91-22-67341600, Fax: 91-22-28805606
KOLKATA OFFICE:
18,Rabindra Sarani, Poddar Court, Gate No-4,5th Floor, Kolkata-700001
Tel : 91-33-39847000 Fax No : 91-33-39847004
AHMEDABAD OFFICE :
10/A, 4th Floor, Kalapurnam Building, Near Municipal Market,
C G Road, Ahmedabad-380009, Gujarat
Tel : 91-79-26424801 - 05, 40049801 - 03
CHENNAI OFFICE:
Salzburg Square, Flat No.1, III rd Floor, Door No.107, Harrington Road,
Chetpet, Chennai - 600031.
Tel: 044-39109100, Fax -044- 39109111
SECUNDERABAD OFFICE:
206, 3rd Floor, above CMR Exclusive, Bhuvana Towers, S.D.Road,
Secunderabad - 500003
Tel: 91-40-30780298/99, 39109536
DUBAI OFFICE:
312, Belshalat Building, Al Karama, Dubai, P.O. Box 117210, U.A.E.
Tel: 97143963120, Mobile : 971502612483
Fax : 9714 3963122
Email ID : [email protected]
Printed and Published on behalf of
Mr. Saurabh Jain @ Publication Address
11/6B, Shanti Chamber, Pusa Road, New Delhi-110005
Website: www.smcindiaonline.com
Investor Grievance : [email protected]
Printed at: S&S MARKETING
102, Mahavirji Complex LSC-3, Rishabh Vihar, New Delhi - 110092 (India)
Ph.: +91-11- 43035012, 43035014, Email: [email protected]
lobal stock markets remained jittery as the expectations of interest rate
hike by the U.S. Federal Reserve rose after Fed Chairwoman Jannet Yellen Gindicated that raising the borrowing cost is appropriate in 2015 in case
economy meets forecast. Greece continued to be a concern in Europe as securing
bailout funds from the creditors seems to be a daunting task for Greece.
Meanwhile, the China's central bank warned of deflationary pressure on Chinese
economy as it forecast subdued consumer prices for the year and a challenging
growth outlook. To note, in order to boost the Chinese economy, the Chinese
central bank has cut interest rates three times in six months. The expectation that
the government will accelerate stimulus measures to bolster the economy pushed
the stock markets higher. Minutes from the Bank of Japan's policy meeting said that
inflation in Japan won't hit a sustained 2% pace this year and any pickup in prices
could take considerable time.
Back at home, the domestic market witnessed volatility on the back of weak rupee
and expiry of May derivative contracts (on Thursday). On the data front, India's
merchandise exports declined 13.96% to $22.05 billion in April 2015 over April 2014.
Imports declined 7.48% to $33.04 billion in April 2015 over April 2014. More than half
of the BSE Sensitive Index companies that have reported earnings disappointed the
street and it looks that the expectation of growth in earnings would take a quarter
or two. Meanwhile, expectations of the timely arrival of the monsoon and cut in the
interest rates by the Reserve Bank of India in the ensuing monetary policy meeting
on 2nd June lifted the domestic markets sentiments and capped the downside.
Indian rupee too weakened recently reflecting foreign institutional investors
selling in equities and buying of the dollar by the importers to pay month end bills.
The trend in global markets, investment by foreign portfolio investors (FPIs), the
movement of the rupee as against the dollar and crude oil price movement will
dictate trend of the market in the coming days.
On the commodity front, bounce back in the dollar index compelled CRB to fall
further. In Base metal counter Lead and Zinc may continue their recovery on supply
crunch and increase in demand. Meanwhile, copper and nickel may remain in
range. Crude oil prices may get direction from an EIA inventory position,
geopolitical tensions in the Middle East and the movement of the dollar index.
Crude oil can move in the range of $55-$63 levels in NYMEX and 3500-3850 in MCX.
Manufacturing PMI of China, ISM Manufacturing, Unemployment Rate, Change in
Non-farm Payrolls and ISM Non-Manufacturing Composite of US, CPI and
Unemployment Rate of Germany, Reserve Bank of Australia Rate Decision, CPI and
GDP of EU, GDP of Australia, ECB and BoE Rate Decision, Unemployment Rate of
Canada, etc.; are some high events, which will show the health of major economies
and thus expected to give some directions to the commodity prices as well.
From The Desk Of Editor
(Saurabh Jain)
SMC Global Securities Limited is proposing, subject to receipt of requisite approvals, market conditions and other considerations, a further public offering of its equity shares and has filed the Draft Red Herring Prospectus with the Securities and Exchange Board of India (“SEBI”) and the Stock Exchanges. The Draft Red Herring Prospectus is available on the website of SEBI at www.sebi.gov.in and on the websites of the Book Running Lead Manager i.e., ICICI Securities Limited at www.icicisecurities.com and the Co- Book Running Lead Manager i.e., Elara Capital (India) Private Limited at www.elaracapital.com . Investors should note that investment in equity shares involves a high degree of risk and for details relating to the same, please see the section titled “Risk Factors” of the aforementioned offer document.
SMC Global Securities Ltd. (hereinafter referred to as “SMC”) is a registered Member of National Stock Exchange of India Limited, Bombay Stock Exchange Limited and its associate is member of MCX stock Exchange Limited. It is also registered as a Depository Participant with CDSL and NSDL. Its associates merchant banker and Portfolio Manager are registered with SEBI and NBFC registered with RBI. It also has registration with AMFI as a Mutual Fund Distributor.
SMC is in the process of making an application with SEBI for registering as a Research Entity in terms of SEBI (Research Analyst) Regulations, 2014. SMC or its associates has not been debarred/ suspended by SEBI or any other regulatory authority for accessing /dealing in securities Market.
SMC or its associates including its relatives/analyst do not hold any financial interest/beneficial ownership of more than 1% in the company covered by Analyst. SMC or its associates and relatives does not have any material conflict of interest. SMC or its associates/analyst has not received any compensation from the company covered by Analyst during the past twelve months. The subject company has not been a client of SMC during the past twelve months. SMC or its associates has not received any compensation or other benefits from the company covered by analyst or third party in connection with the research report. The Analyst has not served as an officer, director or employee of company covered by Analyst and SMC has not been engaged in market making activity of the company covered by Analyst.
The views expressed are based solely on information available publicly available/internal data/ other reliable sources believed to be true.
SMC does not represent/ provide any warranty express or implied to the accuracy, contents or views expressed herein and investors are advised to independently evaluate the market conditions/risks involved before making any investment decision.

NEWS
DOMESTIC NEWSEconomy• According to the credit rating agency Moody's, India's economic growth
rate in the January-March quarter is likely to slip to 7.2% from 7.5% in the previous three months, mainly on account of lower production and weak global demand.
Chemicals• BASF has set up a research and development centre for agrochemicals at
Lonikand, Pune, its first in the country, at an estimated investment of Rs 64 crore. The centre will focus on global agriculture research on herbicides, fungicides and insecticides and will also offer to tailor-made solutions to the farmers.
FMCG• Jyothy Laboratories may induct its detergent powder Mr White into its list
of power brands by next year. The move to induct Mr White, strong in the south, into its league of top brands, comes as the maker of Ujala fabric whitener looks to beef up this club.
Realty/Construction• Punj Lloyd has won a `542-crore road project in Bihar from National
Highways Authority of India (NHAI). The project is scheduled to be completed in 24 months. Punj Lloyd has executed over 16 highway projects of NHAI till date.
• DLF has kept the new sales bookings target for this financial year at last year's level of about ̀ 4,000 crore as the company feels that it would take at least 12 months for housing sales to improve.
Automobile• Mahindra & Mahindra unveiled an updated version of its sports utility
vehicle XUV500, with the price starting at `11.21 lakh (ex-showroom Delhi).While the entry level variant W4 is priced at `11.21 lakh, the highest trim W10 comes with a tag of ̀ 15.99 lakh.
Capital Goods• Crompton Greaves has received non-binding proposals from reputed
international entities for acquiring the company's European, North American and Indonesian power divisions. Separately, it has received firm offers for the Canadian power and the American transportation automation business (formerly QEI Inc.).
Metal• SAIL and Korean major Posco have decided to join hands again for setting
up a 1.5 million tonne per annum steel plant at Bokaro at a likely investment of R6,000 crore to cater to the growing demand from the automotive sector.
Oil and Gas• GAIL (India) has entered into an agreement to sell liquefied natural gas
(LNG) to Shell. The definitive agreement has been signed with Shell through its subsidiary in Singapore.
Pharmaceuticals• Cipla Ltd has signed an agreement with Serum Institute of India Ltd to
exclusively sell influenza vaccine Nasovac-S in India. Under this agreement, Serum Institute will develop and manufacture the vaccine, while Mumbai-based Cipla will exclusively market it in India.
INTERNATIONAL NEWS• US pending home sales index surged up 3.4 percent to 112.4 in April from a
slightly upwardly revised 108.7 in March. Economists had expected the index to increase by about 0.8 percent. A pending home sale is one in which a contract was signed but not yet closed. Normally, it takes four to six weeks to close a contracted sale.
• US initial jobless claims edged up to 282,000, an increase of 7,000 from the previous week's revised level of 275,000. The continued increase came as a surprise to economists, who had expected jobless claims to dip to 270,000 from the 274,000 originally reported for the previous week.
• US consumer confidence index rose to 95.4 in May from a downwardly revised 94.3 in April. Economists had expected the consumer confidence index to dip to 95.0 from the 95.2 originally reported for the previous month.
• US durable goods orders dipped by 0.5 percent in April, with the modest decrease matching economists' consensus estimate. Durable goods orders in March surged up by an upwardly revised 5.1 percent compared to the 4.4 percent jump that had been reported.
• Japan's unemployment rate dropped unexpectedly to a 18-year low in April. The jobless rate came in at a seasonally adjusted 3.3 percent in April, down slightly from 3.4 percent in the previous month. Economists had expected the rate to remain stable at 3.4 percent.
• Retail sales in Japan advanced 5.0 percent on year in April, the Ministry of Economy, Trade and Industry said on Thursday - coming in at 11.562 trillion yen.
EX-DATE COMPANY PURPOSE
1-Jun-15 Hero MotoCorp Dividend - Rs 30/- Per Share
3-Jun-15 Adani Enterprises Scheme Of Arrangement
4-Jun-15 IRB Infrastructure
Developers Interim Dividend
Developers Interim Dividend
4-Jun-15 ICICI Bank Dividend - Rs 5/- Per Share
5-Jun-15 Tata Consultancy Services Dividend - Rs 24/- Per Share
5-Jun-15 State Bank of Bikaner
and Jaipur Annual General Meeting
10-Jun-15 Oriental Bank of
Commerce Dividend - Rs 3.30/- Per Share
10-Jun-15 POLARIS CONSULTING &
SERVICES Final Dividend Rs 10/- Per Share
11-Jun-15 Torrent Power Dividend Rs 1.50 Per Share
12-Jun-15 Vijaya Bank Dividend - Rs 1.50 Per Share
15-Jun-15 Torrent Pharmaceuticals Dividend - Rs 6.25/- Per Share
15-Jun-15 Infosys Dividend - Rs 29.50/- Per Share
16-Jun-15 Bank of Baroda Dividend - Rs 3.20/- Per Share
17-Jun-15 Ashok Leyland Dividend - Re 0.45 Per Share
18-Jun-15 Allahabad Bank Dividend - Rs 1.63/- Per Share
18-Jun-15 Welspun India Final Dividend - Rs 7.50/- Per Share
18-Jun-15 Syndicate Bank Dividend - Rs 4.70/- Per Share
19-Jun-15 Essel Propack Dividend Rs 1.60 Per Share
19-Jun-15 Hindustan Unilever Dividend - Rs 9/- Per Share
22-Jun-15 Punjab National Bank Dividend - Rs 3.30/- Per Share
23-Jun-15 Central Bank of India Dividend - Re 0.50/- Per Share
23-Jun-15 Indian Bank Dividend - Rs 4.20/- Per Share
24-Jun-15 Asian Paints Dividend - Rs 4.30/- Per Share
FORTHCOMING EVENTS
NOTES:1) These levels should not be confused with the daily trend sheet, which is sent every morning by e-mail in the name
of "Morning Mantra ".2) Sometimes you will find the stop loss to be too far but if we change the stop loss once, we will find more strength
coming into the stock. At the moment, the stop loss will be far as we are seeing the graphs on weekly basis and taking a long-term view and not a short-term view.
TREND SHEET
Stocks *Closing Trend Date Rate SUPPORT RESISTANCE Closing
Price Trend Trend
Changed Changed
SENSEX 27828 DOWN 30.04.15 27011 27900 28460
S&P NIFTY 8433 DOWN 30.04.15 8181 8500 8620
CNX IT 11575 DOWN 24.04.15 11132 11900 12200
CNX BANK* 18721 DOWN 20.03.15 18606 - 19000
ACC 1512 DOWN 20.03.15 1570 1550 1580
BHARTIAIRTEL 426 UP 13.03.15 400 405 395
BHEL** 252 DOWN 06.02.15 264 - 255
CIPLA 650 DOWN 24.04.15 638 690 710
DLF 118 DOWN 24.04.15 131 135 140
HINDALCO 129 DOWN 12.12.14 154 140 145
ICICI BANK 317 DOWN 06.02.15 329 331 340
INFOSYS 2023 DOWN 24.04.15 1995 2070 2100
ITC 327 DOWN 04.03.15 344 342 348
L&T 1654 DOWN 30.04.15 1631 1660 1690
MARUTI 3786 UP 19.09.13 1480 3550 3500
NTPC 137 DOWN 08.05.15 142 145 150
ONGC 330 DOWN 17.10.14 397 330 335
RELIANCE 877 UP 17.04.15 927 870 840
TATASTEEL 329 DOWN 29.05.15 328 350 360
S/l
4
®
Closing as on 29-05-2015*CNXBANK has breached the Resistance of 18700**BHEL has breached the Resistance of 250

BSE SENSEX GAINERS & LOSERS TOP (% Change) NSE NIFTY GAINERS TOP & LOSERS (% Change)
SECTORAL INDICES (% Change)
SMC Trend
SMC Trend
FMCGHealthcare
FTSE 100CAC 40
Auto BankRealty
Cap GoodsCons Durable
Oil & GasPower
NasdaqDow jonesS&P 500
NikkeiStrait times
Hang SengShanghai
ITMetal
Down SidewaysUp
GLOBAL INDICES (% Change)
INDIAN INDICES (% Change)
5
®
SMC Trend
Nifty Sensex BSE Midcap BSE Smallcap Nifty Junior S&P CNX 500
-1.65 -1.61
-0.56 -0.56
-1.56
-1.39
-1.80
-1.60
-1.40
-1.20
-1.00
-0.80
-0.60
-0.40
-0.20
Nifty Sensex BSE Midcap BSE Smallcap
Nifty Junior S&P CNX 500
0.00
-2.54
0.06
-0.34
2.08
-1.26
-2.66
-2.29
-1.86
0.22
0.48
-1.15
-3.00
-2.00
-1.00
0.00
1.00
2.00
3.00
Auto Index Bankex Cap Goods Index
Cons Durable Index
FMCG Index Healthcare Index
IT Index Metal Index Oil & Gas Index
Power Index Realty Index
0.17
1.42
-0.58
-0.25
-0.94
-1.92
-0.80
0.13
-0.10
-2.50
-2.00
-1.50
-1.00
-0.50
0.00
0.50
1.00
1.50
2.00
Nasdaq Comp. Dow Jones S&P 500 Nikkei Strait Times Hang Seng Shanghai Comp.
FTSE 100 CAC 40
276.28
3.71
168.43
-519.78
160.60 118.7085.60
455.40
790.30
-600.00
-400.00
-200.00
0.00
200.00
400.00
600.00
800.00
1000.00
Friday Monday Tuesday Wednesday Thursday
FII / FPI Activity MF Activity
7.69
2.241.75 1.58 1.58
-6.02-5.09 -4.95 -4.74 -4.61
-8.00
-6.00
-4.00
-2.00
0.00
2.00
4.00
6.00
8.00
10.00
B H E L Coal India O N G C Bharti Airtel Hero Motocorp
Tata Motors Vedanta Tata Steel Sun Pharma.Inds.
H D F C
7.99
4.53 4.243.02
2.29
-18.28
-5.89-4.88 -4.86 -4.82
-20.00
-15.00
-10.00
-5.00
0.00
5.00
10.00
B H E L B P C L Punjab Natl.Bank
Bank of Baroda
Coal India Tech Mahindra
Tata Motors Sun Pharma.Inds.
Tata Steel Ambuja Cem.
INSTITUTIONAL ACTIVITY (Equity) (` Crore)
Indian Markets were closed on 6th Mar.
Indian Markets were closed on 6th Mar.

Beat the street - Fundamental Analysis
Above calls are recommended with a time horizon of 8 to 10 months. Source: Company Website Reuters Capitaline
6
®
Investment Rationale shown considerable improvement in last few years. Although the recent Q-o-Q growth was flat •VA Tech Wabag is a multinational player in the but with strong order book and many projects to water treatment industry. The company offers completion, there can be substantial increase in complete life cycle solutions including revenues and profits in coming quarters. In FY conceptualization, design, engineering, 2016 , management has given guidelines related procurement, supply, installation, construction to revenue and it will be in the range of `2800-and O&M services.3000 crore & order intake will be in the range of •VA Tech Wabag Limited, which is involved in water `3500-3700 crore. Net Profit registered increased and waste water treatment, with strong Order by 4.5% as compared to last financial year and in book of `6,973 crore including framework the FY15, the company issue bonus shares from its contracts of `1,687 crore , recently won `220-General Reserves.crore order for the Jica-funded Ganga Action Plan
ValuationProject in Varanasi. It is further poised to gain Wabag's flexible model of shifting to municipal to more projects from Ganga Action Plan which has a industrial and domestic to international business is total outlay of ̀ 51,000 crore.quite robust. The company is pursuing both organic as •The management of the company is eyeing 15-20 well inorganic growth. The business units are equipped per cent share (worth ̀ 15,000-20,000 crore) in the with sectoral knowledge about clients. The stock of the water treatment business emerging from the Ganga company is trading at `740.85 per share at a PE of Action Plan project. The company is hopeful to 36.24x at par of 1 year average of 36.33x. The stock is leverage its core strength in technology with more expected to trade at ̀ 1029.00 per share presenting 39% than 100 patents which very few firms in India can upside potential in 8-10 months time frame. boost of and which makes it at par with some of the
top companies in the world.•In FY 2015, Indian business contributed 36% of the
total revenue out of which 70% of the projects related to government and rest of the World business accounted for 64% of the total revenue. After bagging some projects in Saudi Arabia, Turkey and Philippines, it is planning to enter Latin America and aim to increase its revenue share from foreign countries to 50:50 percent.
•The company has a sound Balance Sheet with ample reserves and having negligible burden related to debt so shareholders of the company will get good benefit in long run.
•The revenue and profits of the company has
Face Value (Rs.) 2.0052 Week High/Low 970.00/501.00M.Cap (Rs. in Cr.) 3990.43EPS (Rs.) 20.24P/E Ratio (times) 36.24P/B Ratio (times) 4.29Dividend Yield (%) 0.00Stock Exchange BSE
` in cr
% OF SHARE HOLDING
P/E Chart
VA TECH WABAG LIMITED CMP: 740.85 Upside: 39%Target Price: 1029
VALUE PARAMETERS
Actual Estimate
FY Mar-14 FY Mar-15 FY Mar-16
Revenue 2,230.20 2,428.40 3,053.10
EBITDA 209.00 211.20 284.80
EBIT 194.00 200.30 266.60
Pre-tax Profit 161.10 167.10 243.80
Net Income 118.40 110.10 162.20
EPS 22.01 20.20 29.41
BVPS 158.16 166.30 211.50
ROE 15.20 15.50 15.80
GATEWAY DISTRIPARKS LIMITED CMP: 351.20 Upside: 19%Target Price: 417
Investment Rationale of Gateway Rail. •Gateway Distriparks is the logistics facilitator with •During the quarter ended March 2015, the main
three verticals – Container Freight Stations (CFS), reason for increase in margins was costs savings and Inland Container Depots (ICD) with rail movement economies of scale with double stacking and hub of containers to major maritime ports, and Cold and spoke models helping the company. Chain Storage and Logistics. Management expects the rail business will be able
•In CFS business, the management aims of about 10% to easily maintain in FY'16, the overall margins that revenue growth in FY'16. New capacities and it achieved in FY'15, as well. increase in market share will drive the growth in ValuationFY'16. Jawaharlal Nehru Port Trust (JNPT) capacity Growth in port volumes & resulting increased addition in CFS business should result in further throughput at CFSs, increase in volume of rail higher volumes in FY'17. movement are expected to have positive impact on
•The company has utilized full Minimum Alternate Tax the Company's long term business and profitability. It (MAT) credit now. Also CFS business is fully taxable, is expected that the company surplus scenario is while Railways still continue to enjoy the MAT likely to continue going forward & will keep its benefits. So overall at company level effective tax growth story in the coming quarters also. Thus, it is rate will be around 23-25% for next couple of years. expected that the stock will see a price target of ̀ 417
•The 12 acre land in Gurgaon will be sold off in FY'16 in 8 to 10 months time frame on a target P/E of 23x by GDL. The funds will be either used by GDL for and FY16 (E) earnings of ̀ 29.41.expansion or to repay of the loan of about `160 crore that it had taken from Gateway Rail. The land will provide adequate space to support the Rail business of Gateway Rail division.
•Snowman Logistics, subsidiary of the company, will be adding 30,000 pallets in FY16 to the 85,500 pallets it now has. It will continue to expand as it explores new businesses and new niches for its established area of its activities.
•The company plans to list its subsidiary Gateway Rail Freight Ltd via an initial public offer (IPO). The funds will be either used for expansion or to repay loan that it had taken from Gateway Rail. The land will provide adequate space to support the business
Face Value (`) 10.00
52 Week High/Low 459.40/215.15
M.Cap (`Cr.) 3818.53
EPS (`) 17.27
P/E Ratio (times) 20.34
P/B Ratio (times) 4.05
Dividend Yield (%) 1.99
Stock Exchange BSE
VALUE PARAMETERS
% OF SHARE HOLDING
P/E Chart
` in cr
Actual Estimate FY Mar-14 FY Mar-15 FY Mar-16Revenue 1,008.10 1,105.00 1,238.90EBITDA 257.20 326.70 363.90EBIT 177.00 237.80 294.80Pre-tax Profit 166.20 226.60 289.90Net Income 135.80 187.80 193.30EPS 12.51 17.27 18.15BVPS 77.03 112.12 104.88ROE 16.70 21.30 17.70
32.96
24.09
3.77
32.86
6.31
Foreign
Institutions
Non Promoter Corporate Holding
Promoters
Public & Others
32.77
21.826.48
29.06
9.88
Foreign
Institutions
Non Promoter Corporate Holding
Promoters
Public & Others

Charts by Spider Software India Ltd
7
EQUITY
Above calls are recommended with a time horizon of 1-2 months
Disclaimer : research. The analysis contained in the analyst research is based on numerous assumptions. Different assumptions could result in materially different results.The analyst, not any of its affiliated companies, not any of their members, directors, employees or agents accepts any liability for any loss or damage arising out of the use of all or any part of the analysis research.
The analyst and its affiliates companies make no representation or warranty in relation to the accuracy, completeness or reliability of the information contained in its
SOURCE: CAPITAL LINE
®
The stock closed at ̀ 162.60 on 29th May 2015. It made a 52-week low at ̀ 142.70
on 08th May 2015 and a 52-week high at ̀ 228.90 on 23rd January 2015. The 200
days Exponential Moving Average (EMA) of the stock on the daily chart is
currently at ̀ 177.44.
After a sharp fall from 225 levels, it again rebound by forming fresh buying pivot
near 145 levels. Moreover, this reversal is getting support with the rise in
volumes and oscillators which were in the oversold condition. So, it is expected
that more upside will be seen in the near term. One can buy in the range of 159-
161 levels for the target of 173-175 levels with SL of 153 levels.
BANK OF BARODA
The stock closed at ̀ 120.50 on 29th May 2015. It made a 52-week low at ̀ 72.30
on 30th May 2014 and a 52-week high of ̀ 135.95 on 06th January 2015. The 200
days Exponential Moving Average (EMA) of the stock on the daily chart is
currently at ̀ 108.11.
As we can see on the chart, it is trading within a range of 115-125 levels from last
few months. This consolidation indicates that it will give a breakout and rise
sharply, so that it can come closer to its 52 week high. We anticipate that in the
near term there will be an upside moves which will help it to reach our desired
targets. One can buy in range of 119-120 levels for the target of 132-136 levels
with SL of 113 levels.
GUJARAT STATE PETRONET LIMITED

DERIVATIVES
CHANGE IN NIFTY OPTION OI (IN QTY)
WEEKLY VIEW OF THE MARKET
NIFTY OPTION OI CONCENTRATION (IN QTY)
CHANGE IN BANKNIFTY OPTION OI (IN QTY)BANKNIFTY OPTION OI CONCENTRATION (IN QTY)
®
GODREJIND (JUN FUTURE)
Buy: Above `384
Target: `394
Stop loss: `379
HINDALCO
Buy JUN 125. PUT 2.65
Sell JUN 120. PUT 1.40
Lot size: 2000
BEP: 123.75
Max. Profit: 7500.00 (3.75*2000)
Max. Loss: 2500.00 (1.25*2000)
OPTIONSTRATEGY
FUTURE
MARUTI
Buy JUN 3850. CALL 64.00
Sell JUN 3900. CALL 46.00
Lot size: 125
BEP: 3868.00
Max. Profit: 4000.00 (32.00*125)
Max. Loss: 2250.00 (18.00*125)
ASIANPAINT
Buy JUN 800. CALL 18.70
Sell JUN 820. CALL 11.70
Lot size: 250
BEP: 807.00
Max. Profit: 3250.00 (13.00*250)
Max. Loss: 1750.00 (7.00*250)
BULLISH STRATEGY
DERIVATIVE STRATEGIES
WIPRO (JUN FUTURE)
Buy: Above `571
Target: `587
Stop loss: `563
RPOWER (JUN FUTURE)
Sell: Below `52
Target: `48
Stop loss: `54
BEARISH STRATEGY
Market witnessed further consolidation on back of F&O expiry and global worries, but major sectors indices like Auto, IT, Bank, FMCG, Infra showed strength. Stock specific theme remained in flavor and Stock specific FII buying helped market to get stable. Hereafter, the range of 8200-8500 levels will remain crucial in the near term, and the move is expected to remain volatile with positive bias, as indicated by option open interest concentration. If Nifty breaks the 8500 mark, it could regain momentum and further upside up to 8650 cannot be ruled out. On the downside, the index will face strong support at 8200 levels. The put-call ratio of open interest closed up at 1.11 levels indicating put writing. The options open interest concentration is at the 8800-strike call with the highest open interest of above 35 lakh shares; this is followed by 8500-strike call with open interest of 25 lakhs. Among put options, the 8200-strike taking the total open interest to 36 lakh shares, this is followed by 8100-strike put with total open interest of 31 lakh shares. The Implied Volatility (IV) of call options slipped to 16.82%, while the average IV of put options closed at 16.92%. The VIX index moved down to 17.13%. As Nifty is in consolidation mode, hence upside cannot be not ruled out. It is advisable to use dips to initiate long position with 8300 as stop loss.
In lakhs
In 10000 In 10000
Call Put
2.6
7 5.3
6
3.0
1 6.3
4
11
.28
19
.02
21
.77
17
.47
17
.58
29
.42
29
.11
18
.82
38
.30
28
.69
29
.86
24
.08
11
.33
10
.52
5.6
3
5.5
6
5.1
2
6.7
8
0.00
5.00
10.00
15.00
20.00
25.00
30.00
35.00
40.00
45.00
7900 8000 8100 8200 8300 8400 8500 8600 8700 8800 9000
Call Put
-1.0
6
-4.3
4
-5.7
6
-12
.59
-10
.87
26
.72
5.7
7
-18
.07
-0.0
2
-5.3
8
-3.9
1
-3.7
7
-15
.00
2.5
0 7.3
1
7.5
0
-44
.56
-16
.27
-5.4
9
-3.6
7
-2.3
3
-3.6
4
-50.00
-40.00
-30.00
-20.00
-10.00
0.00
10.00
20.00
30.00
40.00
7900 8000 8100 8200 8300 8400 8500 8600 8700 8800 9000
Call Put
3.3
8
3.5
9
22
.19
1.4
3
1.9
7
4.3
9
72
.01
34
.81
37
.96
53
.32
22
.673
1.6
3
47
.36
63
.78
26
.41
24
.27
22
.83
8.5
8
2.6
5
0.4
1
0.3
0
0.4
1
0.00
10.00
20.00
30.00
40.00
50.00
60.00
70.00
80.00
17000 17500 18000 18200 18300 18400 18500 18600 18700 19000 19500
Call Put
-0.7
9
-1.3
1
-6.4
4 -1.0
4
-1.5
6
-2.6
7
11
.18
22
.83
23
.37
-11
.22
-5.4
4
-3.2
3
-1.5
7
5.6
4
14
.87
15
.06
12
.61
-15
.81
-4.0
5
-1.0
9
-2.5
8
-1.9
9
-20.00
-15.00
-10.00
-5.00
0.00
5.00
10.00
15.00
20.00
25.00
30.00
17000 17500 18000 18200 18300 18400 18500 18600 18700 19000 19500
8
In lakhs

9
DERIVATIVES
®
FII’s ACTIVITY IN DERIVATIVE SEGMENT
SENTIMENT INDICATOR (NIFTY)
28-May 27-May 26-May 25-May 22-May
Discount/Premium -0.45 14.60 16.00 19.05 17.55
PCR(OI) 1.11 1.14 1.11 1.26 1.26
PCR(VOL) 1.08 1.14 0.83 1.21 0.89
A/D RATIO(Nifty 50) 0.52 1.23 0.61 0.33 1.17
A/D RATIO(All FO Stock)* 0.80 1.21 0.67 0.65 0.76
Implied Volatality 16.42 15.96 15.49 15.23 15.46
VIX 17.13 17.28 17.07 16.93 16.93
HISTORY. VOL 20.06 34.42 21.32 21.92 22.10
*All Future Stock
SENTIMENT INDICATOR (BANKNIFTY)
28-May 27-May 26-May 25-May 22-May
Discount/Premium -7.95 -25.25 -41.15 -44.05 -58.05
PCR(OI) 0.91 1.04 0.82 0.84 0.92
PCR(VOL) 0.89 1.08 0.79 0.85 0.96
A/D RATIO(BANKNIFTY) 0.33 11.00 1.40 0.71 0.20
#A/D RATIO 0.91 20.00 0.62 0.75 0.18
Implied Volatality 24.01 22.49 22.17 22.47 21.96
HISTORY. VOL 27.43 39.90 28.52 29.42 30.24
FII’S ACTIVITY IN NIFTY FUTURE
**The highest call open interest acts as resistance and highest put open interest acts as support.# Price rise with rise in open interest suggests long buildup | Price fall with rise in open interest suggests short buildup # Price fall with fall in open interest suggests long unwinding | Price rise with fall in open interest suggests short covering
# All BANKING Future Stock
Top 10 long build up Top 10 short build up
LTP % Price Change Open interest
BOSCHLTD 23207.85 0.18% 187875
UNIONBANK 166.45 2.21% 12703000
GODREJIND 380.2 5.95% 1969968
IOC 363.25 4.23% 8198000
HDFCBANK 1036.8 1.39% 36891750
SYNDIBANK 111.75 3.62% 12184000
BPCL 820.95 4.78% 2528000
INDIACEM 93.1 4.67% 18922000
NHPC 20.35 4.63% 32780000
GMRINFRA 14.55 1.39% 200375012
LTP % Price Change Open interest
TECHM 548.85 -17.64% 11321500
MCLEODRUSS 235.95 -4.26% 1479000
APOLLOHOSP 1229.55 -6.23% 534750
JPPOWER 7.15 -1.38% 77970000
IBREALEST 58.4 -1.68% 37008000
VEDL 197.3 -4.36% 22224000
RELIANCE 881.25 -2.43% 29284000
JINDALSTEL 119.05 -13.64% 32050000
UBL 955.35 -4.28% 763000
TATAMOTORS 483.75 -5.85% 23160815
In Cr. In Cr.
- 16
62
22
9
64
8 85
3
- 31
3
32
8
16
7
21
6
- 96
65
1
-2000
-1500
-1000
- 500
0
500
1000
15-May 18-May 19-May 20-May 21-May 22-May 25-May 26-May 27-May 28-May
77
0
13
75
19
57
14
74
38
9
11
00
28
4
16
7
- 80
1
12
82
-1000
-500
0
500
1000
1500
2000
2500
15-May 18-May 19-May 20-May 21-May 22-May 25-May 26-May 27-May 28-May
* May series VS Jun Series
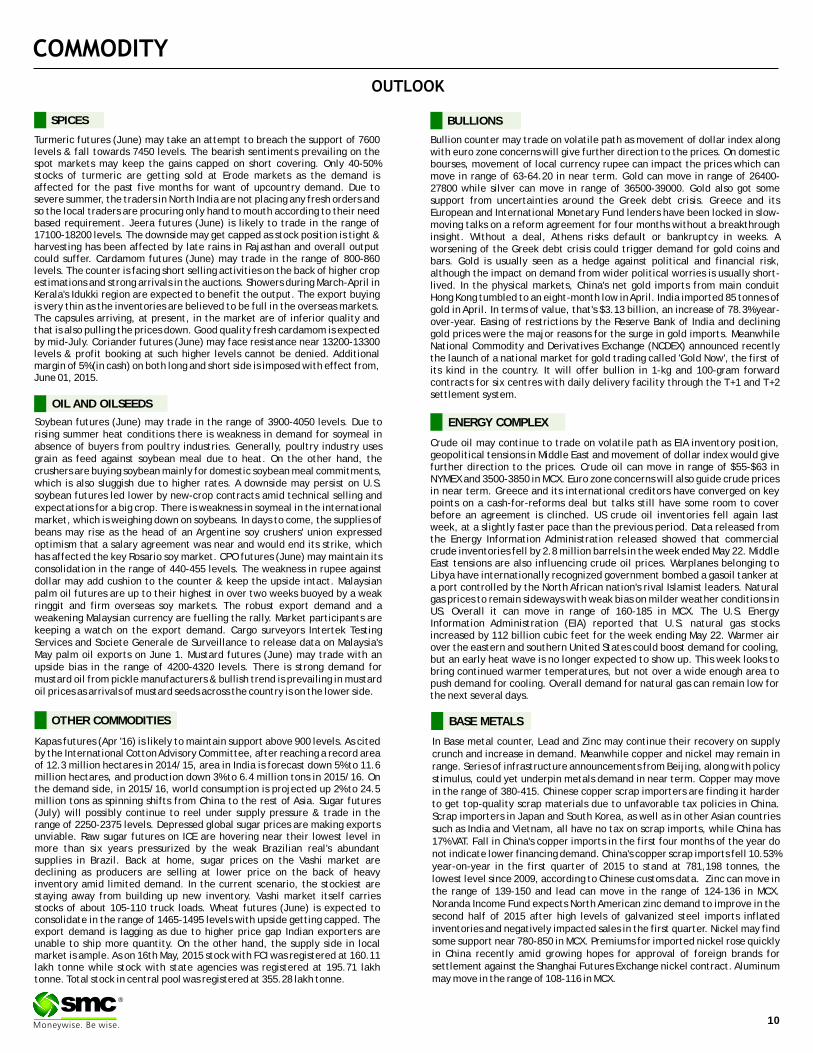
Turmeric futures (June) may take an attempt to breach the support of 7600 levels & fall towards 7450 levels. The bearish sentiments prevailing on the spot markets may keep the gains capped on short covering. Only 40-50% stocks of turmeric are getting sold at Erode markets as the demand is affected for the past five months for want of upcountry demand. Due to severe summer, the traders in North India are not placing any fresh orders and so the local traders are procuring only hand to mouth according to their need based requirement. Jeera futures (June) is likely to trade in the range of 17100-18200 levels. The downside may get capped as stock position is tight & harvesting has been affected by late rains in Rajasthan and overall output could suffer. Cardamom futures (June) may trade in the range of 800-860 levels. The counter is facing short selling activities on the back of higher crop estimations and strong arrivals in the auctions. Showers during March-April in Kerala's Idukki region are expected to benefit the output. The export buying is very thin as the inventories are believed to be full in the overseas markets. The capsules arriving, at present, in the market are of inferior quality and that is also pulling the prices down. Good quality fresh cardamom is expected by mid-July. Coriander futures (June) may face resistance near 13200-13300 levels & profit booking at such higher levels cannot be denied. Additional margin of 5% (in cash) on both long and short side is imposed with effect from, June 01, 2015.
SPICES
Bullion counter may trade on volatile path as movement of dollar index along with euro zone concerns will give further direction to the prices. On domestic bourses, movement of local currency rupee can impact the prices which can move in range of 63-64.20 in near term. Gold can move in range of 26400-27800 while silver can move in range of 36500-39000. Gold also got some support from uncertainties around the Greek debt crisis. Greece and its European and International Monetary Fund lenders have been locked in slow-moving talks on a reform agreement for four months without a breakthrough insight. Without a deal, Athens risks default or bankruptcy in weeks. A worsening of the Greek debt crisis could trigger demand for gold coins and bars. Gold is usually seen as a hedge against political and financial risk, although the impact on demand from wider political worries is usually short-lived. In the physical markets, China's net gold imports from main conduit Hong Kong tumbled to an eight-month low in April. India imported 85 tonnes of gold in April. In terms of value, that's $3.13 billion, an increase of 78.3% year-over-year. Easing of restrictions by the Reserve Bank of India and declining gold prices were the major reasons for the surge in gold imports. Meanwhile National Commodity and Derivatives Exchange (NCDEX) announced recently the launch of a national market for gold trading called 'Gold Now', the first of its kind in the country. It will offer bullion in 1-kg and 100-gram forward contracts for six centres with daily delivery facility through the T+1 and T+2 settlement system.
BULLIONS
10
In Base metal counter, Lead and Zinc may continue their recovery on supply crunch and increase in demand. Meanwhile copper and nickel may remain in range. Series of infrastructure announcements from Beijing, along with policy stimulus, could yet underpin metals demand in near term. Copper may move in the range of 380-415. Chinese copper scrap importers are finding it harder to get top-quality scrap materials due to unfavorable tax policies in China. Scrap importers in Japan and South Korea, as well as in other Asian countries such as India and Vietnam, all have no tax on scrap imports, while China has 17% VAT. Fall in China's copper imports in the first four months of the year do not indicate lower financing demand. China's copper scrap imports fell 10.53% year-on-year in the first quarter of 2015 to stand at 781,198 tonnes, the lowest level since 2009, according to Chinese customs data. Zinc can move in the range of 139-150 and lead can move in the range of 124-136 in MCX. Noranda Income Fund expects North American zinc demand to improve in the second half of 2015 after high levels of galvanized steel imports inflated inventories and negatively impacted sales in the first quarter. Nickel may find some support near 780-850 in MCX. Premiums for imported nickel rose quickly in China recently amid growing hopes for approval of foreign brands for settlement against the Shanghai Futures Exchange nickel contract. Aluminum may move in the range of 108-116 in MCX.
®
BASE METALS
Crude oil may continue to trade on volatile path as EIA inventory position, geopolitical tensions in Middle East and movement of dollar index would give further direction to the prices. Crude oil can move in range of $55-$63 in NYMEX and 3500-3850 in MCX. Euro zone concerns will also guide crude prices in near term. Greece and its international creditors have converged on key points on a cash-for-reforms deal but talks still have some room to cover before an agreement is clinched. US crude oil inventories fell again last week, at a slightly faster pace than the previous period. Data released from the Energy Information Administration released showed that commercial crude inventories fell by 2.8 million barrels in the week ended May 22. Middle East tensions are also influencing crude oil prices. Warplanes belonging to Libya have internationally recognized government bombed a gasoil tanker at a port controlled by the North African nation's rival Islamist leaders. Natural gas prices to remain sideways with weak bias on milder weather conditions in US. Overall it can move in range of 160-185 in MCX. The U.S. Energy Information Administration (EIA) reported that U.S. natural gas stocks increased by 112 billion cubic feet for the week ending May 22. Warmer air over the eastern and southern United States could boost demand for cooling, but an early heat wave is no longer expected to show up. This week looks to bring continued warmer temperatures, but not over a wide enough area to push demand for cooling. Overall demand for natural gas can remain low for the next several days.
ENERGY COMPLEXSoybean futures (June) may trade in the range of 3900-4050 levels. Due to rising summer heat conditions there is weakness in demand for soymeal in absence of buyers from poultry industries. Generally, poultry industry uses grain as feed against soybean meal due to heat. On the other hand, the crushers are buying soybean mainly for domestic soybean meal commitments, which is also sluggish due to higher rates. A downside may persist on U.S. soybean futures led lower by new-crop contracts amid technical selling and expectations for a big crop. There is weakness in soymeal in the international market, which is weighing down on soybeans. In days to come, the supplies of beans may rise as the head of an Argentine soy crushers' union expressed optimism that a salary agreement was near and would end its strike, which has affected the key Rosario soy market. CPO futures (June) may maintain its consolidation in the range of 440-455 levels. The weakness in rupee against dollar may add cushion to the counter & keep the upside intact. Malaysian palm oil futures are up to their highest in over two weeks buoyed by a weak ringgit and firm overseas soy markets. The robust export demand and a weakening Malaysian currency are fuelling the rally. Market participants are keeping a watch on the export demand. Cargo surveyors Intertek Testing Services and Societe Generale de Surveillance to release data on Malaysia's May palm oil exports on June 1. Mustard futures (June) may trade with an upside bias in the range of 4200-4320 levels. There is strong demand for mustard oil from pickle manufacturers & bullish trend is prevailing in mustard oil prices as arrivals of mustard seeds across the country is on the lower side.
OIL AND OILSEEDS
OTHER COMMODITIES
Kapas futures (Apr '16) is likely to maintain support above 900 levels. As cited by the International Cotton Advisory Committee, after reaching a record area of 12.3 million hectares in 2014/15, area in India is forecast down 5% to 11.6 million hectares, and production down 3% to 6.4 million tons in 2015/16. On the demand side, in 2015/16, world consumption is projected up 2% to 24.5 million tons as spinning shifts from China to the rest of Asia. Sugar futures (July) will possibly continue to reel under supply pressure & trade in the range of 2250-2375 levels. Depressed global sugar prices are making exports unviable. Raw sugar futures on ICE are hovering near their lowest level in more than six years pressurized by the weak Brazilian real's abundant supplies in Brazil. Back at home, sugar prices on the Vashi market are declining as producers are selling at lower price on the back of heavy inventory amid limited demand. In the current scenario, the stockiest are staying away from building up new inventory. Vashi market itself carries stocks of about 105-110 truck loads. Wheat futures (June) is expected to consolidate in the range of 1465-1495 levels with upside getting capped. The export demand is lagging as due to higher price gap Indian exporters are unable to ship more quantity. On the other hand, the supply side in local market is ample. As on 16th May, 2015 stock with FCI was registered at 160.11 lakh tonne while stock with state agencies was registered at 195.71 lakh tonne. Total stock in central pool was registered at 355.28 lakh tonne.

11
TECHNICAL RECOMMENDATIONS
COMMODITY
NICKEL MCX (JUNE) contract closed at ̀ 820.90 on 28th May '15. The contract made its high of 930.70
on 12th May '15 and a low of `811.80 on 26th May '15. The 18-day Exponential Moving Average of the
commodity is currently at ̀ 846. On the daily chart, the commodity has Relative Strength Index (14-day) value of 38. One can buy in the
range 815-800 with the stop loss of ̀ 780 for a target of ̀ 880.
`
ALUMINIUM MCX (JUNE) contract closed at 112.50 on 28th May '15. The contract made its high of
`122.90 on 13th May '15 and a low of ̀ 110.65 on 27th May '15. The 18-day Exponential Moving Average of
the Commodity is currently at ̀ 114.80.
On the daily chart, the commodity has Relative Strength Index (14-day) value of 45. One can buy in the
range 111.50-111 with the stop loss of ̀ 110 for a target of ̀ 114.50.
`
CORIANDER NCDEX (JUNE) contract closed at 13000.00 on 28th May '15. The contract made its high of
`13290.00 on 29th May '15 and a low of `10250.00 on 11th May' 15. The 18-day Exponential Moving
Average of the Commodity is currently at ̀ 11750.
On the daily chart, the commodity has Relative Strength Index (14-day) value of 77. One can buy in the
range 12900-12800 with the stop loss of ̀ 12650 for a target of ̀ 13400.
`
®
NICKEL MCX (JUNE)
ALUMINIUM MCX (JUNE)
CORIANDER NCDEX (JUNE)
NOTES : 1) These levels should not be confused with the daily trend sheet, which is sent every morning by e-mail in the name of Daily report- commodities (Morning Mantra).
2) Sometimes you will find the stop loss to be too far but if we change the stop loss once, we will find more strength coming into the commodity. At the moment, the stop loss will be far as we are seeing the graphs on weekly basis and taking a long-term view and not a short-term view.
EXCHANGE COMMODITY CONTRACT CLOSING DATE TREND TREND RATE TREND SUPPORT RESISTANCE CLOSING
PRICE CHANGED CHANGED STOP/LOSS
NCDEX SOYABEAN JUNE 3962.00 09.04.15 UP 3573.00 3920.00 - 3900.00
NCDEX JEERA JUNE 17405.00 13.11.14 UP 12090.00 17200.00 - 17000.00
NCDEX CHANA JUNE 4684.00 30.10.14 UP 3131.00 4400.00 - 4300.00
NCDEX RM SEEDS JUNE 4224.00 16.04.15 UP 3659.00 3950.00 - 3850.00
MCX MENTHA OIL JUNE 940.10 12.03.15 UP 821.20 900.00 - 875.00
MCX CARDAMOM JUNE 828.70 09.04.15 SIDEWAYS
MCX SILVER JULY 38296.00 11.12.14 UP 38668.00 36000.00 35000.00
MCX GOLD JUNE 26861.00 12.02.15 SIDEWAYS
MCX COPPER JUNE 392.45 28.05.15 SIDEWAYS
MCX LEAD JUNE 127.10 21.05.15 Down 125.20 - 132.00 135.00
MCX ZINC JUNE 142.90 21.05.15 SIDEWAYS
MCX NICKEL JUNE 820.90 21.05.15 Down 827.90 - 870.00 900.00
MCX ALUMINUM JUNE 112.50 21.05.15 SIDEWAYS
MCX CRUDE OIL JUNE 3668.00 29.04.15 UP 3755.00 3600.00 3550.00
MCX NATURAL GAS JUNE 174.40 14.05.15 SIDEWAYS
TREND SHEET
Closing as on 28.05.15
COMMODITY
NEWS DIGEST
In the week gone by, bounce back in the dollar index compelled CRB to fall further. Capital inflow was more in the stock markets due to bullish sentiments prevailing there. With some improved economic and comments from Fed chief Janet Yellen that rates would go up "at some point this year" raised the confidence of investors in the dollar index. This is the two consecutive weeks decline, which was witnessed in bullion counter. COMEX gold hit its important support of $1180. Robust dollar and the prospects of higher U.S. interest rates dented demand for the metal. Silver also closed the week on a negative note. Silver touched the strong support of 38000 levels in MCX. Energy counter saw sharp selling pressure, especially in natural gas. Though decline in inventories helped it to cover some of its weekly loses. Department of Energy (DoE) reported US commercial crude inventories fell by 2.8 million barrels to 479.4 million in the week through May 22, while petrol stockpiles fell by 3.3 million barrels. It was the fourth straight week of falling US crude inventories after a steady build-up since January that has pushed stockpiles to record highs. Base metals kept the investors on their toes throughout the week with their wild swings. Earlier they were trading in a range, but now saw a quick bounce back, especially zinc, which moved north on the news of squeezed supply. Copper hit a one-month low on Wednesday due to concerns about the economic outlook for big metals consumer China. Furthermore, seasonal demand passes its peak and there is a plentiful supply.
Chana traded in a range. In a latest measure to keep pulses market under control, government has directed traders to update their stock of imported pulses every fortnight. The immediate effect of this order worked as a cap on firming up pulses market at this point of time. Guar price traded in a range with marginal downside as market is waiting for monsoon rainfall. In spices, chilli, jeera and turmeric traded weak while cardamom and dhaniya prices propped up. Steady to firm sentiment was witnessed in dhaniya spot market. Good demand is reported for Eagle variety in the spot market from Masala miller. Sugar prices continuously moved down in the Indian market. The Indian Sugar Mills Association (ISMA) revisited India' sugar production estimate to around 28 million tons this marketing year i.e. 2014 -15. Domestic soybean fell after it rallied in recent days. Weak international soy benchmark, which fell to the seven-month low followed by forecast of good weather for soybean planting in US, pressurized price in domestic market too.
WEEKLY COMMENTARY
WEEKLY STOCK POSITIONS IN WAREHOUSE (NCDEX)
COMMODITY UNIT 28.05.15 DIFFERENCEQTY. QTY.
BARLEY MT 13946 14567 621
CASTOR SEED MT 343556 321668 -21888
CHANA MT 114932 121379 6447
CORIANDER MT 14282 16272 1990
COTTON (29MM) BALES 400 400 0
GUARGUM MT 5838 5594 -244
GUARSEED MT 3733 4491 758
JEERA MT 15127 17113 1986
MAIZE MT 11009 10804 -205
RAPE MUSTARD SEED MT 47326 50530 3204
SUGAR MT 27198 12019 -15179
TURMERIC MT 9944 10715 771
WHEAT MT 31801 35612 3811
20.05.15 COMMODITY UNIT 28.05.15 DIFFERENCE
QTY. QTY.
CARDAMOM MT 37.50 30.50 -7.00
COTTON BALES 110700.00 102100.00 -8600.00
GOLD KGS 29.00 29.00 0.00
GOLD MINI KGS 29.40 29.40 0.00
GOLD GUINEA KGS 17.65 20.70 3.05
MENTHA OIL KGS 2764203.00 2820379.95 56176.95
SILVER (30 KG Bar) KGS 15662.29 15340.32 -321.97
20.05.15
•Austria's central bank plans to repatriate some of its
gold reserves from Britain after facing criticism for
storing too much of the precious metal abroad.
•US pending Home Sales for the month ending April
increased by 3.4% as compared to 1.2% in March.
•Venezuela and Russia's top oil producer, Rosneft, have
agreed on around $14 billion in investment in the South
American OPEC country's oil and gas sector.
•Swiss exports of gold to China dropped by around 67% in
April to just 15.1 tonnes, according to Swiss Federal
Customs Administration.
•NCDEX launched 'Gold Now' platform, an online market
for buying and selling gold.
•Additional Margin on coriander of 5% (in Cash) on both
Long and Short side will be imposed with effect from
beginning of day Monday, June 01, 2015.
•Modifications in contract specifications – Refined Soy
Oil futures contracts:- Ticker Symbol: SYOREF, Trading
Unit: 10 MT, Delivery unit: 10 MT
•Wheat procurement by government agencies during
current Rabi marketing season has crossed the last year
mark. It is 5 lakh MT more than last season's
procurement.
WEEKLY STOCK POSITIONS IN WAREHOUSE (MCX)
12
®
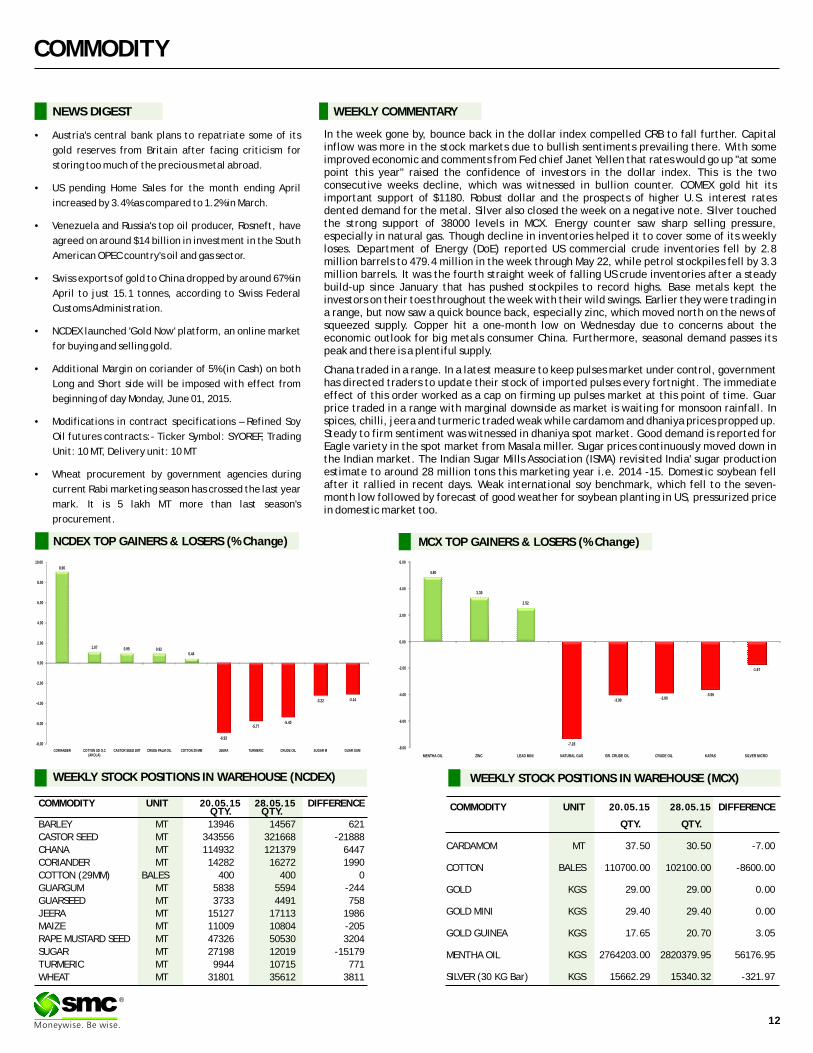
NCDEX TOP GAINERS & LOSERS (% Change) MCX TOP GAINERS & LOSERS (% Change)
4.80
3.30
2.52
-8.00
-6.00
-4.00
-2.00
0.00
2.00
4.00
6.00
MENTHA OIL ZINC LEAD MINI
-7.28
-3.99 -3.80-3.55
-1.67
NATURAL GAS BR. CRUDE OIL CRUDE OIL KAPAS SILVER MICRO
8.96
1.07 0.95 0.920.44
-6.93
-5.77-5.40
-3.22 -3.14
-8.00
-6.00
-4.00
-2.00
0.00
2.00
4.00
6.00
8.00
10.00
CORIANDER COTTON SD O.C (AKOLA)
CASTOR SEED 2MT CRUDE PALM OIL COTTON 29 MM JEERA TURMERIC CRUDE OIL SUGAR M GUAR GUM
COMMODITY
COMMODITY EXCHANGE CONTRACT 28.05.15 CHANGE%
ALUMINIUM LME 3 MONTHS 1768.00 1776.50 0.48
COPPER LME 3 MONTHS 6161.50 6095.00 -1.08
LEAD LME 3 MONTHS 1947.00 1990.00 2.21
NICKEL LME 3 MONTHS 12710.00 12810.00 0.79
ZINC LME 3 MONTHS 2178.00 2228.00 2.30
GOLD COMEX AUG 1204.40 1188.80 -1.30
SILVER COMEX JULY 17.04 16.67 -2.15
LIGHT CRUDE OIL NYMEX JUNE 59.72 57.68 -3.42
NATURAL GAS NYMEX JUNE 2.89 2.71 -6.27
22.05.15
PRICES OF METALS IN LME/ COMEX/ NYMEX (in US $)
WEEKLY STOCK POSITIONS IN LME (IN TONNES)
COMMODITY STOCK POSITION STOCK POSITION DIFFERENCE
21.05.15
ALUMINIUM 3773275 3752325 -20950
COPPER 334875 327500 -7375
NICKEL 446640 465624 18984
LEAD 162525 158025 -4500
ZINC 467125 458825 -8300
28.05.15
INTERNATIONAL COMMODITY PRICES
COMMODITY EXCHANGE CONTRACT UNIT 22.05.15 28.05.15 CHANGE(%)
Soya CBOT JULY Cent per Bushel 924.25 926.00 0.19
Maize CBOT JULY Cent per Bushel 360.00 353.50 -1.81
CPO BMD JULY MYR per MT 2135.00 2208.00 3.42
Sugar LIFFE JULY 10 cents per MT 351.30 347.40 -1.11
13
®
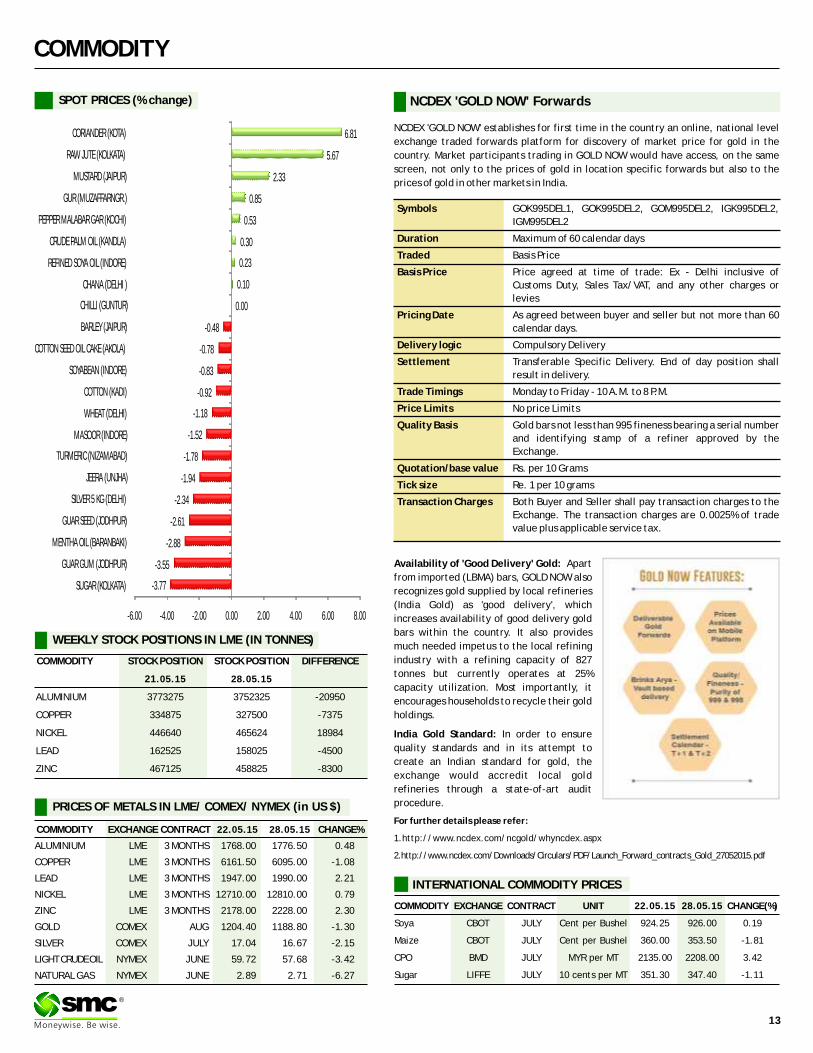
SPOT PRICES (% change) NCDEX 'GOLD NOW' Forwards
NCDEX 'GOLD NOW' establishes for first time in the country an online, national level
exchange traded forwards platform for discovery of market price for gold in the
country. Market participants trading in GOLD NOW would have access, on the same
screen, not only to the prices of gold in location specific forwards but also to the
prices of gold in other markets in India.
Symbols GOK995DEL1, GOK995DEL2, GOM995DEL2, IGK995DEL2,
IGM995DEL2
Duration Maximum of 60 calendar days
Traded Basis Price
Basis Price Price agreed at time of trade: Ex - Delhi inclusive of
Customs Duty, Sales Tax/VAT, and any other charges or
levies
Pricing Date As agreed between buyer and seller but not more than 60
calendar days.
Delivery logic Compulsory Delivery
Settlement Transferable Specific Delivery. End of day position shall
result in delivery.
Trade Timings Monday to Friday - 10 A.M. to 8 P.M.
Price Limits No price Limits
Quality Basis Gold bars not less than 995 fineness bearing a serial number
and identifying stamp of a refiner approved by the
Exchange.
Quotation/base value Rs. per 10 Grams
Tick size Re. 1 per 10 grams
Transaction Charges Both Buyer and Seller shall pay transaction charges to the
Exchange. The transaction charges are 0.0025% of trade
value plus applicable service tax.
Availability of 'Good Delivery' Gold: Apart
from imported (LBMA) bars, GOLD NOW also
recognizes gold supplied by local refineries
(India Gold) as 'good delivery', which
increases availability of good delivery gold
bars within the country. It also provides
much needed impetus to the local refining
industry with a refining capacity of 827
tonnes but currently operates at 25%
capacity utilization. Most importantly, it
encourages households to recycle their gold
holdings.
India Gold Standard: In order to ensure
quality standards and in its attempt to
create an Indian standard for gold, the
exchange would accredit local gold
refineries through a state-of-art audit
procedure.
For further details please refer:
1.http://www.ncdex.com/ncgold/whyncdex.aspx
2.http://www.ncdex.com/Downloads/Circulars/PDF/Launch_Forward_contracts_Gold_27052015.pdf
-3.77
-3.55
-2.88
-2.61
-2.34
-1.94
-1.78
-1.52
-1.18
-0.92
-0.83
-0.78
-0.48
0.00
0.10
0.23
0.30
0.53
0.85
2.33
5.67
6.81
-6.00 -4.00 -2.00 0.00 2.00 4.00 6.00 8.00
SUGAR (KOLKATA)
GUAR GUM (JODHPUR)
MENTHA OIL (BARANBAKI)
GUAR SEED (JODHPUR)
SILVER 5 KG (DELHI)
JEERA (UNJHA)
TURMERIC (NIZAMABAD)
MASOOR (INDORE)
WHEAT (DELHI)
COTTON (KADI)
SOYABEAN (INDORE)
COTTON SEED OIL CAKE (AKOLA)
BARLEY (JAIPUR)
CHILLI (GUNTUR)
CHANA (DELHI )
REFINED SOYA OIL (INDORE)
CRUDE PALM OIL (KANDLA)
PEPPER MALABAR GAR (KOCHI)
GUR (MUZAFFARNGR.)
MUSTARD (JAIPUR)
RAW JUTE (KOLKATA)
CORIANDER (KOTA)

CURRENCY
Currency Table
Currency Pair Open High Low Close
USD/INR 63.59 64.38 63.54 64.16
EUR/INR 69.88 70.29 69.45 69.98
GBP/INR 98.47 98.85 97.86 97.94
JPY/INR 52.27 52.33 51.55 51.62
(Source: Reliable Software, Open: Monday 9.00 AM IST, Close: Thursday (5.00 PM IST)
News Flows of last week
28th May Japan's retail sales rebounded modestly in the year to April after three straight months of falls
28th May China's factories struggled to expand in May despite recent interest rate cuts
28th May The dollar climbed to a 12-1/2-year high against the yen
28th May U.S. pending home sales race to nine-year high in April
28th May Japan's core consumer prices rose 0.3 percent in April from a year earlier
28th May China's April services trade deficit widens to $17.3 billion
29th May Spending by Japanese households slumped unexpectedly in April
EUR/INR (JUNE) contract closed at 69.98 on 28th May'15. The contract made its high of `70.29 on 28th May'15 and a low of `69.45 on 26st May'15 (Weekly Basis). The 14-day Exponential Moving Average of the EUR/INR is currently at ̀ 70.67.
On the daily chart, EUR/INR has Relative Strength Index (14-day) value of 46.53. One can sell below 69.60 for a target of 68.60 with the stop loss of 70.10.
JPY/INR (JUNE) contract closed at 51.62 on 28th May'15. The contract made its high of 52.32 on 26th May'15 and a low of ̀ 51.55 on 28th May'15 (Weekly Basis). The 14-day Exponential Moving Average of the JPY/INR is currently at ̀ 52.59.
On the daily chart, JPY/INR has Relative Strength Index (14-day) value of 30.27. One can sell around 52.00 for a target of 51.00 with the stop loss of 52.50
Market Stance
Indian rupee started the week on negative note and once again breached 64
mark as against dollar on fresh demand for the American currency from banks
and importers. Moreover, the dollar hit its highest level in more than 12 years
against the yen, with the US currency's rapid pace of gains putting market
participants on alert for any signs of discomfort from the US and Japan.
However, in later part of the week the rupee was seen snapped its losing
streak after local stocks surged high and on fresh selling of the greenback by
banks and exporters. Although there might have been worries about the Indian
rupee sliding on US interest rate hike fears, but the local unit is still among the
top performing emerging market currencies versus the dollar. While the rupee
was among the top five emerging market currencies since the beginning of the
year, it performed even better in the January to mid-April period. Markets had
turned volatile after mid-April with raising US Treasury yields.
EUR/INR
USD/INR (JUNE) contract closed at ̀ 64.16 on 28th May'15. The contract made its high of `64.38 on 28thMay'15 and a low of `63.54 on 25th May'15 (Weekly Basis). The 14-day Exponential Moving Average of the USD/INR is currently at ̀ 63.85.
On the daily chart, the USD/INR has Relative Strength Index (14-day) value of 60.86. One can sell below 63.90 for the target of 63.00 with the stop loss of 64.30
GBP/INR JUNE) contract closed at 97.94 on 28th May'15. The contract made its high of 98.85 on 27th May'15 and a low of `97.86 on 28th May'15 (Weekly Basis). The 14-day Exponential Moving Average of the GBP/INR is currently at ̀ 98.70
On the daily chart, GBP/INR has Relative Strength Index (14-day) value of 50.29. One can sell below 97.80 for a target of 96.80 with the stop loss of 98.30.
`
USD/INRTechnical Recommendation
GBP/INR JPY/INR
Economic gauge for the next week
Date Currency Event PREVIOUS
01st June USD ISM Manufacturing PMI 51.5
02nd June EUR Producer Price Index (MoM) 0.2
02nd June EUR Consumer Price Index (YoY) 0
02nd June EUR Producer Price Index (YoY) -2.3
02nd June EUR Consumer Price Index - Core (YoY) 0.6
03rd June EUR ECB Interest Rate Decision 0.05
03rd June EUR ECB Monetary policy statement and press conference -
04th June GBP BoE Interest Rate Decision 0.5
04th June GBP BoE Asset Purchase Facility 375
05th June GBP Consumer Inflation Expectations 1.9
05th June EUR Gross Domestic Product s.a. (YoY) 1
05th June USD Nonfarm Payrolls 223
05th June USD Unemployment Rate 5.4
14
®

IPO TRACKER
PNC Infratech Infrastructure 2028.97 488.44 26-May-15 378.00 381.00 405.40 7.25
UFO Moviez Entertainment 1509.96 600.00 14-May-15 625.00 600.00 580.50 -7.12
MEP Infrast. Infra. Developers 962.41 324.00 6-May-15 63.00 63.00 59.55 -5.48
VRL Logistics Logistics 2917.05 473.88 30-Apr-15 205.00 288.00 317.55 54.90
Inox Wind Capital Goods 9742.21 450.76 9-Apr-15 325.00 400.00 439.00 35.08
Ortel Communication Indian Media & Ent. 528.06 217.20 19-Mar-15 200.00 181.00 173.90 -13.05
Monte Carlo Textile & Apparel 1219.71 350.43 19-Dec-14 645.00 585.00 561.25 -12.98
Shemaroo Ent. Entertainment 667.60 120.00 1-Oct-14 170.00 180.00 245.60 44.47
Sharda Cropchem Agro Chemical 3202.83 351.86 23-Sep-14 156.00 254.10 355.00 127.56
Snowman Logistic Miscellaneous 1401.64 197.40 12-Sep-14 47.00 78.75 83.90 78.51
Company Sector M.Cap(In `Cr.) Issue Size(in `Cr.) List Date Issue Price List Price Last Price %Gain/Loss(from Issue price)
*
*Closing prices as on 28-05-2015
IPO
IPO NEWSIPO NEWS
NBCC board okays 10% stake sale via FPO; may raise Rs 900 croreThe board of state-owned NBCC has approved the sale of 10 per cent stake through public offer that will help the company raise over ̀ 900 crore to fund business expansion. The stake sale would be subject to the approval of the Government of India, which holds 90 per cent equity in the National Buildings Construction Corporation. NBCC was listed on the bourses in 2012 when government diluted 10 per cent stake to raise ̀ 127 crore. The price band of the NBCC IPO had been fixed at ̀ 90-106 per share. NBCC, which is under the administrative control of Ministry of Urban Development, provides project management consultancy services for construction projects, civil infrastructure for power sector and real estate development.
IndiGo to file for $400mn IPO by July, may offer 25%India's largest carrier IndiGo is preparing to file for an initial public offering by July to sell shares worth USD 400 million. The size of the issue will be around 25 percent of the company's equity capital, sources said, adding that it will be a mix of offer for sales and fresh issue of shares. This values the airline at USD 1.6 billion or roughly ̀ 10,000 crore, more than twice its nearest rival Jet Airways and 8.5 times that of SpiceJet . The premium can be attributed to company's superior growth rate, little debt, expansion plan and a robust track record of consistent profitability -- last year, it clocked profit of ̀ 815 crore on revenues of ̀ 12,900 crore while peers languished in losses.
Navkar Corp gets Sebi go-ahead for ̀ 600 cr IPOLogistics Company Navkar Corporation has received capital markets regulator Sebi's approval to raise up to ̀ 600 crore through an IPO. The company has filed their respective draft red herring prospectus (DRHP) with Sebi in March this year for the proposed public offers. The Securities and Exchange Board of India (Sebi) issued its final observations on the draft offer documents on May 22, which is necessary for companies to launch any public offer. As per the draft papers, Navkar Corporation would mobilise up to ̀ 510 crore by issuing fresh equity shares, while Sidhhartha Corporation would rake in up to `90 crore through sale of existing shares. The funds would be used for capacity enhancement of the Somathane container freight station (CFS), development of the non-notified areas of CFSs and establishment of a logistics park at Valsad in Gujarat. The issue is being managed by Axis Capital , SBI Capital Markets and Edelweiss Financial Services .
Alkem targets $1bn sales by '17, to raise ̀ 1500cr via IPOAlkem Laboratories, the country's fifth-largest drug maker by domestic sales aims to double revenues by 2017 to be a billion-dollar plus company by 2017. The company has been preparing to hit the capital markets to raise nearly ̀ 1500 crore by December.
Vodafone India planning to launch IPO next year: ReportsThe British telecom major Vodafone is reportedly planning to launch IPO of its Indian arm to raise about $4 billion next fiscal. The company has appointed NM Rothschild as its consultant to work on roadmap and the paperwork for the public offering will be completed by the end of ongoing financial year, as per reports. When contacted, Vodafone spokesperson declined to comment. The company has been planning IPO of its Indian arm since a very long time. Vodafone acquired 100 per cent stake in the Indian venture by buying out entire stake from its local partners for ̀ 10,141 crore in 2013. Vodafone India former MD and CEO Marten Pieters had said that company will proceed with its IPO plan provided that its tax issue is resolved. Vodafone is entangled in a legal dispute with the Indian government in about ̀ 20,000-crore tax dispute. Vodafone in January said that it has invested more than GBP 12.8 billion (about `1,29,745) in India since 2007 and in 2013 it made commitment to invest about `4,000-6,000 crore annually. In addition to this, the company acquired spectrum for about `25,959.74 crore in March and the company has plans to expand its 3G service on its own network from 9 circles to 16 circles.
DTDC plans 600cr IPO at 3,000cr valuationFirst generation Bengali entrepreneur Subhasish Chakraborty, who started courier company DTDC with just ̀ 70,000 about 25 years ago, is now planning to enter the capital markets. The company, which is India's largest express delivery logistics player in terms of reach, plans to raise Rs 600 crore through an initial public offering (IPO) by diluting up to 20%, valuing it at ̀ 3,000 crore. This would make DTDC the second most valued express delivery service provider after Blue Dart, which has a market capitalization of ̀ 15,000 crore. DTDC promoters own 56% stake in the company and 42% is held by Europe's second largest logistics firm GeoPost, an offshoot of the French government's postal arm. Anil Ambani-led Reliance Capital bought about 40% stake in DTDC in 2006 for ̀ 66 crore and sold it to GeoPost for ̀ 160 crore in 2013. The value of GeoPost's stake in DTDC has grown to around ̀ 1,200 crore in just two years.
Tata Sky Drops IPO PlanIndia's TataSky pay-TV operation has shelved plans for an IPO. In 2013 it had talked of a float of 25 per cent of the company in order to raise 20 billion Indian Rupees. However, TataSky will instead raise INR18 billion by selling a similar stake to Private Equity investors. TataSky is owned by the Tata Group and 21st Century Fox. The company is quoted by the newspaper saying that it is in dialogue with global investors such as Warburg Pincus, Blackstone and others.
15
®

FIXED DEPOSIT MONITOR
• Interest structure may be revised by company from time to time. Pls confirm Interest rates before submitting the application.
* For Application Greater Than Rs. Fifty Lakhs Or equal to Fifty Lakhs, Please Contact to Head Office.
* Email us at [email protected]
FIXED DEPOSIT COMPANIES
PERIOD MIN.ADDITIONAL RATE OF INTEREST (%)
S.NO (NBFC COMPANY -NAME)12M 18M 24M 36M 45M 48M 60M 84M INVESTMENT
1 ANSAL HOUSING & CONSTRUCTION LTD. 11.75 - 12.00 12.25 - - - - - CUM-20000/-,
NON CUM-40000/-
2 BAJAJ FINANCE LTD.(UPTO RS. 5 CR.) 9.10 9.20 9.25 9.25 - 9.25 9.25 - 0.25% FOR SR. CITIZEN, 0.10% FOR LOCATION WISE
EXISTING CUSTOMERUPTO RS. 1CRORE
3 CENT BANK HOME FINANCE LTD.(UPTO RS. 1 CR.) 9.25 - 9.25 9.25 - 9.25 9.25 9.25 0.25% EXTRA FOR SR. CITIZEN 5000/-
4 DEWAN HOUSING FINANCE CORPORATION LTD 13M=9.50% 14M=9.50% 40M=9.60% 0.25% EXTRA FOR SR. CITIZEN,WIDOW, 13M=50000;
ARMED, PERSONNEL, EXISTING DHFL HOME 14M=10000;
BORROWERS, 0.25% EXTRA FOR DEPOSIT 40M=2000
50 LAC AND ABOVE
5 DEWAN HOUSING FINANCE CORPORATION LTD (AASHRAY) 9.25 - 9.50 9.50 - 9.50 - 9.50 10,000/-
6 GRUH FINANCE LTD. 8.75 - 8.75 8.50 - 8.50 8.50 8.50 96-120M=8.50%; 0.25% FOR SR. CITIZEN & TRUST 1000/-
7 HDFC PREMIUM DEPOSIT FOR INDIVIUAL (UPTO RS. 2 CR.) 30M=9.00 22M=9.05 44M=9.05 - 0.25% FOR SR. CITIZEN 20000/-, 40000/-
IN MONTHLY
8 HDFC LTD FOR INDIVIDUAL (UPTO RS.2 CR.) 8.90 - 8.90 8.90 - 8.90 8.90 - 0.25% FOR SR. CITIZEN.
9 HDFC PREMIUM DEPOSIT FOR TRUST & INSTITUTE(UPTO RS. 2 CR.) 30M=8.90 22M=8.95 44M=8.95 - 0.25% FOR SR. CITIZEN 20000/-, 40000/-
IN MONTHLY
10 HDFC LTD FOR TRUST & INSTITUTE (UPTO RS.2 CR.) 8.80 - 8.80 8.80 - 8.80 8.80 - 0.25% FOR SR. CITIZEN.
11 HUDCO LTD.(IND & HUF) 9.15 - 9.00 9.00 - 8.75 8.75 8.50 0.25% FOR SR. CITIZEN 10000/-
12 HUDCO LTD.(TRUST/CO/INSTITUTION) 9.00 - 8.85 8.85 - 8.75 8.75 8.50 - 10000/-
13 J K TYRE & INDUSTRIES LTD. 9.00 - 9.25 9.50 - - - - 0.50% ADD. INTEREST TO SR. CITIZEN, 25000/-
EMPLOYEES, SHAREHOLDERS AND PERSON
INVESTING RS. 5 LACS AND ABOVE - MAX. 0.50%
14 J K LAKSHMI CEMENT LTD. 9.00 - 9.25 9.50 - - - - - 25000/-
15 KERALA TRANS DEVELOP FINANCE CORP LTD (FOR < RS. 5 CRORE) 10.00 - 10.00 10.00 - 9.75 9.75 - 0.25% EXTRA FOR SR. CITIZEN & 0.25% 10000/-
EXTRA IF APP AMOUNT IS RS. 25 LAC & ABOVE
16 LIC HOUSING FINANCE LTD.(UPTO RS. 5 CR.) 8.60 8.60 8.70 8.75 - - 9.00 - 0.25% FOR SR. CITIZEN IF APP ABOVE 10000/-
RS. 50,000/- & 0.10% IF APP UPTO RS. 50,000/-
17 M&M FINANCIAL SERVICES LTD (FOR BELOW RS. 1 CRORE)9.00 9.25 9.25 9.25 - 9.25 9.25 - 0.25% FOR SR. CITIZEN 10000/-
18 OMAXE LTD. 11.50 - 12.00 12.50 - - - - - 50000/-
19 PRISM CEMENT LTD. 9.75 - 9.75 - - - - - - 10000/-
20 PNB HOUSING FINANCE LTD.(UPTO RS. 5 CR.) 9.15 - 9.15 9.15 - 9.15 9.15 9.15 0.25% EXTRA FOR SR. CITIZEN UPTO RS.1 CRORE 20000/-
21 SRS LTD. 12.00 - 12.25 12.50 - - - - - 30000/-
22 SHRIRAM TRANSPORT FINANCE-UNNATI SCHEME 9.00 - 9.25 9.50 - 9.50 9.50 - - 5000/-
23 SHRIRAM CITY UNION SCHEME 9.00 - 9.25 9.50 - 9.50 9.50 - - 5000/-
(FOR TRUST ONLY)
16
®

MUTUAL FUND
NEWS
HDFC Mutual Fund introduces FMP 1127D May 2015 (1).HDFC Mutual Fund has launched the HDFC FMP 1127D May 2015 (1), a close ended income scheme. The NFO opens for subscription on May 29, 2015 and
closes on June 09, 2015. No entry load and exit load will be applicable for the scheme. The minimum subscription amount is multiples of ̀ 5,000. The
investment objective of the scheme is to generate income through investments in Debt / Money Market Instruments and Government Securities
maturing on or before the maturity date of the respective Plan(s).
Birla Sun Life Mutual Fund introduces Fixed Term Plan Series MR (1153 days)Birla Sun Life Mutual Fund has launched the Birla Sun Life Fixed Term Plan-Series MR (1153 days), a close ended income scheme. The NFO opens for
subscription on May 29, 2015 and closes on June 03, 2015. The investment objective of the scheme is to generate income by investing in a portfolio of
fixed income securities maturing on or before the duration of the scheme.
Birla Sun Life Mutual Fund files offer document with SebiBirla Sun Life Mutual Fund has filed offer document with SEBI to launch a close ended equity scheme as “Birla Sun Life Focused Equity Fund-Series 6 and
Series 7”. The investment objective of the scheme is to generate capital appreciation, from a portfolio of equity securities specified as eligible
securities for Rajiv Gandhi Equity Savings Scheme, 2013 (RGESS).
ICICI Prudential MF announces Rollover under FMPICICI Prudential Asset Management Company has announced rolling over (extension of maturity date) of ICICI Prudential Fixed Maturity Plan - Series 72 -
500 Days Plan E. As per the announcement, roll over (extend the maturity date) of the Scheme is to July 27, 2017. The existing maturity date is June 4,
2015. Date of Roll over is June 5, 2015. Period of roll over is 784 days. All the other provisions of the SID/KIM of the scheme remain unchanged
Deutsche Mutual Fund introduces Hybrid Fixed Term Fund-Series 39 (1100 days).Deutsche Mutual Fund has launched the DWS Hybrid Fixed Term Fund-Series 39 (1100 days), a close ended income scheme. The NFO opens for
subscription on May 28, 2015 and closes on June 11, 2015. The investment objective of the scheme is generate income by investing in fixed income
securities maturing on or before the date of the maturity of the Scheme and to generate capital appreciation by investing in equity and equity related
instruments.
Axis Mutual Fund introduces Hybrid Fund-Series 24(1276 days)Axis Mutual Fund has launched the Axis Hybrid Fund-Series 24 (1276 days), a close ended income scheme. The NFO opens for subscription on May 28,
2015 and closes on June 10, 2015. No entry load and exit load will be applicable for the scheme. The investment objective of the scheme is to generate
income by investing in high quality fixed income securities that are maturing on or before the maturity of the Scheme whilst the secondary objective is
to generate capital appreciation by investing in equity and equity related instruments.
Sundaram Mutual Fund introduces Hybrid Series NSundaram Mutual Fund has launched the Sundaram Hybrid Series N, a close ended income scheme. The NFO opens for subscription on May 27, 2015 and
closes on June 10, 2015. No entry load and exit load will be applicable for the scheme. The minimum subscription amount is `5000. The investment
objective of the scheme is to generate capital appreciation and current income, through a judicious mix of investments in equities and fixed income
securities.
DSP BlackRock MF files offer document for Dual Ad Advantage Fund-Series 39 to 43DSP BlackRock Mutual Fund has filed offer document with SEBI to launch a close ended income scheme as “DSP BlackRock Dual Advantage Fund-Series 39
to 43”. The New Fund Offer price is Rs 10 per unit. Entry load and Exit load will be nil for the scheme. The investment objective of the scheme is to
generate returns and seek capital appreciation by investing in a portfolio of debt and money market securities. The schemes also seek to invest a
portion of the portfolio in equity & equity related securities to achieve capital appreciation. As far as investments in debt and money market securities
are concerned, the Schemes will invest only in securities which mature on or before the date of maturity of the Schemes
Fund Name NFO NFO Scheme Objective Fund Type Fund Class Fund Manager MinimumOpens on Closes on Amount
28-May-2015 10-Jun-2015 Close-Ended Growth `5000Axis Hybrid Fund - Series 24 (1276 Days) - Regular Plan (G)
Ashwin Patni
/ Devang
Shah
To generate income by investing in high
quality fixed income securities that are
maturing on or before the maturity of the
Scheme whilst the secondary objective is to
generate capital appreciation by investing
in equity and equity related instruments
NFOs WATCH
29-May-2015 03-Jun-2015 Close-Ended Growth `5000Birla Sun Life Fixed Term Plan - Series MR (1153 Days) Regular Plan (G)
Kaustubh
Gupta
to generate income by investing in a
portfolio of fixed income securities
maturing on or before the duration of the
Scheme.
17
®

18
MUTUAL FUND Performance Charts
Returns (%) Risk Market Cap (%)
Scheme Name NAV Launch QAAUM 3M 6M 1Y 3Y Since Std.Dev Beta Jenson LARGE MID SMALL DEBT &
(`) Date (` Cr.) Launch CAP CAP CAP OTHER
SBI Small & Midcap Fund - Growth 29.71 09-Sep-2009 269.23 0.07 14.91 69.36 41.98 20.98 2.46 0.81 0.59 9.32 42.47 39.39 8.82
Motilal Oswal MOSt Focu. Mid. 30 Fund - Reg - G 19.80 24-Feb-2014 341.73 3.31 19.19 64.12 N.A 72.37 2.42 0.71 0.76 13.46 84.96 N.A 1.59
DSP BlackRock Micro Cap Fund - Reg - G 39.52 14-Jun-2007 1843.73 3.93 11.97 63.21 38.87 18.85 2.60 0.78 0.68 N.A 78.26 14.06 7.68
Moti. Oswal MOSt Foc. Mult. 35 Fund - Reg - G 17.13 28-Apr-2014 1144.87 2.69 14.06 59.74 N.A 64.47 2.28 0.80 0.73 68.46 22.08 N.A 9.46
Kotak Emerging Equity Scheme - Reg - G 25.69 30-Mar-2007 509.81 0.05 9.01 55.15 32.99 12.25 2.33 0.87 0.44 22.91 63.71 10.08 3.30
Tata Mid Cap Growth Fund - Plan A - G 101.91 01-Jul-1994 405.09 0.38 11.12 53.77 36.08 11.74 2.48 0.88 0.51 22.98 59.62 13.25 4.15
UTI Mid Cap Fund - Growth 78.41 09-Apr-2004 2573.77 0.84 6.12 52.85 37.99 21.31 2.42 0.86 0.56 26.33 60.67 3.49 9.51
EQUITY (Diversified)
BALANCED
INCOME FUND
Note: Indicative corpus are including Growth & Dividend option. The above mentioned data is on the basis of 28/05/2015Beta, Sharpe and Standard Deviation are calculated on the basis of period: 1 year, frequency: Weekly Friday, RF: 7%
ULTRA SHORT TERM
SHORT TERM FUND
Due to their inherent long term nature, the following 3 categories have been sorted on the basis of 1 year returns
Due to their inherent short term nature, Short term funds and Ultra short term funds have been sorted on the basis of 6month and 3month returns respectively
Returns (%) Risk Market Cap (%)
Scheme Name NAV Launch QAAUM 3M 6M 1Y 3Y Since Std.Dev Jenson LARGE MID SMALL DEBT &
(`) Date (` Cr.) Launch CAP CAP CAP OTHER
Tata Balanced Fund - Plan A - Growth 169.57 08-Oct-1995 2236.32 -0.92 8.46 35.61 26.72 17.33 1.68 0.28 41.55 28.66 1.59 28.21
Franklin India Balanced Fund - Growth 89.99 10-Dec-1999 366.69 -0.21 6.02 33.11 23.90 15.26 1.52 0.23 53.48 12.08 N.A 34.44
SBI Magnum Balanced Fund - Growth 94.61 09-Oct-1995 1416.83 -0.54 6.41 31.14 26.87 16.95 1.53 0.27 33.43 24.82 10.90 30.85
L&T India Prudence Fund - Growth 19.16 07-Feb-2011 230.21 -0.92 6.72 30.39 25.23 16.31 1.49 0.29 38.16 23.93 2.83 35.09
DSP BlackRock Balanced Fund - Growth 106.80 27-May-1999 615.91 -0.49 3.70 28.69 19.28 15.94 1.75 0.17 42.00 27.19 3.21 27.60
HDFC Balanced Fund - Growth 107.12 11-Sep-2000 3365.53 -0.99 3.08 27.54 23.68 17.48 1.61 0.29 38.52 27.16 0.77 33.55
Canara Robeco Balance - Growth 110.77 01-Feb-1993 304.71 -1.31 2.97 26.62 21.69 11.55 1.84 0.20 31.66 34.21 5.73 28.40
Returns (%) RiskAverage Yield till
Scheme Name NAV Launch QAAUM Since Std. SharpeMaturity (Days) Maturity
1W 2W 1M 6M 1Y 3Y(`) Date (`Cr.) Launch Dev.
ICICI Prudential LTP - Prem - Growth 16.65 13-Jan-2010 391.81 8.59 21.01 -5.22 10.58 15.36 12.46 9.96 22.37 0.29 6533.50 7.91
Pramerica Dynamic Bond Fund - Growth 1328.12 12-Jan-2012 239.48 6.34 17.41 4.20 12.29 14.02 8.62 8.77 24.64 0.01 1689.95 8.19
IDFC D B F - Reg - Growth (Re-Launched) 16.93 03-Dec-2008 5243.75 6.26 21.16 -3.77 10.55 13.58 10.14 8.46 38.81 0.02 5164.75 7.90
Birla Sun Life Income Plus - DAP 15.90 06-Mar-2009 4767.43 6.86 21.10 -4.18 9.65 13.42 9.02 7.72 40.27 -0.03 N.A 7.96
IDFC SSIF - Invt Plan - Reg - Growth 34.10 14-Jul-2000 1936.40 5.97 21.04 -4.01 10.27 13.29 9.91 8.59 38.91 0.02 5175.70 7.90
UTI Bond Fund - Growth 41.96 04-May-1998 3242.33 9.87 22.33 -0.86 10.05 13.16 9.56 8.76 30.74 -0.01 4015.00 8.30
Sundaram Fle. Fund - Fle. Income - Reg - G 19.54 30-Dec-2004 342.15 10.67 25.00 3.13 9.16 13.14 7.98 6.64 38.40 N.A 2701.00 8.44
Annualised
Returns (%) Risk Average Yield tillScheme Name NAV Launch QAAUM Since Std. Sharpe Maturity (Days) Maturity
1W 2W 1M 6M 1Y 3Y(`) Date (`Cr.) Launch Dev.
Birla Sun Life Dynamic Bond Fund - Ret - DAP 17.05 08-Apr-2009 11471.00 10.60 15.63 3.08 11.92 13.41 10.52 9.08 23.35 0.09 N.A 8.67
DSP BlackRock Income Oppo. Fund - Reg - G 22.66 13-May-2003 1746.09 11.69 15.01 6.79 9.50 10.37 9.51 7.03 10.99 0.17 1314.00 10.45
HDFC HIF - Dynamic - Growth 48.09 27-Apr-1997 1816.59 5.66 19.50 -4.79 9.39 13.48 10.21 9.07 35.02 0.03 5938.55 7.99
Birla Sun Life Tre. Optimizer Plan - Reg - G 175.56 02-May-2008 3616.74 10.23 15.93 4.98 9.34 11.14 10.47 8.28 8.50 0.40 N.A 8.43
Franklin India STIP - Growth 2908.42 31-Jan-2002 10303.40 12.62 14.71 7.08 9.31 11.00 10.30 8.34 12.39 0.18 949.00 10.58
HDFC Short Term Plan - Growth 27.41 28-Feb-2002 2367.78 12.66 13.62 7.37 9.30 10.46 9.43 7.90 11.83 0.12 813.95 10.05
JPMorgan India Short Term Inc. Fund - G 15.52 25-Mar-2010 455.74 10.10 14.25 8.66 9.20 9.85 9.39 8.86 9.07 0.19 748.00 9.05
Annualised
Returns (%) Risk Average Yield tillScheme Name NAV Launch QAAUM Since Std. Sharpe Maturity (Days) Maturity
1W 2W 1M 3M 1Y 3Y(`) Date (`Cr.) Launch Dev.
Baroda Pioneer Tre. Adv. Fund - Plan A - G 1616.06 24-Jun-2009 1194.52 10.31 10.80 8.69 9.61 9.23 9.39 8.43 4.94 0.39 249.19 8.96
Franklin India Low Duration Fund - G 15.58 26-Jul-2010 3017.98 10.80 11.95 8.56 9.48 9.92 9.84 9.59 4.32 0.55 416.10 10.42
Tata Treasury Manager Fund - SHIP - G 1630.83 13-Jul-2007 279.71 9.76 11.75 8.93 9.43 9.40 9.41 6.40 5.82 0.37 264.32 8.60
Franklin India USB Fund - Retail - G 18.19 18-Dec-2007 6756.12 9.80 10.45 8.81 9.33 9.15 9.37 8.36 3.09 0.66 186.15 9.78
DWS Cash Opportunities Fund - Growth 18.95 22-Jun-2007 335.37 10.53 10.40 8.57 9.31 9.41 9.34 8.39 4.55 0.41 233.60 9.40
Indiabulls Ultra Short Term Fund - G 1357.29 06-Jan-2012 396.41 8.20 8.90 8.25 9.25 9.30 9.26 9.42 4.29 0.38 65.70 8.47
IDFC Ultra Short Term Fund - Reg - G 19.79 17-Jan-2006 2421.43 9.37 10.48 8.17 9.17 9.02 9.50 7.56 4.29 0.47 286.00 8.60
Annualised
®

D e l h i | M u m b a i | K o l k a t a | A h m e d a b a d | C h e n n a i | B e n g a l u r u | D u b a i
For Subscription Call 011-66075200, (IVR Option No. 2 "Customer Care") Or E-mail: [email protected]
REGISTERED OFFICE: 11/6B, Shanti Chamber, Pusa Road, New Delhi - 110005 • Tel +91-11-30111000 • Fax +91-11-25754365
SMC Global Securities Ltd. CIN No.: L74899DL1994PLC063609
NSE INB/INF/INE 230771431, BSE INB/INF/INE 011343937, MCX- SX INB/INF 260771432 INE 260771431, USEL INE 271343936, CDSL IN-DP-CDSL-583-2010, NSDL IN-DP-NSDL-333-2010 (SMC Global Securities Ltd.) NCDEX: NCDEX/TCM/CORP/0131, MCX: MCX/TCM/CORP/0385, NMCE: NMCE/TCM/CORP/0215, ICEX: ICEX/TCM/CORP/009, ACE: ACEL/CM/CORP/0267, UCX: 210001 (SMC Comtrade Ltd.), PMS INP000003435 (SMC Investments and Advisors Ltd.), IRDA Regi: No: DB 272/04 License No. 289 (SMC Insurance Brokers Pvt. Ltd.) , Merchant Banker INM000011427 (SMC Capitals Ltd.)
Investment in securities & commodities market are subject to market risk • All insurance products sold through SMC Insurance Brokers Pvt. Ltd. • Investment Banking Services provided by SMC Capitals Ltd. • Equity PMS and Wealth management services provided by SMC Investments & Advisors Ltd. • IPOs and Mutual Funds distribution service is provided by SMC Global Securities Ltd. • Financing Services provided by Moneywise Financial Services Pvt Ltd. • Insurance is the subject matter of solicitation • Commodity broking services provided by SMC Comtrade Ltd. • Real Estate Advisory services are offered through SMC Real Estate Advisors Pvt. Ltd. • Award sources: Best Financial Services Provider given to SMC Comtrade Ltd.• Property Consultant of the year (residential) given to SMC Real Estate Advisors Pvt. Ltd. • Zee Business Market Analyst Awards 2014 • Assocham - Excellence Awards 2015 • BSE-D&B Equity Broking Awards 2014,2013 & 2012 • Assocham SME Excellence Awards 2014 • Bloomberg-UTV Financial Leadership Awards 2012.
Disclaimer: SMC Global Securities Limited is proposing, subject to receipt of requisite approvals, market conditions and other considerations, a further public offering of its equity shares and has filed the Draft Red Herring Prospectus with the Securities and Exchange Board of India (“SEBI”) and the Stock Exchanges. The Draft Red Herring Prospectus is available on the website of SEBI at www.sebi.gov.in and on the websites of the Book Running Lead Manager i.e., ICICI Securities Limited at www.icicisecurities.com and the Co- Book Running Lead Manager i.e., Elara Capital (India) Private Limited at www.elaracapital.com. Investors should note that investment in equity shares involves a high degree of risk and for details relating to the same, please see the section titled “Risk Factors” of the aforementioned offer document.
2014 & '13
BEST EQUITY BROKING HOUSE-
DERIVATIVE SEGMENTAwarded by:
Investors' Protection Fund
2012
BESTCURRENCY
BROKERAwarded by:
2012
BEST EQUITY
BROKING HOUSE
Investors' Protection Fund
Awarded by:
2015
PROPERTY CONSULTANT OF THE YEAR - RESIDENTIAL
Awarded by:
ABP NEWS
2014ZEE BUSINESS
INDIA'S BEST MARKET ANALYST
COMMODITY FUNDAMENTAL Awarded by:
2015
BEST FINANCIAL SERVICES
PROVIDERAwarded by:
2014
BESTCOMMODITY
BROKERAwarded by:
Equity | Commodity | Currency | Wealth Management | Investment Banking | Insurance Broking | Real Estate Advisory
Distribution of IPOs, MF, FDs & Bonds | Financing | Institutional Broking | Clearing Services | NRI & FPI Services | Research
triverse
Trade like a smart trader with
"SMC Autotrender"
ACCESS FROM ANYWHERE (TRADING TERMINAL, DESKTOP, LAPTOP, TAB, MOBILE)
COVERS EQUITY (F&O STOCKS), | COMMODITY & CURRENCY | SHORT TERM &
LONG TERM TREND IDENTIFICATION | CREATE & TRACK TREND OF YOUR
PORTFOLIO ON EVERY LOGIN ID
EXCLUSIVELY FOR SUB-BROKERS & AUTHORISED PERSON
Get free subscription
of this software today!!