Embed Size (px)
Citation preview

University of South CarolinaScholar Commons
Theses and Dissertations
2015
Brand Positioning Map and Analysis Using WebScraping and Advertisement AnalysisSurya BhattUniversity of South Carolina - Columbia
Follow this and additional works at: https://scholarcommons.sc.edu/etd
Part of the Computer Engineering Commons, and the Computer Sciences Commons
This Open Access Thesis is brought to you by Scholar Commons. It has been accepted for inclusion in Theses and Dissertations by an authorizedadministrator of Scholar Commons. For more information, please contact [email protected].
Recommended CitationBhatt, S.(2015). Brand Positioning Map and Analysis Using Web Scraping and Advertisement Analysis. (Master's thesis). Retrieved fromhttps://scholarcommons.sc.edu/etd/3158

BRAND POSITIONING MAP AND ANALYSIS USING WEB SCRAPING AND
ADVERTISEMENT ANALYSIS
By
Surya Bhatt
Bachelor of Technology
National Institute of Technology Bhopal, 2013
Submitted in Partial Fulfillment of the Requirements
For the Degree of Master of Science in
Computer Science and Engineering
College of Engineering and Computing
University of South Carolina
2015
Accepted by:
Csilla Farkas, Director of Thesis
Rafael Becerril, Reader
John Rose, Reader
Lacy Ford, Vice Provost and Dean of Graduate Studies

ii
© Copyright by Surya Bhatt, 2015
All Rights Reserved.

iii
ACKNOWLEDGEMENTS
I’d like to thank Dr. Csilla Farkas for giving me this excellent opportunity and
flexibility to pursue thesis on such an interesting topic. Her guidance has been
insurmountable throughout the course. I’d also like to thank Dr. Rafael Becerril for giving
me great ideas to incorporate in the research. Also helping me figure out my exact topic
for the thesis. The help given by Dr. John Rose has been unprecedented when it came to
programming related issues, taking logical steps forward and Big Data infrastructure
related information. The research wouldn’t have seen the light of the day if it were not this
awesome mentoring by all of them.

iv
ABSTRACT
There’s a significant increase in online consumer forums. When customers set out
to buy a product they use these forums to form an opinion. Our research focuses on
comparing Brand positioning maps based on consumer reviews. We also analyse the
impact of advertisements and expert reviews. Our goal is to show that combining consumer
reviews with ads and electronic media will help us analyze the effectiveness of advertising
on brand positioning maps. This approach shall also help us in making association graphs
for a brand using words of perception/opinion associated with that brand/product. Which
may in turn assist companies in improving the focus of their advertisements to persuade
the required set of crowd and influence the public perception.

v
TABLE OF CONTENTS
ACKNOWLEDGEMENTS ........................................................................................................ iii
ABSTRACT .......................................................................................................................... iv
CHAPTER 1: INTRODUCTION……………………………………………………………......1
CHAPTER 2 RELATED WORK .................................................................................................5
CHAPTER 3 RESEARCH PROBLEMS ........................................................................................8
CHAPTER 4 APPROACH FOR THE TASKS ..............................................................................10
CHAPTER 5 BRAND POSITIONING MAPS’ ANALYSIS ...........................................................20
CHAPTER 6 CONCLUSION ....................................................................................................26
REFERENCES .......................................................................................................................28
APPENDIX A: CODE IMPLEMENTATION ...............................................................................31

vi
LIST OF FIGURES
Figure 1.1 Illustrative Brand Positioning Map ....................................................................4
Figure 4.1 Analysis Process Flow Diagram .......................................................................12
Figure 4.2 BMW 3 and 7 Network Graph .........................................................................15
Figure 4.3 Honda’s Network Graph...................................................................................16
Figure 4.4 Acura’s Network Graph ...................................................................................17
Figure 4.5 Kia Soul, Nissan Leaf Network Graph .............................................................18
Figure 4.6 Generalized perception graph for all the models considered ...........................19
Figure 5.1 Sales of Toyota over time .................................................................................20
Figure 5.2 Sales of all cars in the US .................................................................................21
Figure 5.3 Brand Positioning Map for Toyota Corolla ......................................................22
Figure 5.4 Brand Positioning Map for Toyota Corolla with reviews and ads ...................24
Figure 5.5 Brand Positioning Map for Toyota Corolla with just social media ..................25
Figure A.1 Process of a Web Scraper ................................................................................31
Figure A.2 Multi-threaded Web Scraper Flow Diagram ...................................................32

1
CHAPTER 1
INTRODUCTION
by vet4 on Sep 3, 2014
Vehicle: 2014 BMW 3 Series 328d 4dr Sedan (2.0L 4cyl Turbo diesel 8A)
Have owned it for 3 mos. includes premium package. Handles very well but would suggest
getting an extended warranty if you plan to keep it beyond 4 yrs.
(Source: Edmunds.com)
The above excerpt of an automobile review from Edmunds.com provides potential
buyers with useful information. Consumers regularly survey online reviews and ratings of
the product they want to purchase. Reviews have a lot of information that can be explored.
Websites and smartphone applications facilitate the spread of the voice of a consumers.
Internet has also led to bridging the gap between an expert on a product and a common
user. In this new generation where people make well informed decisions when buying a
product, consumer reviews gain increased importance. Potential consumers use them for
making the right choice. Manufacturers use the reivews to influence and estimate the
behavior of consumers.
Also the advertisements that we see or hear have an impact on our buying decisions
and consumer perceptions [Hong-Youl Ha, 2004]. These advertisements help in decision
making of the consumers [Abernethy and Franke 1996].
One of our intermediate tasks will involve estimating the public sentiment relating
to a company/ a brand. This analysis relies on reviews and advertisements. Assmus et. al.
established that advertisements do affect sales [Gert Assmus et. al. 1984].

2
Our goal was to build a tool that measures the affect of advertisements and electronic
media on Brand Positioning Maps. Our finding will allow companies to use
advertisements to alter the brand positioning map. It has been observed [Kamakura and
Moon, 2014] that consumer reviews also account as a factor in the brand positioning
maps. We will build brnad positioning maps using consumer reviews then using reviews
with advertisements and other forms of online media. We used car company’s and
model’s reviews for this research but it applies equally well for any other field. The
amount of data makes it a Big Data application. Especially if the advertisements are
analyzed in the real time from media sources. In the thesis executed the following tasks:
Task 1 - Scrape through online review web pages from different websites. The web
scraper then gives all the reviews in a crude format. Similarly, audio and video
advertisements, expert reviews, blogs are transcribed for a similar analysis as text.
Task 2 – Analyze collected data. Stanford Part of Speech tagger [Toutanova et. al.
2003] is used to mark out all the adjectives and adverbs associated with a car brand.
Adjectives and adverbs have been used to identify user’s satisfaction with a
product. Also we used a word dictionary to find objectivity and sentiment
associated with all the sentences in the text along with the degree of sentiment
associated.
Task 3 – Build a brand positioning map using the data from task 2. This information
can be used by industries in improved product positioning strategies and modify
their advertisements in a direction they find themselves lacking.
The Figure 1.1 below shows the initial position of a product (Honda Accord) on a
Product Positioning Map. This has been formed after analyzing the consumer reviews. As

3
the map shows, people consider the price of Accord to be affordable and are quite satisfied
with it as well.
This is close to being an ideal situation for the consumers when they pay less and get
more satisfaction. Thus, the ideal position for any product in this map would be on the left-
top corner. Unless the goal of the company is to build a product for the elite class. In which
case the product will have to be in the right top corner ideally. Advertisements could help
change this position as: Let’s assume Honda Accord lacks security features. Company can
add those and advertise, describing how they have added six air bags for added safety. As
advertising affects sales and consumer opinions [Gert Assmus et. al. 1984] the product
positioning maps are bound to change.
The changes in these maps could either be:
a) Attracting new customers in the masses by making changes and adding features to
increase satisfaction and reduce price.
b) For the premium segments, maintaining the customer base even while increasing
the prices for cars.
The anticipated transitions in the Map above can be vertically upwards or horizontally
left/right as per the company’s requirement. Using these maps in our research we were able
to evaluate the percentage change brought in consumer perception using advertisements,
expert reviews and other electronic media influences.

4
Figure 1.1 Sample Brand Positioning Map depicting directions which a product may take
In the remaining of this thesis, in section 2, we have described most of the related
work in this area, in section 3 the main research problem is posed and a solution is given.
Section 4 talks about the approach taken for solving this problem. The generated Brand
Positioning Maps are analyzed in section 5. I have concluded the topic in section 6.

5
CHAPTER 2
RELATED WORK
Analyzing consumer reviews is not a novel idea. It has been highlighted in many previous
researches [Harold H. Kassarjian, June 1977]. Kassarjian in Content Analysis of Consumer
Research analyzed the content for more than just a company’s public image. It was also
used for objectivity analysis, theme of advertisement, information contained in the
advertisements etc. This paper also advocated on how content analysis must be objective,
systematic and quantitative. The sentiment and objectivity analysis tools help us in
achieving these objectives quite well. Also advertisement analysis has been studied during
the last decade [Grahame Dowling and Boris Kabanoff 1996, Avery Abernethy, 1996].
They analyzed different types of information that is conveyed in advertisements like
performance, availability, price, safety etc. The author uses Analysis of covariance
(ANCOVA) to find out correlation between various factors and how do they affect in more
informative advertisements. While Dowling focused his pioneering research on advertising
slogans using computer-aided text analysis. The author established that how some slogans
leave a stronger impression on the masses. That is also a reason why in the current research
there is a need to include sentiment analysis along with the emphatic weightage of each
word. There also has been a recent research on making a brand positioning map using
public reviews. Kamakura and Moon in 2014 built positioning maps for wine and hotel
industries.

6
Though we’d think that the expert reviews for wines are always very subjective and the
paper couldn’t handle it well. We found the ontology built for hotel reviews very accurate
and have tried to incorporate something similar and improved in our research project.
Considering the big data aspect, there has been research showing that this social
engineering is part of the future applications in big data. For example in the paper: Critical
Questions for Big Data, Boyd and Crawford, 2012, it has six provocations which bring the
issues needing Big Data. Making Big Data a technological, cultural phenomenon that rests
on the interplay of technology, analysis and clever judgments. In which social analytics
were highlighted to be one of the key applications of big data.
On the technical part on the different methods of analysis, there’s also a tool,
Opinion Finder [Opinion Finder: Source 2003, 2005] which is used to find polarity in
sentences based on many NLP software packages. It is a system that processes documents
and automatically identifies subjective sentences and sentiment expressions as being
positive or negative.
OpinionFinder goes through the following steps:
1) Preprocessing
It also uses Stanford Part of Speech Tagger to sentence split and part-of-speech tag the
documents.
2) Feature Finder
A helper text document for identifying subjective sentences.

7
3) Rule-based Subjectivity Classifier
It relies on manually crafted rules to tag sentences in the document as subjective or
objective with a very high precision and low recall.
4) Subjectivity Classifier
The subjectivity classifier tags sentences in the document as subjective or objective based
on a trained model on the MPQA Corpus. There are various tagging models to choose
from.
5) Polarity Classifier
The polarity classifier tags the words in the document with their contextual polarity based
on a model trained on the MPQA Corpus.
6) SGML markup
The original document is re-written with inline SGML markup with the output of the
classifiers.
Indexing of words is crucial in this project. It will be done by using Stanford Part of
Speech Tagger [Toutanova et. al. 2003] (POS Tagger), which is a software that reads text
and assigns parts of speech to each word such as noun, verb, adjective, etc. The English
taggers use the Penn Treebank tag set. POS Tagger helps in the extraction of sentiment
and other kinds of social meaning, including politeness, bias, friendliness, and flirtation,
from speech and text. These tools help us keep the overall text-processing objective.

8
CHAPTER 3
RESEARCH PROBLEMS
It is commonly observed that a company tries to increase its reputation and participate in a
more reputed group of companies. For example Acura from the Honda Motor Co. Ltd.
would make efforts to be better than or seen alongside names like BMW A.G. and
Mercedes Benz. There’s always a scope to improve the way we present our product to the
consumer to make it stand above others. The companies are always in competition for
standing above others. The way they could do this is to gauge from the market what the
consumers think of them, and then improve the minus points of the product through ads.
Currently just the analysis of public reviews on online forums has been used to prepare
brand positioning maps. Which are very informative on how should a product be placed
and promoted. Though this research is fairly significant, it lacks a wider scope of all-
inclusiveness.
3.1 The overview of the complete research is as follows:
1) A web scraper is used to gather public reviews for three segment of cars – lower
priced, mid-priced, and high-priced cars. These three segments are taken to prevent
any bias from a particular class of consumers. Example – owners of higher end cars
might not write reviews as frequently as those in the mid segment cars. Two
websites have been used for web scraping purposes – Edmunds.com and Cars.com.
and editorials have been taken from Autocar blog.

9
We could have included more number of websites and even e-newspapers and
editorials, but the scope of this project precluded it. Also text is transcribed from
video reviews and advertisements of the car companies.
2) A word-by-word tagging is done using Part of Speech Tagger on each car’s review.
Out of these texts, it is observed that people mostly use adjectives or action words
(adverbs mostly) to express their content or discontent towards a product. For
example – fuel-efficient, good mileage, quickly, smoothly etc. So a list of all the
words associated with a car type are extracted. Since individual products are
responsible for the brand image, results are later aggregated for each company, in
our case, Honda LLC and Toyota’s Corolla.
3) The filtered bag of text is scored with a reference dictionary of words and relative
emphasis they have. Whether it was meant in a positive/ negative/ neutral
connotation each word gets a score. Also mostly it’s observed that people do not
post much bad reviews after buying expensive cars. It’s subtle to figure out, but
possible as observed through the results. Or the defense to this can be that expensive
car owners do not come as frequently to write reviews.
4) At the same time Video reviews are also transcribed using Sphinx4, an audio
transcription library developed by Carnegie Mellon University [Walker et. al.
2004].
5) The results from steps two, three and four are correlated to produce analytic graphs.

10
CHAPTER 4
APPROACH FOR THE TASKS
It is primarily an implementation based research, in which Computing tools are used to
derive the best possible marketing insights estimating public opinion at large. The solution
proposed in this research has four marquee stages. The first stage involves scraping of the
reviews from various websites. Two websites have been scraped for reviews by product’s
name and then by the company’s name. In the first case, the reviews were limited to the
year 2011 to take into account the effect of advertisements on reviews after 2011. The
sources used were Edmunds.com and Cars.com. The web scraper uses multi-threading to
reduce the processing time. This parallelization could also be done by using Hadoop to
further enhance speed if we were to deal with a very large number of reviews like those in
the electronics industries. This part has mostly been done in Java and the reviews are
collected together. Figure 4.1 shows the outline of the analysis.
A web crawler has been implemented taking skeleton code from the web and improvising
it as per our needs. Please refer the Appendix for details.

11
There are two main methods that need to be overridden:
shouldVisit – It is used for the crawler to decide whet1her the URL should be
crawled or not. Which is used to limit the crawler from going to media pages and
scraping media files.
Visit - This function is called after the content is downloaded from the URL. It can
be used to manipulate the information just obtained.
The crawler uses maven library dependency from University of California, Irvine that has
essential jar files for multithreaded crawler functions.
The limitation of the crawler is that it does not go through password-protected
websites. But in our case, both the review websites do not necessarily need a log in to see
the reviews. All the crawl data is stored in an intermediate folder. We can also vary the
number of threads initiating the crawl, the depth of crawling in pages and number of pages
to be visited. Simultaneously audio files are transcribed using the Sphinx4 library and
merged into the same text file having all the reviews.
In the next stage of our research we use the Stanford Part of Speech Tagger. It uses
a tagging model, which is a collection of sentences used to train the Tagger. So that the
next time it recognizes a word structure it becomes able to qualify a word with a particular
part of speech. It is a process in which we can always refine our results based on which
data set we use.

12
Figure 4.1: Overview of the Analysis Process

13
Stumbling upon different tagging models for English text, we decided to use bidirectional-
ditsim-wsj-018-tagger because it has a reported accuracy of 97.32% [Robert C Moore,
2014] in identifying parts of speech, which is slightly better than the other tagger models
available. Another advantage of using this tagger is that it has language models for English,
Chinese, Arabic, French and German. Which may improve the scalability of the project if
extended.
A sample input to the tagger (from Stanford CoreNLP project’s sampleinput.txt):
“A passenger plane has crashed shortly after take-off from Kyrgyzstan's capital, Bishkek,
killing a large number of those on board. The head of Kyrgyzstan's civil aviation authority
said that out of about 90 passengers and crew, only about 20 people have survived. The
Itek Air Boeing 737 took off bound for Mashhad, in north-eastern Iran, but turned round
some 10 minutes later.”
The output from the Stanford POS tagger is:
“A_DT passenger_NN plane_NN has_VBZ crashed_VBN shortly_RB after_IN take-
off_NN from_IN Kyrgyzstan_NNP 's_POS capital_NN, _, Bishkek_NNP ,_, killing_VBG
a_DT large_JJ number_NN of_IN those_DT on_IN board_NN ._. The_DT head_NN
of_IN Kyrgyzstan_NNP 's_POS civil_JJ aviation_NN authority_NN said_VBD that_IN
out_IN of_IN about_IN 90_CD passengers_NNS and_CC crew_NN ,_, only_RB about_IN
20_CD people_NNS have_VBP survived_VBN ._. The_DT Itek_NNP Air_NNP
Boeing_NNP 737_CD took_VBD off_RP bound_VBN for_IN Mashhad_NNP ,_, in_IN
north-eastern_JJ Iran_NNP ,_, but_CC turned_VBD round_NN some_DT 10_CD
minutes_NNS later_RB ._.”

14
After all the words are tagged with part of speech tags, we had selected only the adjective
and adverb related words (JJ and RB). Since mostly adjectives and adverbs are the parts of
speech used for expressing views. Out of the list of words, we make the perception network
graphs using the most frequent words.
Figure 4.2 shows one of the network association graphs in which significant
reviews were marked for BMW 3 series and 7 series. To decide significant words
associated with a product, we’ve extracted the most commonly occurring words easy to
display from the reviews. As has been explained previously, we have selected adjectives
and adverbs as parameters for expression. In case of a draw in the frequency of a word,
which was observed in many cases, we’ve chosen all the words unless we run out of the
ability to display them clearly. The central Nodes in the graph represent the car names.
Other nodes represent specific properties/words mentioned in the reviews. A line from
central node to other represents association of both. From the graph it can be observed that
powerful, fast, tough, huge, automatic and beautiful are the words that commonly occur
between these two car types. The only words with negative connotation that were mostly
found in this graph were boring and annoying. Hence these word choices suggest that when
a customer sets out to buy a BMW he/she’s looking for something closer to a bond car.
Similar word network graph is shown for Honda Accord and Fit. From the reviews, it has
been seen that out of the datasets from Honda, BMW, Kia, Lexus and Nissan’s chosen cars,
Honda had the most number of reviews and with mostly a positive feedback.

15
Figure 4.2 Network graph for perceptions for BMW 3 and 7 series until year 2011
The negative adjective that shows up in this graph is again ‘annoying’, well not literally.
Also it is good to know that a two string word ‘fuel-efficient’ was a common one for both
the cars.
Figure 4.4 shows a graph for Acura RLX and TLX. While the common words in a
similar graph for Acura RLX and TLX were midsize and comfortable, the negative
connotation words were tedious and not great. It might show less words for Honda and
Acura because of random words causing the data to be unclean.

16
Figure 4.3. A similar perception network graph for Honda Accord and Honda Fit
There’s also a network graph made with Kia Soul and Nissan Leaf in Figure 4.5. These
cars were observed to have comparatively less positive reviews than the other products in
all the companies considered. Nissan leaf, even after advertising about its eco-friendly all-
electric car, hasn’t been able to compete with cars from a similar segment and is suggested
in the consumer reviews. In comparison to Kia soul, it was in a better position though. Most
of the comments for Soul described it as cubic, small and box-shaped which suggests the
design wasn’t liked by many consumers. Though manually going through the reviews
showed that some consumers also found it spacious for them.

17
Figure 4.4 Perception Network graph for Acura RLX and Acura TLX
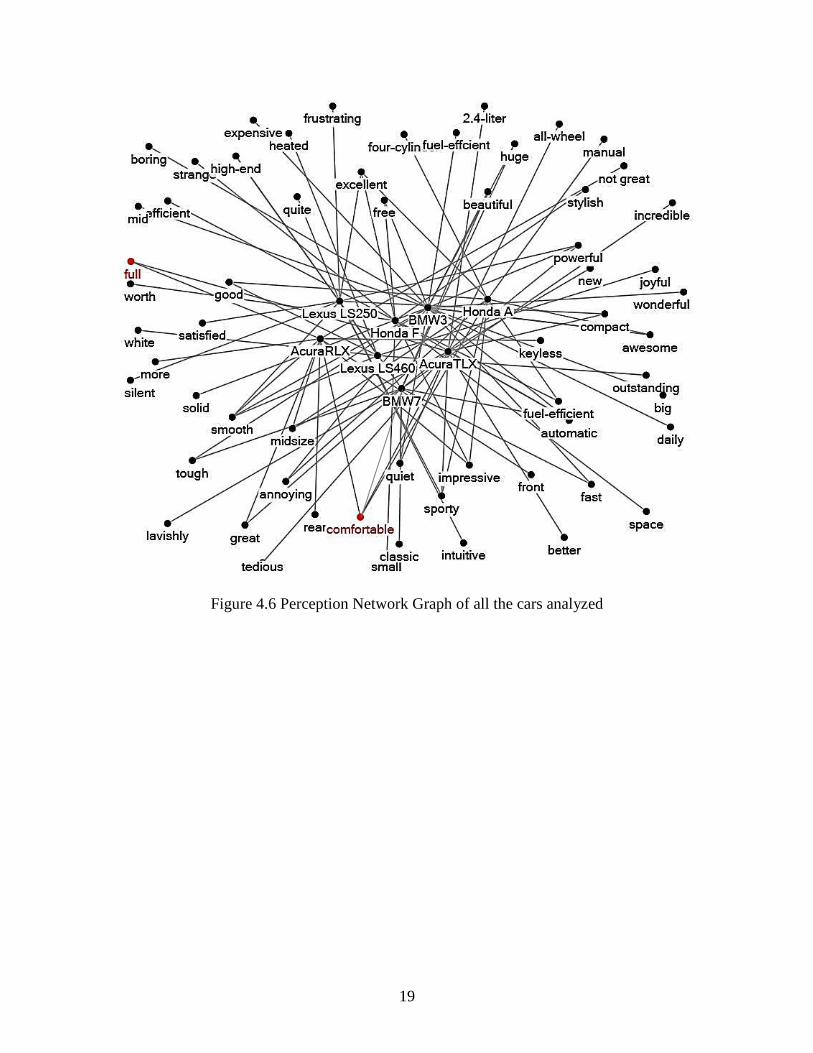
In Figure 4.6 when we analyze all the cars together we find every consumer agreed to
their cars being ‘comfortable’.
Which demonstrates that all the car companies mentioned fulfil at the least this
basic criterion. So the competing point wouldn’t be about comfort anymore, since a car
worth $16K as well as one worth $90K car are felt comfortable in these records for
respective consumers. It is the additional features that amount to greater consumer
satisfaction. It might also be wrong in a way; to assert the previous statement because
‘comfortable’ is a very common, subjective and colloquial word unlike cozy or some other
complicated synonym. Or if the user prefers to write with a negation like ‘not comfortable’.

18
Figure 4.5 Perception network Graph for Kia Soul and Nissan Leaf
19
Figure 4.6 Perception Network Graph of all the cars analyzed

20
CHAPTER 5
BRAND POSITIONING MAPS’ ANALYSIS
We have chosen a specific case study of Toyota Corolla to support our research. All the
process described in section 4 is done twice. First taking consumer reviews and data just.
Then taking the consumer reviews, advertisements, expert reviews until 2014. Since there
was a huge recall of Toyota cars from 2009 until 2011, the overall sales of Corollas went
down. Consumers’ confidence in the brand name also took a toll in general since
Umbrella branding does have an effect on the brand itself [Mary Sullivan, 1990]. In the
graph it is observed that the sales dipped significantly in 2007, ‘08 and ‘09. [US Toyota
Corolla Sales, Goodcarbadcar.com]
Figure 5.1: Sales of Toyota Corolla over time

21
This trend is contradicting to the overall market trends in which sales of all the
cars in the US increased in the same period from 2009 onwards. The sales dip in Corolla
can be attributed to mass product recalls for Corolla starting 2009 and less popularity
before those years.
Figure 5.2: Contribution of Corolla in the overall car sales in US over time
It is also seen that the sales of Toyota Corolla increased significantly in and after
2009. There must have been significant improvements introduced or clarifications made
by Toyota which persuaded more number of consumers to buy their product. Or at least
consumer perception improved because of some input from the product’s advertisements
and expert reviews on the newer models.
The Brand Positioning Map obtained from Toyota Corolla’s reviews are presented
in Figure 5.3. We had to divide the reviews into three segments to analyze year by year.
Car brands introduce car models almost every year. It is possible that reviews were

22
improved because of many new features in a model. It is an assumption that when a
consumer goes through reviews, a review 6 years older than that present time might not be
as much valuable. So we have year blocks 2006-‘08, 2009 – ’11 and 2012- ‘14. Also for
the price, average price paid during that period is taken from Edmunds.com.
Figure 5.3: Brand Positioning Map for Toyota’s Corolla over the years
The number of reviews collected from 2008 and previous years were much more than
recent models. The reason being reviews for used car models which date back to even
decades ago. As it was seen, the Brand Positioning Map failed to capture public sentiment

23
and mostly gave a neutral consumer perception when the time interval was increased. The
perception scorer found almost equal amount of words with a positive and negative
connotation. This also suggests that if we have more data from more sources, we’ll be
needing more than just word scores to gauge the overall polarity of the review set.
Considering the Brand Positioning Map which we have created, it shows Corolla’s
market position with and without advertisements for the three set of years. The consumer
satisfaction on the Y axis is based on the perception scores obtained from the dictionary.
The scores obtained are shown in table 5.1.
Table 5.1: Perception Scores Table for Toyota Corolla with and without Advertisements
Year and Type Score from Dictionary Normalization on Y axis
2006-‘08 w/o ads, reviews 34.155 2.3
2006-’08 w/ ads, reviews 43.618 3.58
2009-‘11 w/o ads, reviews 18.788 1.04
2009-‘11 w/ ads, reviews 30.010 1.97
2012-‘14 w/o ads, reviews 60.87 4.5
2012-‘14 w/ ads, reviews 59.728 4.4
Taking the case of the period from 2009-2011, it is seen that Corolla has a place on the
Brand Positioning Map having the largest gap with and without advertisements and expert
reviews. Our BPM has a range on X and Y axis from -4.5 to +4.5. When we compare it to
the position where Corolla stands today, we find that it has risen in price as well as the
consumer satisfaction has increased. We considered video reviews from experts in the data

24
taken from 2012 to 2014 period as well as during period 2009-2011. Also the map suggests
the public sentiment falling in general from 2008-10 to 2009-11. It is also the time at which
there’s highest percentage increase in perception score at a given time. From a score of
18.788 to 30.010 it’s a 59.72% increase in 2009-11. This change has been brought about
by the inclusion of social media. To measure this change quantifiably, we also have a Brand
Position Map for just advertisements and just consumer reviews in Fig. 5.4 and Fig. 5.5.
Figure 5.4: Corolla BPM with independent points for reviews and e media with ads

25
Figure 5.5: Corolla Brand Positioning Map with just the e media and ads’ effects

26
CHAPTER 6
CONCLUSION
Social engineering can render deep insights into what’s going on in consumer’s minds,
what is the purchase pattern of people, their likes and dislikes etc. Consumer reviews have
been gaining attention lately due to the increase in computing resources and Big Data
processing capability. Having gone through many journals to gauge the public sentiment,
we thought that there is a huge potential in analysis if we combine the results from
consumer reviews and advertisements. With the help of analysis of this text we’d be able
to observe changes in the Product Positioning Maps for various cars. These maps can be
very useful for the companies to improve their sales. For Example, if we were concerned
about sales of Honda Motor Co. Ltd.’s Fit, we’d see that even after being inexpensive, what
all factors are creating a bad image of the car. Say those were mileage and safety. Then
Honda can improve upon those factors in their advertisements advocating how have they
improved upon mileage and introduced more safety measures in the car. But why do this
research when car companies after launching a car already do the surveys? The reason is
that in these surveys mostly they use a restricted vocabulary in which they ask a fixed set
of questions. Hence it becomes more like a closed ended question. While when consumers
write the reviews themselves, they highlight all the pressing needs in the car and all the
shiny features it has both, without being strait-jacketed into a set of questions. Thus making
this research go deeper into the requirements of the consumers.

27
In the direction of the future of this research, I find that print media, blogs, and
permission based scraping of chats must also be added to utilize most of the intellectual
input that consumers get. Which can be added later if the research problem further calls
for.

28
REFERENCES
Thomas Y. Lee and Eric T. Bradlow. October 2011. Automated Marketing Research
Using Online Customer Reviews. Journal of Marketing Research Vol. XLVIII.
Seshadri Tirunillai and Gerard J. Tellis. August 2014. Mining Marketing Meaning From
Online Chatter: Strategic Brand Analysis of Big Data Using Latent Dirichlet Allocation.
Journal of Marketing Research Vol. LI
Oded Netzer, Ronen Feldman, Jacob Goldenberg, Moshe Fresko, (2012) Mine Your Own
Business: Market-Structure Surveillance through Text Mining. Marketing Science 31(3):
521-543.
OpinionFinder: Subjective Sentence Classifiers: Ellen Riloff and Janyce Wiebe (2003).
Learning Extraction Patterns for Subjective Expressions. Conference on Empirical
Methods in Natural Language Processing (EMNLP-03). ACL SIGDAT. Pages 105-112.
OpinionFinder: Source Identifier: Yejin Choi, Claire Cardie, Ellen Riloff, and Siddharth
Patwardhan (2005). Identifying Sources of Opinions with Conditional Random Fields
and Extraction Patterns. Proceedings of Human Language Technology
Conference/Conference on Empirical Methods in Natural Language Processing
(HLT/EMNLP 2005), Vancouver, Canada.
OpinionFinder: Direct Subjective and Speech Event Identifier: Yejin Choi, Eric Breck,
and Claire Cardie (2006). Joint Extraction of Entities and Relations for Opinion
Recognition. Conference on Empirical Methods in Natural Language Processiong
(EMNLP-2006).
OpinionFinder: Polarity Classifier: Theresa Wilson, Janyce Wiebe and Paul Hoffmann
(2005). Recognizing Contextual Polarity in Phrase-Level Sentiment Analysis.
Proceedings of Human Language Technologies Conference/Conference on Empirical
Methods in Natural Language Processing (HLT/EMNLP 2005), Vancouver, Canada.

29
Kristina Toutanova, Dan Klein, Christopher Manning, and Yoram Singer. 2003. Feature-
Rich Part-of-Speech Tagging with a Cyclic Dependency Network. In Proceedings of
HLT-NAACL 2003, pp. 252-259
Harold H. Kassarjian. June 1977. Content Analysis in Consumer Research. Journal of
Consumer Research. pp. 8-18.
Avery M. Abernethy and George R. Franke. Summer 1996. The Information Content of
Advertising: A Meta-Analysis. Journal of Advertising.
Grahame R. Dowling and Boris Kabanoff. January 1996. Computer-Aided Content
Analysis: What Do 240 Advertising Slogans Have in Common? pp 63-75.
Wagner A. Kamakura and Sangkil Moon. April 2014. A picture is a worth a thousand
words: Translating product reviews into a brand-positioning map. Ebape FGV.
Hong-Youl Ha, 2004, Factors influencing consumer perceptions of brand trust online.
Journal of Product and Brand Management.
Mary Sullivan, July 1990, Measuring Image Spillovers in Umbrella Branded Products,
The Journal of Business, Vol. 63, No.3, pp. 309-329.
GoodCarBadCar.net, 2015, “Toyota Corolla Sales Figures”, Data source: Automakers
and Automotive News Datacenter
Robert C. Moore, 2014, Fast High-Accuracy Part-of-Speech Tagging by Independent
Classifiers, proceeding of COLING 2014, pages 1165-1176, Ireland
Github.com/yasserg/crawler4j, 2014, README.md, Open Source Web Crawler for Java.
Willie Walker, Paul Lamere, Philip Kwok, Bhiksha Raj, Rita Singh, Evandro Gouvea,
Peter Wolf and Joe Woelfel, 2004, Sphinx-4: A flexible open source framework for
speech recognition, ACM Digital Library

30
APPENDIX A: CODE IMPLEMENTATION
To collect reviews from all the web pages related to a car, a basic web scraper was
implemented. Firstly using a single threaded synchronous crawler. This class used
HttpClient package from Apache HttpClient Module to get the content out of the web
pages. The Java script used and file extenstions were filtered out using the Regular
Expression: “.*(\\.(css|js|bmp|gif|jpe?g" + "|png|tiff?|mid|mp2|mp3|mp4"
+ "|wav|avi|mov|mpeg|ram|m4v|pdf" + "|rm|smil|wmv|swf|wma|zip|rar|gz))$”
All of the HTML tags were stored in hash maps with value being the content of all of the
tags as strings. These values were then compared to a preset Enum type having all the
commonly used HTML tags. In case of <href> tags, the links were extracted. In case of
paragraph elements and body tags all the text was kept as it is. It is also the reason the word
helpful appears in all the reviews. Because all the reviews ended with an element called
“helpful” to mark out all the helpful reviews. The text was then curated to remove most of
such redundant text and garbage.
The basic flow diagram of the web crawler implementation is shown in Figure
A.1: The information to be retained is stored in a temporary file. This temporary file gets
overwritten each time a crawler is run. This kind of web crawler worked very well for
crawling on a page-by-page basis. But in case of many sub-links in the page, it was stuck
because of blocking operation of the single threaded application.

31
Figure A.1: Overall process used by web scraper
The program had to wait until the page was completely loaded. Instead we chose to
modify the multi-threaded web crawler implemented at UC Irvine using our custom
classes. This web crawler uses multi-threaded synchronous crawler, which optimizes the
use of CPU clock cycles as well as the time to load the web pages. The maven
dependencies download the needed jar files for the crawler classes to be used. In our case
using only two crawlers fetched good results. The way this multi-threaded crawler is set
up can be shown by Fig. A2.

32
Figure A.2: Multithreaded Web Scraper
The two main classes which were used to change the parameters for scraping are
BasicCrawlController.java and BasicCrawler.java.
BasicCrawlController.java:
import edu.uci.ics.crawler4j.crawler.CrawlConfig;
import edu.uci.ics.crawler4j.crawler.CrawlController;
import edu.uci.ics.crawler4j.fetcher.PageFetcher;
import edu.uci.ics.crawler4j.robotstxt.RobotstxtConfig;
import edu.uci.ics.crawler4j.robotstxt.RobotstxtServer;
/**
* @author Surya Bhatt
**/
public class BasicCrawlController {
public static void main(String[] args) throws Exception {
if (args.length != 2) {
System.out.println("Needed parameters: ");
System.out.println("\t rootFolder (it will contain intermediate crawl data)");
System.out.println("\t numberOfCralwers (number of concurrent threads)");
return;
}

33
/*
* crawlStorageFolder is a folder where intermediate crawl data is
* stored. Args[0] gives the directory information where intermediate scraped *
data is to be stored.
*/
String crawlStorageFolder = args[0];
/*
* numberOfCrawlers shows the number of concurrent threads that should
* be initiated for crawling. Args[1] gives the number of crawlers which we
* want to implement, which we have kept as 2.
*/
int numberOfCrawlers = Integer.parseInt(args[1]);
CrawlConfig config = new CrawlConfig();
config.setCrawlStorageFolder(crawlStorageFolder);
/*
* We must make sure that we don't send more than 1 request per
* second due to some websites' IP blocking rules(1000 milliseconds between
requests).
*/
config.setPolitenessDelay(1000);
/*
* We can set the maximum crawl depth here. The default value is -1 for
* unlimited depth. But we left it at 2 since we didn't want the crawler to run for a long
time.
*/
config.setMaxDepthOfCrawling(2);
/*
* We can set the maximum number of pages to crawl. The default value
* is -1 for unlimited number of pages. A safe limit for all inclusion is 1000
*/
config.setMaxPagesToFetch(1000);
config.setResumableCrawling(false);
/*
* Instantiate the controller for this crawl. */
PageFetcher pageFetcher = new PageFetcher(config);
RobotstxtConfig robotstxtConfig = new RobotstxtConfig();
RobotstxtServer robotstxtServer = new RobotstxtServer(robotstxtConfig,
pageFetcher);

34
CrawlController controller = new CrawlController(config, pageFetcher,
robotstxtServer);
/*
* For each crawl, we need to add some seed URLs. These are the first
* URLs that are fetched and then the crawler starts following links
* which are found in these pages. Here we have taken only 1 car model-specific URL
as our
* seed URL to get reviews related to just one model every time. Here, H Civic
*/
controller.addSeed("http://www.edmunds.com/honda/civic/2013/sedan/consumer-
reviews/");
//controller.addSeed("http://SOME_OTHER_URL.com");
/*
* Start the crawl. This is a blocking operation, meaning that our code
* will reach the line after this only when crawling is finished.
*/
controller.start(BasicCrawler.class, numberOfCrawlers);
}
}
BasicCrawler.java:
import edu.uci.ics.crawler4j.crawler.Page;
import edu.uci.ics.crawler4j.crawler.WebCrawler;
import edu.uci.ics.crawler4j.parser.HtmlParseData;
import edu.uci.ics.crawler4j.url.WebURL;
import java.util.List;
import java.util.Set;
import java.util.regex.Pattern;
import org.apache.http.Header;
/**
* @author Surya Bhatt
**/
public class BasicCrawler extends WebCrawler {
//The regex pattern used for filtering all kinds of media files and spammy ad URLs.
private final static Pattern FILTERS = Pattern.compile(".*(\\.(css|js|bmp|gif|jpe?g" +
"|png|tiff?|mid|mp2|mp3|mp4"
+ "|wav|avi|mov|mpeg|ram|m4v|pdf" + "|rm|smil|wmv|swf|wma|zip|rar|gz))$");
35
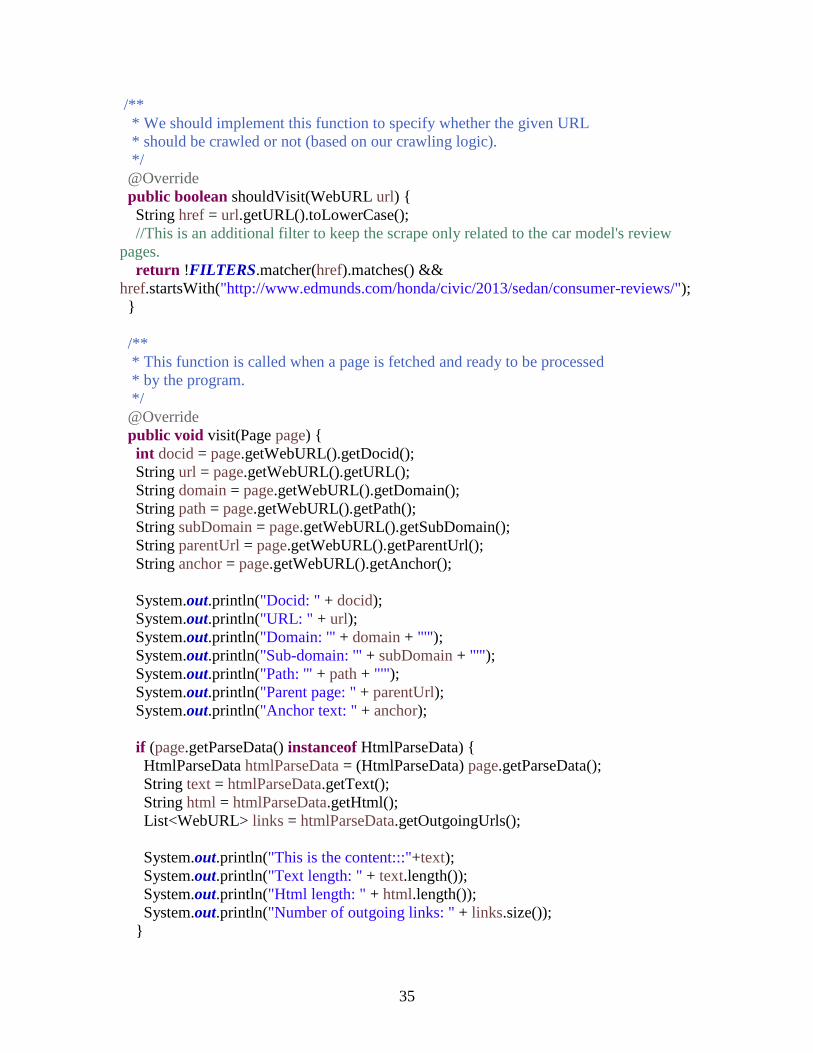
/**
* We should implement this function to specify whether the given URL
* should be crawled or not (based on our crawling logic).
*/
@Override
public boolean shouldVisit(WebURL url) {
String href = url.getURL().toLowerCase();
//This is an additional filter to keep the scrape only related to the car model's review
pages.
return !FILTERS.matcher(href).matches() &&
href.startsWith("http://www.edmunds.com/honda/civic/2013/sedan/consumer-reviews/");
}
/**
* This function is called when a page is fetched and ready to be processed
* by the program.
*/
@Override
public void visit(Page page) {
int docid = page.getWebURL().getDocid();
String url = page.getWebURL().getURL();
String domain = page.getWebURL().getDomain();
String path = page.getWebURL().getPath();
String subDomain = page.getWebURL().getSubDomain();
String parentUrl = page.getWebURL().getParentUrl();
String anchor = page.getWebURL().getAnchor();
System.out.println("Docid: " + docid);
System.out.println("URL: " + url);
System.out.println("Domain: '" + domain + "'");
System.out.println("Sub-domain: '" + subDomain + "'");
System.out.println("Path: '" + path + "'");
System.out.println("Parent page: " + parentUrl);
System.out.println("Anchor text: " + anchor);
if (page.getParseData() instanceof HtmlParseData) {
HtmlParseData htmlParseData = (HtmlParseData) page.getParseData();
String text = htmlParseData.getText();
String html = htmlParseData.getHtml();
List<WebURL> links = htmlParseData.getOutgoingUrls();
System.out.println("This is the content:::"+text);
System.out.println("Text length: " + text.length());
System.out.println("Html length: " + html.length());
System.out.println("Number of outgoing links: " + links.size());
}

36
Header[] responseHeaders = page.getFetchResponseHeaders();
if (responseHeaders != null) {
System.out.println("Response headers:");
for (Header header : responseHeaders) {
System.out.println("\t" + header.getName() + ": " + header.getValue());
}
}
System.out.println("=============");
}}
After the text was scraped from all the required pages, we used Stanford Part of Speech
Tagger to tag the text according to different parts of speech. We have filtered out the
words and have only used adjectives, adverbs and their variations for analysis because
these are the words mostly used for describing things.
The Tagger class used for the Stanford Part of Speech Tagger:
import java.io.BufferedReader;
import java.io.FileNotFoundException;
import java.io.FileReader;
import java.util.Arrays;
import edu.stanford.nlp.tagger.maxent.MaxentTagger;
public class TagText {
public static void main(String[] args) throws Exception {
//Specify which Tagger training model to use
MaxentTagger tagger = new MaxentTagger("taggers/english-left3words-
distsim.tagger");
String sample = "";
try{
BufferedReader br;
br = new BufferedReader(new FileReader
("C:/Users/Vaio/Desktop/HondaAllCarsReviews.txt"));
while (br.readLine() != null){
sample = sample.concat(br.readLine());
}
//rest of the reading code here

37
br.close();
} catch(Exception e){
System.out.println("Error!");
}
// The tagged string
String tagged = tagger.tagString(sample);
// Output the result
String[] wordList = tagged.split(" ");
int count =0;
for (int i = 0; i < wordList.length; i++) {
//Regex in which JJ is for Adjectives and RB for Adverbs filtering
if (wordList[i].matches("(.*)_JJ|(.*)_RB")) {
System.out.println(wordList[i]);
count++;
}
}
System.out.println(count);
}
}
After collecting the list of all the relevant words in separate text files, we needed to
perform sentiment analysis. One of the approaches initially used was OpinionFinder to find
the sentiment related to each sentence. But it failed to recognize the strength of an adjective.
Whether it had an extreme or a subtle emphasis. For improving which we had used a
dictionary by linguistics at Carnegie Mellon University which has 18580 action words and
adjectives scored according to the strength they have. All of these words were scored
according to the emphasis in sentiment they had between +1 and -1. -1 for extremely
negative connoted words and +1 for extremely positive words. For example - hapless has
a score of -1, while uneasy has -0.625, while epic has a score of 1. These words were saved
in a map and checked to match the input text files. This gave us a better score of the measure
of what strong / weak sentiments are floating in the reviews.

38
Here is the code used for which in the class WordScorer.java :
WordScorer.java
import java.io.BufferedReader;
import java.io.FileNotFoundException;
import java.io.FileReader;
import java.io.IOException;
import java.util.Collections;
import java.util.Comparator;
import java.util.HashMap;
import java.util.Iterator;
import java.util.LinkedHashMap;
import java.util.LinkedList;
import java.util.List;
import java.util.Map;
import java.util.Map.Entry;
import java.util.Set;
public class WordScorer {
static HashMap <String, Double> wordMap = new HashMap <String, Double>();
public static void main(String[] args) throws IOException {
// The dictionary is first read from the file path.
double score;
String word;
double CustomerSatisfactionScore = 0;
BufferedReader br = new BufferedReader(new FileReader
("C://Users/Vaio/Desktop/sentiwords.txt"));
String line;
while ((line = br.readLine()) != null) {
String[] values = line.split("\\t");
score = Double.parseDouble(values[0].toString());
word = values[1];
//System.out.println("Not Printing file content:");
wordMap.put(word, score);
}
br.close();

39
BufferedReader brText = new BufferedReader(new
FileReader("C://Users/Vaio/Desktop/CorollaRevAfterRecall.txt"));
String textLine;
HashMap <String, Double> scoreCounts = new HashMap <String,
Double>();
while ((textLine = brText.readLine()) != null) {
String [] words = textLine.split("\\s+");
for (int i = 0; i < words.length; i++){
if (wordMap.get(words[i]) != null){
if (scoreCounts.get(words[i]) != null){
scoreCounts.put(words[i],
(scoreCounts.get(words[i]) + Math.abs(wordMap.get(words[i]))));
CustomerSatisfactionScore +=
wordMap.get(words[i]);
} else {
scoreCounts.put(words[i],
Math.abs(wordMap.get(words[i])));
System.out.println(CustomerSatisfactionScore);
CustomerSatisfactionScore +=
wordMap.get(words[i]);
}
}
}
}
scoreCounts = sortByComparator(scoreCounts, true);
Set keys = scoreCounts.keySet();
for (Iterator i = keys.iterator(); i.hasNext();) {
String key = (String) i.next();
Double value = scoreCounts.get(key);
System.out.println("Key: "+key + ", Value: " + value);
//CustomerSatisfactionScore += value;
}
System.out.println(CustomerSatisfactionScore);
}
private static HashMap<String, Double> sortByComparator(HashMap<String,
Double> unsortMap, final boolean order)
{

40
List<Entry<String, Double>> list = new LinkedList<Entry<String,
Double>>(unsortMap.entrySet());
// Sorting the list based on values
Collections.sort(list, new Comparator<Entry<String, Double>>()
{
public int compare(Entry<String, Double> o1, Entry<String, Double> o2)
{
if (order)
{
return o1.getValue().compareTo(o2.getValue());
}
else {
return o2.getValue().compareTo(o1.getValue());
}
}
});
// Maintaining insertion order with the help of LinkedList
HashMap<String, Double> sortedMap = new LinkedHashMap<String,
Double>();
for (Entry<String, Double> entry : list)
{
sortedMap.put(entry.getKey(), entry.getValue());
}
return sortedMap;
}
}
After we had obtained the scores related to all the words, they were used to make
perception graphs and Brand Positioning Maps.