Embed Size (px)
Citation preview
International Journal of Aviation, International Journal of Aviation,
Aeronautics, and Aerospace Aeronautics, and Aerospace
Volume 6 Issue 3 Article 10
2019
Brand Awareness, Purchase Intention and Price Premium of Brand Awareness, Purchase Intention and Price Premium of
International Airlines Operating between Australia and the United International Airlines Operating between Australia and the United
Kingdom Kingdom
Yi Gao Purdue University, [email protected] Nigel Wai Keong Choy Swinburne University of Technology, [email protected]
Follow this and additional works at: https://commons.erau.edu/ijaaa
Part of the Management and Operations Commons, and the Tourism and Travel Commons
Scholarly Commons Citation Scholarly Commons Citation Gao, Y., & Choy, N. W. (2019). Brand Awareness, Purchase Intention and Price Premium of International Airlines Operating between Australia and the United Kingdom. International Journal of Aviation, Aeronautics, and Aerospace, 6(3). https://doi.org/10.15394/ijaaa.2019.1345
This Article is brought to you for free and open access by the Journals at Scholarly Commons. It has been accepted for inclusion in International Journal of Aviation, Aeronautics, and Aerospace by an authorized administrator of Scholarly Commons. For more information, please contact [email protected].

Introduction
Air transportation is a competitive industry, both domestically and
internationally. With the deregulation of the airline industry in major domestic
markets such as the United States and Australia (Airline Deregulation Act, 1978;
Bureau of Transport Economics, 1995) and the wide adoption of open skies
agreements (U.S. Department of State, n.d.) on international markets, it has
become increasingly rare to spot a busy route that is serviced by a single carrier.
Airlines are flocking to profitable routes, trying tirelessly to differentiate
themselves from competitors, and brawling for higher market shares.
The competition among airlines offers travelers with more choices. While
the fundamental product provided by airlines in essence is similar to each other,
which is to carry passengers and cargo from origins to destinations, flights
operated by different carriers do differentiate from each other in terms of
departure/arrival times, number of stops, aircraft types, etc. There have been a
plethora of studies addressing factors that could influence passengers’ choice of
airlines (Brey & Walker, 2011; Gao & Koo, 2014; Moreno, 2006; Yai, Takada, &
Okamoto, 1997). Among these factors, airfare plays a critical role in travelers’
decision making, especially to budget-sensitive leisure travelers.
As most other consumer goods or services, flights offered by airlines are
priced differently and dynamically. Due to the wide application of Global
Distribution System (GDS), airlines’ pricing is entirely transparent to each other.
An airline could almost respond simultaneously to any price adjustment made by
competitors. However, airlines are still charging distinctive airfares on the same
route for the same departure and arrival date. This suggests that the pricing power
of airlines is obviously not identical.
At the time of booking, tangible differences in flights are presented to
travelers, such as departure/arrival times, number of connections, aircraft type and
cabin classes. These visible advantages or disadvantages are already priced in
displayed airfares. Less preferred flights such as red-eye flights or indirect flights
are usually more competitively priced in order to compensate for inconveniences.
Pricing of flights is also determined by subjective and intangible factors such as
travelers’ preferences and perceptions of the airlines’ overall brand reputation.
Such preferences and perceptions could be from previous experience with the
airline, or stem from brand equity of airlines.
Brands are an essential element of modern life, and have a strong impact
on how products and services are being perceived and valued. “The perceived
added value that a brand gives to a product, when compared to the same
unbranded product” is defined as brand equity (Macias & Rodriquez, 2018, p.2).
Brand equity has multiple dimensions. In one of his most cited works, Aaker
(1996) provided a framework of 10 dimensions in evaluating and tracking brand
1
Gao and Choy: Branding of international airlines between Australia and UK
Published by Scholarly Commons, 2019

equity, which are price premium, satisfaction/loyalty, perceived quality,
leadership, perceived value, brand personality, organizational associations, brand
awareness, market share and price, and distribution indices.
Another frequently mentioned concept is brand strength, which is how
consumers perceive and behave towards a brand in the marketplace (Anselmsson,
Vestman Bondesson, & Johansson, 2014; Persson, 2010). Brand strength is
regarded by many as a component of brand equity, along with brand image and
brand value (Keller & Lehmann, 2003; Persson, 2010). Brand strength itself is
composed of two dimensions, which are brand loyalty and price premium. Price
premium means the amount a customer will pay for the brand in comparison with
another brand offering similar benefits (Aaker, 1996). Price premiums are widely
viewed as the most useful dimension in measuring brand equity (Aaker, 1996;
Blackston, 1995; Sethuraman, 2001).
Quite a number of studies have been conducted in different domains to
analyze the influence of brand equity on price premium. In the Swedish grocery
retail industry, Anselmsson et al. (2014) found that in addition to traditional brand
equity dimensions, uniqueness is also a dimension of brand equity and thus drives
price premium for grocery products of different brands. This supports their earlier
findings on brand equity model (Anselmsson, Johansson, & Persson, 2007). In
Japan, Masuda and Kushiro (2018) found that among the four conventional brand
equity dimensions, which are awareness, loyalty, perceived quality, and brand
associations, loyalty has the most significant effect on consumers’ willingness to
pay price premium for private labels in fresh produce. In Spain, researchers have
studied a very specific product, olive oil (Gómez, Martín‐Consuegra, Díaz, &
Molina, 2018). The determinants they examine are awareness, corporate social
responsibility, origin, quality and positioning. This is different from conventional
brand equity models, such as Aaker’s (1996). Their study finds that positioning is
the strongest and unique determinant of price premium, and four other
determinants will only drive brand loyalty but not price premium. Through a
specially designed experiment, Suchomelova, Prochazka, and Durinik (2017)
identify that personal interest will drive consumers to pay price premium for
products that they feel emotionally attached. In this specific case, it is shopping
bags, mugs, and tank tops bearing visual references to consumers’ local culture.
There has been quite an effort trying to find a brand equity model that fits
the airline industry. Sarker, Mohd-Any, and Kamarulzaman (2019) conduct a
systematic and critical review of consumer-based brand equity literature. They
narrowed down from initially 1.8 million search results to finally four highly cited
models. Considering the nature of airlines being a service industry, they
recommend the service branding model proposed by Berry (2000). In this model,
Berry clarifies the difference between brand meaning and brand awareness. Brand
meaning is the customers’ dominant perceptions of the brand, or the immediate
2
International Journal of Aviation, Aeronautics, and Aerospace, Vol. 6 [2019], Iss. 3, Art. 10
https://commons.erau.edu/ijaaa/vol6/iss3/10DOI: https://doi.org/10.15394/ijaaa.2019.1345

impression when the brand is mentioned. And brand awareness is whether the
customers have heard of the brand or not (Berry, 2000). Both brand meaning and
brand awareness are contributing to brand equity, though at different extents.
Berry (2000) suggests that brand meaning is only affected by direct service, but
brand awareness can be affected by the indirect experience (communications) as
well as company’s presented brand.
Researchers are trying to develop a more airline-specific brand equity
model. Chen and Tseng (2010) propose that brand awareness, brand image,
perceived quality and brand loyalty would constitute a customer-based airline
brand equity model. They suggest brand loyalty is the primary determinant of
brand equity among these four dimensions. This model is a subset of Aaker
(1996). Three out of the four dimensions are from Aaker’s original brand equity
ten, with the only difference being brand image. But even this dimension could be
represented by brand value and brand personality from Aaker (1996). Another
customer-based airline brand equity model also has four dimensions: airline flight
service quality, airline brand affect, airline brand awareness, and airline brand
association (Thakshak, 2018). Except for airline brand affect, three other
dimensions are also from Aaker’s (1996) brand equity ten. Brand effect here
refers to the emotional feeling and attitude toward brand, which in essence is
similar to Aaker’s customer satisfaction dimension. Therefore, no completely new
dimension has actually been developed for the airline industry from either study.
There are also applied brand studies in air transportation. For instance,
Chen and Chang (2008) analyzed the relationship between brand equity, brand
preference, and customers’ purchase intentions on international air passengers’
decision in Taiwan using simultaneous maximum-likelihood-estimation. Their
study found that brand equity had a positive effect on both brand preference and
purchase intentions for the high switching cost group. However, for the low
switching cost group, the effect of brand equity on purchase intentions is not
significant. Another study by Jeng (2016) does not use any of the above-
mentioned brand equity model. Instead, it is about the relationship between brand
credibility and consumer purchase intention, which is found to be positive. Brand
credibility would increase consumers’ decision convenience and enhance
affective commitment.
Motivated by the aforementioned studies, especially ones in the air
transportation sector, and intrigued by how people perceive airlines brands, this
study aims to investigate the effect of brand awareness on purchase intention and
price premium on a specific route: Australia - the United Kingdom. A specific
route is used in order to enhance the relatedness of participants to survey
questions, and the UK is selected due to the close economic, ethnic and historical
tie between the two nations. Research questions to be addressed by this study
include:
3
Gao and Choy: Branding of international airlines between Australia and UK
Published by Scholarly Commons, 2019

• How familiar are people living in the metropolitan Melbourne area with
international airlines operating between Melbourne the United Kingdom?
• What effect does brand awareness have on passengers’ purchase intention and
price premium of airfares when travelling internationally?
Method
To collect travelers’ perceptions and preferences of airline brands, this
study used the method of survey. Surveys are known to be able to collect
responses from samples of decent size efficiently and effectively. Subjectivity of
researchers could be controlled in the process of data collection. The instrument
used by the survey for data collection is constructed and administered by
researchers of this study. The collection of responses from survey participants has
been approved by the ethics committee of the university with which researchers
are affiliated to ensure the rights of participants are properly protected.
There are multiple factors that could affect travelers’ choice of flights
when making reservations for trips (Gao & Koo, 2014). This study eliminated
factors that were not directly related to the research questions in constructing a
basic international trip scenario. Without listing marketed airfare,
departure/arrival times, or connections, the study only presented participants a
simplified round trip from Melbourne to London. Survey participants were asked
about their familiarity and preferences with regards to airlines that are currently
operating between Australia and the United Kingdom.
The survey questionnaire was composed of six questions, to directly
address the key issues and, at the same time, to remove the barrier of
participation. In the first three questions, participants are asked to provide basic
background information, including age group they belong to, income bracket, and
their travel frequencies in the last 12 months. By collecting such data, it was
anticipated that statistical analysis could be conducted later to compare responses
from participants of different sub-groups.
Question 4 checked how familiar participants were with airlines that
operate between Australia and the UK, with or without connections. Participants
were presented with 16 different airline logos and are asked by researchers in
person to name all the airlines they recognize. It was expected that false claims of
recognition could be reduced to minimum through this approach.
Question 5 asked participants to list up to three airlines that they would be
more likely to fly. Participants were provided with a reference airfare (A$2,000),
to be used to help make the decision if they are willing to pay that amount or
more to fly with the chosen airlines. This question intended to measure
passengers’ purchase intention with different airlines.
In Question 6, survey participants were asked to group airlines into two
categories, using “+” or “–“ marks. If the participant related a particular airline to
4
International Journal of Aviation, Aeronautics, and Aerospace, Vol. 6 [2019], Iss. 3, Art. 10
https://commons.erau.edu/ijaaa/vol6/iss3/10DOI: https://doi.org/10.15394/ijaaa.2019.1345

the premium brand category, then the airline would be marked as “+”. By
contrast, if an airline was perceived to be more of a discount brand, then the
participant put it into the “-“ group. Participants were only asked to group airlines
that they had a strong opinion about instead of being required to mark all the
airlines. By doing so, this study collected a more accurate impression of
participants.
In addition to the descriptive analysis which are used to investigate brand
awareness, purchase intention, and price premium of survey participants with
airlines operating between Australia and the UK, this study also conducted a
series of statistical analysis to examine the correlation among these factors,
separately for each airline. Due to the design of the survey instrument, responses
to Q4-Q6 are categorical in nature. Therefore, Chi-Square test of association was
used here. Assumptions for Chi-square test of association are examined before
these tests are conducted (McHugh, 2013). As suggested, Cramer’s V was
calculated to measure the strength of correlation.
The three null hypotheses used in Chi-square tests are:
𝑯𝟎𝟏: There is no association between brand awareness and purchase
intention for airlines being investigated in this study.
𝑯𝟎𝟐: There is no association between brand awareness and price
premium for airlines being investigated in this study.
𝑯𝟎𝟑: There is no association between purchase intention and purchase
intention for airlines being investigated in this study.
IATA 2-letter codes are used to denote airlines in the results section. See Table 1
for the mapping between airlines and IATA codes.
Table 1
IATA codes for airlines
IATA
Code Airline IATA Code Airline
AI Air India GA Garuda Indonesia
BA British Airways KE Korean Air
CX Cathay Pacific Airways MH Malaysia Airlines
MU China Eastern Airline QF Qantas Airways
CZ China Southern Airline QR Qatar Airways
EK Emirates BI Royal Brunei Airlines
EY Etihad Airways SQ Singapore Airlines
BR EVA Air TG Thai Airways
5
Gao and Choy: Branding of international airlines between Australia and UK
Published by Scholarly Commons, 2019

Results
Data collection of this study occurred near the Glenferrie Train Station of
Melbourne, Australia. A research team collected responses from participants
using face-to-face approach. Convenience sampling was adopted by this project
out of practical considerations. The research team had approached a total number
of 500 passers-by in a 4-week period during September - October 2017. Potential
participants were briefed with the purpose of the project and were presented with
the consent statement before they decided to participate. A total number of 259
valid responses were collected, representing a response rate of 51.8%.
As of the demographic information, survey participants were mostly
candid about their age and travel frequency in the previous year, but were
reluctant to disclose income. More than half of the participants chose “not to
disclose” even they were only asked to indicate the range of income. As the data
was collected in a public space near a major university, approximately 40% of the
participants were 25 years old or younger, and close to 70% of the participants
were 35 years or younger at the time of data collection. See Table 2 for the
summary of demographic data.
Table 2
Summary of Demographics
Variable Level Count Percentage
Age 18-25 105 40.54%
26-35 74 28.57%
36-45 42 16.22%
46-59 28 10.81%
60+ 4 1.54%
Prefer not to say 6 2.32%
Income $0-$18,200 36 13.90%
$18,201-$37,000 32 12.36%
$37,001-$87,000 32 12.36%
$87,000-$180,000 5 1.93%
$180,001+ 4 1.54%
Prefer not to say 150 57.92%
Trips 0 70 27.03%
1-5 165 63.71%
6-10 18 6.95%
11-20 1 0.39%
20+ 1 0.39%
6
International Journal of Aviation, Aeronautics, and Aerospace, Vol. 6 [2019], Iss. 3, Art. 10
https://commons.erau.edu/ijaaa/vol6/iss3/10DOI: https://doi.org/10.15394/ijaaa.2019.1345

In terms of brand awareness, as expected for an Australia-based sample,
the most recognized airline logo is Qantas. Seventy-four-point one percent
(74.1%) of the participants successfully named the Kangaroo symbol among all
the logos. Singapore Airlines, Thai Airways, Emirates, and Malaysia Airlines are
also more recognizable than other airlines. The least recognized brands are
Garuda Indonesia (7.7%), China Eastern (7.7%), and Korean Air (8.1%). See
Figure 1 for brand awareness standings.
Figure 1. Airline brand awareness by numbers and by percentages.
In terms of the purchase intention and airline preference, 115 out of 259
survey participants picked Qantas over other airlines when flying to the UK,
putting the flag carrier of Australia as the most preferred airline. This is followed
by Singapore Airlines (96), and Emirates (92). Airlines that received less than 10
votes in this question are Garuda Indonesia (1), China Eastern Airlines (2), Air
India (3), Korean Air (5), Royal Brunei Airlines (6), and China Southern Airlines
(7). See Figure 2 for standings of airline purchase intention.
7
Gao and Choy: Branding of international airlines between Australia and UK
Published by Scholarly Commons, 2019

Figure 2. Preferred airlines for travelling between AU & UK.
Question 6 intended to capture the relationship between brand awareness
and price premium (or discount). Qantas and Emirates received the most
favorable votes as the premium airline choice while receiving only a small
number of votes as discount brands. Thai Airways, thought as one of the most
recognizable brands among survey participants, was considered by 75 participants
as a discount choice when flying to the UK. Another interesting finding is
Singapore Airlines. When other airlines were viewed either as premium or
discount choices in a convincing way, Singapore Airlines received 66 premium
votes and 49 discount votes, displaying a dichotomous choice among participants.
See Figure 3 for details of response to this question.
8
International Journal of Aviation, Aeronautics, and Aerospace, Vol. 6 [2019], Iss. 3, Art. 10
https://commons.erau.edu/ijaaa/vol6/iss3/10DOI: https://doi.org/10.15394/ijaaa.2019.1345

Figure 3. Premium choice vs. discount choice.
Assumptions necessary for Chi-square tests are examined according to
McHugh (2013). The first five assumptions with regard to the nature of measures
themselves can be easily met. The focus of the assumption check is on the very
last one: The value of the cell Expected Count should be 5 or more in at least 80%
of the cells, and no cell should have an expected of less than one. Results of the
assumption check are summarized in Table 3. The primary cause for airlines
failing to meet the assumption requires is due to the low number of votes received
for those airlines. When these assumptions are met, the validity of Chi-square
tests can be guaranteed.
9
Gao and Choy: Branding of international airlines between Australia and UK
Published by Scholarly Commons, 2019
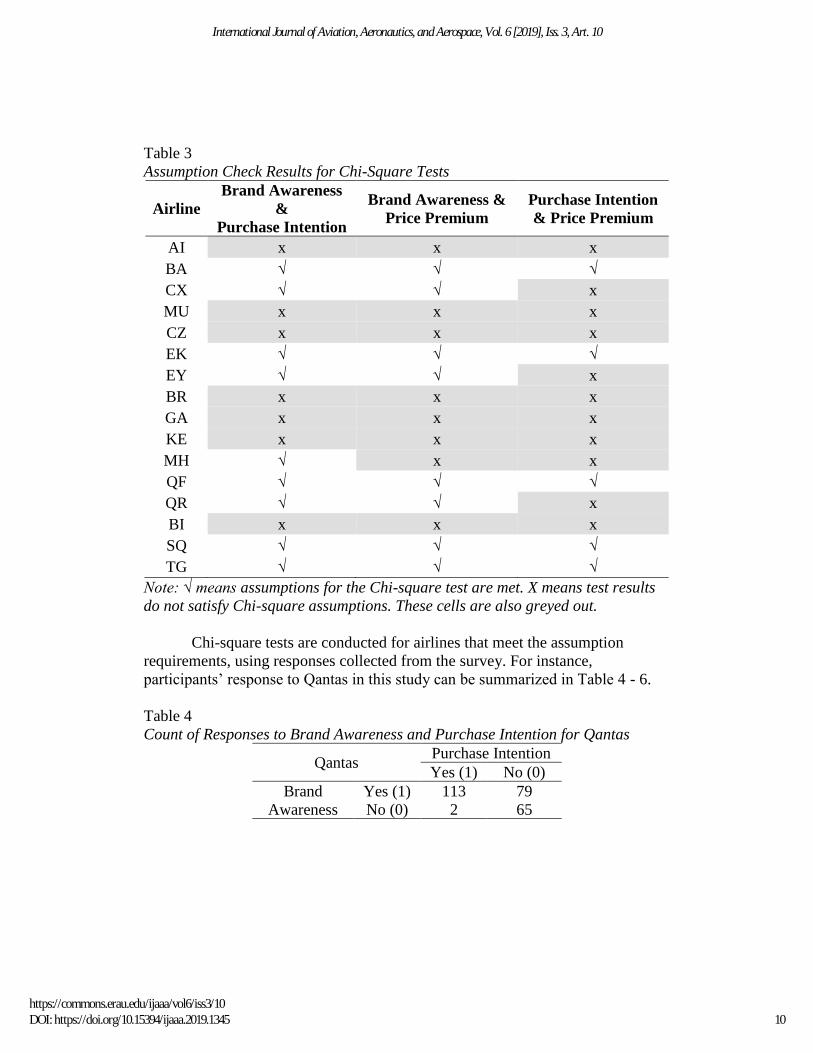
Table 3
Assumption Check Results for Chi-Square Tests
Airline
Brand Awareness
&
Purchase Intention
Brand Awareness &
Price Premium
Purchase Intention
& Price Premium
AI x x x
BA √ √ √
CX √ √ x
MU x x x
CZ x x x
EK √ √ √
EY √ √ x
BR x x x
GA x x x
KE x x x
MH √ x x
QF √ √ √
QR √ √ x
BI x x x
SQ √ √ √
TG √ √ √
Note: √ means assumptions for the Chi-square test are met. X means test results
do not satisfy Chi-square assumptions. These cells are also greyed out.
Chi-square tests are conducted for airlines that meet the assumption
requirements, using responses collected from the survey. For instance,
participants’ response to Qantas in this study can be summarized in Table 4 - 6.
Table 4
Count of Responses to Brand Awareness and Purchase Intention for Qantas
Qantas Purchase Intention
Yes (1) No (0)
Brand
Awareness
Yes (1) 113 79
No (0) 2 65
10
International Journal of Aviation, Aeronautics, and Aerospace, Vol. 6 [2019], Iss. 3, Art. 10
https://commons.erau.edu/ijaaa/vol6/iss3/10DOI: https://doi.org/10.15394/ijaaa.2019.1345

Table 5
Count of Responses to Brand Awareness and Price Premium for Qantas
Qantas
Price Premium
Discount Group
(-1)
No Response
(0)
Premium Group
(1)
Brand
Awareness
Yes
(1) 27 79 86
No
(0) 1 63 3
Table 6
Count of Response to Purchase Intention and Price Premium for Qantas
Qantas
Price Premium
Discount Group
(-1)
No Response
(0)
Premium Group
(1)
Purchase
Intention
Yes
(1) 11 29 75
No
(0) 17 113 14
With the exception of the test between brand awareness and price
premium for Thai Airways, all other Chi-square test results are significant.
Cramer’s V is also calculated for these tests. Per Akoglu (2018), Cramer’s V
between 0.15 and 0.25 means the association between two variables is strong, and
Cramer’s V above 0.25 is considered to be very strong. Refer to Table 7 for Chi-
square test results and Cramer’s V. It is worth mentioning that due to skewed
distribution of age, income and travel frequencies of this sample, comparisons
between different sub-groups could not produce meaningful results. Results of
these comparisons are not reported here.
According to Cohen (1988), when df=1 and effect size is at least 0.30, the
minimum sample size required is 198 to support a strong power of test being as
0.95. The effective sample size used by this study is 259, which means the current
sample size is large enough for the purpose of the study.
11
Gao and Choy: Branding of international airlines between Australia and UK
Published by Scholarly Commons, 2019

Table 7
Summary of Chi-Square Test Results and Cramer’s V
Airline
Brand Awareness &
Purchase Intention
Brand Awareness &
Price Premium
Purchase Intention &
Price Premium
P-value Cramer’s V P-value Cramer’s
V P-value Cramer’s V
BA <0.001 0.402 <0.001 0.367 <0.001 0.610
CX <0.001 0.278 <0.001 0.343
EK <0.001 0.568 <0.001 0.489 <0.001 0.672
EY <0.001 0.422 <0.001 0.473
MH <0.001 0.217
QF <0.001 0.492 <0.001 0.465 <0.001 0.592
QR <0.001 0.391 <0.001 0.368
SQ <0.001 0.548 <0.001 0.354 0.041 0.157
TG <0.001 0.426 0.072* 0.142 0.009 0.190
Note: 𝛼 = 0.05 is used for all the tests above as the level of significance.
* The only test that is not significant is between brand awareness and price
premium for Thai Airways.
Discussion
This study inevitably has its limitations. Due to the location and timing of
data collection, the sample used by this study is skewed to the younger end of the
age spectrum. Considering their travel frequency in the previous 12 months, the
sample is mostly composed of leisure travelers. Therefore, results of this study
may only represent part of, rather than the entire, population of Australia. In
addition, as any other survey-based research, this study cannot ensure all
participants have provided honest answers to the survey questions, even the
research team has given their best effort to verbally communicate with every
participant to explain research objectives and to double check the accuracy of
responses provided.
The approach to data collection could potentially contribute to the
significance found by this study. Rather than asking participants directly if they
have heard of a certain airline to measure brand awareness, researchers ask
participants to name airline logos they could recognize. Recognition is a stronger
form of awareness in that it indicates not only knowledge of existence but also
familiarity. Meanwhile, for purchase intention and price premium, a verbal
confirmation in a survey does not always suggest the actual commitment in real
world. Audience should note this when interpreting findings of this study.
Singapore Airlines is an interesting case. For years, both media and the
public by default group Singapore Airlines into the premium full-service carrier
12
International Journal of Aviation, Aeronautics, and Aerospace, Vol. 6 [2019], Iss. 3, Art. 10
https://commons.erau.edu/ijaaa/vol6/iss3/10DOI: https://doi.org/10.15394/ijaaa.2019.1345

category. To many frequent travelers, they are the benchmark of service and
quality in the airline industry. In this study, even Singapore still remains as one of
the most recognizable airline brands in an oversea market (Australia) and quite a
lot of participants indicate their intentions of flying with Singapore, the
unexpected number of participants who put Singapore into the discount category
definingly warrants a scrutiny. A follow-up study could potentially identify
extremely valuable insights to improve the brand image of Singapore Airlines in
the Australia market.
Airlines understand the importance of marketing. Leading international
carriers such as Emirates (2018) are spending hundreds of millions of dollars per
annum to sponsor sports, cultural and arts events to promote their brand and
products. Full-service carriers are also investing on providing the most exclusive
and lavish cabin products to maintain their attraction to premium travelers and to
strengthen their brand positioning in the tourism market (Dirsehan & Kurtuluş,
2018). Airlines are investing on social media marketing activities to promote
brand awareness (Seo & Park, 2018). Such an effort and expense are being paid
off. The Emirates brand is widely recognized in the global market, and such brand
awareness is positively contributing to passengers’ purchase intention as well as
price premium.
Findings of this study are pointing a direction for future studies.
Systematic random sampling should be used to select a sample that better
represents the Australia market. In addition to investigating the correlation, a
qualitative study using focus groups or interview could potentially provide more
insights to reveal the logic behind these correlations. Airlines, with their direct
access to sales data, should analyze the link between brand awareness changes
and sales growth/decline to identify possible causation.
Conclusions
Demographic information suggests that the majority of participants fit the
profile of leisure travelers, considering the majority of survey participants are
young, have lower income and don’t travel frequently in a year (Table 2). Leisure
travelers typically are sensitive to price, mostly fly economy class, and book
tickets in advance in order to save. However, airfare is not the only factor leisure
travelers will consider when choosing between different airlines. Their
impressions with a particular airline are also from a more holistic perspective. In
particular, prior experience and familiarity with the airline play important roles in
their decision making (Gao & Koo, 2014).
In terms of brand awareness among survey participants, the most
recognized airline brands are Qantas Airways (74.1%), Singapore Airlines (61%),
Thai Airways (58.7%), and Emirates (49.8%). This awareness standing is very
similar to the current market share of international airlines in the Australia market
13
Gao and Choy: Branding of international airlines between Australia and UK
Published by Scholarly Commons, 2019

(see Figure 4). The exception is Thai Airways, whose market share is less than
3% but ranks 3rd in terms of awareness among all airlines in this study.
Figure 4. Market share of international airlines in Australia (international routes).
Adapted from “International Airlines in Australia” by T. Youl, 2018, IBISWorld
Industry Report I4901.
Responses to the purchase intention question also match the market share
standing well. More participants would select Qantas, Singapore, and Emirates
over other airlines when travelling between Australia and the UK, and these are
also the top 3 airlines in terms of market share on the international market to or
from Australia. Such a match can be viewed as a testimony for the quality of
responses collected by this study.
Price premium is one of the most useful dimensions in measuring brand
equity (Aaker, 1996; Blackston, 1995; Sethuraman, 2001). In Australia’s
international airline market, Qantas and Emirates are clearly viewed by many as
premium brands. Such an association will place both airlines on a strong position
to charge premium airfares. What’s interesting is Singapore Airlines. A higher
than expected percentage of participants don’t agree with the conventional
reputation of the airline, and group them into the discount choice group. This is
calling for the attention of Singapore Airlines, who traditionally view Australia as
one of its most important oversea markets. Another intriguing finding is Thai
Airways. As one of the top three most recognized airline brands in this study, the
skewed survey responses reveal that Australian customers recognize its brand as a
14
International Journal of Aviation, Aeronautics, and Aerospace, Vol. 6 [2019], Iss. 3, Art. 10
https://commons.erau.edu/ijaaa/vol6/iss3/10DOI: https://doi.org/10.15394/ijaaa.2019.1345

discount airline. This strong identification could seriously affect airlines’ sales
and revenue, calling the airline for a thorough study of its brand image in
Australia.
For airlines that meet the Chi-square test assumption requirements,
significant correlation between brand awareness and purchase intention are found,
suggesting the positive effect of brand equity on purchase intention. Measured by
Cramer’s V, the correlations are quite strong. This is confirmatory to the finding
of Chen and Chang (2008) that brand equity has positive effect on both brand
preference and purchase intention. Similarly, significance is found between brand
awareness and price premium, and between purchase intention and price
premium. All of above results are justifying airlines’ expenditures on brand
promotions in the Australia market.
15
Gao and Choy: Branding of international airlines between Australia and UK
Published by Scholarly Commons, 2019

References
Aaker, D. (1996). Measuring brand equity across products and markets.
California Management Review, 38(3), 102. doi:10.2307/41165845
Airline Deregulation Act. (1978). PUB. L. No. 95-504, 92 Stat. 1705.
Akoglu, H. (2018). User's guide to correlation coefficients. Turkish Journal of
Emergency Medicine, 18(3), 91-93. doi:10.1016/j.tjem.2018.08.001
Anselmsson, J., Johansson, U., & Persson, N. (2007). Understanding price
premium for grocery products: A conceptual model of customer-based
brand equity. Journal of Product & Brand Management, 16(6), 401-414.
doi:10.1108/10610420710823762
Anselmsson, J., Vestman Bondesson, N., & Johansson, U. (2014). Brand image
and customers' willingness to pay a price premium for food brands.
Journal of Product & Brand Management, 23(2), 90-102.
doi:10.1108/JPBM-10-2013-0414
Berry, L. (2000). Cultivating service brand equity. Official Publication of the
Academy of Marketing Science, 28(1), 128-137.
doi:10.1177/0092070300281012
Blackston, M. (1995). The qualitative dimension of brand equity. (Research
International, Brand and Communication President Max Blackston
speech)(Research Currents)(Transcript). Journal of Advertising Research,
35(4), RC2.
Brey, R., & Walker, J. L. (2011). Latent temporal preferences: An application to
airline travel. Transportation Reserach Part A, 45(9), 849-992.
doi:10.1016/j.tra.2011.04.010
Bureau of Transport Economics. (1995). Deregulation of domestic aviation in
Australia 1990-1995. Retrieved from https://bitre.gov.au/publications/
1995/files/is_006.pdf
Chen, C.-F., & Chang, Y.-Y. (2008). Airline brand equity, brand preference, and
purchase intentions-The moderating effects of switching costs. Journal of
Air Transport Management, 14(1), 40-42.
doi:10.1016/j.jairtraman.2007.11.003
Chen, C.-F., & Tseng, W.-S. (2010). Exploring customer-based airline brand
equity: Evidence from Taiwan. Transportation Journal, 49(1), 24-34.
Cohen, J. (1988). Statistical power analysis for the behavioral sciences (2nd ed.).
Hillsdale, N.J.: L. Erlbaum Associates.
Dirsehan, T., & Kurtuluş, S. (2018). Measuring brand image using a cognitive
approach: Representing brands as a network in the Turkish airline
industry. Journal of Air Transport Management, 67, 85-93.
doi:10.1016/j.jairtraman.2017.11.010
16
International Journal of Aviation, Aeronautics, and Aerospace, Vol. 6 [2019], Iss. 3, Art. 10
https://commons.erau.edu/ijaaa/vol6/iss3/10DOI: https://doi.org/10.15394/ijaaa.2019.1345
Emirates. (2018). The Emirates Group annual report 2017-2018. Retrieved from
https://cdn.ek.aero/downloads/ek/pdfs/report/annual_report_2018.pdf
Gao, Y., & Koo, T. T. R. (2014). Flying Australia–Europe via China: A
qualitative analysis of the factors affecting travelers' choice of Chinese
carriers using online comments data. Journal of Air Transport
Management, 39, 23-29. doi:10.1016/j.jairtraman.2014.03.006
Gómez, M., Martín‐Consuegra, D., Díaz, E., & Molina, A. (2018). Determinants
and outcomes of price premium and loyalty: A food case study. Journal of
Consumer Behaviour, 17(1), 64-74. doi:10.1002/cb.1692
Jeng, S. P. (2016). The influences of airline brand credibility on consumer
purchase intentions. Journal of Air Transport Management, 55, 1-8.
doi:10.1016/j.jairtraman.2016.04.005
Keller, K. L., & Lehmann, D. R. (2003). How do brands create value? Marketing
Management, 12(3), 26-31.
Macias, W. & Rodriquez, K. (2018). Brand valuation by price premium:
Theoretical explanation and practical application using conjoint analysis.
Knowledge Management: An International Journal, 17, 13-27.
doi:10.18848/2327-7998/CGP/v17i03/13-27
Masuda, K., & Kushiro, S. (2018). Influence of brand equity on the price
premium for private labels in fresh produce: A contingent valuation
survey. Agribusiness, 34(2), 338-350. doi:10.1002/agr.21498
McHugh, M. L. (2013). The chi-square test of independence. Biochemia Medica,
23(2), 143-149. doi:10.11613/BM.2013.018
Moreno, M. B. (2006). Airline choice for domestic flights in São Paulo
metropolitan area: An application of the conditional logit model. Journal
of Air Transportation, 11(2), 22-42.
Persson, N. (2010). An exploratory investigation of the elements of B2B brand
image and its relationship to price premium. Industrial Marketing
Management, 39(8), 1269-1277. doi:10.1016/j.indmarman.2010.02.024
Sarker, M. M., Mohd-Any, A. A., & Kamarulzaman, Y. (2019). Conceptualising
consumer-based service brand equity (CBSBE) and direct service
experience in the airline sector. Journal of Hospitality and Tourism
Management, 38, 39-48. doi:10.1016/j.jhtm.2018.11.002
Seo, E.-J., & Park, J.-W. (2018). A study on the effects of social media marketing
activities on brand equity and customer response in the airline industry.
Journal of Air Transport Management, 66, 36-41.
doi:10.1016/j.jairtraman.2017.09.014
Sethuraman, R. (2001). What makes consumers pay more for national brands than
for store brands - image or quality? Review of Marketing Science, WP No.
318. Retreived from https://papers.ssrn.com/sol3/ papers.cfm?
abstract_id=310883
17
Gao and Choy: Branding of international airlines between Australia and UK
Published by Scholarly Commons, 2019

Suchomelova, A., Prochazka, J., & Durinik, M. (2017). Personal interest
branding: Source of price premium. Journal of International Consumer
Marketing, 29(1), 27-34. doi:10.1080/08961530.2016.1236309
Thakshak. (2018). Analysing customer based airline brand equity: Perspective
from Taiwan. Future Business Journal, 4(2), 233-245.
doi:10.1016/j.fbj.2018.07.001
U.S. Department of State. (n.d.).Civil air transport agreements. Retrieved from
https://www.state.gov/e/eb/tra/ata/
Yai, T., Takada, K., & Okamoto, N. (1997). Analysis of international air
passenger characteristics in the Asian region.
https://doi.org/10.1016/j.ajsl.2017.09.002
Youl, T. (2018). International airlines in Australia. IBISWorld Industry Report
I4901. Retreived from https://www.ibisworld.com.au/industry-
trends/market-research-reports/transport-postal-warehousing/air-
space/international-airlines.html
18
International Journal of Aviation, Aeronautics, and Aerospace, Vol. 6 [2019], Iss. 3, Art. 10
https://commons.erau.edu/ijaaa/vol6/iss3/10DOI: https://doi.org/10.15394/ijaaa.2019.1345