Embed Size (px)
DESCRIPTION
Brain W ave B ased A uthentication. Kennet Fladby 2008. Outline. 1. Introduction 2. Research questions 3. Experimental work 4. Results 5. Conclusion 6. Further work. 1-1. Brain waves. The brain contains about 100 billion neurons. - PowerPoint PPT Presentation
Citation preview

Brain Wave Based Authentication
Kennet Fladby2008

Outline
1. Introduction2. Research questions3. Experimental work4. Results5. Conclusion6. Further work

1-1. Brain waves
• The brain contains about 100 billion neurons.• Neurons generates and leads electrical signals.• The sum of these electrical signals generates
an electric field.• Fluctuations in the electric field can be
measured.• Electroencephalographic (EEG)

1-2. 10-20 System

1-3. EEG signal: 20 seconds, 128Hz

2. Research questions
• Is it possible to authenticate by means of brain waves with only one EEG sensor?
• What feature should be extracted from the signals?• Do we have to authenticate based on a person’s
thoughts or can we use the brain waves as a biometric directly?
• Will a distance metric approach work?• What is the best FMR and FNMR we can achieve?

3-1. TasksTask Description
Relax Relax in a normal fashion
Color Visualize the red color
Rotate Mentally rotate a house
Password Think about the password ’BrainWaveS’
Music Think about a melody/song
Words Generate words with capital letter ’M’
Count Count upwards starting from 1
Read Read a random provided text

3-2. Setup
• 10 participants– 3 sessions, 3 recordings of each task per session– Each recording lasts 20 seconds (2560 samples)– Eyes closed
• Number of recordings– 72 per participant ( 24 minutes )– 720 total (4 hours )
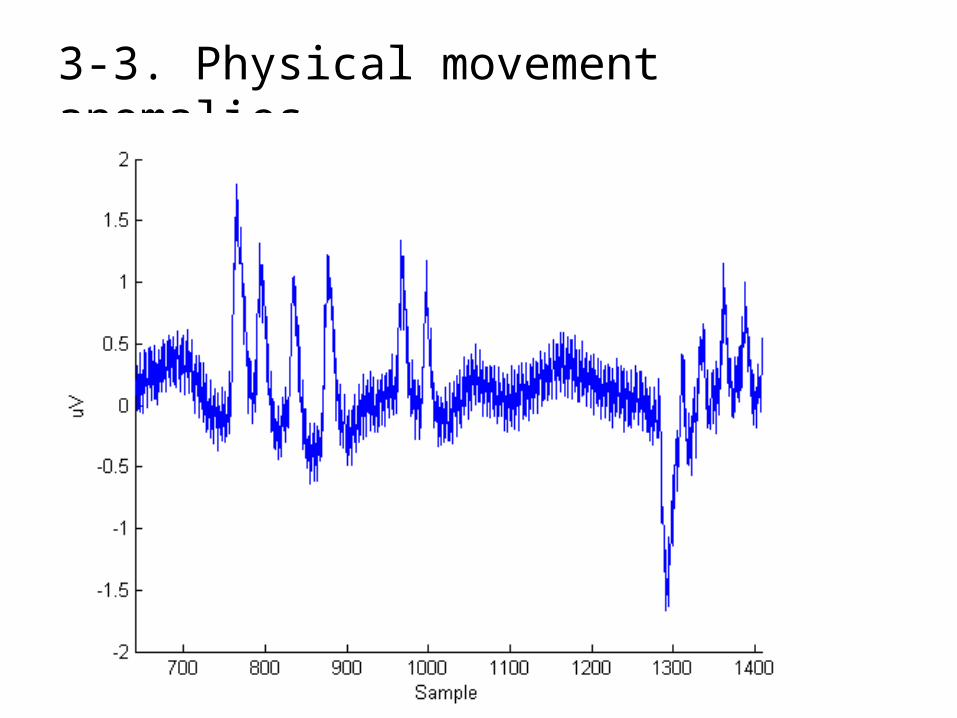
3-3. Physical movement anomalies
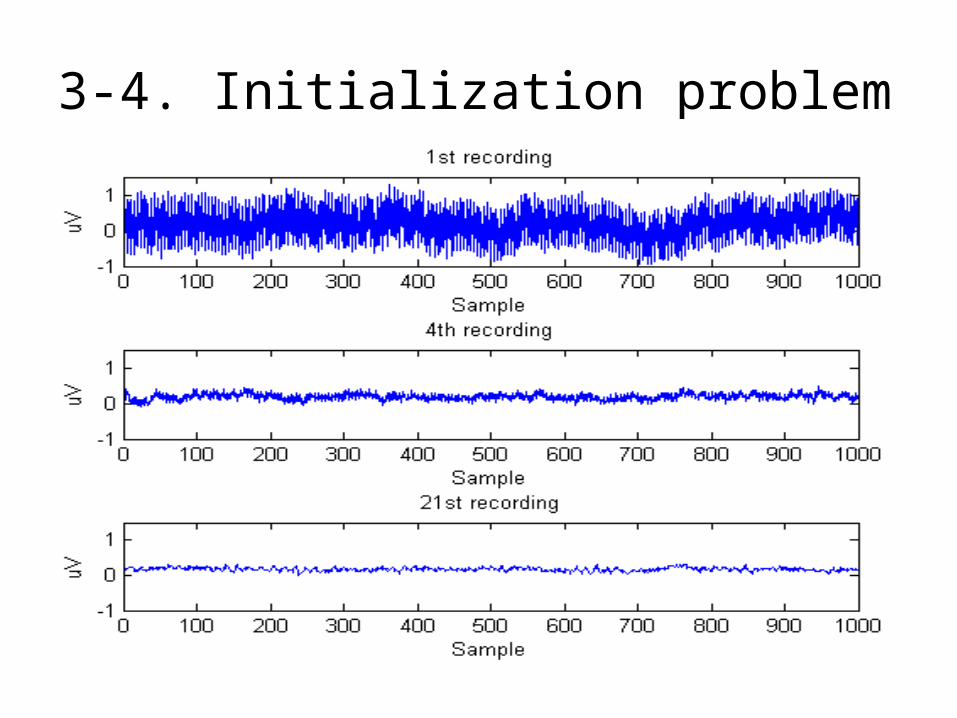
3-4. Initialization problem
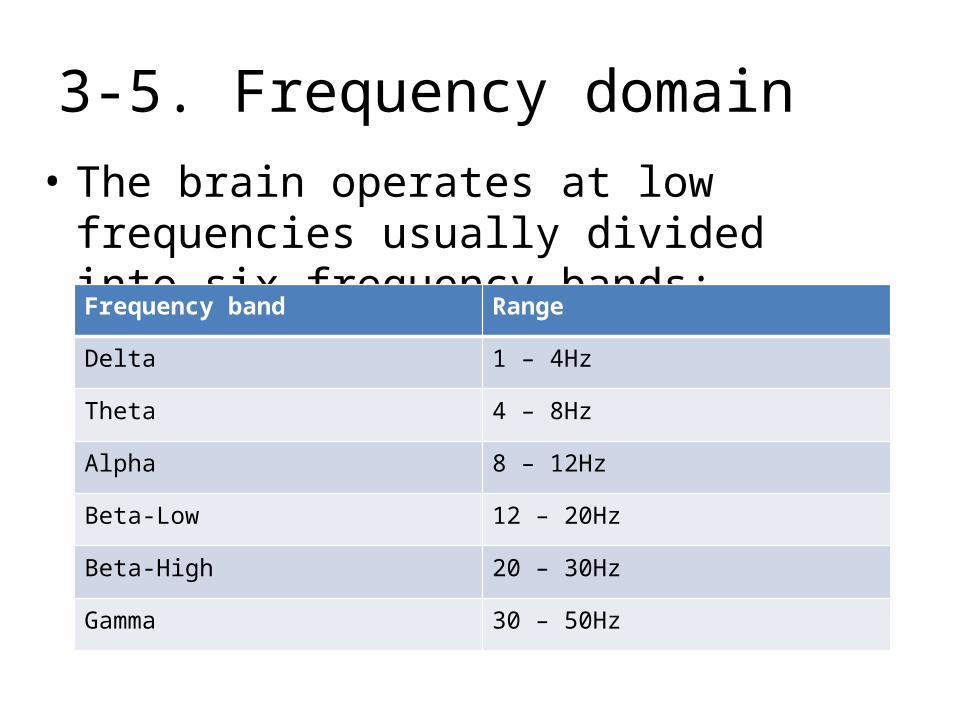
3-5. Frequency domain• The brain operates at low frequencies usually
divided into six frequency bands:Frequency band Range
Delta 1 – 4Hz
Theta 4 – 8Hz
Alpha 8 – 12Hz
Beta-Low 12 – 20Hz
Beta-High 20 – 30Hz
Gamma 30 – 50Hz

3-6. Fast fourier transform

3-7. Feature extraction
• Time domain features– Mean sample value– Zero crossing rate– Values above zero
• Frequency domain features– Peak frequency– Peak frequency magnitude– Signal power in each frequency band
• Pdelta, Ptheta, Palpha, PbetaLow, PbetaHigh, Pgamma
– Mean band power– Mean phase angle
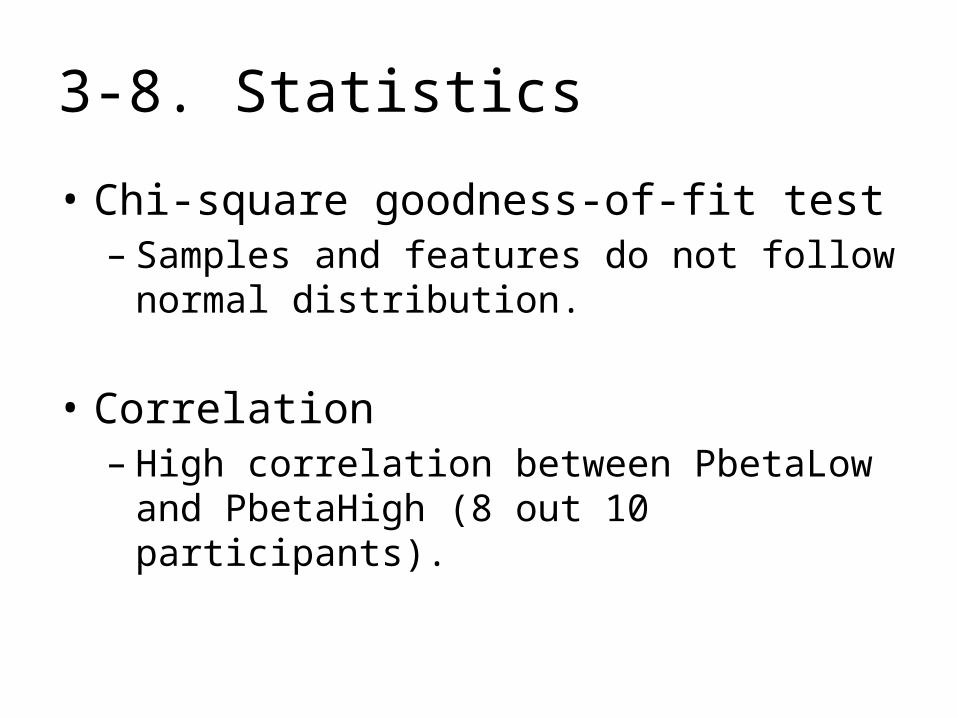
3-8. Statistics
• Chi-square goodness-of-fit test– Samples and features do not follow normal
distribution.
• Correlation– High correlation between PbetaLow and
PbetaHigh (8 out 10 participants).

3-9. Distance metricd = d(signal1,signal2) :
X = signal1Y = signal2
d1 = |X.PbetaLow / X.PbetaHigh - Y.PbetaLow / Y.PbetaHigh|d2 = |X.PbetaLow / Y.PbetaLow - Y.PbetaHigh /X.PbetaHigh|d3 = |X.Palpha / X.PbetaLow - Y.Palpha / Y.PbetaLow| d4 = |X.Palpha/ Y.Palpha - Y.PbetaLow / X.PbetaLow|
d = d1 + d2 + d3 + d4

4-1. Distance computation 1
• Computation: All vs All• Genuine attempts:– d(signal1,signal2) from the same participant
• Fraudulent attempts– d(signal1,signal2) from different participants
• Requirement:– d(signal1,signal2) must be from the same task

4-2. DET-Curve 1
EER = 30.28%
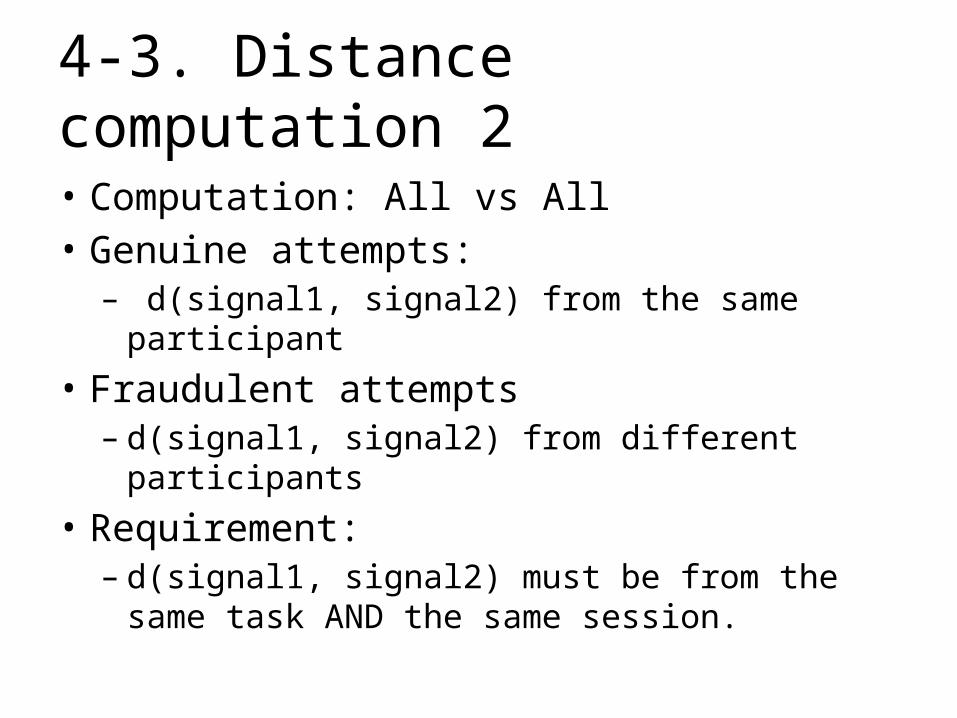
4-3. Distance computation 2
• Computation: All vs All• Genuine attempts:– d(signal1, signal2) from the same participant
• Fraudulent attempts– d(signal1, signal2) from different participants
• Requirement:– d(signal1, signal2) must be from the same task
AND the same session.

4-4. DET-Curve 2
EER = 23.26%

4-5. Task selectionTask with the best average distance
Participant Session 1 Session 2 Session 3
1 Color Count Words2 Count Count Password3 Color Count Rotate4 Words Color Rotate5 Rotate Password Password6 Count Count Words7 Rotate Words Color8 Rotate Password Words9 Words Words Music10 Relax Color Rotate

4-6. Distance computation 3
• Computation: Task selection• Genuine attempts– d(signal1,signal2) from the same participant
• Fraudulent attempts– d(signal1,signal2) from different participants
• Requirement– d(signal1,signal2) must be from the selected
session 1 task.

4-7. DET-Curve 3
EER = 21.46%

4-8. Distance computation 4
• Computation: Task selection• Genuine attempts– d(signal1,signal2) from the same participant
• Fraudulent attempts– d(signal1,signal2) from different participants
• Requirement– d(signal1,signal2) must be from the selected
session 1 task AND the same session.

4-9. DET-Curve 4
EER = 17.08%

4-10. DET-Curve 1-4
EER = 30.28%EER = 23.26%EER = 21.46%EER = 17.08%

5. Conclusion
• Similiarities are session based– Two consequtive signals are very similar
• Equipment dependant– Signal gets better over time– Captures too much physical movement
• One sensor is not enough– Limited information– Low sample rate

6. Further work
• Better distance metric– Identify more feature relations– Try different feature combinations
• Better selection of tasks– Tasks designed for the Fp1 location
• New equipment– Better filtering– Increased sample frequency– More sensors– Different sensor locations

Thank you for listening!
Questions?