Embed Size (px)
Citation preview

March 2014
Bradwell Power StationFED discharge arrangements: Far-field dispersion
EBR4908-RT010-R04-00

Bradwell Power Station
FED discharge arrangements: Far-field dispersion
EBR4908-RT010-R04-00
Document information
Document permissions Confidential - client
Project number EBR4908
Project name Bradwell Power Station
Report title FED discharge arrangements: Far-field dispersion
Report number RT010
Release number R04-00
Report date March 2014
Client Magnox Ltd
Client representative Richard Mensah
Project manager Graham Watt
Project director Rob Wild
This unsigned document has not been formally checked and authorised for release. Until it has been reviewed and signed off by qualified technical staff within HR Wallingford, this document must not be considered complete or final.
© HR Wallingford Ltd
This report has been prepared for HR Wallingford’s client and not for any other person. Only our client should rely upon the contents of this report and any methods or results which are contained within it and then only for the purposes for which the report was originally prepared. We accept no liability for any loss or damage suffered by any person who has relied on the contents of this report, other than our client.
This report may contain material or information obtained from other people. We accept no liability for any loss or damage suffered by any person, including our client, as a result of any error or inaccuracy in third party material or information which is included within this report.
To the extent that this report contains information or material which is the output of general research it should not be relied upon by any person, including our client, for a specific purpose. If you are not HR Wallingford’s client and you wish to use the information or material in this report for a specific purpose, you should contact us for advice.
Document history
Date Release Prepared Approved Authorised Notes
11 Mar 2014 04-00 GAW BRW GBS
26 Feb 2014 03-00 GAW BRW GBS
03 Dec 2013 02-00 GAW TEJ BRW
11 Sep 2013 01-00 GAW TEJ BRW

Bradwell Power Station
FED discharge arrangements: Far-field dispersion
EBR4908-RT010-R04-00
Summary Magnox is undertaking a decommissioning programme at Bradwell nuclear power station. The site lies on the south side of the Blackwater Estuary in Essex, about 1 kilometre seaward of Bradwell Marina, and has been occupied as a power station since the early 1960s.
During decommissioning the magnesium alloy which comprises the fuel element debris (FED) will be dissolved in nitric acid, abated to reduce certain constituents and released in a controlled batch operation to the Blackwater Estuary. The liquors produced contain predominantly nitrates, with trace concentrations of metals. In its initial concept, Magnox expected that the FED would be discharged via the final delay tank (FDT) and siphon pit/outfall previously used for the power station cooling water; this report describes the mid- to far-field dispersion arising from the use of an alternative, dedicated, discharge arrangement.
A series of far-field dispersion simulations has examined discharge and dilution of the FED effluent, releasing it at different stages of the ebb tide. The existing discharge window of 30 minutes, beginning one hour after high water, is confirmed as the optimum time for release.
The metals contained in the discharge are expected to be brought under the EQS concentrations (where applicable) during the initial dilution phase of the discharge (within 100 m of the outfall) – even allowing for background levels where provided. For most of those substances, the predicted total concentrations are below 40% of the annual-average EQS value.
Modelling results suggest that the retained nitrate from the discharge is well-diffused. The FED discharge is predicted to increase the average nitrate concentrations in the Blackwater Estuary by less than 10% of the background value. Localised areas within the plume will experience higher concentrations. Close to the outfall and within the main plume, short-duration peak nitrate concentrations of up to 1.5 mg/l are predicted.
When the FED discharge finishes, residual nitrate concentration in the estuary will gradually reduce back to the background concentration.
Bradwell Power Station
FED discharge arrangements: Far-field dispersion
EBR4908-RT010-R04-00
Contents
Summary
1. Introduction _________________________________________________________ 11.1. Report conventions ........................................................................................................................... 1
2. Environmental conditions ______________________________________________ 22.1. Data from the Blackwater TELEMAC model ..................................................................................... 3
2.2. Data from site measurements ........................................................................................................... 6
2.3. Nitrate ................................................................................................................................................ 8
2.4. Metals ................................................................................................................................................ 9
3. FED discharge ______________________________________________________ 93.1. Nitrate .............................................................................................................................................. 10
3.2. Metals .............................................................................................................................................. 10
3.3. Temperature .................................................................................................................................... 12
4. Mid- to far-field dispersion _____________________________________________ 134.1. Discharge window ..........................................................................................................................144.2. Far-field concentrations ..................................................................................................................15
4.2.1. Spatial variations ...............................................................................................................164.2.2. Time variations ..................................................................................................................16
4.3. Oyster beds ....................................................................................................................................224.4. Discussion ......................................................................................................................................23
5. Discharge operating sequence _________________________________________ 236. Long-term concentrations _____________________________________________ 23
6.1. Extended simulations .....................................................................................................................236.2. Bulk mixing .....................................................................................................................................246.3. Other removal mechanisms ...........................................................................................................256.4. Evidence from other inputs of nitrate .............................................................................................25
7. Conclusions ________________________________________________________ 288. References ________________________________________________________ 28
Figures Figure 1.1: Location map ............................................................................................................................ 2
Figure 2.1: Extent of the numerical model .................................................................................................. 4
Figure 2.2: Numerical model bathymetry near Bradwell ............................................................................. 4
Figure 2.3: Simulated water depth at the outfall location ............................................................................ 5
Figure 2.4: Simulated current speed and direction at the outfall location ................................................... 5
Figure 2.5: Observed water depth near the outfall location ........................................................................ 7
Figure 2.6: Observed current speed and direction near the outfall location ............................................... 7
Figure 4.1: Environment Agency monitoring points ..................................................................................13Figure 4.2: Fraction of first discharge retained within the estuary ............................................................15

Bradwell Power Station
FED discharge arrangements: Far-field dispersion
EBR4908-RT010-R04-00
Figure 4.3: Predicted nitrate concentrations, averaged over one day, spring tide (Day 15). Number labels show the start time of the release ..................................................................................................17Figure 4.4: Predicted nitrate concentrations, averaged over one day, neap tide (Day 7). Number labels show the start time of the release ..................................................................................................18Figure 4.5: Predicted instantaneous nitrate concentrations, site 4a .........................................................19Figure 4.6: Predicted nitrate concentrations (averaged over 25 hours), site 4a.............................19 Figure 4.7: Predicted nitrate concentrations (averaged over 25 hours), site 6a............................20 Figure 4.8: Predicted nitrate concentrations (averaged over 25 hours), site 7a............................20 Figure 4.9: Predicted nitrate concentrations (averaged over 25 hours), site 8..............................21 Figure 4.10: Predicted nitrate concentrations (averaged over 25 hours), site 14a...................................21Figure 4.11: Oyster beds ..........................................................................................................................22Figure 4.12: Simulated nitrate concentrations at oyster bed 1 .................................................................22Figure 6.1: Predicted nitrate concentrations, averaged over one day, spring tide after 50 days’ discharge ...................................................................................................................................................27Figure 6.2: Predicted nitrate concentrations, averaged over one day, neap tide after 57 days’ discharge ...................................................................................................................................................27
Tables Table 2.1: Background nitrate (as N) concentrations (mg/l) ....................................................................... 8
Table 2.2: Background metals concentrations (µg/l) .................................................................................. 9
Table 3.1: FED discharge and diluted metal concentrations, compared with EQS values ...................... 11
Table 3.2: FED discharge and diluted metal concentrations, compared with background....................... 11
Table 3.3: Predicted combined metal concentrations (diluted value + background) at the edge of the mixing zone ......................................................................................................................................... 12
Table 3.4: Effluent temperature information for different ambient air temperatures ................................. 12
Table 4.1: Nitrate threshold concentrations ..............................................................................................15

Bradwell Power Station
FED discharge arrangements: Far-field dispersion
EBR4908-RT010-R04-00 1
1. IntroductionMagnox is undertaking a decommissioning programme at Bradwell nuclear power station. During decommissioning the magnesium alloy which comprises the fuel element debris (FED) will be dissolved in nitric acid, abated to reduce certain constituents and released in a controlled batch operation to the Blackwater Estuary. The liquors produced contain predominantly nitrates, with trace concentrations of metals. In its initial concept, Magnox expected that the FED would be discharged via the final delay tank (FDT) and siphon pit/outfall previously used for the power station cooling water; this report describes the mid- to far-field dispersion arising from the use of an alternative, dedicated, discharge arrangement.
The site lies on the south side of the Blackwater Estuary in Essex, about 1 kilometre seaward of Bradwell Marina (Figure 1.1), and has been occupied as a power station since the early 1960s.
1.1. Report conventions
In this report the horizontal co-ordinates are referred to the British National Grid and vertical levels to Ordnance Datum Newlyn (ODN). ODN is approximately 0.2 m below mean sea level at Newlyn, and 2.68 m above Admiralty Chart Datum (CD) at Bradwell; CD is approximately the level of the lowest astronomical tide.
In most places, absolute concentrations are given for the concentration of nitrate as N in milligrams per litre, assuming an initial discharge concentration of 22,100 mg/l. Concentrations resulting from different initial concentrations can be deduced by rescaling. Concentrations always refer to depth-average values. In the context of numerical values, the word ‘nitrate’ should be understood to refer to ‘nitrate as N’.
‘Day’ refers to a 25-hour period comprising two tidal cycles. For example. ‘daily averages’ are calculated over 25-hour periods starting and ending at High Water.
Discharge times are often expressed relative to High Water (HW) and hours after HW; for example, the discharge window begins one hour after high water which may be written ‘HW+1’.
The study makes use of information provided and derived in previous investigations carried out for Magnox and BNFL, and summarises HR Wallingford’s previous studies of the FED effluent.

Bradwell Power Station
FED discharge arrangements: Far-field dispersion
EBR4908-RT010-R04-00 2
Figure 1.1: Location map
2. Environmental conditionsThe Blackwater Estuary is a significant tidal estuary on the east coast of England. It receives freshwater inputs from the rivers Blackwater, Colne and Crouch, together with other smaller streams. The mean tidal range at Walton-on-the-Naze (an Admiralty Standard Port near the mouth of the estuary) is 3.8 m on spring tides and 2.3 m on neap tides. The tidal range at Bradwell is somewhat larger: around 4.8 m on spring tides and 2.9 m on neap tides.

Bradwell Power Station
FED discharge arrangements: Far-field dispersion
EBR4908-RT010-R04-00 3
2.1. Data from the Blackwater TELEMAC model
HR Wallingford holds an existing calibrated TELEMAC-2D tidal model of the Blackwater Estuary area, which was established for previous studies at Bradwell (References 1 and 2). The model extent and bathymetry are presented in Figure 2.1 and Figure 2.2.
TELEMAC-2D is a two-dimensional, depth-averaged, numerical model that uses the well-established finite element method to determine water depths and depth-averaged velocities at each node in the computational network or ‘mesh’. A depth-averaged model is appropriate in this case as the Blackwater Estuary is observed to be well mixed and unstratified. The model mesh contains triangular elements of varying size and orientation, allowing wide spatial coverage using small elements in the area of interest and larger elements in the remoter areas. The elements can be aligned with physical features to give a highly accurate representation of the layout. The model is supplied with boundary conditions in the form of water level and/or current velocity, and calculates the corresponding velocity and water level across the domain. The results are stored at intervals for analysis or use in further calculation. TELEMAC has been established as a highly effective model for simulation of well-mixed estuaries and HR Wallingford’s TELEMAC models of coastal areas, including the Anglian and Northumbrian coastlines, have been accepted by the Environment Agency as the basis of discharge planning studies for many sea outfalls.
The Blackwater Estuary model was set up using bathymetric data from Admiralty charts of the area, together with survey data in the vicinity of the intake/discharge structure. The model area includes the three estuaries of the Blackwater, the Colne and the Crouch, and extends 25km along the coast to north and south and 20km offshore. The offshore boundary has been set to follow the general direction of the flood and ebb currents in the North Sea. Boundary conditions were provided as water levels at the seaward boundaries, synthesised from published harmonic constituents in a similar way to the predictions published in the Admiralty tide tables.
River inputs were represented as average discharges at Maldon (Rivers Blackwater, Brain, Ter and Chelmer) and at the River Colne.
The model has been verified using published Admiralty tidal stream (Diamond) data and other measurements. In particular the model currents were compared with observations close to the discharge point.

Bradwell Power Station
FED discharge arrangements: Far-field dispersion
EBR4908-RT010-R04-00 4
Figure 2.1: Extent of the numerical model
Figure 2.2: Numerical model bathymetry near Bradwell
Bradwell Power Station
FED discharge arrangements: Far-field dispersion
EBR4908-RT010-R04-00 5
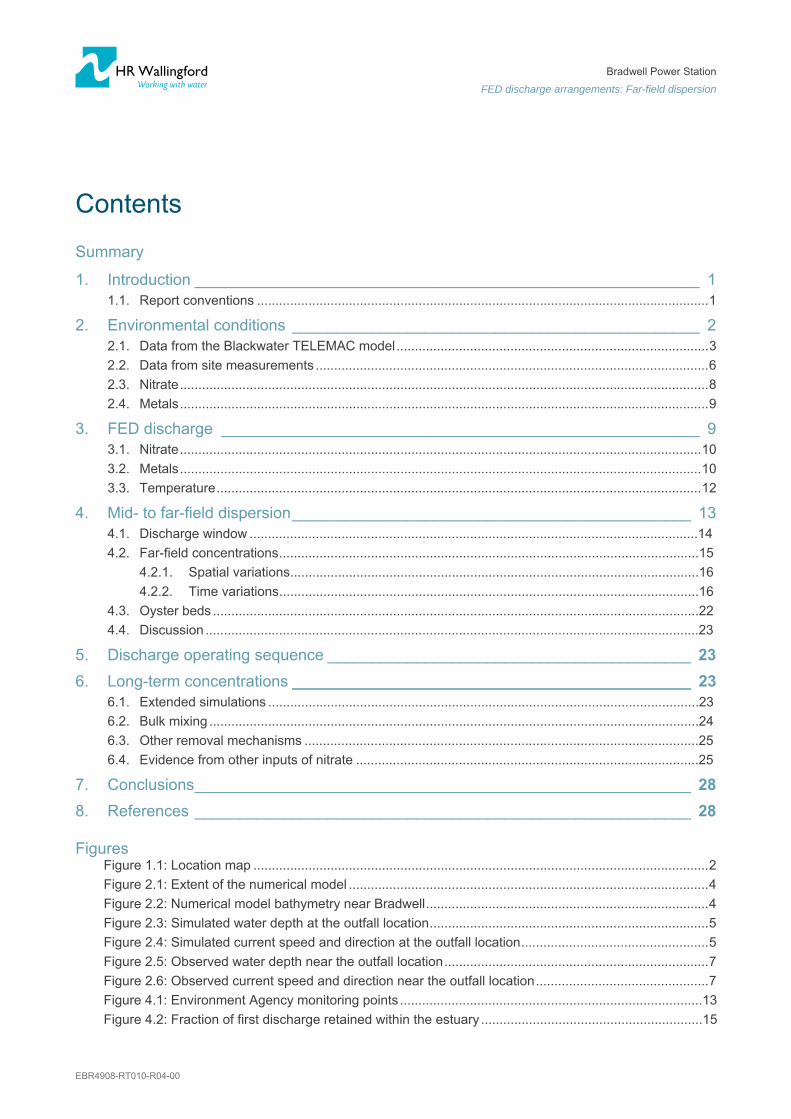
Figure 2.3 and Figure 2.4 show the modelled variation of water depth, and current speed and direction near the outfall structure.
Figure 2.3: Simulated water depth at the outfall location
Figure 2.4: Simulated current speed and direction at the outfall location
5
6
7
8
9
10
11
0 2 4 6 8 10 12 14
wat
er
dep
th (
m)
model time (days)
0
90
180
270
360
0
0.1
0.2
0.3
0.4
0.5
0.6
0.7
0.8
0 2 4 6 8 10 12 14
current direction (degrees N)
curr
en
t sp
ee
d (
m/s
)
model time (days)
current speed current direction

Bradwell Power Station
FED discharge arrangements: Far-field dispersion
EBR4908-RT010-R04-00 6
In summary, the water depth varies approximately between 5 m and 11 m, and the current peak speeds between 0.3 m/s and 0.7 m/s. During the discharge window, between 1 and 1.5 hours after high water, current speeds are in the range roughly 0.15-0.75 m/s and water depths roughly 8.5-10.5 m.
2.2. Data from site measurements
The values above can be compared with the measurements made at the site in December 2012 (Reference 3) by the Port of London Authority. These measurements were made around 90 m offshore of the barrier wall. Ebb-tide current speeds of 0.5 m/s to 1.1 m/s were recorded. Measured water depths and current speeds and directions are shown in Figure 2.5 and Figure 2.6.
Comparison with these values, and others from the two surveys (References 1 and 3), suggest that the TELEMAC model may underestimate the currents in the vicinity of the existing intake-outfall structure. This will tend to lead to conservative dilution and dispersion results (that is, the model concentrations are likely to be greater than in reality and the model dilutions are likely to be less). In addition, the observations indicate a stronger bias than the model towards the ebb tide – thus the model may indicate poorer flushing in the estuary than would be achieved in practice.

Bradwell Power Station
FED discharge arrangements: Far-field dispersion
EBR4908-RT010-R04-00 7
Figure 2.5: Observed water depth near the outfall location
Source: Reference 3
Figure 2.6: Observed current speed and direction near the outfall location
Source: Reference 3
7
8
9
10
11
12
13
14
15
13/12/2012 18/12/2012 23/12/2012 28/12/2012 02/01/2013
wa
ter
de
pth
(m
)
0
90
180
270
360
0.0
0.2
0.4
0.6
0.8
1.0
1.2
1.4
13/12/2012 18/12/2012 23/12/2012 28/12/2012 02/01/2013
current dire
ction (de
gre
es N
)cu
rre
nt s
pee
d (
m/s
)
current speed current direction

Bradwell Power Station
FED discharge arrangements: Far-field dispersion
EBR4908-RT010-R04-00 8
2.3. Nitrate
The FED discharge is rich in nitrates, which are taken as the key parameter in this investigation. Nitrates are present in the Blackwater Estuary from sources such as agriculture, contributing mainly via run-off in to the freshwater rivers.
The agricultural source is supplemented by discharges from sewage treatment works in the river Colne (about 10% of the total load) and to a lesser extent the Blackwater (about 1% of the total load). In the Colne the main sewage treatment works source is at Colchester Hythe, with smaller sources at Fingringhoe and Brightlingsea. In the Blackwater the sewage treatment works are at West Mersea, Tiptree, Tollesbury, Bradwell and Maldon.
Reference 4 presents a characterisation of the Essex Estuaries including the Colne and Blackwater Estuaries and discusses the issue of nutrients in the Estuary. The annual loads of total oxidised nitrogen (TOxN) are estimated as:
Colne 47.8 x 10⁶ moles per year 1830 kg/day nitrate as N
Blackwater 178.2 x 10⁶ moles per year 6820 kg/day nitrate as N
assuming all the oxidised nitrogen is in the form of NO3.
Combining the estimated loads above and the river flows, it can be estimated that the daily load of nitrate is 8650 kg/day, and the average concentration of nitrate in both the Colne and the Blackwater is 0.020 kg/m3 (20 mg/l). These concentrations are reduced by various tidal and non-tidal dispersion, and chemical and biological processes to give the background concentrations listed in Table 2.1.
It may be noted that the measured average upper-estuary concentration is less than 5% of the calculated value; this reduction is due to a complex series of loss mechanisms.
Table 2.1: Background nitrate (as N) concentrations (mg/l)
maximum average
upper estuary 4.38 0.78
mid estuary 2.02 0.39
outer estuary 1.36 0.35
Source: Data provided by Magnox
The EQS (Environmental Quality Standard) value for dissolved inorganic nitrogen depends on salinity and turbidity (Reference 5). For water of intermediate or greater turbidity, ‘high’ quality requires an average concentration of less than 18 µmol/l (0.25 mg/l ) when the salinity is in the range 30-34.5 ppt, and less than 30 µmol/l (0.42 mg/l) when the salinity is 25 ppt. These EQS values are lower than the observed background concentrations in relevant parts of the estuary.

Bradwell Power Station
FED discharge arrangements: Far-field dispersion
EBR4908-RT010-R04-00 9
2.4. Metals
Certain metals are already present in the background in the estuary. Magnox has provided monitoring values for the constituents shown in Table 2.2.
Table 2.2: Background metals concentrations (µg/l)
monitoring site maximum average
boron upper estuary 5030 3999
cadmium upper estuary 0.507 0.068
mid estuary 0.101 0.05
chromium upper estuary 6.5 0.72
mid estuary 0.5 0.43
copper upper estuary 3.39 1.52
mid estuary 1.79 1.34
iron upper estuary 100 49.54
lead upper estuary 1.12 0.15
mid estuary 0.131 0.078
nickel upper estuary 5.03 1.47
mid estuary 1.43 1.1
silver upper estuary 1.81 1.011
mid estuary <1 <1
zinc upper estuary 29 5.78
mid estuary 6.1 3.25
Source: Data provided by Magnox
The Environment Agency, following from the EU Water Framework Directive, has published EQS values for a range of metals and other substances (Reference 5). Relevant EQS values are discussed in Section 3.2.
3. FED discharge The FED is expected to have a nitrate concentration of around 22,000 mg/l as N in the final delay tank, and will be discharged in batches of up to 20 m3. Initially a discharge of one batch per day is anticipated, with a lower rate of discharge later on in the process. Initially, one batch of 20 m3 is expected to be discharged over a period of half an hour, commencing one hour after high water, once per day. Without pre-dilution, the flow rate will be 40 m3/h, or 0.011 m3/s.
The FED will be discharged using the dedicated outfall structure described in Reference 6, which is expected to achieve an initial dilution around 500:1 during the discharge window on most tides of the spring-neap cycle. For the analysis in this report we have assumed an initial dilution of 240:1, which corresponds to a conservative estimate of the dilution at the lowest simulated neap tide current speed during the discharge window.

Bradwell Power Station
FED discharge arrangements: Far-field dispersion
EBR4908-RT010-R04-00 10
The undiluted FED effluent will have density of around 1122 kg/m3. This density is very much higher than the receiving water (around 1030 kg/m3) and as a result the FED discharge will be negatively buoyant.
After an initial phase where the motion of the discharge is dominated by the diffuser characteristics and its exit momentum, a negatively buoyant effluent will tend to sink towards the bed of the estuary and flow away down any gradient. The weight of the effluent will cause it to spread out into a thin stable layer (or density current). The plume may be deflected by ambient currents, but once it has reached the seabed the interaction between the plume and ambient water is generally weak.
3.1. Nitrate
The FED discharge is rich in nitrates, with a concentration of around 22,000 mg/l as N. Since the background concentrations of nitrate are already greater than the EQS values, it seems more appropriate to evaluate the discharge effect in terms of the increase relative to the background value. Magnox has indicated that it wishes to limit the increase in nitrate concentration to less than 10% of the background concentrations shown in Table 2.1.
3.2. Metals
Several metals are expected to be present in the FED discharge. Table 3.1 shows the anticipated discharge concentrations, together with the permitted environmental quality standard (EQS), annual average (AA) and maximum allowable concentration (MAC) values defined in Reference 5. (Some of the substances do not have EQS values.)
The proposed outfall design is expected to provide a reduction in concentration of around 240:1 (or more) close to the outfall, as described in Reference 6 and the introduction to this chapter. The column ‘diluted concentration’ in Table 3.1 includes this initial dilution. The final column presents the diluted concentration as a percentage of the EQS-AA value. All the predicted diluted metal concentrations are below the EQS values.
Table 3.2 compares the diluted values with the background concentrations (from Table 2.2). Note that in both of the tables in this section, the concentrations presented are due to the FED discharge in isolation – the background levels are not included in these values, and the dilution calculation does not allow for the background concentration.
The effective concentration at the edge of the mixing zone (taken to be 100 m away from the outfall) will be roughly the diluted concentration added to the background. Table 3.3 presents effective combined concentrations for the substances where background values are available. Where both average and maximum background values have been provided, both have been used. The calculated combined concentrations are expressed both as actual concentrations and as a percentage of the EQS-AA. This calculation gives a good approximation where the discharge concentration is much greater than the background, but becomes less accurate if the values are closer. Where the background concentration exceeds the discharge concentration (as for iron) the calculation is not valid; therefore these substances have been omitted from this table.
For mercury, no background value has been provided; however as a Priority Substance (as defined by the Water Framework Directive), it is an important constituent of the discharge. The value presented here as ‘average’ is simply the diluted concentration due to the FED effluent, assuming zero background; ‘maximum’ is omitted.
As noted above, the discharge concentration of iron is lower than the provided background concentration and so this calculation is not valid; iron is omitted from the table.

Bradwell Power Station
FED discharge arrangements: Far-field dispersion
EBR4908-RT010-R04-00 11
Table 3.1: FED discharge and diluted metal concentrations, compared with EQS values
discharge concentration
(µg/l) EQS-AA
(µg/l) EQS-MAC
(µg/l)
diluted concentration
(µg/l)
diluted concentration (% of EQS-AA)
boron 255 -- -- 1.06 -
cadmium 14.7 0.2 0.45 0.06 31
calcium 2460 -- -- 10.25 -
chromium 13.2 0.6 32 0.06 9
copper 47.8 5 -- 0.20 4
iron 31.1 1000 -- 0.13 < 1
lead 24.4 7.2 -- 0.10 1
mercury 0.545 0.05 0.07 0.002 5
nickel 903 20 n/a 3.76 19
titanium 2.55 -- -- 0.01 -
zinc 1690 40 -- 7.04 18
Source: Environmental quality standard (EQS) values taken from Environment Agency H1 Annex D (Reference 5). Diluted concentrations reproduced from Reference 6.
Table 3.2: FED discharge and diluted metal concentrations, compared with background
discharge concentration
(µg/l)
diluted concentration
(µg/l)
background concentration
diluted concentration (% of background concentration)
average (µg/l)
maximum(µg/l)
average maximum
boron 255 1.06 3999* 5030* < 1 < 1
cadmium 14.7 0.06 0.05 0.101 123 61
calcium 2460 10.25 - - - -
chromium 13.2 0.06 0.43 0.5 13 11
copper 47.8 0.20 1.34 1.79 15 11
iron 31.1 0.13 49.54* 100* < 1 < 1
lead 24.4 0.10 0.078 0.131 130 78
mercury 0.545 0.002 - - - -
nickel 903 3.76 1.1 1.43 342 263
titanium 2.55 0.01 - - - -
zinc 1690 7.04 3.25 6.1 217 115
Note: Background values are for mid-estuary, except * where only upper estuary values are available.
Source: Reference 6

Bradwell Power Station
FED discharge arrangements: Far-field dispersion
EBR4908-RT010-R04-00 12
Table 3.3: Predicted combined metal concentrations (diluted value + background) at the edge of the mixing zone
combined concentrations (µg/l) % of EQS annual average
average maximum average maximum
cadmium 0.11 0.16 56 81
chromium 0.49 0.56 81 93
copper 1.54 1.99 31 40
lead 0.18 0.23 2 3
mercury 0.002 -- 5 --
nickel 4.86 5.19 24 26
zinc 10.29 13.14 26 33
Note: Substances without EQS or provided background concentration are omitted, except mercury.
For mercury, no background value has been provided. The ‘average’ presented here is simply the diluted concentration due to the FED effluent, assuming zero background.
For iron, the background concentration exceeds the discharge concentration, and this calculation is inappropriate. Therefore iron has also been omitted.
3.3. Temperature
Magnox has asked us to comment on the effects of effluent temperature in the estuary, based on the data shown in Table 3.4. The highest excess temperature (∆T) in the FED effluent is expected to be around 16°C. This ‘excess’ temperature is the increase in temperature of the effluent relative to the ambient temperature.
A temperature excess of as much as 16°C will only have a minor effect on the density of the effluent, and hence on its buoyancy, because the buoyancy is dominated by the high dissolved nitrate concentration. The initial dilution and subsequent dispersion of the effluent will, therefore, not be affected significantly by the temperature contrast.
Using an initial dilution of 240:1 as above, we can calculate the diluted excess temperature at the end of the mixing zone as around 0.06°C.
Such a small increase in temperature is likely to be considered acceptable.
Table 3.4: Effluent temperature information for different ambient air temperatures
Heat Transfer Modelled Results (°C)
Ambient Air Temperature (inside container) 5 10 15 25 35
Ambient Air Temperature (outside container) 5 10 15 25 35
Final Temperature in Sentencing Tanks 21.12 24.55 27.97 34.82 41.67
∆T (Pipeline to FMDT) 16.12 14.55 12.97 9.82 6.67
Source: Provided by Magnox

Bradwell Power Station
FED discharge arrangements: Far-field dispersion
EBR4908-RT010-R04-00 13
4. Mid- to far-field dispersionAs the tide in the estuary ebbs past the outfall tower, the discharge is carried away from the outfall tower to form a plume that stretches away to the east. At the end of the effluent discharge this plume is cut off at the source and becomes a patch moving away from the outfall as the tide falls, but returning toward the estuary as the tide rises. As the plume and patch move with the tide, turbulence in the flow spreads and dilutes the effluent.
The main purpose of the mid-field studies is to show that the metals are well dispersed from the vicinity of the discharge, and to evaluate the impact of the nitrates. In reality, time-varying wind perturbations and non-tidal currents would be likely to affect the trajectory and spread the impact over a wider area at lower concentrations than discussed here. The average impact at any location is the combination of a brief period when the patch may pass directly over, together with a much longer period when there is only indirect impact (residual concentration or returning patch), or no impact.
The Environment Agency has a set of monitoring points in the Blackwater Estuary: points 4, 6, 7, 8 and 14 in Figure 4.1. The results discussed in this Chapter show that the effluent plume passes to the south of most of these points; therefore we have defined a set of points corresponding to the Agency locations, but moved onto the plume axis. These points are labelled with suffix a in Figure 4.1.
Figure 4.1: Environment Agency monitoring points

Bradwell Power Station
FED discharge arrangements: Far-field dispersion
EBR4908-RT010-R04-00 14
This part of the study used HR Wallingford’s PLUME-RW dispersion model. PLUME-RW simulates the movement of pollutant plumes discharged, for example, from sea outfalls or storm water overflows, using a random walk representation of turbulent dispersion. Pollutant discharges are represented by the release of discrete particles, which move in three dimensions under the influence of mean tidal currents based on TELEMAC-2D simulations (and under the influence of wind, if applied). Turbulent motions not resolved by the TELEMAC-2D mesh are parameterised as random particle displacements in the horizontal and vertical directions.
4.1. Discharge window
In its initial concept, Magnox intended to discharge the FED effluent in a half-hour window beginning one hour after High Water; that is, from HW+1 to HW+1.5. Magnox wishes to evaluate the possibility of expanding this discharge window to provide more flexibility in their discharge regime.
We have simulated nitrate dispersion for a single discharge batch released at each hour of the tide. That is, we had a simulation with the release starting at HW, one at HW+1, another at HW+2, and so on over the complete tide. Each discharge ran for 30 minutes, and its evolution was tracked for 15 days (a full spring-neap cycle). The releases used the spring tide (first tide shown in Error! Reference source not found.) which is expected to show the greatest sensitivity to release time. Figure 4.2 shows the fraction of the discharge remaining within the estuary for each simulation. Here, ‘within the estuary’ is defined as west of 602000 mE; the figure shows 25-hour averages to expose the trend over time, without variations due to individual tides.
These results suggest that releasing close to HW gives a significant benefit in terms of reducing the nitrate retention within the estuary – releasing at HW+6 (close to low water) leads to nearly 70% of the batch remaining in the estuary after 15 days, compared with around 20% for HW+1. In these tests, releases at HW, HW+11 and HW+12 are predicted to give flushing at least as good as the present discharge at HW+1. The tidal cycle is roughly 12.5 hours; therefore HW+12 is around half an hour before the following HW, and HW+11 around 1.5 hours before it.

Bradwell Power Station
FED discharge arrangements: Far-field dispersion
EBR4908-RT010-R04-00 15
Figure 4.2: Fraction of first discharge retained within the estuary
Number labels indicate release start time (hours after HW).
The remainder of this section focuses on these four release times, within 2 hours before or after HW. It should be noted that discharge too close to high water might affect the performance of the diffuser, as discussed below in Section 4.3.
4.2. Far-field concentrations
To estimate the build-up of nitrate in the estuary, further simulations have been run, this time discharging for 30 minutes each day, at the same stage of the tide. The discharge window has been varied to give a set of four simulations. Figure 4.3 and Figure 4.4 show the predicted nitrate concentrations (as N) for the four simulations, averaged over one day on the spring tide and neap tide respectively. The black squares in these plots show our shifted monitoring points. The colour contour bands have been chosen to correspond to key nitrate concentrations, as summarised in Table 4.1.
Table 4.1: Nitrate threshold concentrations
concentration (mg/l) comment
0.25 EQS value (coastal waters)
0.078 10% of average background value, upper estuary
0.039 10% of average background value, mid estuary
0.035 10% of average background value, outer estuary
Source: EQS from Reference 5; background data from Magnox
0
10
20
30
40
50
60
70
80
90
100
0 2 4 6 8 10 12 14 16
daily‐average m
ass retained
(%)
days
HW
HW+1
HW+2
HW+3
HW+4
HW+5
HW+6 (LW)
HW+7
HW+8
HW+9
HW+10
HW+11
HW+12
HW+6 (LW)
5
74
32
8910
1
11HW
12

Bradwell Power Station
FED discharge arrangements: Far-field dispersion
EBR4908-RT010-R04-00 16
4.2.1. Spatial variations
The average impact at any location is the combination of a brief period when the patch may pass directly over, together with a much longer period when there is only indirect impact (residual concentration or returning patch), or no impact. Figure 4.3 and Figure 4.4 show that the average impact is most apparent in a long narrow ribbon extending some 10 km east of the outfall on a spring tide and 6 km east on a neap tide. The ribbon is narrower on the spring tide than on the neap tide. The average concentration of nitrate over a day due to the discharge is less than 0.25 mg/l in all locations in both simulations. It is noticeable that the maximum average impact is found near the eastern end of the tidal ribbon, in the area where the moving patch slows down and reverses.
On both spring and neap tides there is a large area of pale blue, which indicates that the average nitrate concentration produced by the discharge is over 10% of background nitrate for the outer and middle estuary but below 10% of background for the upper estuary. On the neap tide, with its smaller tidal excursion, the area of impact is shorter but concentrations within the footprint are higher, but still within the same range. In all simulated cases, there is a small area of yellow where the excess concentration is just above 10% of background for the upper estuary.
4.2.2. Time variations
The Environment Agency has a set of monitoring points in the Blackwater Estuary: points 4, 6, 7, 8 and 14 in Figure 4.1. The results discussed in this Chapter show that the effluent plume passes to the south of most of these points; therefore we have defined a set of points corresponding to the Agency locations, but moved onto the plume axis. These points are labelled with suffix a in Figure 4.1.
Figure 4.5 to Figure 4.10 show timeseries of nitrate concentration at our shifted monitoring locations. Figure 4.5 shows the actual variation in time at point 4a (just downstream of the outfall). As noted above, this shows a brief period when the patch passes directly over, visible as sharp spikes in the concentration, punctuated by much longer periods when there is only indirect impact (residual concentration or returning patch), or no impact. Figure 4.6 and the remaining plots show daily (25 hour) averages of the concentration to illustrate the general trend over time. (Note that the vertical axis for site 8 is expanded relative to the others.) The highest peak concentrations are those shown at site 4a, around 1.5 mg/l. The highest daily-average is at site 6a, around 0.13 mg/l. Concentrations at the Environment Agency monitoring sites are predicted to be around an order of magnitude lower than at our shifted locations; the values at those points are similar to those shown for site 8.

EBR490
Figure 4.3: Predicted nitrate concentrations, averaged over one day, spring tide (Day 15). Number labels show the start time of the release
17

EBR490
Figure 4.4: Predicted nitrate concentrations, averaged over one day, neap tide (Day 7). Number labels show the start time of the release
18

Bradwell Power Station
FED discharge arrangements: Far-field dispersion
EBR4908-RT010-R04-00 19
Figure 4.5: Predicted instantaneous nitrate concentrations, site 4a
Figure 4.6: Predicted nitrate concentrations (averaged over 25 hours), site 4a
‐20
‐15
‐10
‐5
0
5
10
0.0
0.5
1.0
1.5
2.0
2.5
0 2 4 6 8 10 12 14 16
water level (mODN)
nitrate concentration (mg/l)
days
HW HW+1 HW+11 HW+12Site 4a
‐20
‐15
‐10
‐5
0
5
10
0.0
0.1
0.2
0.3
0.4
0.5
0 2 4 6 8 10 12 14 16
water level (mODN)
nitrate concentration (mg/l)
days
HW HW+1 HW+11 HW+12Site 4a

Bradwell Power Station
FED discharge arrangements: Far-field dispersion
EBR4908-RT010-R04-00 20
Figure 4.7: Predicted nitrate concentrations (averaged over 25 hours), site 6a
Figure 4.8: Predicted nitrate concentrations (averaged over 25 hours), site 7a
‐20
‐15
‐10
‐5
0
5
10
0.0
0.1
0.2
0.3
0.4
0.5
0 2 4 6 8 10 12 14 16
water level (mODN)
nitrate concentration (mg/l)
days
HW HW+1 HW+11 HW+12Site 6a
‐20
‐15
‐10
‐5
0
5
10
0.0
0.1
0.2
0.3
0.4
0.5
0 2 4 6 8 10 12 14 16
water level (mODN)
nitrate concentration (mg/l)
days
HW HW+1 HW+11 HW+12Site 7a

Bradwell Power Station
FED discharge arrangements: Far-field dispersion
EBR4908-RT010-R04-00 21
Figure 4.9: Predicted nitrate concentrations (averaged over 25 hours), site 8
Figure 4.10: Predicted nitrate concentrations (averaged over 25 hours), site 14a
‐20
‐15
‐10
‐5
0
5
10
0.00
0.02
0.04
0.06
0.08
0.10
0 2 4 6 8 10 12 14 16
water level (mODN)
nitrate concentration (mg/l)
days
HW HW+1 HW+11 HW+12Site 8
‐20
‐15
‐10
‐5
0
5
10
0.0
0.1
0.2
0.3
0.4
0.5
0 2 4 6 8 10 12 14 16
water level (mODN)
nitrate concentration (mg/l)
days
HW HW+1 HW+11 HW+12Site 14a
Bradwell Power Station
FED discharge arrangements: Far-field dispersion
EBR4908-RT010-R04-00 22
4.3. Oyster beds
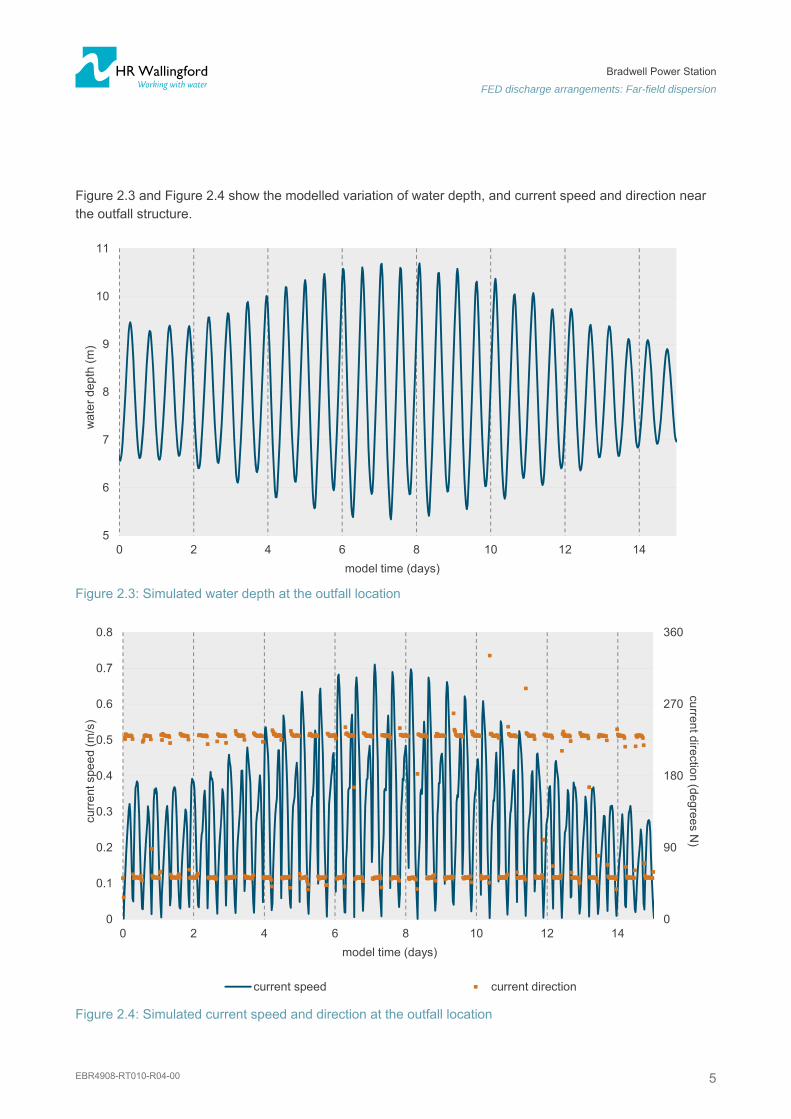
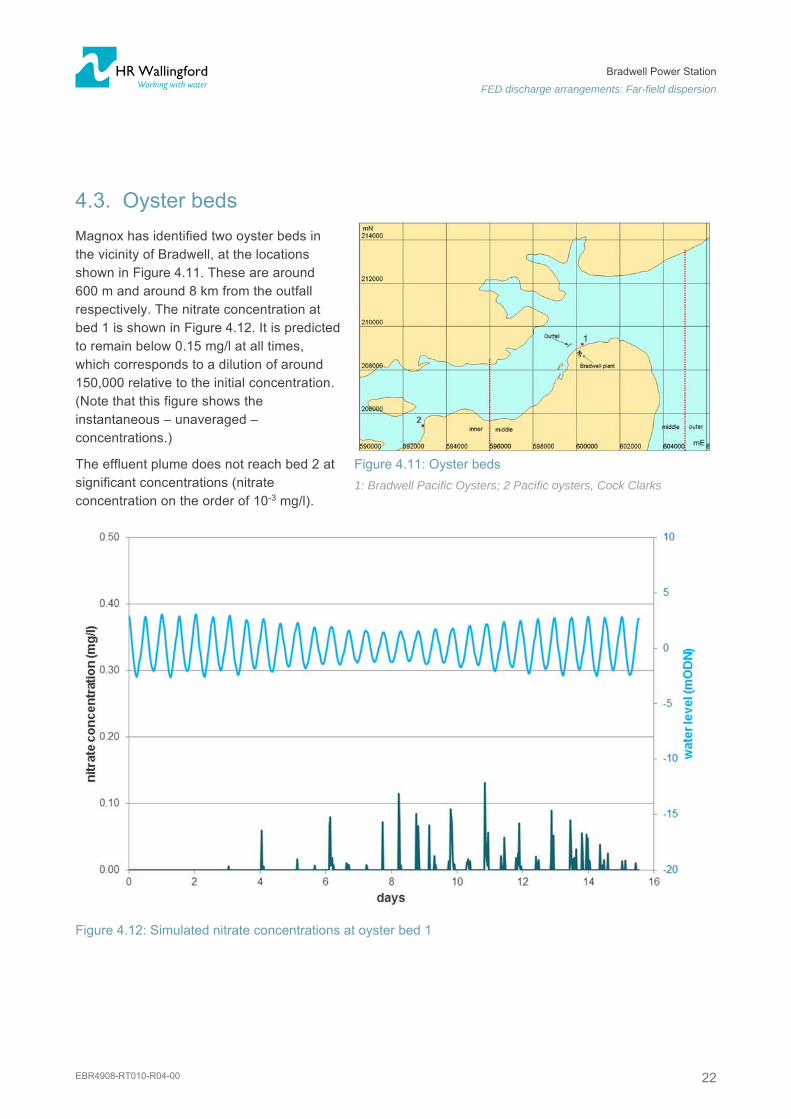
Magnox has identified two oyster beds in the vicinity of Bradwell, at the locations shown in Figure 4.11. These are around 600 m and around 8 km from the outfall respectively. The nitrate concentration at bed 1 is shown in Figure 4.12. It is predicted to remain below 0.15 mg/l at all times, which corresponds to a dilution of around 150,000 relative to the initial concentration. (Note that this figure shows the instantaneous – unaveraged – concentrations.)
The effluent plume does not reach bed 2 at significant concentrations (nitrate concentration on the order of 10-3 mg/l).
Figure 4.12: Simulated nitrate concentrations at oyster bed 1
Figure 4.11: Oyster beds
1: Bradwell Pacific Oysters; 2 Pacific oysters, Cock Clarks
Bradwell Power Station
FED discharge arrangements: Far-field dispersion
EBR4908-RT010-R04-00 23
4.4. Discussion
The results presented here suggest that a discharge timed close to High Water (within about 1-1.5 hours before or after HW) will cause the nitrate discharge to flush out of the Blackwater Estuary at least as rapidly as the present arrangement. However, our study (Reference 6) has also shown that the initial dilution of the effluent – that is, mixing in the near field – depends strongly on the current speed. For this reason, discharging very close to HW, when current speeds are at their lowest, may cause a pool of water at high concentration to collect close to the outfall. Although this pool will be dispersed as the current speed increases with the falling tide (after 30 minutes to 2 hours) it may be considered undesirable.
Discharging later on the ebb tide would result in greater initial dilution (and so lower concentrations immediately adjacent to the outfall) but is predicted not to allow the plume to escape rapidly from the estuary (Figure 4.2). Although it may be practical to extend the discharge window slightly, these results taken together suggest that the possible extension is small. It may be most convenient in practice to retain the present window from HW+1 to HW+1.5.
5. Discharge operating sequenceWe have suggested that it is most practical to retain the present discharge window from HW+1 to HW+1.5. With the proposed dedicated outfall structure, there will be no complicated hydraulics associated with the stored volume in the discharge line (in contrast to the situation with discharge into the cooling water tunnel, discussed in Reference 7) and so the discharge should begin as soon as the pumps are engaged. The operating sequence becomes:
HW+1 FED tank is full; pipeline is full of FED (remaining from previous release). Pumps start. Effluent starts to emerge from outfall port.
HW+1.5 FED tank is empty. Pumps stop. No more effluent emerges from outfall port. Pipeline remains full of FED.
The hydraulics of the outfall line should be configured (during detailed design) so that no further FED effluent trickles out after the pumps have stopped running. Alternatively, the pipeline could be flushed out with fresh water if preferred.
6. Long-term concentrations
6.1. Extended simulations
A simulation has been carried out over two months of discharge. The results shown in Figure 6.1 and Figure 6.2 indicate peak concentrations consistent with those discussed above (in the range 0.039-0.078 mg/l), but suggest that the nitrate plume will become more diffuse, and cover a larger part of the estuary, though still almost entirely confined to the middle and outer parts, with little intrusion to the upper estuary. Isolated patches of apparent higher concentrations near the coast (such as that near Brightlingsea in the top-right corner of both figures) are artefacts due to ‘stranded’ particles in dry areas, and should be ignored.
The simulations do not include any processes other than tidal dispersion, although in fact biological and other processes can play a significant part in reducing nitrate concentrations in estuaries. In this case, the

Bradwell Power Station
FED discharge arrangements: Far-field dispersion
EBR4908-RT010-R04-00 24
discharge is flushed out of the estuary relatively quickly by the tide, and we consider that other processes are unlikely to produce a significant further reduction in nitrate concentrations.
In the longer term, when the FED discharge finishes, the residual nitrate concentration will gradually reduce back to the background concentration.
6.2. Bulk mixing
If we examine the discharge in the context of the overall flows into the estuary and the total volume of the estuary we can estimate the impact of various amounts of retention of the effluent.
The volume of water in the estuary west of 602000mE, estimated from the hydrodynamic model is:
High water spring 269 x 106 m3
High water neap 194 x 106 m3
Average high water 232 x 106 m3.
The total volume to be discharged during the 49-week operation can be estimated on the basis of continuous operation as 20 x 49 x 7 = 6.9 x 10³ m3 of effluent.
Even if all of this were retained in the estuary there would still be a dilution factor of about 30,000 relative to the concentration in the FDT (22,100 mg/l) giving nitrate concentrations of the order 0.6 mg/l to 0.8 mg/l. These values are the average for the whole volume considered, and locally concentrations could be considerably higher, following the patterns shown in Figure 6.1 and Figure 6.2.
If as much as 10% of all the discharge is retained (as suggested by Sections Error! Reference source not found. and 6.4) there would be a dilution factor of 300,000 giving average nitrate concentrations for the volume considered of the order 0.06 mg/l to 0.08 mg/l. For the middle estuary, this is about 20% of the baseline concentration.
These numbers are calculated using the high tide volume but the implied average concentration applies to all states of the tide. This is because the discharge is always added close to high tide. The subsequent outflow of water reduces the total volume but does not increase the concentration.
It can also be noted that according to the National River Flow Archive (Reference 8) the average inflow rate into the estuary from the rivers is:
Blackwater at Langford 1.33 m3/s
Chelmer at Rushes Lock 1.90 m3/s
Ter at Crabb’s Bridge 0.28 m3/s
Brain at Guithavon Valley 0.39 m3/s.
These rivers combine before entering the west end of the estuary close to Maldon so
Total at Maldon 3.94 m3/s or 340,600 m3/day.
In addition the Colne at Lexden contributes a further 91,900 m3/day (1.1 m3/s), but this is further east than the main impact area of the FED discharge as illustrated in Chapter 4.
On average the river flow into the Blackwater estuary (excluding the Colne) is some 17,000 times the effluent discharge volume, and is enough to completely flush the estuary in some 510 days. Thus the rivers will supply a volume equivalent to two-thirds of the water originally in the estuary during the FED discharge, implying that the natural flushing period might be of the order of two years.

Bradwell Power Station
FED discharge arrangements: Far-field dispersion
EBR4908-RT010-R04-00 25
6.3. Other removal mechanisms
The PLUME-RW model calculates dispersion by tidal currents during the period simulated in the hydrodynamic model. This is a period of low residual current in the outer coastal area. In these conditions the same water that leaves the estuary on the ebb tide tends to return on the flood. It is likely that at times during the operation of the FED there will be additional residual currents associated with weather disturbances, etc, that will reduce the volume of “old” water returning to the estuary on the flood tide and replace it with “new” water from the north or the south. This will tend to reduce the build-up of FED effluent in the estuary.
There are also removal processes for the nitrate, corresponding to chemical, biological and sedimentary processes that are not included in the PLUME-RW model. Reference 4 indicates that significant denitrification occurs in the Colne (32-44% of the TOxN entering via the river is removed en route to the North Sea), mainly in the upper estuary.
These considerations indicate that, while the PLUME-RW model is an effective tool for investigating the dilution and dispersion of the FED discharge on the first few tides, it omits some important removal processes that affect the long-term build up, which makes the longer term simulations described above over-conservative. The PLUME-RW model is regarded as a reliable simulator of the processes by which the point discharge is transformed into a diffuse concentration field. Figure 6.1 and Figure 6.2 and additional analysis of the model results show that this tidally-dispersed concentration pattern would be fairly uniform.
As the built-up dispersion pattern of the discharge is so widespread and uniform, and as the concentration (without additional removal mechanisms) is of the same order as the existing concentration, the subsequent dispersion and removal of the nitrate in the discharge is expected to be similar to that of the existing nitrate load to the same area. The subsequent behaviour is therefore best determined by considering what is already known about the well-distributed nitrates from other sources, as discussed below.
6.4. Evidence from other inputs of nitrate
Reference 4 presents a characterisation of the Essex Estuaries including the Colne and Blackwater Estuaries. The issue of nutrients in the Estuary is covered in Section 6.2 of Reference 4 The authors note that, as would be expected, agriculture is the dominant nitrogen source, contributing mainly via run-off into the freshwater rivers. The agricultural source is supplemented by discharges from sewage treatment works in the river Colne (about 10% of the total load) and to a lesser extent the Blackwater (about 1% of the total load).
In the Colne the main sewage treatment works source is at Colchester Hythe, with smaller sources at Fingringhoe and Brightlingsea. In the Blackwater the sewage treatment works are at West Mersea, Tiptree, Tollesbury, Bradwell and Maldon.
The annual loads of total oxidised nitrogen (TOxN) are quoted in Section Error! Reference source not found. of this report, which shows that the average concentration in the Colne is 1830/91900 = 0.020 kg/m3 and the average concentration in the Blackwater is 6820/340600 = 0.020 kg/m3. That is, the concentration in both rivers is the same and amounts to 20 mg/l nitrate as N. The processes that reduce these concentrations down to the levels observed in the inner, middle and outer estuary (maximum 4.38 mg/l to 1.36 mg/l, average 0.78 mg/l to 0.35 mg/l) combine all the tidal and non-tidal dispersion and chemical and biological denitrification processes present in the system.

Bradwell Power Station
FED discharge arrangements: Far-field dispersion
EBR4908-RT010-R04-00 26
These loads may be compared with the estimated FED input of nitrogen of 663 kg per day for 49 weeks of operation per year giving an annual load of 0.190 x 10⁶ kg to 0.227 x 10⁶ kg.
The expected annual load from the FED plant is thus of the order 7.7% to 9.1% of the estimated annual load into the Blackwater and 5.9% to 7.1% of the estimated annual load into the Blackwater plus Colne (where the load into the Blackwater and Colne can be regarded as contributing to the middle and outer estuary).
If we allow for denitrification of 32% to 44% in the upper estuary (say 40% on average), as indicated in the previous section we can conclude that the FED discharge might amount to 7.7% to 9.1% of the load entering the upper estuary and about 10% of the load entering the middle and outer estuary.1
As the retained nitrate is well diffused and the discharge does not affect the flow patterns in the estuary to any significant extent, the most reasonable predictor of the overall increase in concentration in the estuary resulting from the FED discharge would be that the increase would be in proportion to the load: 8% to 10% depending on location within the estuary.
As indicated above, tidal dispersion would be expected to decrease this by about one-third per four weeks after discharges cease. Therefore the increase would be expected to decrease to less than 5% above background within about three months of cessation of discharge.
1 Based on the statement in Reference 4 (p92, para 2) that about 40% of the load in the Colne is lost by denitrification “en route to the North Sea” and “mainly in the upper estuary”. Assuming this to mean that 40% is lost before reaching the middle and outer estuary (and assuming that 40% is lost in the upper Blackwater estuary as well as the upper Colne estuary), this implies that, the real Blackwater + Colne contribution to middle and outer is only (1-0.4)x(2.49e6+0.669e6) so the FED plant “share” is increased by 1/(1-0.4) from (5.9% - 7.1%) to (9.8% - 11.8%) ≈ 10% - 12%. However, considering the relative contribution to the upper estuary, the calculation uses only the Blackwater source and ignores the denitrification loss.
Applying all, rather than most of the loss to the upper estuary gives a conservative estimate of the ratio of plant load to background load. It is probably also conservative to apply a 40% loss to the upper Blackwater estuary when the estuary report only gives the value for the Colne and implies it might be higher in the Colne than the Blackwater. Thus 10% seems a reasonable value.

Bradwell Power Station
FED discharge arrangements: Far-field dispersion
EBR4908-RT010-R04-00 27
Figure 6.1: Predicted nitrate concentrations, averaged over one day, spring tide after 50 days’ discharge
Figure 6.2: Predicted nitrate concentrations, averaged over one day, neap tide after 57 days’ discharge

Bradwell Power Station
FED discharge arrangements: Far-field dispersion
EBR4908-RT010-R04-00 28
7. ConclusionsThis report has examined dispersion of the FED effluent discharged using a dedicated outfall structure, close to the existing power station outfall. The existing discharge window of 30 minutes, beginning one hour after high water, is confirmed as the optimum time for release.
The metals contained in the discharge are expected to be brought under the EQS concentrations during the initial dilution phase of the discharge (within 100 m of the outfall) – even allowing for background levels where provided. For most of those substances, the predicted total concentrations are below 40% of the annual-average EQS value.
The effluent is expected to produce an increase in temperature of less than 0.1°C outside the mixing zone.
Modelling results suggest that the retained nitrate from the discharge is well-diffused. The FED discharge is predicted to increase the average nitrate concentrations in the Blackwater Estuary by less than 10% of the background value. Localised areas within the plume will experience higher concentrations. Close to the outfall and within the main plume, short-duration peak nitrate concentrations of up to 1.5 mg/l are predicted.
When the FED discharge finishes, the localised peak concentrations near the outfall will immediately be eliminated. Residual nitrate concentration in the estuary will gradually reduce back to the background concentration. Allowing for background processes removing nitrate from the estuary, the period required is estimated at a few (perhaps three) months.
8. References1. Tide and wind-induced flow modelling of the Blackwater Estuary. HR Wallingford report EX3870, 1998.
2. Blackwater Estuary Plume Dispersion Modelling. HR Wallingford report EX5876, 2008.
3. Bradwell Power Station Dedicated Discharge Structure: Current and water level measurementdeployment. Report EBR4908-RT007, HR Wallingford Ltd, February 2013.
4. Characterisation of the European Marine Sites: Essex Estuaries European Marine Site. Chessman BS,Burt GR and Langston WJ, Marine Biological Association of the United Kingdom Occasional Publication(17), (ISSN:02602784), 2006.
5. H1 Annex D – Basic Surface water discharges, Environment Agency, 2011.
6. Bradwell Power Station Effluent discharge arrangements: Initial dilution, HR Wallingford report EBR4908-RT009, 2014.
7. Bradwell Power Station: Active effluent discharge line dispersion assessment – additional studies ofdischarge to the existing tunnel. HR Wallingford report EX5065, 2005.
8. National River Flow Archive, http://www.ceh.ac.uk/data/nrfa/data/search.html.

Bradwell Power Station
FED discharge arrangements: Far-field dispersion
EBR4908-RT010-R04-00 17
© HR Wallingford
HR Wallingford is an independent engineering and environmental hydraulics organisation. We deliver practical solutions to the complex water-related challenges faced by our international clients. A dynamic research programme underpins all that we do and keeps us at the leading edge. Our unique mix of know-how, assets and facilities includes state of the art physical modelling laboratories, a full range of numerical modelling tools and, above all, enthusiastic people with world-renowned skills and expertise.
HR Wallingford, Howbery Park, Wallingford, Oxfordshire OX10 8BA, United Kingdom tel +44 (0)1491 835381 fax +44 (0)1491 832233 email [email protected] www.hrwallingford.com