Embed Size (px)
Citation preview

BR-236February 2005

METEOSAT - In 1977 the first of seven Meteosat meteorological satellites
was launched to monitor the weather over Europe and Africa.
Operational services from ESA’s first Earth Observation satellite still
continue to this very day.
ERS-1 and 2 - ERS-1, launched in 1991, was ESA’s first remote-sensing
satellite in polar orbit and carried a comprehensive payload to measure
ocean-surface temperature, waves and winds at sea. ERS-2, which
overlapped with ERS-1, was launched in 1995 and added the Global
Ozone Monitoring Experiment (GOME) for atmospheric ozone research.
ENVISAT - Launched in 2002, Envisat is the largest Earth-observation
satellite ever built. It carries 10 sophisticated optical and radar
instruments to provide continuous observation of the Earth’s oceans,
land, ice caps and atmosphere for the study of natural and man-made
contributors to climate change and for the study of natural resources.
MSG (Meteosat Second Generation) - Following the success of Meteosat,
the procurement of four improved second-generation MSG satellites
guarantees operational services for the next 15 years. The first MSG was
launched in 2002. MSG is a joint project between ESA and EUMETSAT.
CRYOSAT - Due for launch in 2005, CryoSat will determine variations in
the thickness of the Earth’s continental ice sheets and marine ice cover.
Its primary objective is to test and quantify the prediction of diminishing
polar ice due to global warming.
METOP (Meteorological Operational) - MetOp is a series of three satellites
dedicated to operational meteorology and forms the space segment of
EUMETSAT’s Polar System (EPS). The first satellite is due for launch in 2005.
GOCE (Gravity Field and Steady-State Ocean Circulation Explorer) - Due for
launch in 2006, GOCE will provide the data set required to accurately
determine global and regional models of the Earth’s gravity field and
geoid. It will advance research in areas of ocean circulation, physics of
the Earth’s interior, geodesy and surveying, and sea-level change.
ADM-Aeolus (Atmospheric Dynamics Mission) - Due for launch in 2007,
ADM-Aeolus will make novel advances in global wind-profile observation
and will provide much-needed information to improve weather
forecasting.
SMOS (Soil Moisture and Ocean Salinity) - Due for launch in 2007, SMOS
will provide global maps of soil moisture and ocean salinity to further our
understanding of the Earth’s water cycle and contribute to climate,
weather and extreme-event forecasting.
Swarm - Due for launch at the end of 2009, Swarm is a constellation of
three satellites to study the dynamics of the magnetic field to gain new
insights into the Earth system by improving our understanding of the
Earth’s interior and climate.
Further information can be obtained via the ESA Observing the Earth and Living Planet web sites at:
E S A ’ s E A R T H O B S E R V A T I O N M I S S I O N S
Prepared by:
Paul Ingmann & Martin Endemann
Published by:
ESA Publications Division
ESTEC, PO Box 299
2200 AG Noordwijk
The Netherlands
Editors: Honora Rider, Michael Rast &
Bruce Battrick
Design & Layout:
AOES Medialab & Jules Perel
Illustrations: AOES Medialab
Price: 10 Euros
ISSN No.: 0250-1589
ISBN No.: 92-9092-578-7
http://www.esa.int/earthobservation
http://www.esa.int/livingplanet

Contents
ADM-Aeolus:Atmospheric Dynamics Mission
The Earth’s wind systems
Why measure the wind from space?
How ADM-Aeolus works
The instrument
The satellite
Getting ready for a wind of change
ADM-Aeolus overview
2
4
6
8
10
12
14
16
A D M - A E O L U SE S A ’ s W I N D M I S S I O N

Many aspects of our lives are influenced by the weather. It goeswithout saying that accurate weather forecasts are importantfor commercial activities such as farming, fishing, constructionand transport, and in general make it easier to plan our dailyaffairs. In extreme circumstances, knowing what the weatherwill bring can also help save lives and protect property.
Although weather forecasts have advanced considerably inrecent years, meteorologists still urgently need reliable wind-profile data to improve the accuracy of forecasts even further.ESA’s wind mission, ADM-Aeolus, aims to demonstrate thatmeasuring global wind-profiles from space, using lasertechnology, can meet this requirement.
Due for launch in 2007, ADM-Aeolus, commonly referred to asjust ‘Aeolus’, is the fourth Earth Explorer mission to be
E S A ’ s L I V I N G P L A N E T P R O G R A M M E
ADM-Aeolus:Atmospheric Dynamics Mission
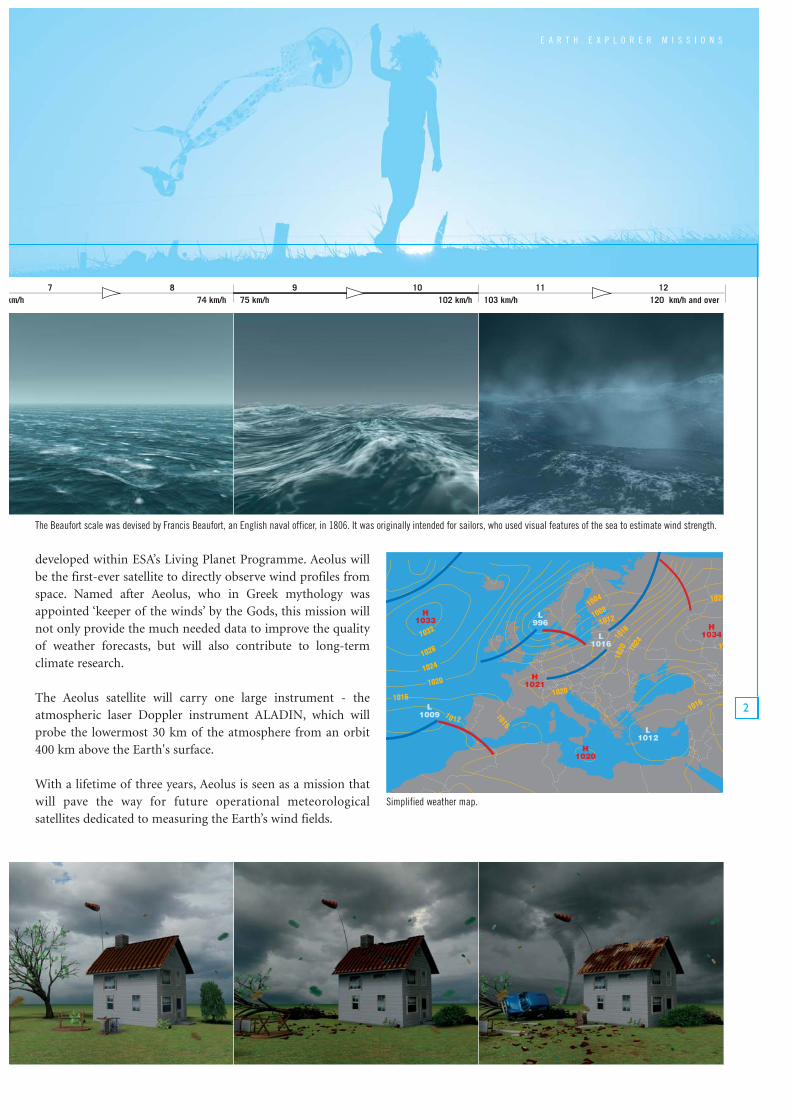
The Beaufort Wind Force Scale.
The Beaufort scale has been modified to use on land.
Cou
rtes
y J.
Ree
d
E A R T H E X P L O R E R M I S S I O N S
developed within ESA’s Living Planet Programme. Aeolus willbe the first-ever satellite to directly observe wind profiles fromspace. Named after Aeolus, who in Greek mythology wasappointed ‘keeper of the winds’ by the Gods, this mission willnot only provide the much needed data to improve the qualityof weather forecasts, but will also contribute to long-termclimate research.
The Aeolus satellite will carry one large instrument - theatmospheric laser Doppler instrument ALADIN, which willprobe the lowermost 30 km of the atmosphere from an orbit400 km above the Earth's surface.
With a lifetime of three years, Aeolus is seen as a mission thatwill pave the way for future operational meteorologicalsatellites dedicated to measuring the Earth’s wind fields.
2
Simplified weather map.
The Beaufort scale was devised by Francis Beaufort, an English naval officer, in 1806. It was originally intended for sailors, who used visual features of the sea to estimate wind strength.
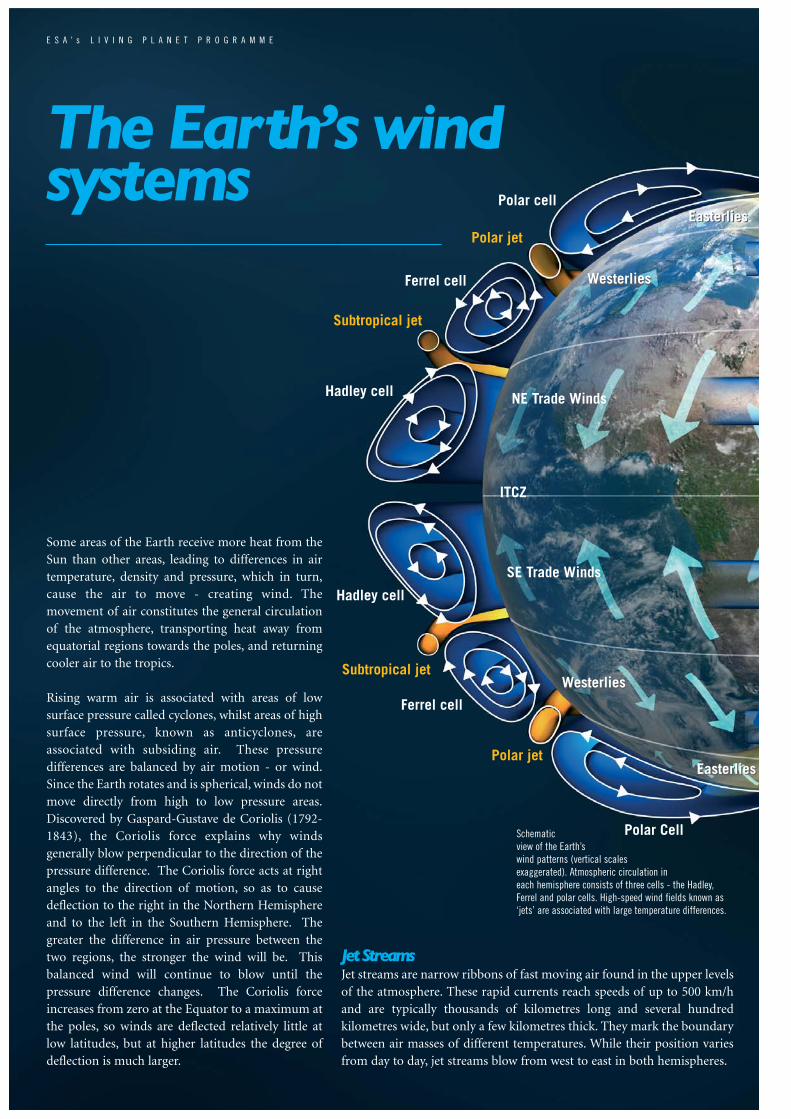
Some areas of the Earth receive more heat from theSun than other areas, leading to differences in airtemperature, density and pressure, which in turn,cause the air to move - creating wind. Themovement of air constitutes the general circulationof the atmosphere, transporting heat away fromequatorial regions towards the poles, and returningcooler air to the tropics.
Rising warm air is associated with areas of lowsurface pressure called cyclones, whilst areas of highsurface pressure, known as anticyclones, areassociated with subsiding air. These pressuredifferences are balanced by air motion - or wind.Since the Earth rotates and is spherical, winds do notmove directly from high to low pressure areas.Discovered by Gaspard-Gustave de Coriolis (1792-1843), the Coriolis force explains why windsgenerally blow perpendicular to the direction of thepressure difference. The Coriolis force acts at rightangles to the direction of motion, so as to causedeflection to the right in the Northern Hemisphereand to the left in the Southern Hemisphere. Thegreater the difference in air pressure between thetwo regions, the stronger the wind will be. Thisbalanced wind will continue to blow until thepressure difference changes. The Coriolis forceincreases from zero at the Equator to a maximum atthe poles, so winds are deflected relatively little atlow latitudes, but at higher latitudes the degree ofdeflection is much larger.
Schematicview of the Earth’swind patterns (vertical scalesexaggerated). Atmospheric circulation ineach hemisphere consists of three cells - the Hadley,Ferrel and polar cells. High-speed wind fields known as‘jets’ are associated with large temperature differences.
Jet StreamsJet streams are narrow ribbons of fast moving air found in the upper levelsof the atmosphere. These rapid currents reach speeds of up to 500 km/hand are typically thousands of kilometres long and several hundredkilometres wide, but only a few kilometres thick. They mark the boundarybetween air masses of different temperatures. While their position variesfrom day to day, jet streams blow from west to east in both hemispheres.
The Earth’s windsystems
E S A ’ s L I V I N G P L A N E T P R O G R A M M E

Did you know?
The windiest place in the world is inAntarctica where winds blow at morethan 100 km/h for five months ofthe year.
The highest wind speed ever recordedwas during a storm on 12 April 1934 atthe Mount Washington Observatory, NewHampshire, USA (altitude 1918 m),where gusts of wind measured 372 km/h.
The fastest surface wind speed at lowaltitude was registered on 8 March1972 at Thule, Greenland, where apeak speed of 333 km/h was recorded.
The Ancient Greeks used to think thatwind was the Earth breathing in and out.
Although the word ‘monsoon’ is nowused to describe the extraordinaryrainfall that occurs in parts of Asia,monsoon is in fact the name forseasonal winds that blow from thesouth-west in summer and from theopposite direction in the winter. Theword monsoon comes from the Arabicword for season ‘mausim’.
The first official hurricane warningwas issued in 1847 by William Reid,the British Governor of Barbados.
What the temperature feels likeoutdoors depends greatly on windspeed. At low temperatures, a roughguide is to take the actual airtemperature and then subtract 1°C andthe wind speed in metres per second(m/s). For example, an air temperatureof 0°C and a wind speed of 6 m/swould feel approximately like -7°C.This effect is called ‘wind chill’.
Aircraft often try to catch a ride on thejet stream to save fuel and time. Thejet stream is a current of fast movingair found in the upper levels of theatmosphere. At an altitude of 10 kmand wind speeds in excess of 450 km/h,planes travelling east from New Yorkto Paris can reduce their flying time byup to an hour.
CellsAtmospheric circulation in each
hemisphere consists of three cells:
- Hadley CellsHadley cells stretch north and south from the Intertropical
Convergence Zone (ITCZ) to about 30°. They are characterised by anupward flow near the surface at low latitudes, and a strong downward flow nearthe surface at higher latitudes. The latitudes where Hadley and Ferrel cells meet arecalled the Horse Latitudes.
- Ferrel CellsFerrel cells form at mid-latitudes (about 30-60°) balancing the transport fromHadley and polar cells. Jet streams, which are associated with high and low-pressure centres, are superimposed on the Ferrel cells.
- Polar CellsAtmospheric circulation cells located in polar regions.
E A R T H E X P L O R E R M I S S I O N S
4

Why measure the wind from space?
Temperature, pressure, humidity and wind are the basic variables thatdescribe the state of the atmosphere. Accurate global observations on windspeed and direction are currently urgently needed to enhance atmosphericmodelling so that operational weather forecasting, as well as the predictionof long-term climate change, can be improved.
Under certain conditions, wind and wind-field data can be derived fromtemperature fields, which are measured from space by atmosphericsounders using a relationship known as ‘geostrophic balance’. However,these relationships are not valid for small horizontal scales (below 3000 km)or large vertical scales (in the order of 10 km). The relationship also breaksdown in the tropics where the Coriolis force is weak. Feature-tracking insatellite images of clouds and water vapour can be used to provide windestimates. However, it is often difficult to assign accurate heights to theobserved features, and it is possible for physical processes such ascondensation and evaporation to be misinterpreted as wind. Scatterometerdata from satellites can also be used to derive information about wind,although this is only possible for surface winds over oceans. All in all, thereare large areas of the atmosphere where wind profiles are not regularlyobserved and this has led to a major deficiency in the Global ObservingSystem.
El Niño is a disruption of the ocean-atmosphere system in the tropicalPacific. In non-El Niño conditions (leftpanel), the Trade Winds blow towardsthe west. These winds lead to warmsurface water in the west Pacific.During an El Niño (right panel), thepressure difference weakens and thesurface wind changes direction, nowblowing from west to east. The result isa rise in sea-surface temperature inthe eastern-tropical Pacific.
© ESA
E S A ’ s L I V I N G P L A N E T P R O G R A M M E
Hurricane Isabel, 2000 km eastof the Leeward Islands in theCaribbean on 8 September2003. The image wastaken by the MediumResolution ImagingSpectrometer(MERIS) on-boardEnvisat.
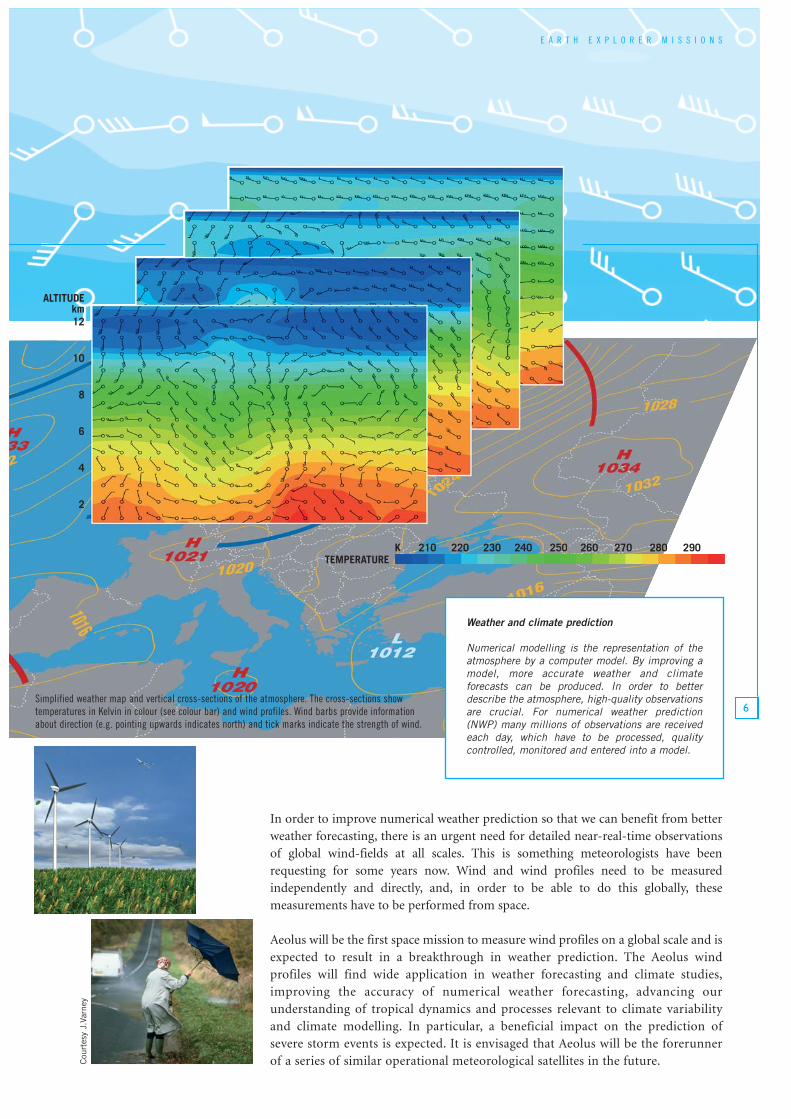
Weather and climate prediction
Numerical modelling is the representation of theatmosphere by a computer model. By improving amodel, more accurate weather and climateforecasts can be produced. In order to betterdescribe the atmosphere, high-quality observationsare crucial. For numerical weather prediction(NWP) many millions of observations are receivedeach day, which have to be processed, qualitycontrolled, monitored and entered into a model.
In order to improve numerical weather prediction so that we can benefit from betterweather forecasting, there is an urgent need for detailed near-real-time observationsof global wind-fields at all scales. This is something meteorologists have beenrequesting for some years now. Wind and wind profiles need to be measuredindependently and directly, and, in order to be able to do this globally, thesemeasurements have to be performed from space.
Aeolus will be the first space mission to measure wind profiles on a global scale and isexpected to result in a breakthrough in weather prediction. The Aeolus windprofiles will find wide application in weather forecasting and climate studies,improving the accuracy of numerical weather forecasting, advancing ourunderstanding of tropical dynamics and processes relevant to climate variabilityand climate modelling. In particular, a beneficial impact on the prediction ofsevere storm events is expected. It is envisaged that Aeolus will be the forerunnerof a series of similar operational meteorological satellites in the future.C
ourt
esy
J.Va
rney
E A R T H E X P L O R E R M I S S I O N S
6Simplified weather map and vertical cross-sections of the atmosphere. The cross-sections showtemperatures in Kelvin in colour (see colour bar) and wind profiles. Wind barbs provide informationabout direction (e.g. pointing upwards indicates north) and tick marks indicate the strength of wind.

E S A ’ s L I V I N G P L A N E T P R O G R A M M E
How ADM-Aeolus works
Being such a dynamic and relatively invisible aspect of theEarth’s environment, it is extremely difficult to make globalmeasurements of wind. Studies have shown that the only way toachieve this is to probe the atmosphere from space using ahighly sophisticated instrument called a ‘Doppler wind lidar’,which utilises a phenomenon called ‘light scattering’ and theDoppler Effect to acquire much-needed data on wind.
A lidar is similar to the more familiar radar, but transmits andreceives light instead of radio waves. A lidar works by emittinga short, but powerful, light pulse from a laser through theatmosphere. As the light pulse travels through the air itinteracts with molecules of gas, particles of dust and droplets ofwater. This causes a small amount of the light to be ‘scattered’in all directions. Some of this light is scattered back towards thelidar - this is called ‘backscattered light’. The lidar’s telescopecollects the backscattered light, and directs it towards a receiver.The time between sending the light pulse and receiving a signaldetermines the distance to the ‘scatterers’ (air molecules, clouddroplets, etc.), and thus the altitude above the surface of theEarth.
To measure wind from space, however, another property ofscattering has to be used - the Doppler Effect. When scatteringparticles are moving, the wavelength of the scattered light isshifted by a small amount as a function of speed. The Dopplerwind lidar measures this change of wavelength to determine thevelocity of the wind in the direction of the light pulse.
Light scattering
Whenever a light beam shines on an object, some fraction of thelight changes direction. This phenomenon is called lightscattering. The amount of scattering by a particle depends onits size relative to the wavelength of light.
‘Rayleigh scattering’ (named after the English Nobel prize-winner Lord John Rayleigh) refers to the scattering of light frommolecules of air, such as oxygen and nitrogen. Rayleighscattering is most efficient at scattering light at shorterwavelengths, i.e. blue and violet. This wavelength dependencemakes the sky look blue on a clear sunny day.
‘Mie scattering’ (named after the German physicist Gustav Mie)describes light scattering from particles larger than thewavelength of light. Mie scattering is visible when looking atclouds. Cloud droplets are large enough to scatter all visiblewavelengths equally. This means that all of the wavelengths ofthe sunlight encountering a cloud will be equally scattered -making the cloud appear white.
The relative motion of air leads to two effects - the centre frequency of the backscatteredlight is shifted with the wind velocity in the measurement direction, and the randommotion of the air molecules leads to a broadening of the frequency width for thebackscattered Rayleigh signal.
Schematic view of a space-borne lidar. A short laser pulse is emitted towards theatmosphere where air molecules and particles reflect a small portion of the light pulseback to the lidar. A telescope collects the light and directs it to the receiver. The signal isrecorded as a function of time to determine the altitude of the scattering layers.

E A R T H E X P L O R E R M I S S I O N S
8
To realise a space-borne Doppler wind lidar is technically verychallenging. The measurements have to be performed fromseveral hundred kilometres above the surface of the Earth;therefore, a powerful laser and a large telescope have to becoupled with a very sensitive receiver. Many measurements haveto be averaged in order to achieve accurate wind observations.
Also, the satellite moves much faster than the wind - the satellitetravels at a ground speed of about 7200 metres per secondwhilst the wind speeds being observed are only in the order ofa few metres per second. A sophisticated pointing system isrequired to ensure that the instrument is pointing at a specificangle so that the speed of the satellite can be accounted for.
Aeolus will orbit the Earth at an altitude of about 400 km.Measurements will be taken orthogonal to the flight directionat an angle of 35° off-nadir. For every 700 laser-pulses, overwhich time the satellite moves forward 50 km, one windprofile will be obtained. The data will be transmitted to aground station in Svalbard, Norway once per orbit, i.e. every90 minutes.
The Doppler Effect
Have you heard a police car go by recently? Remember how the pitch changes as the vehicletravels towards, and then away from you - first thepitch becomes higher, and then, as it passes itbecomes lower. The change in pitch is a result of ashift in the frequency of sound waves. Although firstdiscovered for sound waves by the Austrianmathematician and physicist, Christian Doppler(1803-53), the Doppler Effect holds true for alltypes of waves including light. The Doppler Effectfor light waves is usually described in terms ofwavelength rather than frequency and is equivalentto a shift in light colour.

E S A ’ s L I V I N G P L A N E T P R O G R A M M E
The instrument
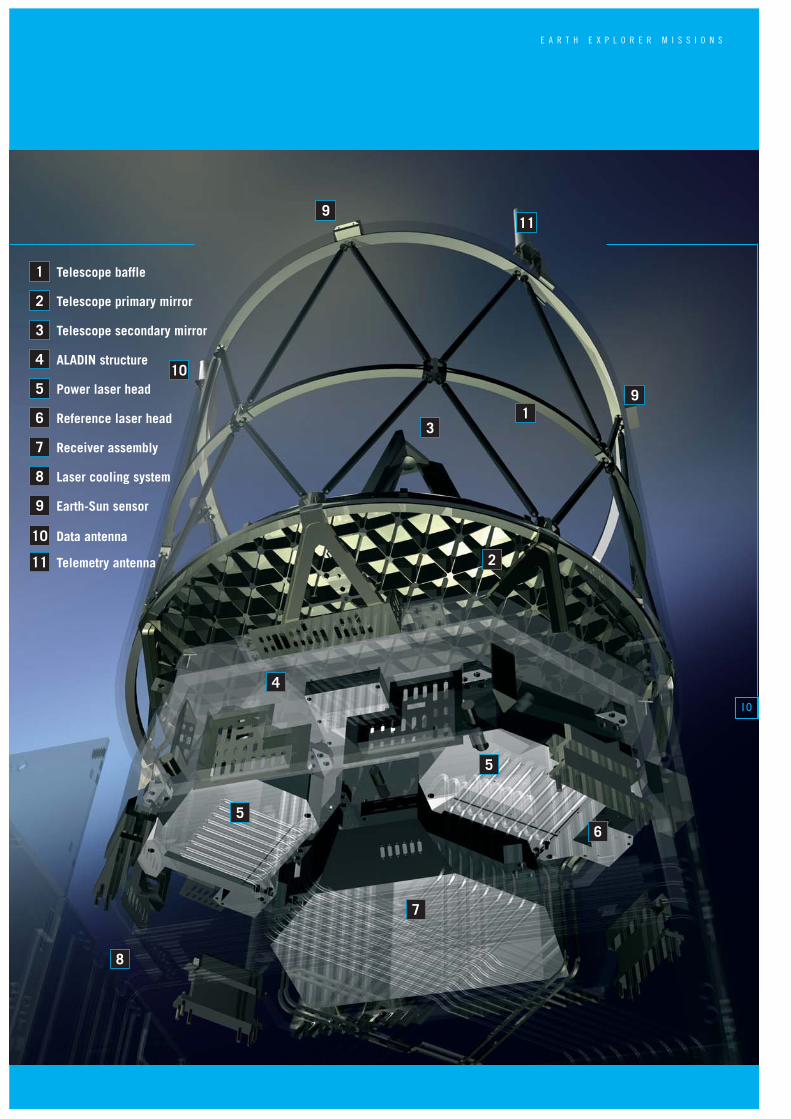
The concept of using a Doppler wind lidar in space to measurewind goes back more than 20 years. However, until recently,studies had found that the measuring techniques would be toocomplicated and consequently nothing was ever realised. Withthe benefit of years of research, the technology has now becomesufficiently advanced to launch the Aeolus satellite carrying aninnovative instrument called ALADIN (Atmospheric LaserDoppler Instrument).
Based on breakthrough technology, ALADIN consists of apowerful laser system to emit short laser pulses down to theatmosphere, a large telescope to collect the backscattered lightsignal, and a very sensitive receiver to analyse the Doppler shiftof the signal from layers at different heights in the atmosphere.
The laser system generates a series of short light pulses in theultraviolet spectral region at 355 nm, which is invisible to thenaked eye and poses no danger for observers on the ground.The ultraviolet region was chosen because the backscatter fromatmospheric molecules at this short wavelength is particularlystrong, and also because this wavelength can be generated withsolid-state lasers, which are amongst the most advancedavailable.
The laser system is actually a complex system of laser sourcesand amplifiers, which are all packaged closely together. There aretwo small lasers used to fix the frequency of the emitted pulses,a laser oscillator to generate pulses with the correct temporalcharacteristics, and two amplifier stages that boost the energy ofthe light pulses to the required value. The light pulses aregenerated in the infrared spectral region (1064 nm.). Thefrequency of the infrared pulses is tripled by a set of two non-linear crystals to reach the ultraviolet (355 nm).
ALADIN is dominated by a large telescope, which measures 1.5 metres in diameter. The telescope is used to collect thebackscattered light from the atmosphere and then directs it tothe receiver. Although large, the telescope is made of alightweight ceramic material so that it weighs only 55 kilograms.
The receiver analyses the Doppler shift of the backscatteredsignal with respect to the frequency of the transmitted laserpulse. Two optical analysers are used to measure, respectively,the Doppler shift of the molecular scattering (Rayleigh) andscattering from aerosols and water droplets (Mie).
Highly sensitive photo-detectors then transform the light signalsinto electronic signals, which are amplified and stored on boarduntil they are transmitted to the ground for processing.
The wind profiles are averaged over a distance of 50 km, whichcorresponds to 700 individual measurements and 7 seconds ofmeasurement time. The wind observations are spaced 200 kmapart and correspond to 28 seconds complying with numericalweather prediction and model requirements.
Baseline Aeolus measurement geometry. The wind is observed orthogonal to the satellite ground-track, pointing 35° off-nadir, away from the Sun. Observations cover 50 km along the flight direction, and are spaced 200 km apart.(H)LOS means (horizontal) line of sight.
E A R T H E X P L O R E R M I S S I O N S
10

E S A ’ s L I V I N G P L A N E T P R O G R A M M E
The satellite
Although developed specifically for Aeolus, the design of thesatellite is based on a heritage of other ESA missions. The aim hasbeen to build a satellite that is relatively simple to operate. Thisreduces the operating costs throughout its lifetime, and is alsoimportant for the future since several Aeolus-type satellites arelater envisaged for operational use.
Aeolus will be placed in a polar Sun-synchronous, dusk/dawnorbit, 408 kilometres above the surface of the Earth. This altitude,which is half the height of most other Earth observationmissions, is a compromise between observing the best signal andkeeping fuel consumption to a minimum. A lower altitude wouldhave considerably increased the fuel required to maintain asteady orbit over the three-year lifetime of the mission.
The dusk/dawn orbit (where the satellite crosses the Equator at06.00 and 18.00 hours local time) will provide maximumillumination from the Sun, as well as a stable thermalenvironment. Observations of the wind will be performed on thenight-side of the satellite to avoid the solar background.However, when orbiting over the hemisphere experiencingwinter, the satellite will enter the Earth’s shadow for up to
20 minutes per orbit. This means that the satellite will undergohuge temperature changes as it passes from day into night. Withthis in mind, the thermal design has had to be particularly robust.
Aeolus carries a state-of-the-art high-precision pointing systemto point the ALADIN instrument towards the Earth’satmosphere. In order to obtain accurate wind profiles thepointing system has to be extremely stable and has had to meetvery demanding technical requirements.
Keeping the ALADIN laser system cool has posed a new problemin space technology. However, this has been resolved byengineering a large radiator on the dark side of the spacecraftwhich radiates the excess heat back into space. The radiator isconnected to the laser system via a number of heat pipes.
Once every orbit the measurement data will be sent to a groundstation in Svalbard, Norway. For a polar-orbiting satellite aground-station at high latitudes is ideal for fast data delivery,although any satellite receiving station with a dish more than 2.4 metres in diameter could be used if data were required moreurgently than within 3 hours.
The Aeolus satellite in launch configuration with the solar arrays folded up. In the flight direction, thesatellite has white covers that protect it from atomic oxygen erosion (left image), while the oppositesides of the satellite are covered with gold-coloured insulation for thermal control (right image).

12
E A R T H E X P L O R E R M I S S I O N S
The data are transmitted from the receiving station to theprocessing station, where the measurement signals that ALADINhas made are translated into wind profiles. These processed dataare then sent to various meteorological offices to be used inweather forecasts. The ground processing-system is geared toprovide rapid data processing and delivery as fast as possible.
The complete satellite is small and light enough to fit on anumber of small launchers, such as Rockot, Vega or Dnepr.The launch cost is, therefore, comparatively low.
Ground pattern of wind observationscovering a 150-second flight segment.
One 50 km-long wind observation, dividedinto individual measurements of 3.5 km, isindicated. The measurement correspondsto 50 laser pulses, while one observation
corresponds to 700 laser pulses.
E S A ’ s L I V I N G P L A N E T P R O G R A M M E
Getting readyfor a wind of change
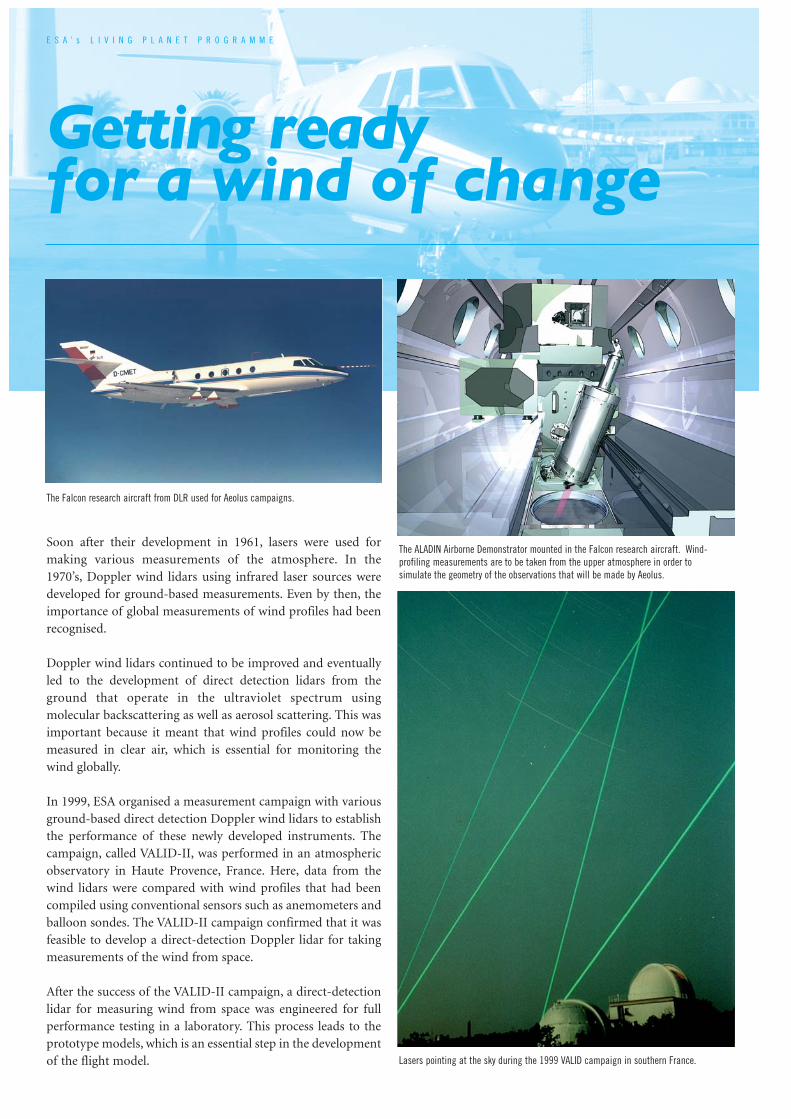
Soon after their development in 1961, lasers were used formaking various measurements of the atmosphere. In the1970’s, Doppler wind lidars using infrared laser sources weredeveloped for ground-based measurements. Even by then, theimportance of global measurements of wind profiles had beenrecognised.
Doppler wind lidars continued to be improved and eventuallyled to the development of direct detection lidars from theground that operate in the ultraviolet spectrum usingmolecular backscattering as well as aerosol scattering. This wasimportant because it meant that wind profiles could now bemeasured in clear air, which is essential for monitoring thewind globally.
In 1999, ESA organised a measurement campaign with variousground-based direct detection Doppler wind lidars to establishthe performance of these newly developed instruments. Thecampaign, called VALID-II, was performed in an atmosphericobservatory in Haute Provence, France. Here, data from thewind lidars were compared with wind profiles that had beencompiled using conventional sensors such as anemometers andballoon sondes. The VALID-II campaign confirmed that it wasfeasible to develop a direct-detection Doppler lidar for takingmeasurements of the wind from space.
After the success of the VALID-II campaign, a direct-detectionlidar for measuring wind from space was engineered for fullperformance testing in a laboratory. This process leads to theprototype models, which is an essential step in the developmentof the flight model. Lasers pointing at the sky during the 1999 VALID campaign in southern France.
The Falcon research aircraft from DLR used for Aeolus campaigns.
The ALADIN Airborne Demonstrator mounted in the Falcon research aircraft. Wind-profiling measurements are to be taken from the upper atmosphere in order tosimulate the geometry of the observations that will be made by Aeolus.

E A R T H E X P L O R E R M I S S I O N S
14
These prototype models will be used to build a fully functionaldirect-detection Doppler lidar that is representative of thespace-borne ALADIN lidar. This demonstrator has to be able toperform wind measurements using the same geometry as itwould use in space. However, for testing it must also be capableof taking measurements from an aircraft. The ALADINAirborne Demonstrator is currently under construction anddue to be ready in 2005. A first ground-based measurementcampaign will compare wind measurements between thedemonstrator and those from conventional wind measurementtechniques and other Doppler wind lidars. The campaign willbe carried out at the Meteorological Observatory inLindenberg, Germany.
Following the ground-based campaign, the ALADINdemonstrator will be integrated into a research aircraft fromthe German Aerospace Centre (DLR) to perform airbornemeasurements. In addition, an existing Doppler wind lidar willalso be installed in the aircraft to make measurements. Thewind observations from these two airborne Doppler lidars willbe complemented with ground-based data from theLindenberg site.
A number of airborne campaigns are to be carried out prior tolaunch to sample different meteorological conditions. Theseground-based and airborne measurement campaigns areimportant to ensure that the data that will be eventuallyreceived from the Aeolus mission will be as accurate andmeaningful as possible.
In the Lindenberg Column, vertical profiles of wind temperature, water vapour and liquid water are measured for validating observations from other instruments.
An anemometer measures wind speed.The wind drives a shaft with 3 half-shells. A tachometer measures therotational speed - this is proportional tothe wind speed. A radiosonde.
Cou
rtes
y: V
. Q
uasc
hnin
g
Courtesy: Deutscher Wetterdienst
E S A ’ s L I V I N G P L A N E T P R O G R A M M E
ADM-Aeolus overviewThe Atmospheric Dynamics Mission Aeolus will provide globalobservations of wind profiles from space to improve the qualityof weather forecasts, and to advance our understanding ofatmospheric dynamics and climate processes. By demonstratingnew laser technology, Aeolus is seen as a pre-operationalmission paving the way for future meteorological satellites tomeasure the Earth’s wind.
ADM-Aeolus was selected in 1999 as an Earth Explorer Coremission as part of ESA’s Living Planet Programme.
Mission Objectives- To measure global wind profiles up to an altitude of 30 km- To measure wind to an accuracy of 1m/s in the planetary
boundary layer (up to an altitude of 2 km)- To measure wind to an accuracy of 2 m/s in the free
troposphere (up to an altitude of 16 km)- To determine the average wind velocity over 50 km tracks.- To measure 120 wind profiles per hour.
Mission DetailsLaunch: 2007 Duration: 3 years (plus 3-month commissioning phase)
Mission OrbitSun-synchronous, dusk/dawn orbitInclination: 97°Altitude: 408 km
ConfigurationTotal dry mass of 1100 kg, comprising:- platform 650 kg (plus 116-266 kg propellant)- payload 450 kgDimensions (launch configuration):- height 4.6 m, length 1.9 m, width 2.0m.
Payload- Atmospheric Laser Doppler Instrument ALADIN - a Direct
Detection Doppler Wind Lidar operating in the near UV(355 nm)
- Transmitter: diode laser pumped Nd: YAG laser, frequencytripled to 355 nm 150 mJ pulse energy, 100 Hz pulse repetitionfrequency in bursts of 10 s (including warm-up time) witha 28 s repeat period, single frequency (line-width less than30 MHz), tuneable over 10 GHz spectral range.
- Receiver: 1.5 m diameter SiC telescope, Mie channel (aerosoland water droplets) with Fizeau spectrometer, Rayleighchannel (molecular scattering) using dual edge étalonspectrometer signal detection applying two charge coupleddevices with on-chip signal averaging for noise reduction.
Attitude Control- Pointing knowledge (after in-flight calibration): 30 µrad.- Sensors: coarse Earth Sun sensor, magnetometer for coarse
pointing control, star tracker, inertial measurement unit, GPSfor fine pointing control.
- Actuators: reaction wheels, magnetotorquers, thrusters.
Power- Average power demand 1400 W.- GaAs Solar Array with 2200 W end-of-life power.- Energy storage in 84 Ah Li-ion battery.
Telemetry and Command- Telecommand uplink 2030 MHz (S-band), 2 kbps.- Telemetry downlink 2205 MHz (S-band), 8 kbps.- Telemetry ground station Kiruna, Sweden.- Measurement data downlink: 8040 MHz (X-band), 10 Mbps.- Data ground-station: Svalbard.
Ground Infrastructure- Command & Control Centre: European Space Operations
Centre (ESA-ESOC), Germany.- Data processing: European Space Research Institute
(ESA-ESRIN), Italy.- Wind profile retrieval: European Centre for Medium-Range
Weather Forecasts (ECMWF), UK.- Data ground processing to be completed within 5 minutes
after reception at processing station.
Launch VehicleTo be decided - Aeolus is compatible with many smalllaunchers, such as Rockot, Dnepr and Vega.
Platform and Payload Prime ContractorEADS Astrium
The SvalSat data receiving station in Svalbard. Due to its location in the Arctic,measurement data from Aeolus is received every orbit, i.e. every 90 minutes.
© K
ongs
berg
Sat
ellit
e S
ervi
ces,
Nor
way
, 2
00
4.


![[Frontiers in Bioscience, 3, d208-236, February 15, 1998 ...[Frontiers in Bioscience, 3, d208-236, February 15, 1998] 208 CELL-CELL COMMUNICATION IN CARCINOGENESIS James E. Trosko1,Randall](https://img.dokumen.tips/doc/110x75/5e7a41b6970d6f051943d6e3/frontiers-in-bioscience-3-d208-236-february-15-1998-frontiers-in-bioscience.jpg)