Embed Size (px)
Citation preview

FOR IMMEDIATE RELEASE
London 29 October 2019
BP p.l.c. Group resultsThird quarter and nine months 2019Highlights Continued strong operating cash flow and strategic delivery
• Financial results– Underlying replacement cost profit for the third quarter of 2019 was $2.3 billion, compared to $3.8 billion a year earlier. The result
was impacted by significantly lower Upstream earnings, resulting from lower prices, maintenance and weather impacts. – A divestment-related, non-cash, non-operating after-tax charge of $2.6 billion resulted in a reported loss for the quarter of $0.7
billion.– Operating cash flow, excluding Gulf of Mexico oil spill payments, was $6.5 billion for the quarter, including a $0.1 billion working
capital release (after adjusting for net inventory holding losses). Gulf of Mexico oil spill payments were $0.4 billion on a post-taxbasis.
– A dividend of 10.25 cents per share was announced for the quarter. Scrip dividend alternative suspended for the third quarter.• Upstream operations impacted by maintenance and weather, Downstream strong
– Reported oil and gas production for the quarter averaged 3.7 million barrels of oil equivalent a day, compared to 3.6 millionbarrels of oil equivalent a day a year earlier.
– Underlying Upstream production, excluding Rosneft, was down 2.5% from a year earlier, reflecting maintenance across a numberof regions and weather impacts in the US Gulf of Mexico.
– The Downstream delivered strong operations with overall 96% Solomon availability for the quarter, and record crude wasprocessed at the Whiting and Cherry Point refineries in the US.
• Divestments ahead of schedule, Downstream expansion in fast-growing markets– Following the agreement to sell all BP’s interests in Alaska to Hilcorp Energy, divestment transactions announced in 2019 totalled
$7.2 billion at the end of the third quarter. BP expects this to reach around $10 billion by year end.– In the Downstream, BP continued its strategic delivery in new markets, announcing joint ventures in fuels marketing in India and
electric vehicle charging in China.– In the quarter BP announced that it will deploy continuous measurement of methane emissions on all its future major operated oil
and gas processing projects.
1
Third quarter ($ billion) Underlying RC profit Profit (loss) for theperiod
Operating cash flow excluding Gulf ofMexico oil spill payments
4
2
0
2018 2019
3.8
2.3
4
2
0
-2
2018 2019
3.3
(0.7)
8
4
0
2018 2019
6.6 6.5
Bob Dudley – Group chief executive:BP delivered strong operating cash flow and underlying earnings in a quarter that saw lower oil and gas prices and significanthurricane impacts. Our focus remains firmly on maintaining financial discipline and delivering safe and reliable operationsthroughout BP. We’re also continuing to advance our strategy, making strong progress with our divestment plans and buildingexciting new opportunities in fast-growing downstream markets in Asia.
Financial summary Third Second Third Nine Ninequarter quarter quarter months months
$ million 2019 2019 2018 2019 2018Profit (loss) for the period attributable to BP shareholders (749) 1,822 3,349 4,007 8,617Inventory holding (gains) losses, net of tax 398 (47) (258) (488) (1,348)RC profit (loss) (351) 1,775 3,091 3,519 7,269Net (favourable) adverse impact of non-operating items and fair value
accounting effects, net of tax 2,605 1,036 747 3,904 1,977Underlying RC profit 2,254 2,811 3,838 7,423 9,246RC profit (loss) per ordinary share (cents) (1.72) 8.72 15.45 17.33 36.42RC profit (loss) per ADS (dollars) (0.10) 0.52 0.93 1.04 2.19Underlying RC profit per ordinary share (cents) 11.06 13.82 19.18 36.57 46.32Underlying RC profit per ADS (dollars) 0.66 0.83 1.15 2.19 2.78
RC profit (loss), underlying RC profit, operating cash flow excluding Gulf of Mexico oil spill payments and working capital are non-GAAP measures.These measures and underlying production, Solomon availability, inventory holding gains and losses, non-operating items and fair value accountingeffects are defined in the Glossary on page 32.
The commentary above and following should be read in conjunction with the cautionary statement on page 36.
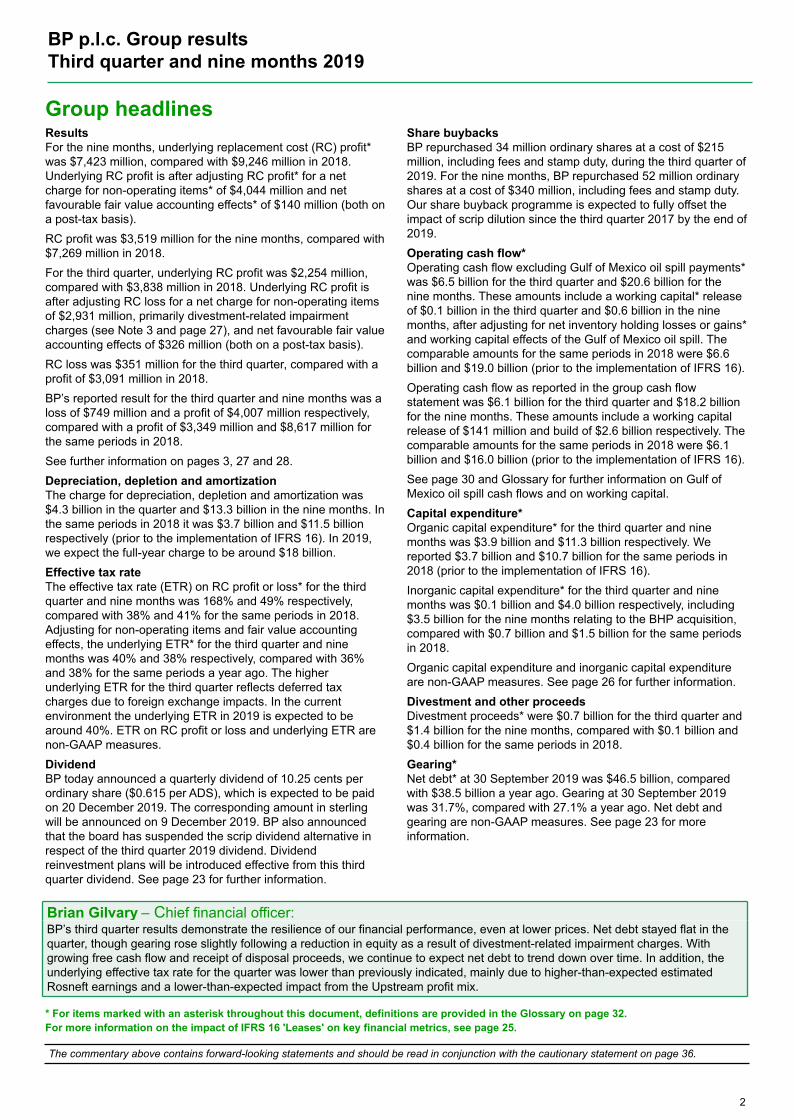
Group headlinesResults For the nine months, underlying replacement cost (RC) profit*was $7,423 million, compared with $9,246 million in 2018.Underlying RC profit is after adjusting RC profit* for a netcharge for non-operating items* of $4,044 million and netfavourable fair value accounting effects* of $140 million (both ona post-tax basis).RC profit was $3,519 million for the nine months, compared with$7,269 million in 2018.For the third quarter, underlying RC profit was $2,254 million,compared with $3,838 million in 2018. Underlying RC profit isafter adjusting RC loss for a net charge for non-operating itemsof $2,931 million, primarily divestment-related impairmentcharges (see Note 3 and page 27), and net favourable fair valueaccounting effects of $326 million (both on a post-tax basis). RC loss was $351 million for the third quarter, compared with aprofit of $3,091 million in 2018.BP’s reported result for the third quarter and nine months was aloss of $749 million and a profit of $4,007 million respectively,compared with a profit of $3,349 million and $8,617 million forthe same periods in 2018. See further information on pages 3, 27 and 28.Depreciation, depletion and amortizationThe charge for depreciation, depletion and amortization was$4.3 billion in the quarter and $13.3 billion in the nine months. Inthe same periods in 2018 it was $3.7 billion and $11.5 billionrespectively (prior to the implementation of IFRS 16). In 2019,we expect the full-year charge to be around $18 billion.
BP p.l.c. Group results Third quarter and nine months 2019
2
Effective tax rateThe effective tax rate (ETR) on RC profit or loss* for the thirdquarter and nine months was 168% and 49% respectively,compared with 38% and 41% for the same periods in 2018.Adjusting for non-operating items and fair value accountingeffects, the underlying ETR* for the third quarter and ninemonths was 40% and 38% respectively, compared with 36%and 38% for the same periods a year ago. The higherunderlying ETR for the third quarter reflects deferred taxcharges due to foreign exchange impacts. In the currentenvironment the underlying ETR in 2019 is expected to bearound 40%. ETR on RC profit or loss and underlying ETR arenon-GAAP measures. DividendBP today announced a quarterly dividend of 10.25 cents perordinary share ($0.615 per ADS), which is expected to be paidon 20 December 2019. The corresponding amount in sterlingwill be announced on 9 December 2019. BP also announcedthat the board has suspended the scrip dividend alternative inrespect of the third quarter 2019 dividend. Dividendreinvestment plans will be introduced effective from this thirdquarter dividend. See page 23 for further information.
Share buybacksBP repurchased 34 million ordinary shares at a cost of $215million, including fees and stamp duty, during the third quarter of2019. For the nine months, BP repurchased 52 million ordinaryshares at a cost of $340 million, including fees and stamp duty.Our share buyback programme is expected to fully offset theimpact of scrip dilution since the third quarter 2017 by the end of2019.Operating cash flow*Operating cash flow excluding Gulf of Mexico oil spill payments*was $6.5 billion for the third quarter and $20.6 billion for thenine months. These amounts include a working capital* releaseof $0.1 billion in the third quarter and $0.6 billion in the ninemonths, after adjusting for net inventory holding losses or gains*and working capital effects of the Gulf of Mexico oil spill. Thecomparable amounts for the same periods in 2018 were $6.6billion and $19.0 billion (prior to the implementation of IFRS 16). Operating cash flow as reported in the group cash flowstatement was $6.1 billion for the third quarter and $18.2 billionfor the nine months. These amounts include a working capitalrelease of $141 million and build of $2.6 billion respectively. Thecomparable amounts for the same periods in 2018 were $6.1billion and $16.0 billion (prior to the implementation of IFRS 16). See page 30 and Glossary for further information on Gulf ofMexico oil spill cash flows and on working capital. Capital expenditure*Organic capital expenditure* for the third quarter and ninemonths was $3.9 billion and $11.3 billion respectively. Wereported $3.7 billion and $10.7 billion for the same periods in2018 (prior to the implementation of IFRS 16). Inorganic capital expenditure* for the third quarter and ninemonths was $0.1 billion and $4.0 billion respectively, including$3.5 billion for the nine months relating to the BHP acquisition,compared with $0.7 billion and $1.5 billion for the same periodsin 2018.Organic capital expenditure and inorganic capital expenditureare non-GAAP measures. See page 26 for further information. Divestment and other proceedsDivestment proceeds* were $0.7 billion for the third quarter and$1.4 billion for the nine months, compared with $0.1 billion and$0.4 billion for the same periods in 2018. Gearing*Net debt* at 30 September 2019 was $46.5 billion, comparedwith $38.5 billion a year ago. Gearing at 30 September 2019was 31.7%, compared with 27.1% a year ago. Net debt andgearing are non-GAAP measures. See page 23 for moreinformation.
Brian Gilvary – Chief financial officer:BP’s third quarter results demonstrate the resilience of our financial performance, even at lower prices. Net debt stayed flat in thequarter, though gearing rose slightly following a reduction in equity as a result of divestment-related impairment charges. Withgrowing free cash flow and receipt of disposal proceeds, we continue to expect net debt to trend down over time. In addition, theunderlying effective tax rate for the quarter was lower than previously indicated, mainly due to higher-than-expected estimatedRosneft earnings and a lower-than-expected impact from the Upstream profit mix.
* For items marked with an asterisk throughout this document, definitions are provided in the Glossary on page 32.For more information on the impact of IFRS 16 'Leases' on key financial metrics, see page 25.
The commentary above contains forward-looking statements and should be read in conjunction with the cautionary statement on page 36.
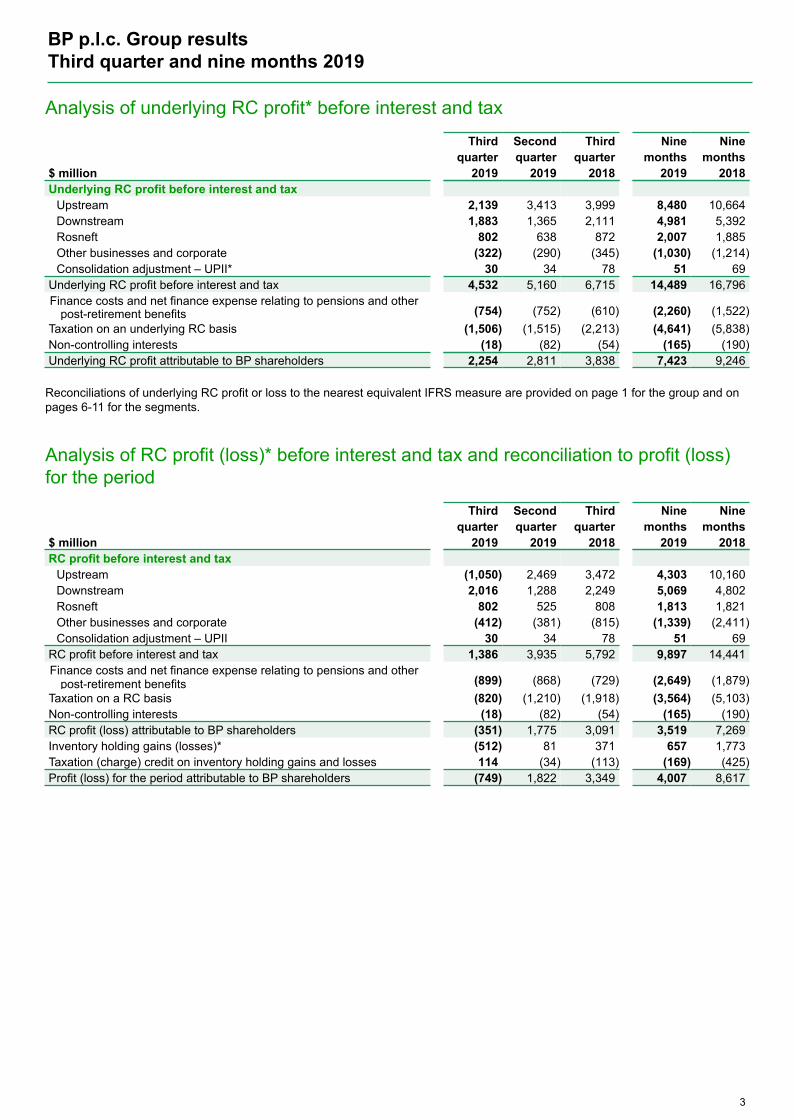
Analysis of underlying RC profit* before interest and tax
Third Second Third Nine Ninequarter quarter quarter months months
$ million 2019 2019 2018 2019 2018Underlying RC profit before interest and tax
Upstream 2,139 3,413 3,999 8,480 10,664Downstream 1,883 1,365 2,111 4,981 5,392Rosneft 802 638 872 2,007 1,885Other businesses and corporate (322) (290) (345) (1,030) (1,214)Consolidation adjustment – UPII* 30 34 78 51 69
Underlying RC profit before interest and tax 4,532 5,160 6,715 14,489 16,796Finance costs and net finance expense relating to pensions and other
post-retirement benefits (754) (752) (610) (2,260) (1,522)Taxation on an underlying RC basis (1,506) (1,515) (2,213) (4,641) (5,838)Non-controlling interests (18) (82) (54) (165) (190)Underlying RC profit attributable to BP shareholders 2,254 2,811 3,838 7,423 9,246
Reconciliations of underlying RC profit or loss to the nearest equivalent IFRS measure are provided on page 1 for the group and onpages 6-11 for the segments.
Analysis of RC profit (loss)* before interest and tax and reconciliation to profit (loss)for the period
Third Second Third Nine Ninequarter quarter quarter months months
$ million 2019 2019 2018 2019 2018RC profit before interest and tax
Upstream (1,050) 2,469 3,472 4,303 10,160Downstream 2,016 1,288 2,249 5,069 4,802Rosneft 802 525 808 1,813 1,821Other businesses and corporate (412) (381) (815) (1,339) (2,411)Consolidation adjustment – UPII 30 34 78 51 69
RC profit before interest and tax 1,386 3,935 5,792 9,897 14,441Finance costs and net finance expense relating to pensions and other
post-retirement benefits (899) (868) (729) (2,649) (1,879)Taxation on a RC basis (820) (1,210) (1,918) (3,564) (5,103)Non-controlling interests (18) (82) (54) (165) (190)RC profit (loss) attributable to BP shareholders (351) 1,775 3,091 3,519 7,269Inventory holding gains (losses)* (512) 81 371 657 1,773Taxation (charge) credit on inventory holding gains and losses 114 (34) (113) (169) (425)Profit (loss) for the period attributable to BP shareholders (749) 1,822 3,349 4,007 8,617
BP p.l.c. Group results Third quarter and nine months 2019
3
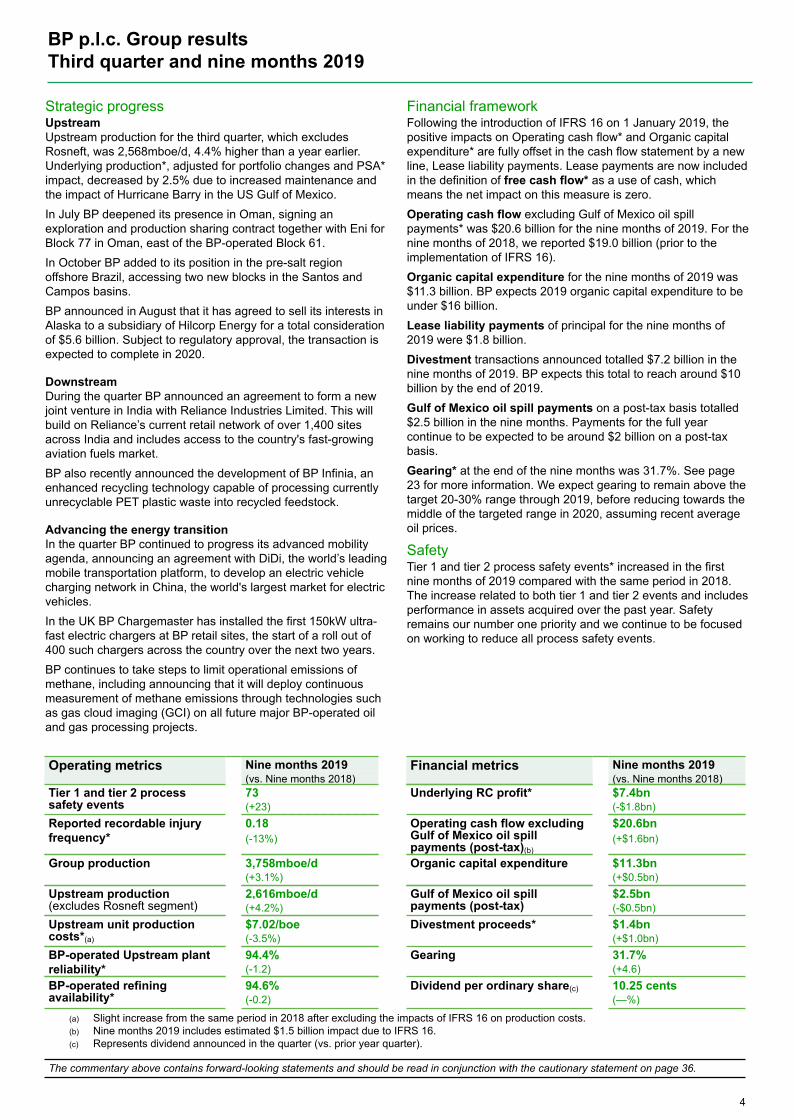
Strategic progressUpstream Upstream production for the third quarter, which excludesRosneft, was 2,568mboe/d, 4.4% higher than a year earlier.Underlying production*, adjusted for portfolio changes and PSA*impact, decreased by 2.5% due to increased maintenance andthe impact of Hurricane Barry in the US Gulf of Mexico. In July BP deepened its presence in Oman, signing anexploration and production sharing contract together with Eni forBlock 77 in Oman, east of the BP-operated Block 61.In October BP added to its position in the pre-salt regionoffshore Brazil, accessing two new blocks in the Santos andCampos basins.BP announced in August that it has agreed to sell its interests inAlaska to a subsidiary of Hilcorp Energy for a total considerationof $5.6 billion. Subject to regulatory approval, the transaction isexpected to complete in 2020.
DownstreamDuring the quarter BP announced an agreement to form a newjoint venture in India with Reliance Industries Limited. This willbuild on Reliance’s current retail network of over 1,400 sitesacross India and includes access to the country's fast-growingaviation fuels market. BP also recently announced the development of BP Infinia, anenhanced recycling technology capable of processing currentlyunrecyclable PET plastic waste into recycled feedstock.
Advancing the energy transitionIn the quarter BP continued to progress its advanced mobilityagenda, announcing an agreement with DiDi, the world’s leadingmobile transportation platform, to develop an electric vehiclecharging network in China, the world's largest market for electricvehicles. In the UK BP Chargemaster has installed the first 150kW ultra-fast electric chargers at BP retail sites, the start of a roll out of400 such chargers across the country over the next two years.BP continues to take steps to limit operational emissions ofmethane, including announcing that it will deploy continuousmeasurement of methane emissions through technologies suchas gas cloud imaging (GCI) on all future major BP-operated oiland gas processing projects.
Financial frameworkFollowing the introduction of IFRS 16 on 1 January 2019, thepositive impacts on Operating cash flow* and Organic capitalexpenditure* are fully offset in the cash flow statement by a newline, Lease liability payments. Lease payments are now includedin the definition of free cash flow* as a use of cash, whichmeans the net impact on this measure is zero.Operating cash flow excluding Gulf of Mexico oil spillpayments* was $20.6 billion for the nine months of 2019. For thenine months of 2018, we reported $19.0 billion (prior to theimplementation of IFRS 16).Organic capital expenditure for the nine months of 2019 was$11.3 billion. BP expects 2019 organic capital expenditure to beunder $16 billion.Lease liability payments of principal for the nine months of2019 were $1.8 billion.Divestment transactions announced totalled $7.2 billion in thenine months of 2019. BP expects this total to reach around $10billion by the end of 2019.Gulf of Mexico oil spill payments on a post-tax basis totalled$2.5 billion in the nine months. Payments for the full yearcontinue to be expected to be around $2 billion on a post-taxbasis.Gearing* at the end of the nine months was 31.7%. See page23 for more information. We expect gearing to remain above thetarget 20-30% range through 2019, before reducing towards themiddle of the targeted range in 2020, assuming recent averageoil prices.
Safety Tier 1 and tier 2 process safety events* increased in the firstnine months of 2019 compared with the same period in 2018.The increase related to both tier 1 and tier 2 events and includesperformance in assets acquired over the past year. Safetyremains our number one priority and we continue to be focusedon working to reduce all process safety events.
Operating metrics Nine months 2019 Financial metrics Nine months 2019(vs. Nine months 2018) (vs. Nine months 2018)
Tier 1 and tier 2 processsafety events
73 Underlying RC profit* $7.4bn(+23) (-$1.8bn)
Reported recordable injuryfrequency*
0.18 Operating cash flow excludingGulf of Mexico oil spillpayments (post-tax)(b)
$20.6bn(-13%) (+$1.6bn)
Group production 3,758mboe/d Organic capital expenditure $11.3bn(+3.1%) (+$0.5bn)
Upstream production(excludes Rosneft segment)
2,616mboe/d Gulf of Mexico oil spillpayments (post-tax)
$2.5bn(+4.2%) (-$0.5bn)
Upstream unit productioncosts*(a)
$7.02/boe Divestment proceeds* $1.4bn(-3.5%) (+$1.0bn)
BP-operated Upstream plantreliability*
94.4% Gearing 31.7%(-1.2) (+4.6)
BP-operated refiningavailability*
94.6% Dividend per ordinary share(c) 10.25 cents(-0.2) (—%)
(a) Slight increase from the same period in 2018 after excluding the impacts of IFRS 16 on production costs.(b) Nine months 2019 includes estimated $1.5 billion impact due to IFRS 16.(c) Represents dividend announced in the quarter (vs. prior year quarter).
The commentary above contains forward-looking statements and should be read in conjunction with the cautionary statement on page 36.
BP p.l.c. Group results Third quarter and nine months 2019
4
This page is intentionally left blank
BP p.l.c. Group results Third quarter and nine months 2019
5
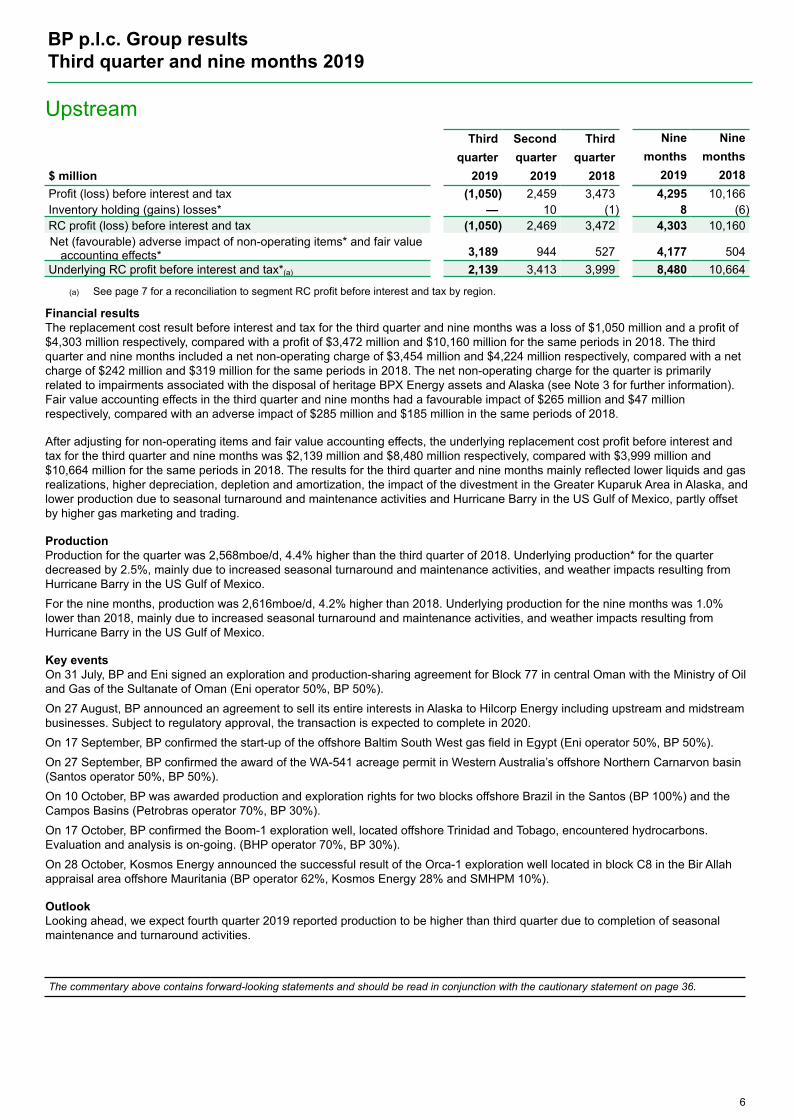
UpstreamThird Second Third Nine Nine
quarter quarter quarter months months$ million 2019 2019 2018 2019 2018Profit (loss) before interest and tax (1,050) 2,459 3,473 4,295 10,166Inventory holding (gains) losses* — 10 (1) 8 (6)RC profit (loss) before interest and tax (1,050) 2,469 3,472 4,303 10,160Net (favourable) adverse impact of non-operating items* and fair value
accounting effects* 3,189 944 527 4,177 504Underlying RC profit before interest and tax*(a) 2,139 3,413 3,999 8,480 10,664
(a) See page 7 for a reconciliation to segment RC profit before interest and tax by region.
Financial resultsThe replacement cost result before interest and tax for the third quarter and nine months was a loss of $1,050 million and a profit of$4,303 million respectively, compared with a profit of $3,472 million and $10,160 million for the same periods in 2018. The thirdquarter and nine months included a net non-operating charge of $3,454 million and $4,224 million respectively, compared with a netcharge of $242 million and $319 million for the same periods in 2018. The net non-operating charge for the quarter is primarilyrelated to impairments associated with the disposal of heritage BPX Energy assets and Alaska (see Note 3 for further information).Fair value accounting effects in the third quarter and nine months had a favourable impact of $265 million and $47 millionrespectively, compared with an adverse impact of $285 million and $185 million in the same periods of 2018.
After adjusting for non-operating items and fair value accounting effects, the underlying replacement cost profit before interest andtax for the third quarter and nine months was $2,139 million and $8,480 million respectively, compared with $3,999 million and$10,664 million for the same periods in 2018. The results for the third quarter and nine months mainly reflected lower liquids and gasrealizations, higher depreciation, depletion and amortization, the impact of the divestment in the Greater Kuparuk Area in Alaska, andlower production due to seasonal turnaround and maintenance activities and Hurricane Barry in the US Gulf of Mexico, partly offsetby higher gas marketing and trading.
ProductionProduction for the quarter was 2,568mboe/d, 4.4% higher than the third quarter of 2018. Underlying production* for the quarterdecreased by 2.5%, mainly due to increased seasonal turnaround and maintenance activities, and weather impacts resulting fromHurricane Barry in the US Gulf of Mexico. For the nine months, production was 2,616mboe/d, 4.2% higher than 2018. Underlying production for the nine months was 1.0%lower than 2018, mainly due to increased seasonal turnaround and maintenance activities, and weather impacts resulting fromHurricane Barry in the US Gulf of Mexico.
Key eventsOn 31 July, BP and Eni signed an exploration and production-sharing agreement for Block 77 in central Oman with the Ministry of Oiland Gas of the Sultanate of Oman (Eni operator 50%, BP 50%).On 27 August, BP announced an agreement to sell its entire interests in Alaska to Hilcorp Energy including upstream and midstreambusinesses. Subject to regulatory approval, the transaction is expected to complete in 2020.On 17 September, BP confirmed the start-up of the offshore Baltim South West gas field in Egypt (Eni operator 50%, BP 50%).On 27 September, BP confirmed the award of the WA-541 acreage permit in Western Australia’s offshore Northern Carnarvon basin(Santos operator 50%, BP 50%).On 10 October, BP was awarded production and exploration rights for two blocks offshore Brazil in the Santos (BP 100%) and theCampos Basins (Petrobras operator 70%, BP 30%).On 17 October, BP confirmed the Boom-1 exploration well, located offshore Trinidad and Tobago, encountered hydrocarbons.Evaluation and analysis is on-going. (BHP operator 70%, BP 30%).On 28 October, Kosmos Energy announced the successful result of the Orca-1 exploration well located in block C8 in the Bir Allahappraisal area offshore Mauritania (BP operator 62%, Kosmos Energy 28% and SMHPM 10%).
OutlookLooking ahead, we expect fourth quarter 2019 reported production to be higher than third quarter due to completion of seasonalmaintenance and turnaround activities.
The commentary above contains forward-looking statements and should be read in conjunction with the cautionary statement on page 36.
BP p.l.c. Group results Third quarter and nine months 2019
6
Upstream (continued)
Third Second Third Nine Ninequarter quarter quarter months months
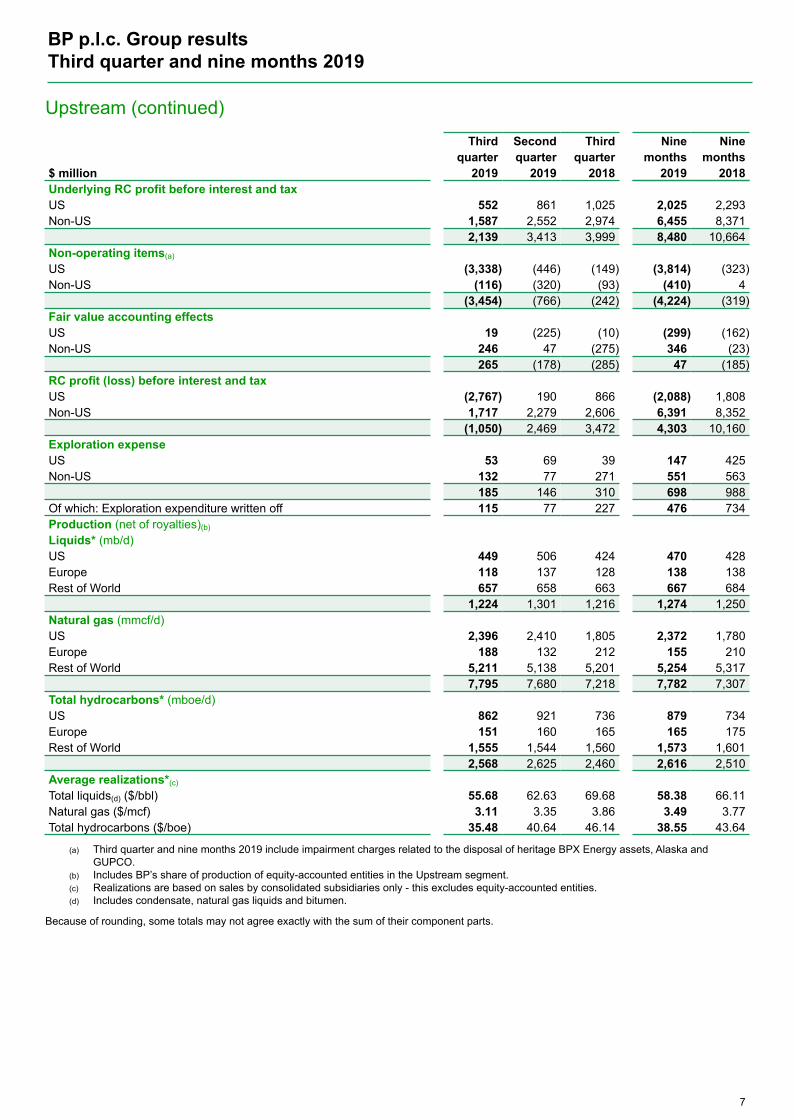
$ million 2019 2019 2018 2019 2018Underlying RC profit before interest and taxUS 552 861 1,025 2,025 2,293Non-US 1,587 2,552 2,974 6,455 8,371
2,139 3,413 3,999 8,480 10,664Non-operating items(a)
US (3,338) (446) (149) (3,814) (323)Non-US (116) (320) (93) (410) 4
(3,454) (766) (242) (4,224) (319)Fair value accounting effectsUS 19 (225) (10) (299) (162)Non-US 246 47 (275) 346 (23)
265 (178) (285) 47 (185)RC profit (loss) before interest and taxUS (2,767) 190 866 (2,088) 1,808Non-US 1,717 2,279 2,606 6,391 8,352
(1,050) 2,469 3,472 4,303 10,160Exploration expenseUS 53 69 39 147 425Non-US 132 77 271 551 563
185 146 310 698 988Of which: Exploration expenditure written off 115 77 227 476 734Production (net of royalties)(b)
Liquids* (mb/d)US 449 506 424 470 428Europe 118 137 128 138 138Rest of World 657 658 663 667 684
1,224 1,301 1,216 1,274 1,250Natural gas (mmcf/d)US 2,396 2,410 1,805 2,372 1,780Europe 188 132 212 155 210Rest of World 5,211 5,138 5,201 5,254 5,317
7,795 7,680 7,218 7,782 7,307Total hydrocarbons* (mboe/d)US 862 921 736 879 734Europe 151 160 165 165 175Rest of World 1,555 1,544 1,560 1,573 1,601
2,568 2,625 2,460 2,616 2,510Average realizations*(c)
Total liquids(d) ($/bbl) 55.68 62.63 69.68 58.38 66.11Natural gas ($/mcf) 3.11 3.35 3.86 3.49 3.77Total hydrocarbons ($/boe) 35.48 40.64 46.14 38.55 43.64
(a) Third quarter and nine months 2019 include impairment charges related to the disposal of heritage BPX Energy assets, Alaska andGUPCO.
(b) Includes BP’s share of production of equity-accounted entities in the Upstream segment.(c) Realizations are based on sales by consolidated subsidiaries only - this excludes equity-accounted entities.(d) Includes condensate, natural gas liquids and bitumen.
Because of rounding, some totals may not agree exactly with the sum of their component parts.
BP p.l.c. Group results Third quarter and nine months 2019
7
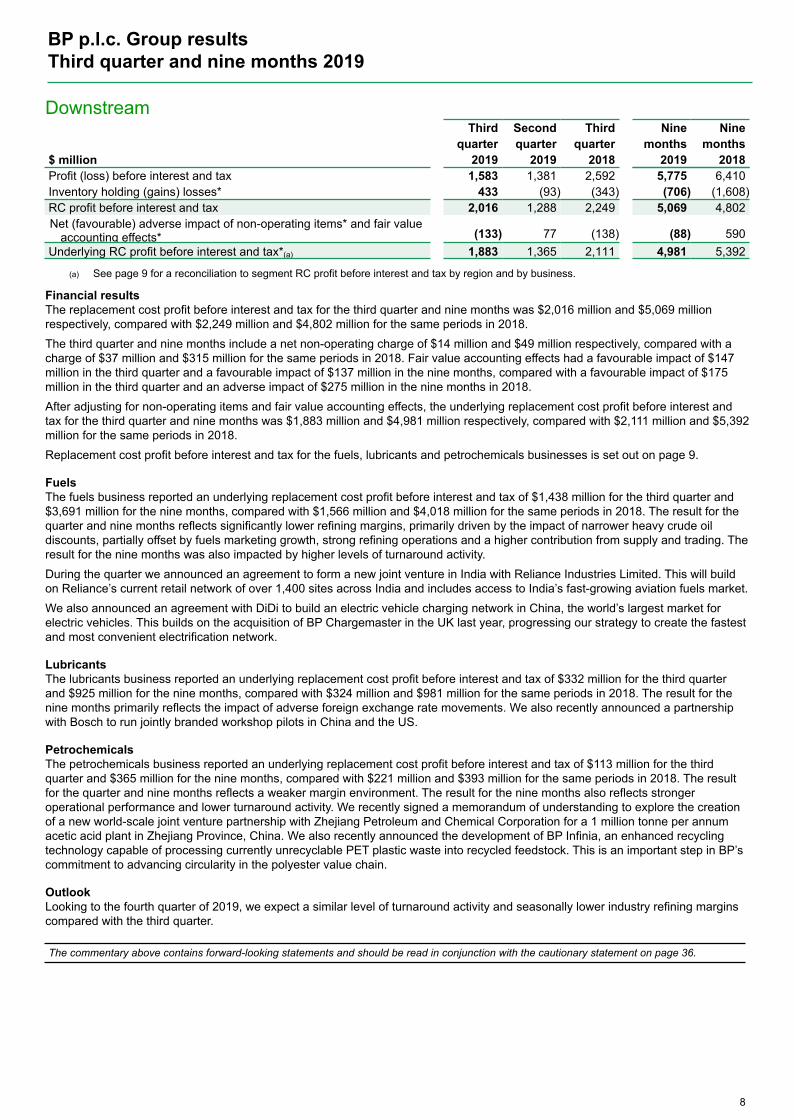
DownstreamThird Second Third Nine Nine
quarter quarter quarter months months$ million 2019 2019 2018 2019 2018Profit (loss) before interest and tax 1,583 1,381 2,592 5,775 6,410Inventory holding (gains) losses* 433 (93) (343) (706) (1,608)RC profit before interest and tax 2,016 1,288 2,249 5,069 4,802Net (favourable) adverse impact of non-operating items* and fair value
accounting effects* (133) 77 (138) (88) 590Underlying RC profit before interest and tax*(a) 1,883 1,365 2,111 4,981 5,392
(a) See page 9 for a reconciliation to segment RC profit before interest and tax by region and by business.
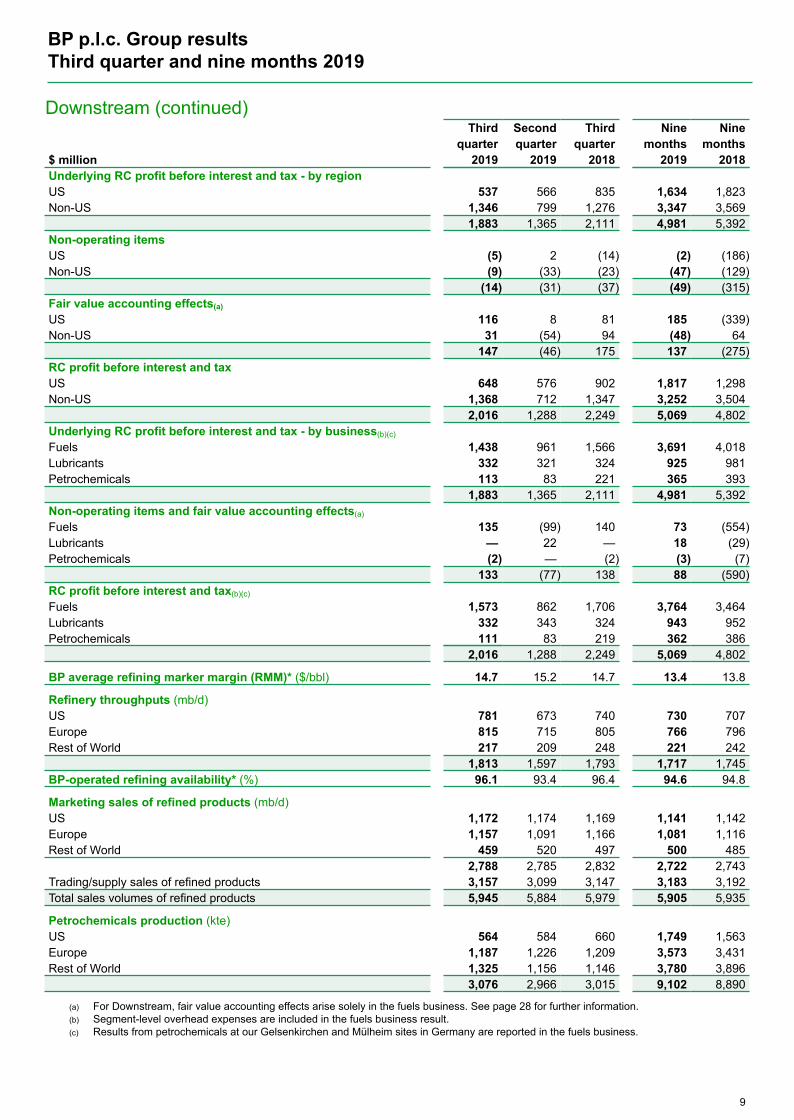
Financial resultsThe replacement cost profit before interest and tax for the third quarter and nine months was $2,016 million and $5,069 millionrespectively, compared with $2,249 million and $4,802 million for the same periods in 2018. The third quarter and nine months include a net non-operating charge of $14 million and $49 million respectively, compared with acharge of $37 million and $315 million for the same periods in 2018. Fair value accounting effects had a favourable impact of $147million in the third quarter and a favourable impact of $137 million in the nine months, compared with a favourable impact of $175million in the third quarter and an adverse impact of $275 million in the nine months in 2018.After adjusting for non-operating items and fair value accounting effects, the underlying replacement cost profit before interest andtax for the third quarter and nine months was $1,883 million and $4,981 million respectively, compared with $2,111 million and $5,392million for the same periods in 2018. Replacement cost profit before interest and tax for the fuels, lubricants and petrochemicals businesses is set out on page 9.
FuelsThe fuels business reported an underlying replacement cost profit before interest and tax of $1,438 million for the third quarter and$3,691 million for the nine months, compared with $1,566 million and $4,018 million for the same periods in 2018. The result for thequarter and nine months reflects significantly lower refining margins, primarily driven by the impact of narrower heavy crude oildiscounts, partially offset by fuels marketing growth, strong refining operations and a higher contribution from supply and trading. Theresult for the nine months was also impacted by higher levels of turnaround activity.During the quarter we announced an agreement to form a new joint venture in India with Reliance Industries Limited. This will buildon Reliance’s current retail network of over 1,400 sites across India and includes access to India’s fast-growing aviation fuels market. We also announced an agreement with DiDi to build an electric vehicle charging network in China, the world’s largest market forelectric vehicles. This builds on the acquisition of BP Chargemaster in the UK last year, progressing our strategy to create the fastestand most convenient electrification network.
LubricantsThe lubricants business reported an underlying replacement cost profit before interest and tax of $332 million for the third quarterand $925 million for the nine months, compared with $324 million and $981 million for the same periods in 2018. The result for thenine months primarily reflects the impact of adverse foreign exchange rate movements. We also recently announced a partnershipwith Bosch to run jointly branded workshop pilots in China and the US.
PetrochemicalsThe petrochemicals business reported an underlying replacement cost profit before interest and tax of $113 million for the thirdquarter and $365 million for the nine months, compared with $221 million and $393 million for the same periods in 2018. The resultfor the quarter and nine months reflects a weaker margin environment. The result for the nine months also reflects strongeroperational performance and lower turnaround activity. We recently signed a memorandum of understanding to explore the creationof a new world-scale joint venture partnership with Zhejiang Petroleum and Chemical Corporation for a 1 million tonne per annumacetic acid plant in Zhejiang Province, China. We also recently announced the development of BP Infinia, an enhanced recyclingtechnology capable of processing currently unrecyclable PET plastic waste into recycled feedstock. This is an important step in BP’scommitment to advancing circularity in the polyester value chain.
OutlookLooking to the fourth quarter of 2019, we expect a similar level of turnaround activity and seasonally lower industry refining marginscompared with the third quarter.
The commentary above contains forward-looking statements and should be read in conjunction with the cautionary statement on page 36.
BP p.l.c. Group results Third quarter and nine months 2019
8
Downstream (continued)Third Second Third Nine Nine
quarter quarter quarter months months$ million 2019 2019 2018 2019 2018Underlying RC profit before interest and tax - by regionUS 537 566 835 1,634 1,823Non-US 1,346 799 1,276 3,347 3,569
1,883 1,365 2,111 4,981 5,392Non-operating itemsUS (5) 2 (14) (2) (186)Non-US (9) (33) (23) (47) (129)
(14) (31) (37) (49) (315)Fair value accounting effects(a)
US 116 8 81 185 (339)Non-US 31 (54) 94 (48) 64
147 (46) 175 137 (275)RC profit before interest and taxUS 648 576 902 1,817 1,298Non-US 1,368 712 1,347 3,252 3,504
2,016 1,288 2,249 5,069 4,802Underlying RC profit before interest and tax - by business(b)(c)
Fuels 1,438 961 1,566 3,691 4,018Lubricants 332 321 324 925 981Petrochemicals 113 83 221 365 393
1,883 1,365 2,111 4,981 5,392Non-operating items and fair value accounting effects(a)
Fuels 135 (99) 140 73 (554)Lubricants — 22 — 18 (29)Petrochemicals (2) — (2) (3) (7)
133 (77) 138 88 (590)RC profit before interest and tax(b)(c)
Fuels 1,573 862 1,706 3,764 3,464Lubricants 332 343 324 943 952Petrochemicals 111 83 219 362 386
2,016 1,288 2,249 5,069 4,802
BP average refining marker margin (RMM)* ($/bbl) 14.7 15.2 14.7 13.4 13.8
Refinery throughputs (mb/d)US 781 673 740 730 707Europe 815 715 805 766 796Rest of World 217 209 248 221 242
1,813 1,597 1,793 1,717 1,745BP-operated refining availability* (%) 96.1 93.4 96.4 94.6 94.8
Marketing sales of refined products (mb/d)US 1,172 1,174 1,169 1,141 1,142Europe 1,157 1,091 1,166 1,081 1,116Rest of World 459 520 497 500 485
2,788 2,785 2,832 2,722 2,743Trading/supply sales of refined products 3,157 3,099 3,147 3,183 3,192Total sales volumes of refined products 5,945 5,884 5,979 5,905 5,935
Petrochemicals production (kte)US 564 584 660 1,749 1,563Europe 1,187 1,226 1,209 3,573 3,431Rest of World 1,325 1,156 1,146 3,780 3,896
3,076 2,966 3,015 9,102 8,890
(a) For Downstream, fair value accounting effects arise solely in the fuels business. See page 28 for further information.(b) Segment-level overhead expenses are included in the fuels business result.(c) Results from petrochemicals at our Gelsenkirchen and Mülheim sites in Germany are reported in the fuels business.
BP p.l.c. Group results Third quarter and nine months 2019
9
Rosneft
Third Second Third Nine Ninequarter quarter quarter months months
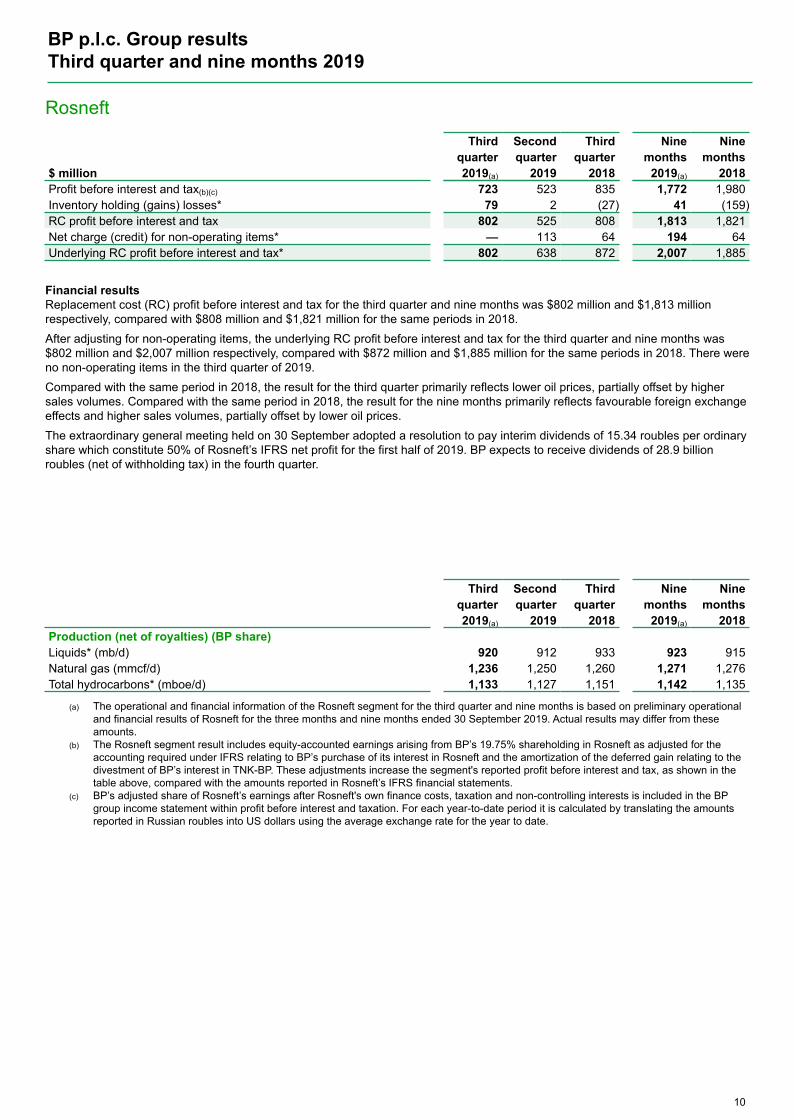
$ million 2019(a) 2019 2018 2019(a) 2018Profit before interest and tax(b)(c) 723 523 835 1,772 1,980Inventory holding (gains) losses* 79 2 (27) 41 (159)RC profit before interest and tax 802 525 808 1,813 1,821Net charge (credit) for non-operating items* — 113 64 194 64Underlying RC profit before interest and tax* 802 638 872 2,007 1,885
Financial resultsReplacement cost (RC) profit before interest and tax for the third quarter and nine months was $802 million and $1,813 millionrespectively, compared with $808 million and $1,821 million for the same periods in 2018. After adjusting for non-operating items, the underlying RC profit before interest and tax for the third quarter and nine months was$802 million and $2,007 million respectively, compared with $872 million and $1,885 million for the same periods in 2018. There wereno non-operating items in the third quarter of 2019.Compared with the same period in 2018, the result for the third quarter primarily reflects lower oil prices, partially offset by highersales volumes. Compared with the same period in 2018, the result for the nine months primarily reflects favourable foreign exchangeeffects and higher sales volumes, partially offset by lower oil prices.The extraordinary general meeting held on 30 September adopted a resolution to pay interim dividends of 15.34 roubles per ordinaryshare which constitute 50% of Rosneft’s IFRS net profit for the first half of 2019. BP expects to receive dividends of 28.9 billionroubles (net of withholding tax) in the fourth quarter.
Third Second Third Nine Ninequarter quarter quarter months months2019(a) 2019 2018 2019(a) 2018
Production (net of royalties) (BP share)Liquids* (mb/d) 920 912 933 923 915Natural gas (mmcf/d) 1,236 1,250 1,260 1,271 1,276Total hydrocarbons* (mboe/d) 1,133 1,127 1,151 1,142 1,135
(a) The operational and financial information of the Rosneft segment for the third quarter and nine months is based on preliminary operationaland financial results of Rosneft for the three months and nine months ended 30 September 2019. Actual results may differ from theseamounts.
(b) The Rosneft segment result includes equity-accounted earnings arising from BP’s 19.75% shareholding in Rosneft as adjusted for theaccounting required under IFRS relating to BP’s purchase of its interest in Rosneft and the amortization of the deferred gain relating to thedivestment of BP’s interest in TNK-BP. These adjustments increase the segment's reported profit before interest and tax, as shown in thetable above, compared with the amounts reported in Rosneft’s IFRS financial statements.
(c) BP’s adjusted share of Rosneft’s earnings after Rosneft's own finance costs, taxation and non-controlling interests is included in the BPgroup income statement within profit before interest and taxation. For each year-to-date period it is calculated by translating the amountsreported in Russian roubles into US dollars using the average exchange rate for the year to date.
BP p.l.c. Group results Third quarter and nine months 2019
10
Other businesses and corporateThird Second Third Nine Nine
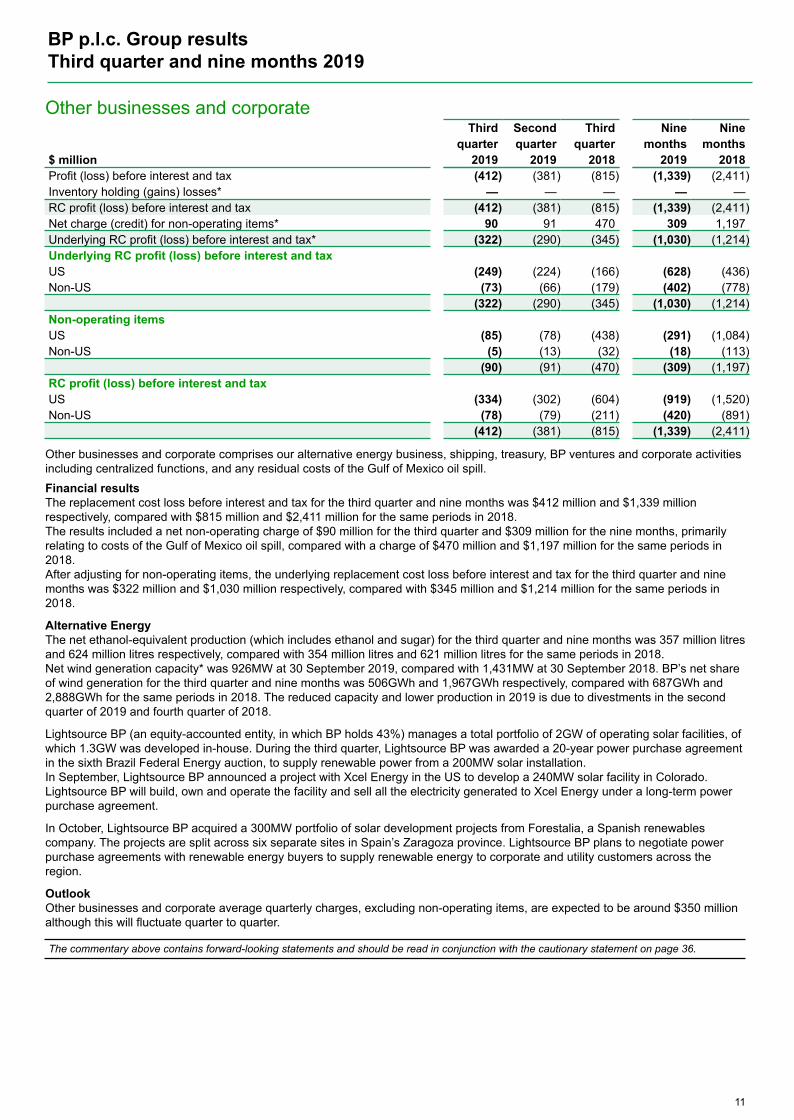
quarter quarter quarter months months$ million 2019 2019 2018 2019 2018Profit (loss) before interest and tax (412) (381) (815) (1,339) (2,411)Inventory holding (gains) losses* — — — — —RC profit (loss) before interest and tax (412) (381) (815) (1,339) (2,411)Net charge (credit) for non-operating items* 90 91 470 309 1,197Underlying RC profit (loss) before interest and tax* (322) (290) (345) (1,030) (1,214)Underlying RC profit (loss) before interest and taxUS (249) (224) (166) (628) (436)Non-US (73) (66) (179) (402) (778)
(322) (290) (345) (1,030) (1,214)Non-operating itemsUS (85) (78) (438) (291) (1,084)Non-US (5) (13) (32) (18) (113)
(90) (91) (470) (309) (1,197)RC profit (loss) before interest and taxUS (334) (302) (604) (919) (1,520)Non-US (78) (79) (211) (420) (891)
(412) (381) (815) (1,339) (2,411)
Other businesses and corporate comprises our alternative energy business, shipping, treasury, BP ventures and corporate activitiesincluding centralized functions, and any residual costs of the Gulf of Mexico oil spill.Financial resultsThe replacement cost loss before interest and tax for the third quarter and nine months was $412 million and $1,339 millionrespectively, compared with $815 million and $2,411 million for the same periods in 2018. The results included a net non-operating charge of $90 million for the third quarter and $309 million for the nine months, primarilyrelating to costs of the Gulf of Mexico oil spill, compared with a charge of $470 million and $1,197 million for the same periods in2018.After adjusting for non-operating items, the underlying replacement cost loss before interest and tax for the third quarter and ninemonths was $322 million and $1,030 million respectively, compared with $345 million and $1,214 million for the same periods in2018.
Alternative EnergyThe net ethanol-equivalent production (which includes ethanol and sugar) for the third quarter and nine months was 357 million litresand 624 million litres respectively, compared with 354 million litres and 621 million litres for the same periods in 2018.Net wind generation capacity* was 926MW at 30 September 2019, compared with 1,431MW at 30 September 2018. BP’s net shareof wind generation for the third quarter and nine months was 506GWh and 1,967GWh respectively, compared with 687GWh and2,888GWh for the same periods in 2018. The reduced capacity and lower production in 2019 is due to divestments in the secondquarter of 2019 and fourth quarter of 2018.
Lightsource BP (an equity-accounted entity, in which BP holds 43%) manages a total portfolio of 2GW of operating solar facilities, ofwhich 1.3GW was developed in-house. During the third quarter, Lightsource BP was awarded a 20-year power purchase agreementin the sixth Brazil Federal Energy auction, to supply renewable power from a 200MW solar installation.In September, Lightsource BP announced a project with Xcel Energy in the US to develop a 240MW solar facility in Colorado.Lightsource BP will build, own and operate the facility and sell all the electricity generated to Xcel Energy under a long-term powerpurchase agreement.
In October, Lightsource BP acquired a 300MW portfolio of solar development projects from Forestalia, a Spanish renewablescompany. The projects are split across six separate sites in Spain’s Zaragoza province. Lightsource BP plans to negotiate powerpurchase agreements with renewable energy buyers to supply renewable energy to corporate and utility customers across theregion.
OutlookOther businesses and corporate average quarterly charges, excluding non-operating items, are expected to be around $350 millionalthough this will fluctuate quarter to quarter.
The commentary above contains forward-looking statements and should be read in conjunction with the cautionary statement on page 36.
BP p.l.c. Group results Third quarter and nine months 2019
11
Financial statements
BP p.l.c. Group results Third quarter and nine months 2019
12
Group income statement
Third Second Third Nine Ninequarter quarter quarter months months
$ million 2019 2019 2018 2019 2018
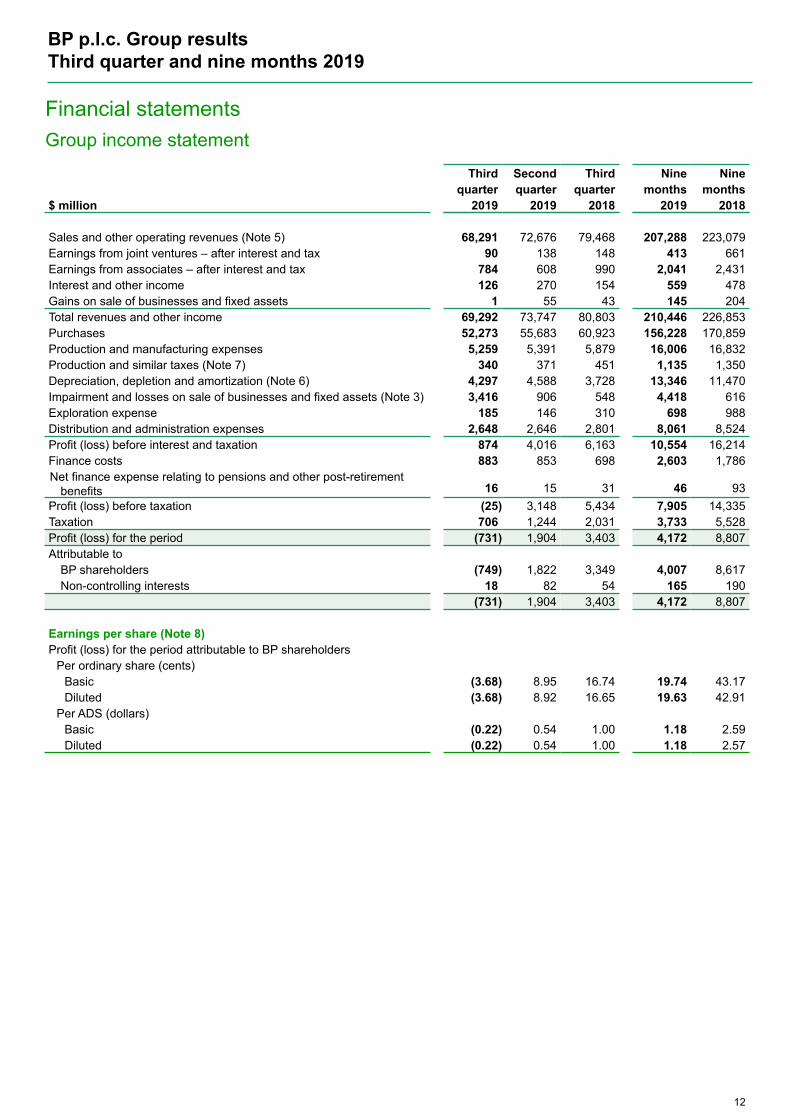
Sales and other operating revenues (Note 5) 68,291 72,676 79,468 207,288 223,079Earnings from joint ventures – after interest and tax 90 138 148 413 661Earnings from associates – after interest and tax 784 608 990 2,041 2,431Interest and other income 126 270 154 559 478Gains on sale of businesses and fixed assets 1 55 43 145 204Total revenues and other income 69,292 73,747 80,803 210,446 226,853Purchases 52,273 55,683 60,923 156,228 170,859Production and manufacturing expenses 5,259 5,391 5,879 16,006 16,832Production and similar taxes (Note 7) 340 371 451 1,135 1,350Depreciation, depletion and amortization (Note 6) 4,297 4,588 3,728 13,346 11,470Impairment and losses on sale of businesses and fixed assets (Note 3) 3,416 906 548 4,418 616Exploration expense 185 146 310 698 988Distribution and administration expenses 2,648 2,646 2,801 8,061 8,524Profit (loss) before interest and taxation 874 4,016 6,163 10,554 16,214Finance costs 883 853 698 2,603 1,786Net finance expense relating to pensions and other post-retirement
benefits 16 15 31 46 93Profit (loss) before taxation (25) 3,148 5,434 7,905 14,335Taxation 706 1,244 2,031 3,733 5,528Profit (loss) for the period (731) 1,904 3,403 4,172 8,807Attributable to
BP shareholders (749) 1,822 3,349 4,007 8,617Non-controlling interests 18 82 54 165 190
(731) 1,904 3,403 4,172 8,807
Earnings per share (Note 8)Profit (loss) for the period attributable to BP shareholders
Per ordinary share (cents)Basic (3.68) 8.95 16.74 19.74 43.17Diluted (3.68) 8.92 16.65 19.63 42.91
Per ADS (dollars)Basic (0.22) 0.54 1.00 1.18 2.59Diluted (0.22) 0.54 1.00 1.18 2.57
Condensed group statement of comprehensive income
Third Second Third Nine Ninequarter quarter quarter months months
$ million 2019 2019 2018 2019 2018
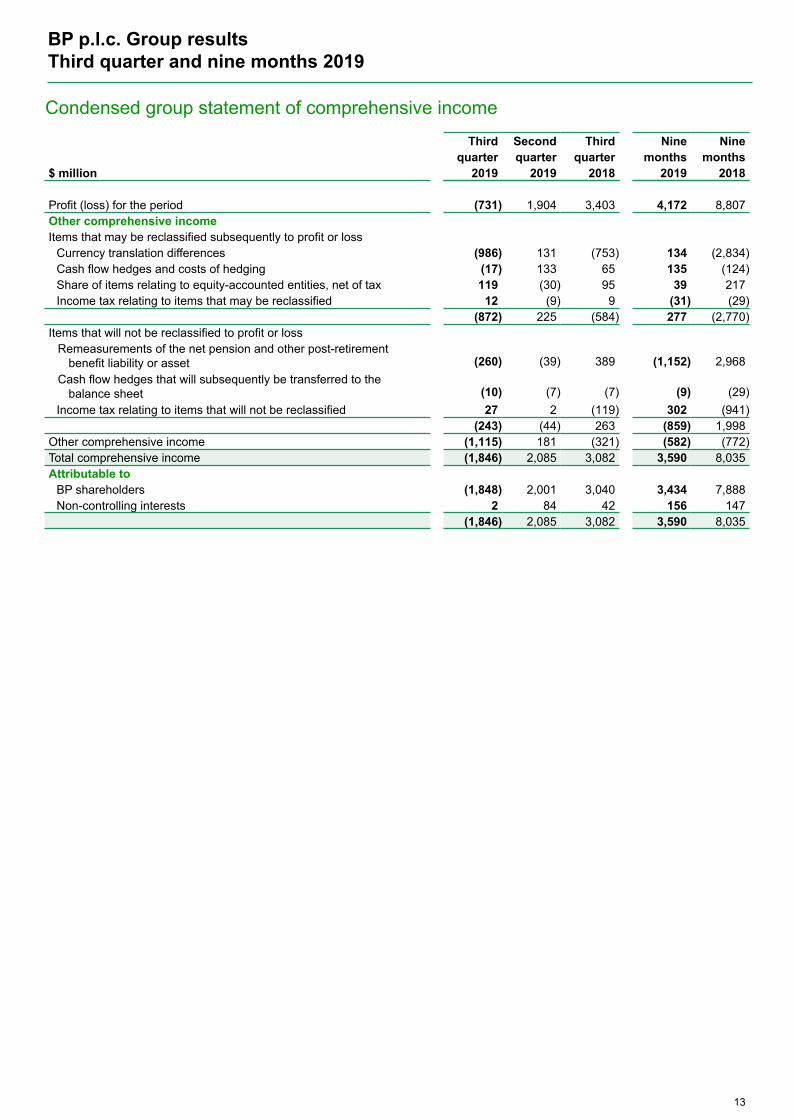
Profit (loss) for the period (731) 1,904 3,403 4,172 8,807Other comprehensive incomeItems that may be reclassified subsequently to profit or loss
Currency translation differences (986) 131 (753) 134 (2,834)Cash flow hedges and costs of hedging (17) 133 65 135 (124)Share of items relating to equity-accounted entities, net of tax 119 (30) 95 39 217Income tax relating to items that may be reclassified 12 (9) 9 (31) (29)
(872) 225 (584) 277 (2,770)Items that will not be reclassified to profit or loss
Remeasurements of the net pension and other post-retirementbenefit liability or asset (260) (39) 389 (1,152) 2,968
Cash flow hedges that will subsequently be transferred to thebalance sheet (10) (7) (7) (9) (29)
Income tax relating to items that will not be reclassified 27 2 (119) 302 (941)(243) (44) 263 (859) 1,998
Other comprehensive income (1,115) 181 (321) (582) (772)Total comprehensive income (1,846) 2,085 3,082 3,590 8,035Attributable to
BP shareholders (1,848) 2,001 3,040 3,434 7,888Non-controlling interests 2 84 42 156 147
(1,846) 2,085 3,082 3,590 8,035
BP p.l.c. Group results Third quarter and nine months 2019
13
Condensed group statement of changes in equity
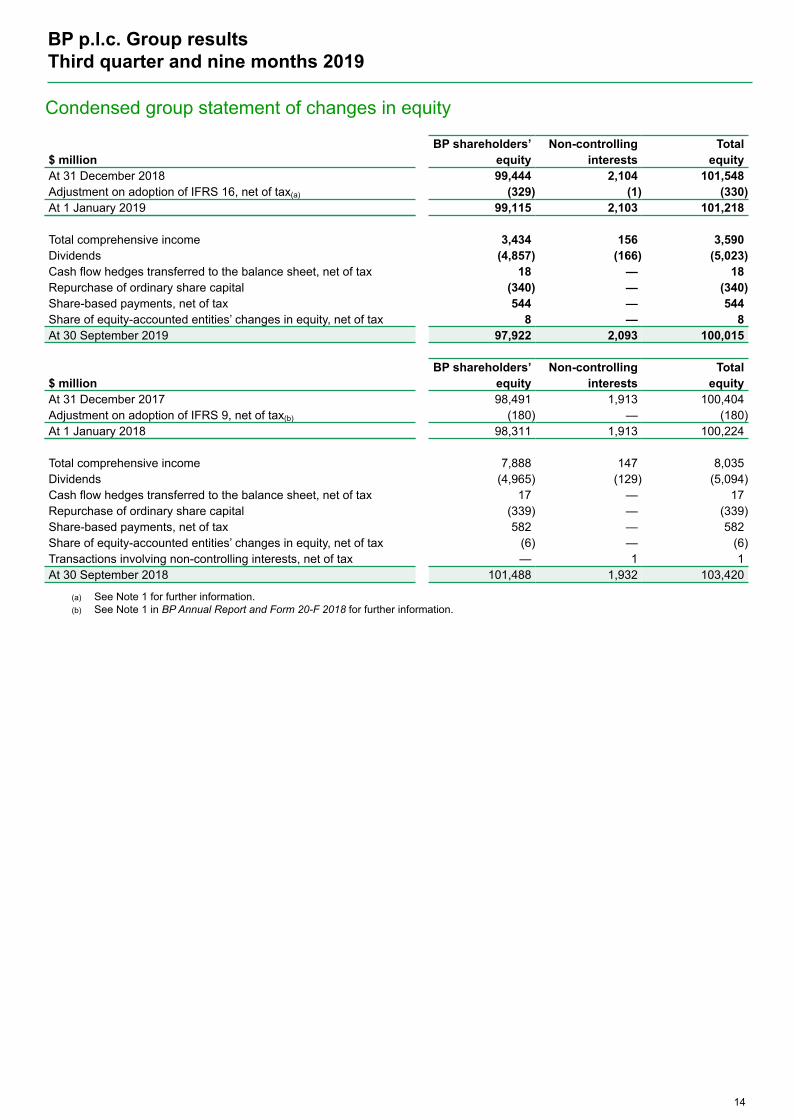
BP shareholders’ Non-controlling Total$ million equity interests equityAt 31 December 2018 99,444 2,104 101,548Adjustment on adoption of IFRS 16, net of tax(a) (329) (1) (330)At 1 January 2019 99,115 2,103 101,218
Total comprehensive income 3,434 156 3,590Dividends (4,857) (166) (5,023)Cash flow hedges transferred to the balance sheet, net of tax 18 — 18Repurchase of ordinary share capital (340) — (340)Share-based payments, net of tax 544 — 544Share of equity-accounted entities’ changes in equity, net of tax 8 — 8At 30 September 2019 97,922 2,093 100,015
BP shareholders’ Non-controlling Total$ million equity interests equityAt 31 December 2017 98,491 1,913 100,404Adjustment on adoption of IFRS 9, net of tax(b) (180) — (180)At 1 January 2018 98,311 1,913 100,224
Total comprehensive income 7,888 147 8,035Dividends (4,965) (129) (5,094)Cash flow hedges transferred to the balance sheet, net of tax 17 — 17Repurchase of ordinary share capital (339) — (339)Share-based payments, net of tax 582 — 582Share of equity-accounted entities’ changes in equity, net of tax (6) — (6)Transactions involving non-controlling interests, net of tax — 1 1At 30 September 2018 101,488 1,932 103,420
(a) See Note 1 for further information.(b) See Note 1 in BP Annual Report and Form 20-F 2018 for further information.
BP p.l.c. Group results Third quarter and nine months 2019
14
Group balance sheet
30 September 31 December$ million 2019 2018(a)
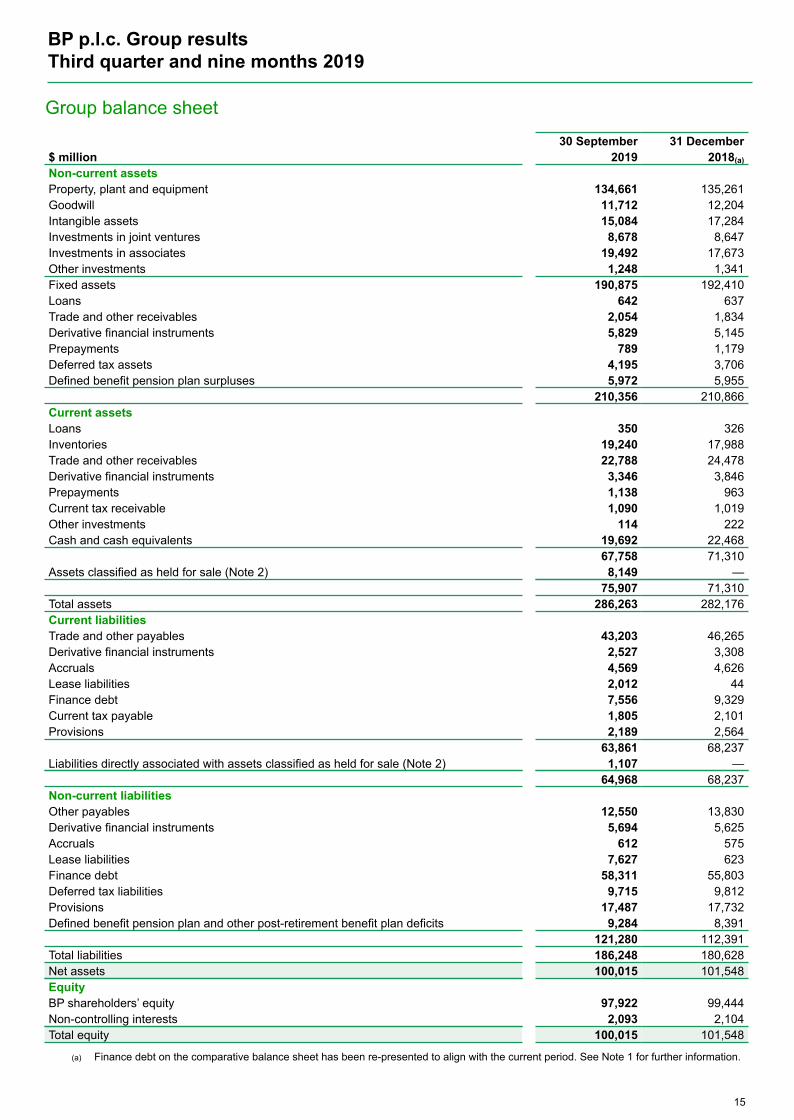
Non-current assetsProperty, plant and equipment 134,661 135,261Goodwill 11,712 12,204Intangible assets 15,084 17,284Investments in joint ventures 8,678 8,647Investments in associates 19,492 17,673Other investments 1,248 1,341Fixed assets 190,875 192,410Loans 642 637Trade and other receivables 2,054 1,834Derivative financial instruments 5,829 5,145Prepayments 789 1,179Deferred tax assets 4,195 3,706Defined benefit pension plan surpluses 5,972 5,955
210,356 210,866Current assetsLoans 350 326Inventories 19,240 17,988Trade and other receivables 22,788 24,478Derivative financial instruments 3,346 3,846Prepayments 1,138 963Current tax receivable 1,090 1,019Other investments 114 222Cash and cash equivalents 19,692 22,468
67,758 71,310Assets classified as held for sale (Note 2) 8,149 —
75,907 71,310Total assets 286,263 282,176Current liabilitiesTrade and other payables 43,203 46,265Derivative financial instruments 2,527 3,308Accruals 4,569 4,626Lease liabilities 2,012 44Finance debt 7,556 9,329Current tax payable 1,805 2,101Provisions 2,189 2,564
63,861 68,237Liabilities directly associated with assets classified as held for sale (Note 2) 1,107 —
64,968 68,237Non-current liabilitiesOther payables 12,550 13,830Derivative financial instruments 5,694 5,625Accruals 612 575Lease liabilities 7,627 623Finance debt 58,311 55,803Deferred tax liabilities 9,715 9,812Provisions 17,487 17,732Defined benefit pension plan and other post-retirement benefit plan deficits 9,284 8,391
121,280 112,391Total liabilities 186,248 180,628Net assets 100,015 101,548EquityBP shareholders’ equity 97,922 99,444Non-controlling interests 2,093 2,104Total equity 100,015 101,548
(a) Finance debt on the comparative balance sheet has been re-presented to align with the current period. See Note 1 for further information.
BP p.l.c. Group results Third quarter and nine months 2019
15
Condensed group cash flow statement
Third Second Third Nine Ninequarter quarter quarter months months
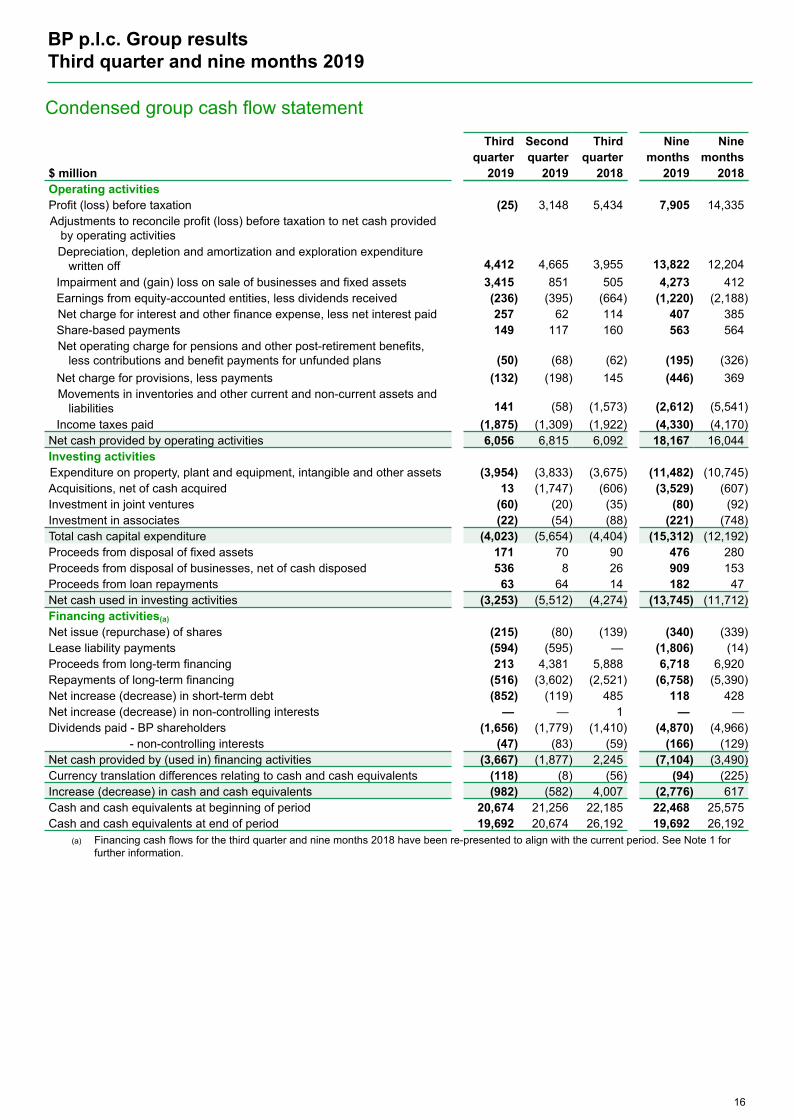
$ million 2019 2019 2018 2019 2018Operating activitiesProfit (loss) before taxation (25) 3,148 5,434 7,905 14,335Adjustments to reconcile profit (loss) before taxation to net cash provided
by operating activitiesDepreciation, depletion and amortization and exploration expenditure
written off 4,412 4,665 3,955 13,822 12,204Impairment and (gain) loss on sale of businesses and fixed assets 3,415 851 505 4,273 412Earnings from equity-accounted entities, less dividends received (236) (395) (664) (1,220) (2,188)Net charge for interest and other finance expense, less net interest paid 257 62 114 407 385Share-based payments 149 117 160 563 564Net operating charge for pensions and other post-retirement benefits,
less contributions and benefit payments for unfunded plans (50) (68) (62) (195) (326)Net charge for provisions, less payments (132) (198) 145 (446) 369Movements in inventories and other current and non-current assets and
liabilities 141 (58) (1,573) (2,612) (5,541)Income taxes paid (1,875) (1,309) (1,922) (4,330) (4,170)
Net cash provided by operating activities 6,056 6,815 6,092 18,167 16,044Investing activitiesExpenditure on property, plant and equipment, intangible and other assets (3,954) (3,833) (3,675) (11,482) (10,745)Acquisitions, net of cash acquired 13 (1,747) (606) (3,529) (607)Investment in joint ventures (60) (20) (35) (80) (92)Investment in associates (22) (54) (88) (221) (748)Total cash capital expenditure (4,023) (5,654) (4,404) (15,312) (12,192)Proceeds from disposal of fixed assets 171 70 90 476 280Proceeds from disposal of businesses, net of cash disposed 536 8 26 909 153Proceeds from loan repayments 63 64 14 182 47Net cash used in investing activities (3,253) (5,512) (4,274) (13,745) (11,712)Financing activities(a)
Net issue (repurchase) of shares (215) (80) (139) (340) (339)Lease liability payments (594) (595) — (1,806) (14)Proceeds from long-term financing 213 4,381 5,888 6,718 6,920Repayments of long-term financing (516) (3,602) (2,521) (6,758) (5,390)Net increase (decrease) in short-term debt (852) (119) 485 118 428Net increase (decrease) in non-controlling interests — — 1 — —Dividends paid - BP shareholders (1,656) (1,779) (1,410) (4,870) (4,966)
- non-controlling interests (47) (83) (59) (166) (129)Net cash provided by (used in) financing activities (3,667) (1,877) 2,245 (7,104) (3,490)Currency translation differences relating to cash and cash equivalents (118) (8) (56) (94) (225)Increase (decrease) in cash and cash equivalents (982) (582) 4,007 (2,776) 617Cash and cash equivalents at beginning of period 20,674 21,256 22,185 22,468 25,575Cash and cash equivalents at end of period 19,692 20,674 26,192 19,692 26,192
(a) Financing cash flows for the third quarter and nine months 2018 have been re-presented to align with the current period. See Note 1 forfurther information.
BP p.l.c. Group results Third quarter and nine months 2019
16

Notes
BP p.l.c. Group results Third quarter and nine months 2019
17
Note 1. Basis of preparation
The interim financial information included in this report has been prepared in accordance with IAS 34 'Interim Financial Reporting'.The results for the interim periods are unaudited and, in the opinion of management, include all adjustments necessary for a fairpresentation of the results for each period. All such adjustments are of a normal recurring nature. This report should be read inconjunction with the consolidated financial statements and related notes for the year ended 31 December 2018 included in BPAnnual Report and Form 20-F 2018.BP prepares its consolidated financial statements included within BP Annual Report and Form 20-F on the basis of InternationalFinancial Reporting Standards (IFRS) as issued by the International Accounting Standards Board (IASB), IFRS as adopted by theEuropean Union (EU) and in accordance with the provisions of the UK Companies Act 2006 as applicable to companies reportingunder IFRS. IFRS as adopted by the EU differs in certain respects from IFRS as issued by the IASB. The differences have no impacton the group’s consolidated financial statements for the periods presented. The financial information presented herein has been prepared in accordance with the accounting policies expected to be used inpreparing BP Annual Report and Form 20-F 2019, which are the same as those used in preparing BP Annual Report and Form 20-F2018 with the exception of the adoption of IFRS 16 'Leases' from 1 January 2019.
New International Financial Reporting Standards adoptedBP adopted IFRS 16 ‘Leases’, which replaced IAS 17 ‘Leases’ and IFRIC 4 ‘Determining whether an arrangement contains a lease’,with effect from 1 January 2019. Further information is included in BP Annual Report and Form 20-F 2018 - Financial statements -Note 1 Significant accounting policies, judgements, estimates and assumptions - Impact of new International Financial ReportingStandards.IFRS 16 provides a new model for lessee accounting in which the majority of leases are accounted for by the recognition on thebalance sheet of a right-of-use asset and a lease liability. Agreements that convey the right to control the use of an identified asset for a period of time in exchange for consideration areaccounted for as leases. A lease liability is recognized at the present value of future lease payments over the reasonably certainlease term. Variable lease payments that do not depend on an index or a rate are not included in the lease liability. The right-of-useasset is recognized at a value equivalent to the initial measurement of the lease liability adjusted for lease prepayments, leaseincentives, initial direct costs and any restoration obligations. The subsequent amortization of the right-of-use asset and the interestexpense related to the lease liability are recognized in the income statement over the lease term. The group recognizes the full lease liability, rather than its working interest share, for leases entered into on behalf of a jointoperation if the group has the primary responsibility for making the lease payments. If the right-of-use asset is jointly controlled by thegroup and the other joint operators, a receivable is recognized for the share of the asset transferred to the other joint operators.BP elected to apply the modified retrospective transition approach in which the cumulative effect of initial application is recognized inopening retained earnings at the date of initial application with no restatement of comparative periods’ financial information.Comparative information in the group balance sheet and group cash flow statement has, however, been re-presented to align withcurrent year presentation, showing lease liabilities and lease liability payments as separate line items. These were previouslyincluded within the finance debt and repayments of long-term financing line items respectively. Amounts presented in these line itemsfor the comparative periods relate to leases accounted for as finance leases under IAS 17.IFRS 16 introduces a revised definition of a lease. As permitted by the standard, BP elected not to reassess the existing populationof leases under the new definition and will only apply the new definition for the assessment of contracts entered into after thetransition date. On transition the standard permits, on a lease-by-lease basis, the right-of-use asset to be measured either at anamount equal to the lease liability (as adjusted for prepaid or accrued lease payments), or on a historical basis as if the standard hadalways applied. BP elected to use the historical asset measurement for its more material leases and used the asset equals liabilityapproach for the remainder of the population. BP also elected to adjust the carrying amounts of the right-of-use assets as at 1January 2019 for onerous lease provisions that had been recognized on the group balance sheet as at 31 December 2018, ratherthan performing impairment tests on transition.
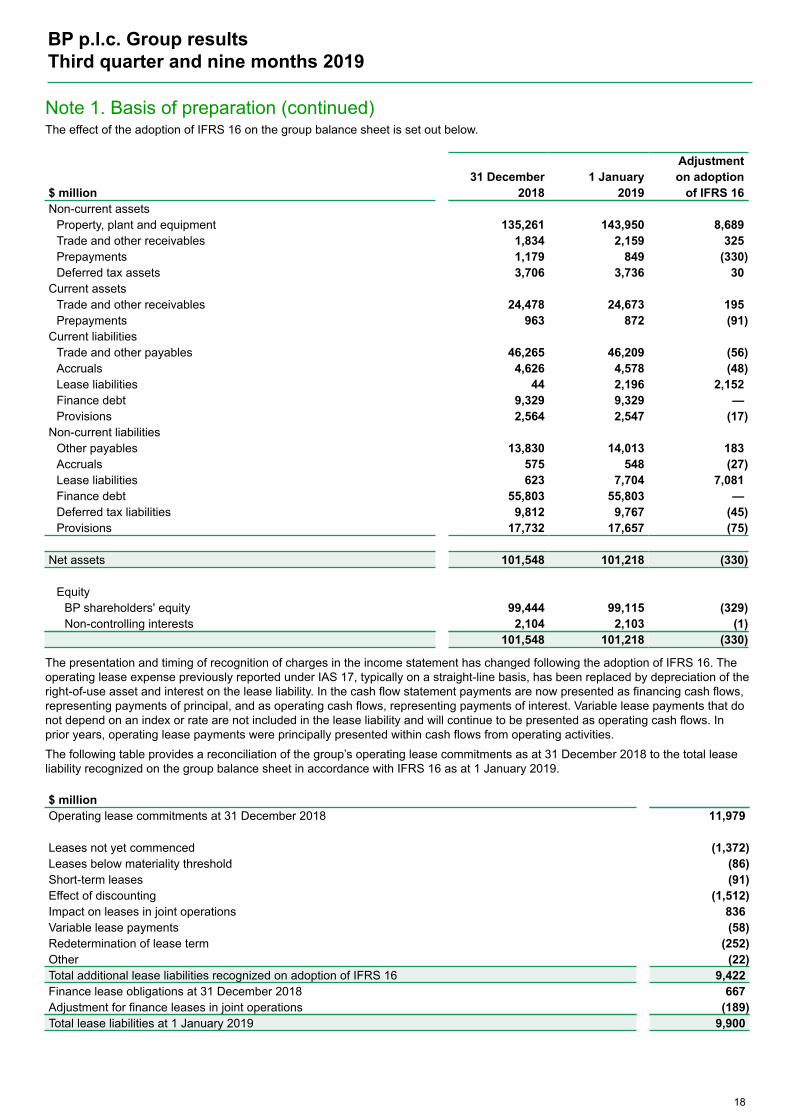
Note 1. Basis of preparation (continued)The effect of the adoption of IFRS 16 on the group balance sheet is set out below.
Adjustment31 December 1 January on adoption
$ million 2018 2019 of IFRS 16Non-current assets
Property, plant and equipment 135,261 143,950 8,689Trade and other receivables 1,834 2,159 325Prepayments 1,179 849 (330)Deferred tax assets 3,706 3,736 30
Current assetsTrade and other receivables 24,478 24,673 195Prepayments 963 872 (91)
Current liabilitiesTrade and other payables 46,265 46,209 (56)Accruals 4,626 4,578 (48)Lease liabilities 44 2,196 2,152Finance debt 9,329 9,329 —Provisions 2,564 2,547 (17)
Non-current liabilitiesOther payables 13,830 14,013 183Accruals 575 548 (27)Lease liabilities 623 7,704 7,081Finance debt 55,803 55,803 —Deferred tax liabilities 9,812 9,767 (45)Provisions 17,732 17,657 (75)
Net assets 101,548 101,218 (330)
EquityBP shareholders' equity 99,444 99,115 (329)Non-controlling interests 2,104 2,103 (1)
101,548 101,218 (330)
The presentation and timing of recognition of charges in the income statement has changed following the adoption of IFRS 16. Theoperating lease expense previously reported under IAS 17, typically on a straight-line basis, has been replaced by depreciation of theright-of-use asset and interest on the lease liability. In the cash flow statement payments are now presented as financing cash flows,representing payments of principal, and as operating cash flows, representing payments of interest. Variable lease payments that donot depend on an index or rate are not included in the lease liability and will continue to be presented as operating cash flows. Inprior years, operating lease payments were principally presented within cash flows from operating activities.The following table provides a reconciliation of the group’s operating lease commitments as at 31 December 2018 to the total leaseliability recognized on the group balance sheet in accordance with IFRS 16 as at 1 January 2019.
$ millionOperating lease commitments at 31 December 2018 11,979
Leases not yet commenced (1,372)Leases below materiality threshold (86)Short-term leases (91)Effect of discounting (1,512)Impact on leases in joint operations 836Variable lease payments (58)Redetermination of lease term (252)Other (22)Total additional lease liabilities recognized on adoption of IFRS 16 9,422Finance lease obligations at 31 December 2018 667Adjustment for finance leases in joint operations (189)Total lease liabilities at 1 January 2019 9,900
BP p.l.c. Group results Third quarter and nine months 2019
18
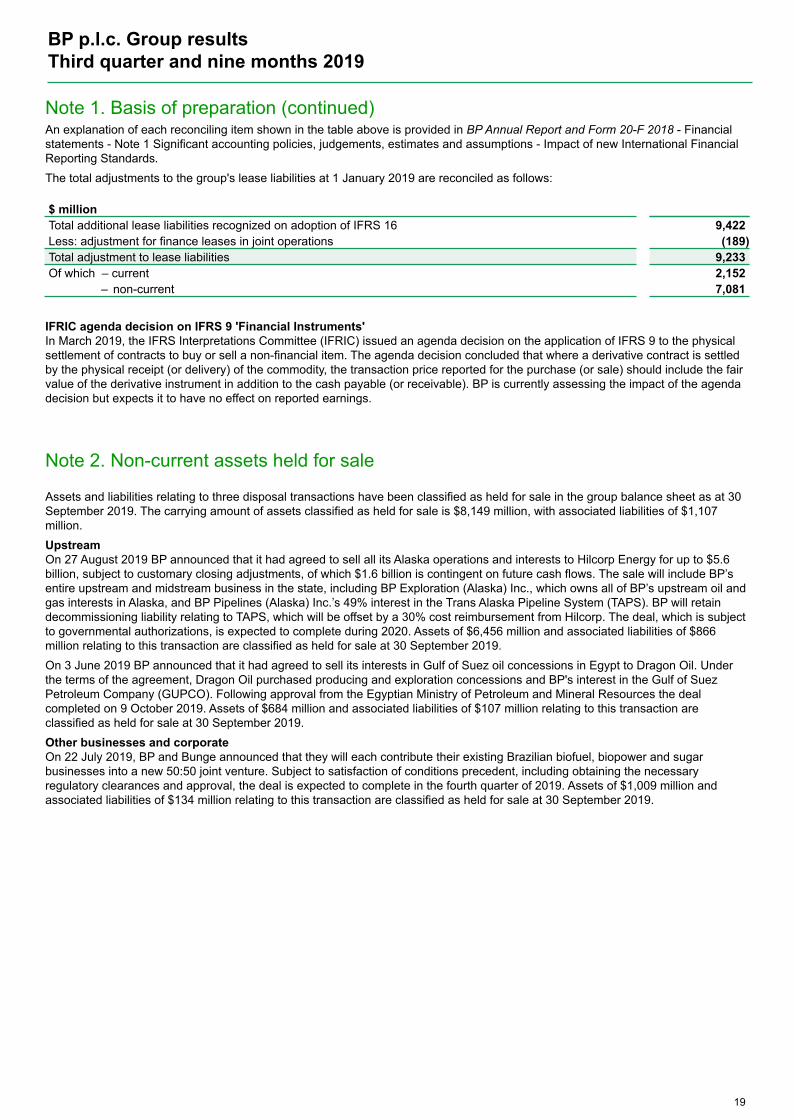
Note 1. Basis of preparation (continued)An explanation of each reconciling item shown in the table above is provided in BP Annual Report and Form 20-F 2018 - Financialstatements - Note 1 Significant accounting policies, judgements, estimates and assumptions - Impact of new International FinancialReporting Standards.The total adjustments to the group's lease liabilities at 1 January 2019 are reconciled as follows:
$ millionTotal additional lease liabilities recognized on adoption of IFRS 16 9,422Less: adjustment for finance leases in joint operations (189)Total adjustment to lease liabilities 9,233Of which – current 2,152
– non-current 7,081
IFRIC agenda decision on IFRS 9 'Financial Instruments'In March 2019, the IFRS Interpretations Committee (IFRIC) issued an agenda decision on the application of IFRS 9 to the physicalsettlement of contracts to buy or sell a non-financial item. The agenda decision concluded that where a derivative contract is settledby the physical receipt (or delivery) of the commodity, the transaction price reported for the purchase (or sale) should include the fairvalue of the derivative instrument in addition to the cash payable (or receivable). BP is currently assessing the impact of the agendadecision but expects it to have no effect on reported earnings.
BP p.l.c. Group results Third quarter and nine months 2019
19
Note 2. Non-current assets held for sale
Assets and liabilities relating to three disposal transactions have been classified as held for sale in the group balance sheet as at 30September 2019. The carrying amount of assets classified as held for sale is $8,149 million, with associated liabilities of $1,107million. UpstreamOn 27 August 2019 BP announced that it had agreed to sell all its Alaska operations and interests to Hilcorp Energy for up to $5.6billion, subject to customary closing adjustments, of which $1.6 billion is contingent on future cash flows. The sale will include BP’sentire upstream and midstream business in the state, including BP Exploration (Alaska) Inc., which owns all of BP’s upstream oil andgas interests in Alaska, and BP Pipelines (Alaska) Inc.’s 49% interest in the Trans Alaska Pipeline System (TAPS). BP will retaindecommissioning liability relating to TAPS, which will be offset by a 30% cost reimbursement from Hilcorp. The deal, which is subjectto governmental authorizations, is expected to complete during 2020. Assets of $6,456 million and associated liabilities of $866million relating to this transaction are classified as held for sale at 30 September 2019.On 3 June 2019 BP announced that it had agreed to sell its interests in Gulf of Suez oil concessions in Egypt to Dragon Oil. Underthe terms of the agreement, Dragon Oil purchased producing and exploration concessions and BP's interest in the Gulf of SuezPetroleum Company (GUPCO). Following approval from the Egyptian Ministry of Petroleum and Mineral Resources the dealcompleted on 9 October 2019. Assets of $684 million and associated liabilities of $107 million relating to this transaction areclassified as held for sale at 30 September 2019.Other businesses and corporateOn 22 July 2019, BP and Bunge announced that they will each contribute their existing Brazilian biofuel, biopower and sugarbusinesses into a new 50:50 joint venture. Subject to satisfaction of conditions precedent, including obtaining the necessaryregulatory clearances and approval, the deal is expected to complete in the fourth quarter of 2019. Assets of $1,009 million andassociated liabilities of $134 million relating to this transaction are classified as held for sale at 30 September 2019.
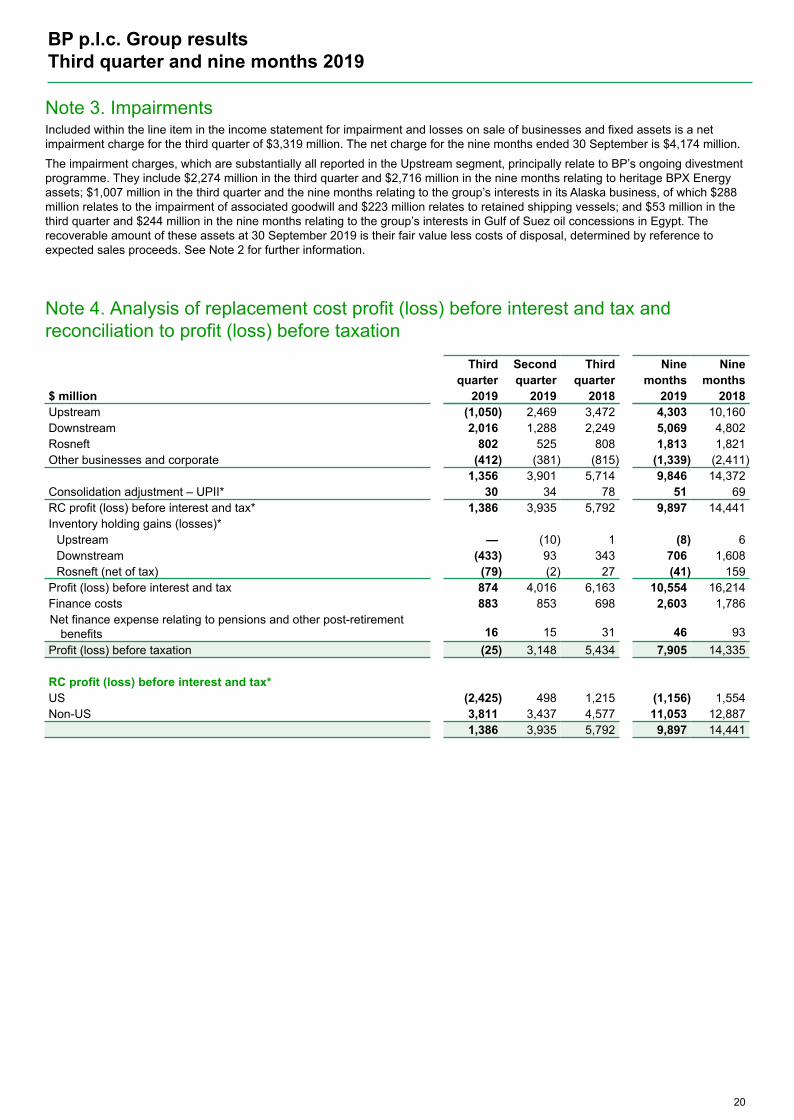
Note 3. Impairments Included within the line item in the income statement for impairment and losses on sale of businesses and fixed assets is a netimpairment charge for the third quarter of $3,319 million. The net charge for the nine months ended 30 September is $4,174 million.The impairment charges, which are substantially all reported in the Upstream segment, principally relate to BP’s ongoing divestmentprogramme. They include $2,274 million in the third quarter and $2,716 million in the nine months relating to heritage BPX Energyassets; $1,007 million in the third quarter and the nine months relating to the group’s interests in its Alaska business, of which $288million relates to the impairment of associated goodwill and $223 million relates to retained shipping vessels; and $53 million in thethird quarter and $244 million in the nine months relating to the group’s interests in Gulf of Suez oil concessions in Egypt. Therecoverable amount of these assets at 30 September 2019 is their fair value less costs of disposal, determined by reference toexpected sales proceeds. See Note 2 for further information.
BP p.l.c. Group results Third quarter and nine months 2019
20
Note 4. Analysis of replacement cost profit (loss) before interest and tax andreconciliation to profit (loss) before taxation
Third Second Third Nine Ninequarter quarter quarter months months
$ million 2019 2019 2018 2019 2018Upstream (1,050) 2,469 3,472 4,303 10,160Downstream 2,016 1,288 2,249 5,069 4,802Rosneft 802 525 808 1,813 1,821Other businesses and corporate (412) (381) (815) (1,339) (2,411)
1,356 3,901 5,714 9,846 14,372Consolidation adjustment – UPII* 30 34 78 51 69RC profit (loss) before interest and tax* 1,386 3,935 5,792 9,897 14,441Inventory holding gains (losses)*
Upstream — (10) 1 (8) 6Downstream (433) 93 343 706 1,608Rosneft (net of tax) (79) (2) 27 (41) 159
Profit (loss) before interest and tax 874 4,016 6,163 10,554 16,214Finance costs 883 853 698 2,603 1,786Net finance expense relating to pensions and other post-retirement
benefits 16 15 31 46 93Profit (loss) before taxation (25) 3,148 5,434 7,905 14,335
RC profit (loss) before interest and tax*US (2,425) 498 1,215 (1,156) 1,554Non-US 3,811 3,437 4,577 11,053 12,887
1,386 3,935 5,792 9,897 14,441
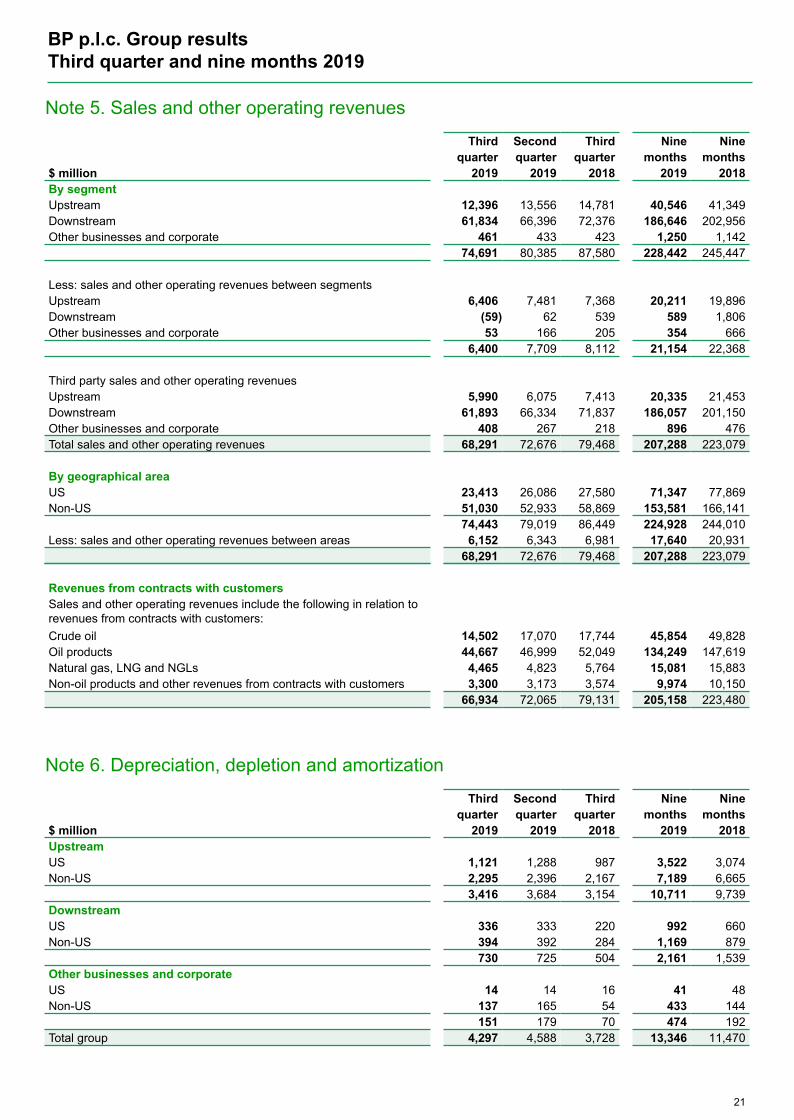
Note 5. Sales and other operating revenues
Third Second Third Nine Ninequarter quarter quarter months months
$ million 2019 2019 2018 2019 2018By segmentUpstream 12,396 13,556 14,781 40,546 41,349Downstream 61,834 66,396 72,376 186,646 202,956Other businesses and corporate 461 433 423 1,250 1,142
74,691 80,385 87,580 228,442 245,447
Less: sales and other operating revenues between segmentsUpstream 6,406 7,481 7,368 20,211 19,896Downstream (59) 62 539 589 1,806Other businesses and corporate 53 166 205 354 666
6,400 7,709 8,112 21,154 22,368
Third party sales and other operating revenuesUpstream 5,990 6,075 7,413 20,335 21,453Downstream 61,893 66,334 71,837 186,057 201,150Other businesses and corporate 408 267 218 896 476Total sales and other operating revenues 68,291 72,676 79,468 207,288 223,079
By geographical areaUS 23,413 26,086 27,580 71,347 77,869Non-US 51,030 52,933 58,869 153,581 166,141
74,443 79,019 86,449 224,928 244,010Less: sales and other operating revenues between areas 6,152 6,343 6,981 17,640 20,931
68,291 72,676 79,468 207,288 223,079
Revenues from contracts with customersSales and other operating revenues include the following in relation torevenues from contracts with customers:Crude oil 14,502 17,070 17,744 45,854 49,828Oil products 44,667 46,999 52,049 134,249 147,619Natural gas, LNG and NGLs 4,465 4,823 5,764 15,081 15,883Non-oil products and other revenues from contracts with customers 3,300 3,173 3,574 9,974 10,150
66,934 72,065 79,131 205,158 223,480
BP p.l.c. Group results Third quarter and nine months 2019
21
Note 6. Depreciation, depletion and amortization
Third Second Third Nine Ninequarter quarter quarter months months
$ million 2019 2019 2018 2019 2018UpstreamUS 1,121 1,288 987 3,522 3,074Non-US 2,295 2,396 2,167 7,189 6,665
3,416 3,684 3,154 10,711 9,739DownstreamUS 336 333 220 992 660Non-US 394 392 284 1,169 879
730 725 504 2,161 1,539Other businesses and corporateUS 14 14 16 41 48Non-US 137 165 54 433 144
151 179 70 474 192Total group 4,297 4,588 3,728 13,346 11,470
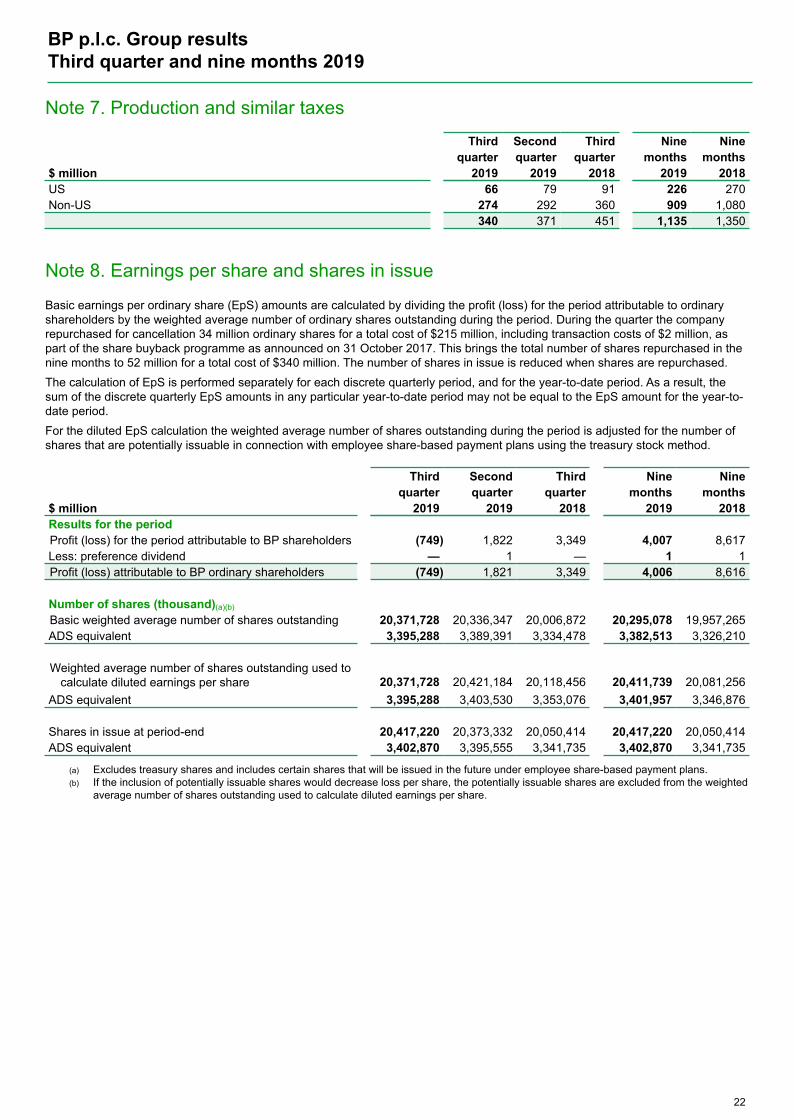
Note 7. Production and similar taxes
Third Second Third Nine Ninequarter quarter quarter months months
$ million 2019 2019 2018 2019 2018US 66 79 91 226 270Non-US 274 292 360 909 1,080
340 371 451 1,135 1,350
BP p.l.c. Group results Third quarter and nine months 2019
22
Note 8. Earnings per share and shares in issue
Basic earnings per ordinary share (EpS) amounts are calculated by dividing the profit (loss) for the period attributable to ordinaryshareholders by the weighted average number of ordinary shares outstanding during the period. During the quarter the companyrepurchased for cancellation 34 million ordinary shares for a total cost of $215 million, including transaction costs of $2 million, aspart of the share buyback programme as announced on 31 October 2017. This brings the total number of shares repurchased in thenine months to 52 million for a total cost of $340 million. The number of shares in issue is reduced when shares are repurchased.The calculation of EpS is performed separately for each discrete quarterly period, and for the year-to-date period. As a result, thesum of the discrete quarterly EpS amounts in any particular year-to-date period may not be equal to the EpS amount for the year-to-date period. For the diluted EpS calculation the weighted average number of shares outstanding during the period is adjusted for the number ofshares that are potentially issuable in connection with employee share-based payment plans using the treasury stock method.
Third Second Third Nine Ninequarter quarter quarter months months
$ million 2019 2019 2018 2019 2018Results for the periodProfit (loss) for the period attributable to BP shareholders (749) 1,822 3,349 4,007 8,617Less: preference dividend — 1 — 1 1Profit (loss) attributable to BP ordinary shareholders (749) 1,821 3,349 4,006 8,616
Number of shares (thousand)(a)(b)
Basic weighted average number of shares outstanding 20,371,728 20,336,347 20,006,872 20,295,078 19,957,265ADS equivalent 3,395,288 3,389,391 3,334,478 3,382,513 3,326,210
Weighted average number of shares outstanding used tocalculate diluted earnings per share 20,371,728 20,421,184 20,118,456 20,411,739 20,081,256
ADS equivalent 3,395,288 3,403,530 3,353,076 3,401,957 3,346,876
Shares in issue at period-end 20,417,220 20,373,332 20,050,414 20,417,220 20,050,414ADS equivalent 3,402,870 3,395,555 3,341,735 3,402,870 3,341,735
(a) Excludes treasury shares and includes certain shares that will be issued in the future under employee share-based payment plans.(b) If the inclusion of potentially issuable shares would decrease loss per share, the potentially issuable shares are excluded from the weighted
average number of shares outstanding used to calculate diluted earnings per share.
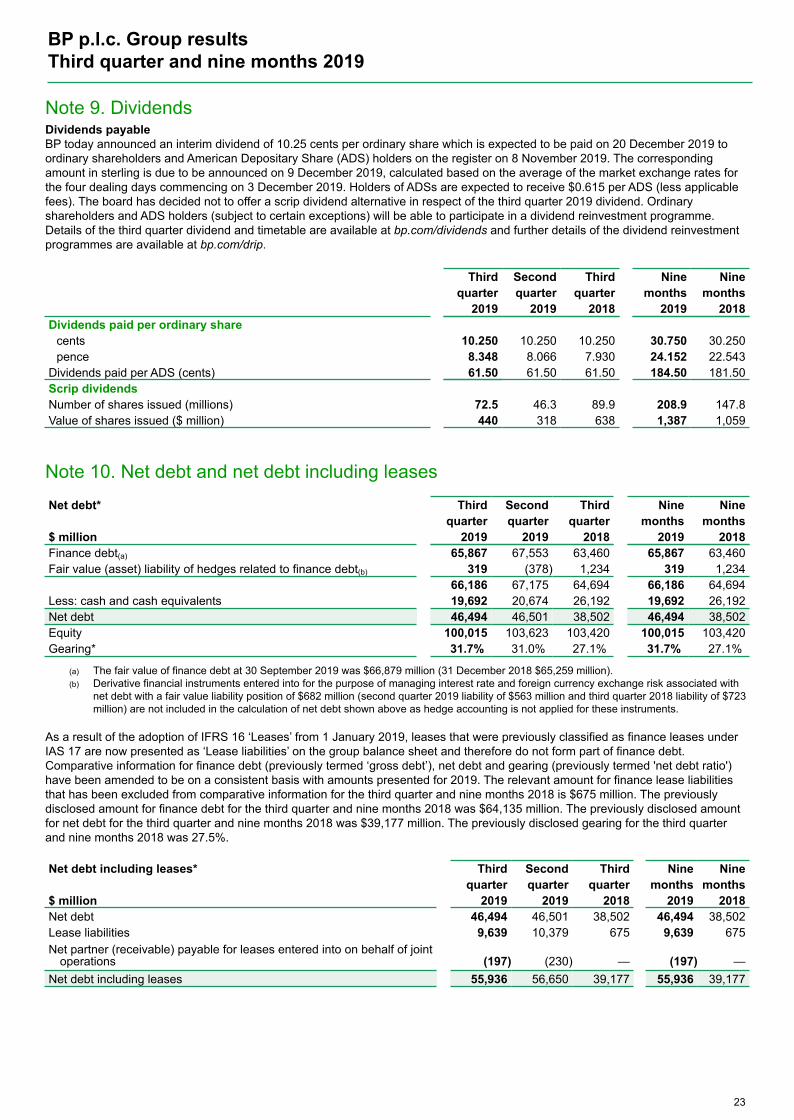
Note 9. Dividends Dividends payableBP today announced an interim dividend of 10.25 cents per ordinary share which is expected to be paid on 20 December 2019 toordinary shareholders and American Depositary Share (ADS) holders on the register on 8 November 2019. The correspondingamount in sterling is due to be announced on 9 December 2019, calculated based on the average of the market exchange rates forthe four dealing days commencing on 3 December 2019. Holders of ADSs are expected to receive $0.615 per ADS (less applicablefees). The board has decided not to offer a scrip dividend alternative in respect of the third quarter 2019 dividend. Ordinaryshareholders and ADS holders (subject to certain exceptions) will be able to participate in a dividend reinvestment programme.Details of the third quarter dividend and timetable are available at bp.com/dividends and further details of the dividend reinvestmentprogrammes are available at bp.com/drip.
Third Second Third Nine Ninequarter quarter quarter months months
2019 2019 2018 2019 2018Dividends paid per ordinary share
cents 10.250 10.250 10.250 30.750 30.250pence 8.348 8.066 7.930 24.152 22.543
Dividends paid per ADS (cents) 61.50 61.50 61.50 184.50 181.50Scrip dividendsNumber of shares issued (millions) 72.5 46.3 89.9 208.9 147.8Value of shares issued ($ million) 440 318 638 1,387 1,059
BP p.l.c. Group results Third quarter and nine months 2019
23
Note 10. Net debt and net debt including leases
Net debt* Third Second Third Nine Ninequarter quarter quarter months months
$ million 2019 2019 2018 2019 2018Finance debt(a) 65,867 67,553 63,460 65,867 63,460Fair value (asset) liability of hedges related to finance debt(b) 319 (378) 1,234 319 1,234
66,186 67,175 64,694 66,186 64,694Less: cash and cash equivalents 19,692 20,674 26,192 19,692 26,192Net debt 46,494 46,501 38,502 46,494 38,502Equity 100,015 103,623 103,420 100,015 103,420Gearing* 31.7% 31.0% 27.1% 31.7% 27.1%
(a) The fair value of finance debt at 30 September 2019 was $66,879 million (31 December 2018 $65,259 million).(b) Derivative financial instruments entered into for the purpose of managing interest rate and foreign currency exchange risk associated with
net debt with a fair value liability position of $682 million (second quarter 2019 liability of $563 million and third quarter 2018 liability of $723million) are not included in the calculation of net debt shown above as hedge accounting is not applied for these instruments.
As a result of the adoption of IFRS 16 ‘Leases’ from 1 January 2019, leases that were previously classified as finance leases underIAS 17 are now presented as ‘Lease liabilities’ on the group balance sheet and therefore do not form part of finance debt.Comparative information for finance debt (previously termed ‘gross debt’), net debt and gearing (previously termed 'net debt ratio')have been amended to be on a consistent basis with amounts presented for 2019. The relevant amount for finance lease liabilitiesthat has been excluded from comparative information for the third quarter and nine months 2018 is $675 million. The previouslydisclosed amount for finance debt for the third quarter and nine months 2018 was $64,135 million. The previously disclosed amountfor net debt for the third quarter and nine months 2018 was $39,177 million. The previously disclosed gearing for the third quarterand nine months 2018 was 27.5%.
Net debt including leases* Third Second Third Nine Ninequarter quarter quarter months months
$ million 2019 2019 2018 2019 2018Net debt 46,494 46,501 38,502 46,494 38,502Lease liabilities 9,639 10,379 675 9,639 675Net partner (receivable) payable for leases entered into on behalf of joint
operations (197) (230) — (197) —Net debt including leases 55,936 56,650 39,177 55,936 39,177
Note 11. Inventory valuation
A provision of $369 million was held against hydrocarbon inventories at 30 September 2019 ($242 million at 30 June 2019 and $53million at 30 September 2018) to write them down to their net realizable value. The net movement charged to the income statementduring the third quarter 2019 was $131 million (second quarter 2019 was a charge of $120 million and third quarter 2018 was acharge of $15 million).
BP p.l.c. Group results Third quarter and nine months 2019
24
Note 12. Statutory accounts
The financial information shown in this publication, which was approved by the Board of Directors on 28 October 2019, is unauditedand does not constitute statutory financial statements. Audited financial information will be published in BP Annual Report and Form20-F 2019. BP Annual Report and Form 20-F 2018 has been filed with the Registrar of Companies in England and Wales. The reportof the auditor on those accounts was unqualified, did not include a reference to any matters to which the auditor drew attention byway of emphasis without qualifying the report and did not contain a statement under section 498(2) or section 498(3) of the UKCompanies Act 2006.
Additional information
BP p.l.c. Group results Third quarter and nine months 2019
25
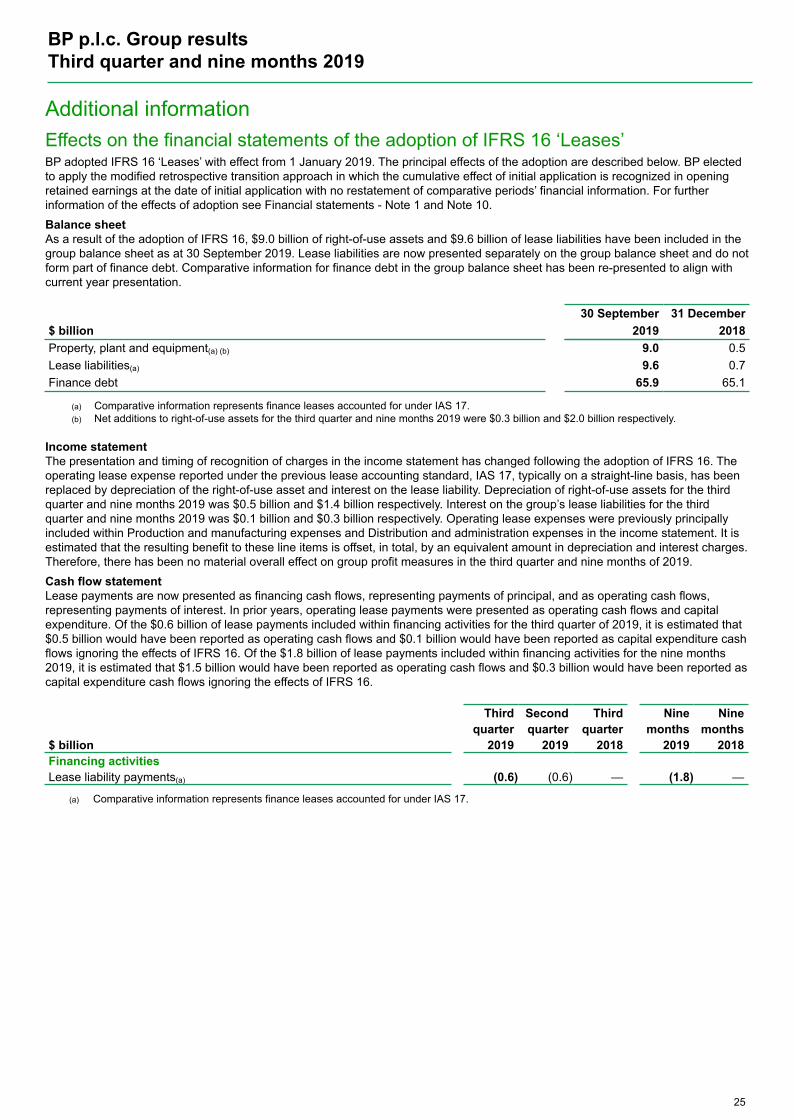
Effects on the financial statements of the adoption of IFRS 16 ‘Leases’BP adopted IFRS 16 ‘Leases’ with effect from 1 January 2019. The principal effects of the adoption are described below. BP electedto apply the modified retrospective transition approach in which the cumulative effect of initial application is recognized in openingretained earnings at the date of initial application with no restatement of comparative periods’ financial information. For furtherinformation of the effects of adoption see Financial statements - Note 1 and Note 10. Balance sheetAs a result of the adoption of IFRS 16, $9.0 billion of right-of-use assets and $9.6 billion of lease liabilities have been included in thegroup balance sheet as at 30 September 2019. Lease liabilities are now presented separately on the group balance sheet and do notform part of finance debt. Comparative information for finance debt in the group balance sheet has been re-presented to align withcurrent year presentation.
30 September 31 December$ billion 2019 2018Property, plant and equipment(a) (b) 9.0 0.5Lease liabilities(a) 9.6 0.7Finance debt 65.9 65.1
(a) Comparative information represents finance leases accounted for under IAS 17.(b) Net additions to right-of-use assets for the third quarter and nine months 2019 were $0.3 billion and $2.0 billion respectively.
Income statementThe presentation and timing of recognition of charges in the income statement has changed following the adoption of IFRS 16. Theoperating lease expense reported under the previous lease accounting standard, IAS 17, typically on a straight-line basis, has beenreplaced by depreciation of the right-of-use asset and interest on the lease liability. Depreciation of right-of-use assets for the thirdquarter and nine months 2019 was $0.5 billion and $1.4 billion respectively. Interest on the group’s lease liabilities for the thirdquarter and nine months 2019 was $0.1 billion and $0.3 billion respectively. Operating lease expenses were previously principallyincluded within Production and manufacturing expenses and Distribution and administration expenses in the income statement. It isestimated that the resulting benefit to these line items is offset, in total, by an equivalent amount in depreciation and interest charges.Therefore, there has been no material overall effect on group profit measures in the third quarter and nine months of 2019.Cash flow statementLease payments are now presented as financing cash flows, representing payments of principal, and as operating cash flows,representing payments of interest. In prior years, operating lease payments were presented as operating cash flows and capitalexpenditure. Of the $0.6 billion of lease payments included within financing activities for the third quarter of 2019, it is estimated that$0.5 billion would have been reported as operating cash flows and $0.1 billion would have been reported as capital expenditure cashflows ignoring the effects of IFRS 16. Of the $1.8 billion of lease payments included within financing activities for the nine months2019, it is estimated that $1.5 billion would have been reported as operating cash flows and $0.3 billion would have been reported ascapital expenditure cash flows ignoring the effects of IFRS 16.
Third Second Third Nine Ninequarter quarter quarter months months
$ billion 2019 2019 2018 2019 2018Financing activitiesLease liability payments(a) (0.6) (0.6) — (1.8) —
(a) Comparative information represents finance leases accounted for under IAS 17.
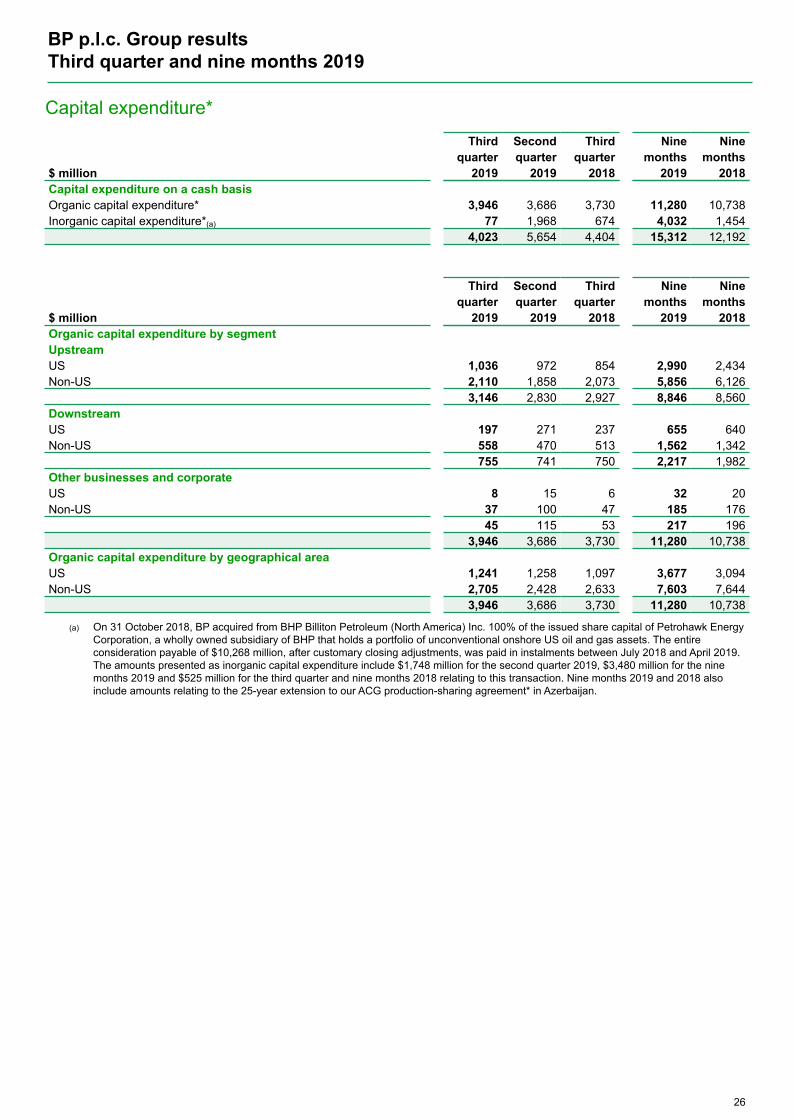
Capital expenditure*
Third Second Third Nine Ninequarter quarter quarter months months
$ million 2019 2019 2018 2019 2018Capital expenditure on a cash basisOrganic capital expenditure* 3,946 3,686 3,730 11,280 10,738Inorganic capital expenditure*(a) 77 1,968 674 4,032 1,454
4,023 5,654 4,404 15,312 12,192
Third Second Third Nine Ninequarter quarter quarter months months
$ million 2019 2019 2018 2019 2018Organic capital expenditure by segmentUpstreamUS 1,036 972 854 2,990 2,434Non-US 2,110 1,858 2,073 5,856 6,126
3,146 2,830 2,927 8,846 8,560DownstreamUS 197 271 237 655 640Non-US 558 470 513 1,562 1,342
755 741 750 2,217 1,982Other businesses and corporateUS 8 15 6 32 20Non-US 37 100 47 185 176
45 115 53 217 1963,946 3,686 3,730 11,280 10,738
Organic capital expenditure by geographical areaUS 1,241 1,258 1,097 3,677 3,094Non-US 2,705 2,428 2,633 7,603 7,644
3,946 3,686 3,730 11,280 10,738
(a) On 31 October 2018, BP acquired from BHP Billiton Petroleum (North America) Inc. 100% of the issued share capital of Petrohawk EnergyCorporation, a wholly owned subsidiary of BHP that holds a portfolio of unconventional onshore US oil and gas assets. The entireconsideration payable of $10,268 million, after customary closing adjustments, was paid in instalments between July 2018 and April 2019.The amounts presented as inorganic capital expenditure include $1,748 million for the second quarter 2019, $3,480 million for the ninemonths 2019 and $525 million for the third quarter and nine months 2018 relating to this transaction. Nine months 2019 and 2018 alsoinclude amounts relating to the 25-year extension to our ACG production-sharing agreement* in Azerbaijan.
BP p.l.c. Group results Third quarter and nine months 2019
26
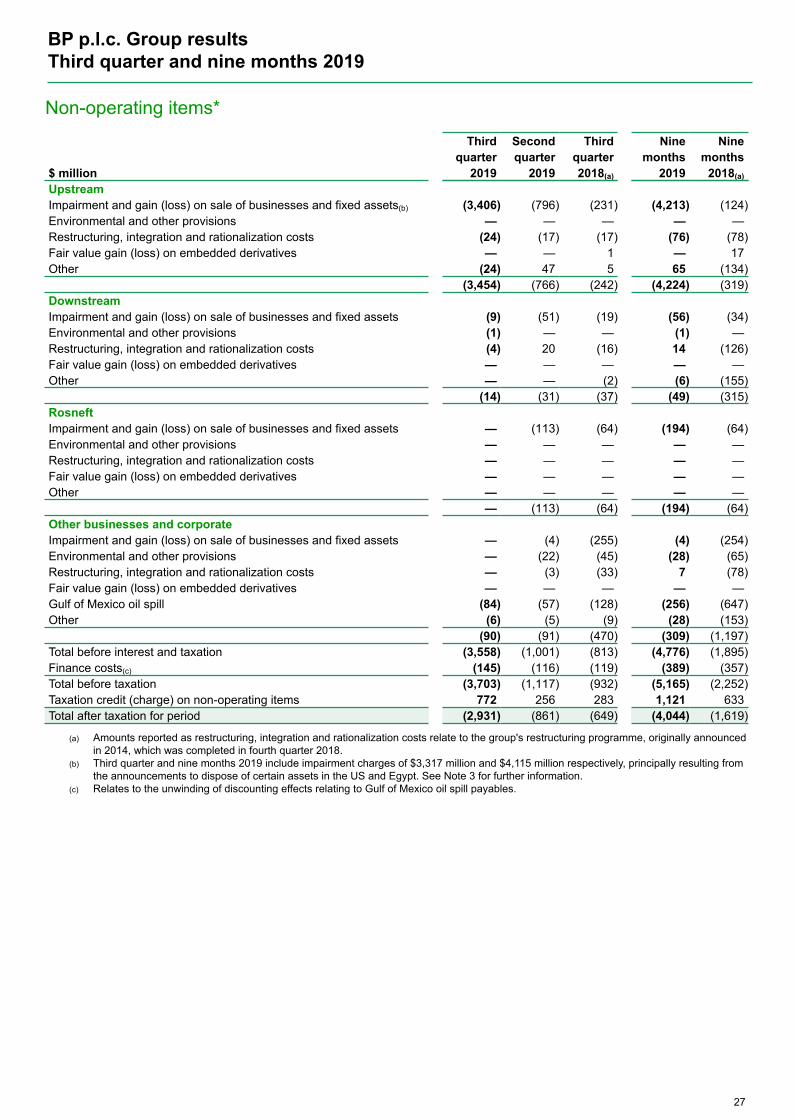
Non-operating items*
Third Second Third Nine Ninequarter quarter quarter months months
$ million 2019 2019 2018(a) 2019 2018(a)
UpstreamImpairment and gain (loss) on sale of businesses and fixed assets(b) (3,406) (796) (231) (4,213) (124)Environmental and other provisions — — — — —Restructuring, integration and rationalization costs (24) (17) (17) (76) (78)Fair value gain (loss) on embedded derivatives — — 1 — 17Other (24) 47 5 65 (134)
(3,454) (766) (242) (4,224) (319)DownstreamImpairment and gain (loss) on sale of businesses and fixed assets (9) (51) (19) (56) (34)Environmental and other provisions (1) — — (1) —Restructuring, integration and rationalization costs (4) 20 (16) 14 (126)Fair value gain (loss) on embedded derivatives — — — — —Other — — (2) (6) (155)
(14) (31) (37) (49) (315)RosneftImpairment and gain (loss) on sale of businesses and fixed assets — (113) (64) (194) (64)Environmental and other provisions — — — — —Restructuring, integration and rationalization costs — — — — —Fair value gain (loss) on embedded derivatives — — — — —Other — — — — —
— (113) (64) (194) (64)Other businesses and corporateImpairment and gain (loss) on sale of businesses and fixed assets — (4) (255) (4) (254)Environmental and other provisions — (22) (45) (28) (65)Restructuring, integration and rationalization costs — (3) (33) 7 (78)Fair value gain (loss) on embedded derivatives — — — — —Gulf of Mexico oil spill (84) (57) (128) (256) (647)Other (6) (5) (9) (28) (153)
(90) (91) (470) (309) (1,197)Total before interest and taxation (3,558) (1,001) (813) (4,776) (1,895)Finance costs(c) (145) (116) (119) (389) (357)Total before taxation (3,703) (1,117) (932) (5,165) (2,252)Taxation credit (charge) on non-operating items 772 256 283 1,121 633Total after taxation for period (2,931) (861) (649) (4,044) (1,619)
(a) Amounts reported as restructuring, integration and rationalization costs relate to the group's restructuring programme, originally announcedin 2014, which was completed in fourth quarter 2018.
(b) Third quarter and nine months 2019 include impairment charges of $3,317 million and $4,115 million respectively, principally resulting fromthe announcements to dispose of certain assets in the US and Egypt. See Note 3 for further information.
(c) Relates to the unwinding of discounting effects relating to Gulf of Mexico oil spill payables.
BP p.l.c. Group results Third quarter and nine months 2019
27
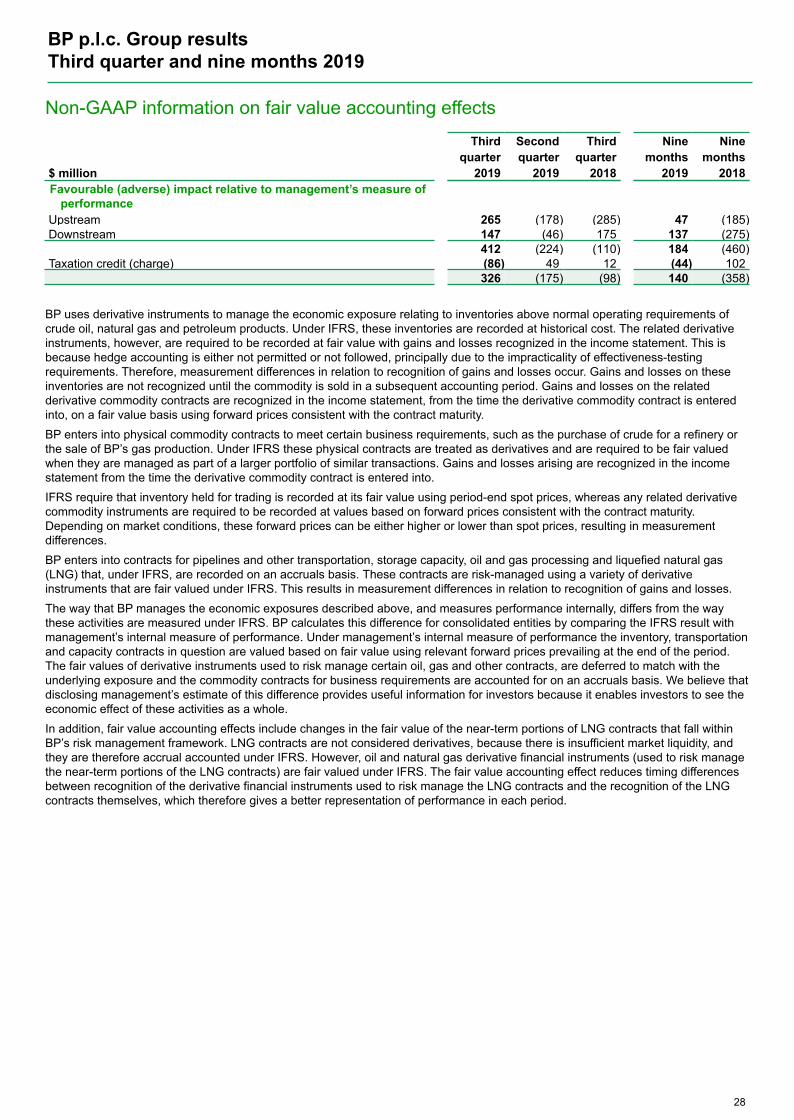
Non-GAAP information on fair value accounting effects
Third Second Third Nine Ninequarter quarter quarter months months
$ million 2019 2019 2018 2019 2018Favourable (adverse) impact relative to management’s measure of
performanceUpstream 265 (178) (285) 47 (185)Downstream 147 (46) 175 137 (275)
412 (224) (110) 184 (460)Taxation credit (charge) (86) 49 12 (44) 102
326 (175) (98) 140 (358)
BP uses derivative instruments to manage the economic exposure relating to inventories above normal operating requirements ofcrude oil, natural gas and petroleum products. Under IFRS, these inventories are recorded at historical cost. The related derivativeinstruments, however, are required to be recorded at fair value with gains and losses recognized in the income statement. This isbecause hedge accounting is either not permitted or not followed, principally due to the impracticality of effectiveness-testingrequirements. Therefore, measurement differences in relation to recognition of gains and losses occur. Gains and losses on theseinventories are not recognized until the commodity is sold in a subsequent accounting period. Gains and losses on the relatedderivative commodity contracts are recognized in the income statement, from the time the derivative commodity contract is enteredinto, on a fair value basis using forward prices consistent with the contract maturity.BP enters into physical commodity contracts to meet certain business requirements, such as the purchase of crude for a refinery orthe sale of BP’s gas production. Under IFRS these physical contracts are treated as derivatives and are required to be fair valuedwhen they are managed as part of a larger portfolio of similar transactions. Gains and losses arising are recognized in the incomestatement from the time the derivative commodity contract is entered into. IFRS require that inventory held for trading is recorded at its fair value using period-end spot prices, whereas any related derivativecommodity instruments are required to be recorded at values based on forward prices consistent with the contract maturity.Depending on market conditions, these forward prices can be either higher or lower than spot prices, resulting in measurementdifferences.BP enters into contracts for pipelines and other transportation, storage capacity, oil and gas processing and liquefied natural gas(LNG) that, under IFRS, are recorded on an accruals basis. These contracts are risk-managed using a variety of derivativeinstruments that are fair valued under IFRS. This results in measurement differences in relation to recognition of gains and losses.The way that BP manages the economic exposures described above, and measures performance internally, differs from the waythese activities are measured under IFRS. BP calculates this difference for consolidated entities by comparing the IFRS result withmanagement’s internal measure of performance. Under management’s internal measure of performance the inventory, transportationand capacity contracts in question are valued based on fair value using relevant forward prices prevailing at the end of the period.The fair values of derivative instruments used to risk manage certain oil, gas and other contracts, are deferred to match with theunderlying exposure and the commodity contracts for business requirements are accounted for on an accruals basis. We believe thatdisclosing management’s estimate of this difference provides useful information for investors because it enables investors to see theeconomic effect of these activities as a whole. In addition, fair value accounting effects include changes in the fair value of the near-term portions of LNG contracts that fall withinBP’s risk management framework. LNG contracts are not considered derivatives, because there is insufficient market liquidity, andthey are therefore accrual accounted under IFRS. However, oil and natural gas derivative financial instruments (used to risk managethe near-term portions of the LNG contracts) are fair valued under IFRS. The fair value accounting effect reduces timing differencesbetween recognition of the derivative financial instruments used to risk manage the LNG contracts and the recognition of the LNGcontracts themselves, which therefore gives a better representation of performance in each period.
BP p.l.c. Group results Third quarter and nine months 2019
28
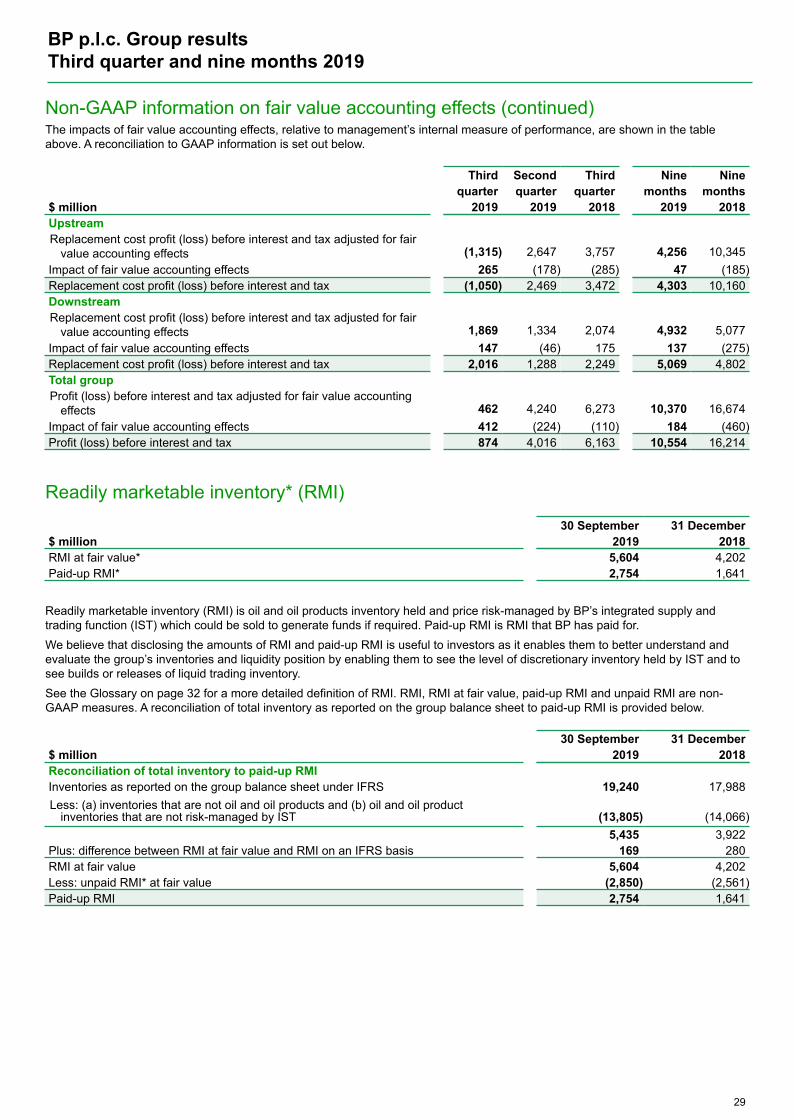
Non-GAAP information on fair value accounting effects (continued)The impacts of fair value accounting effects, relative to management’s internal measure of performance, are shown in the tableabove. A reconciliation to GAAP information is set out below.
Third Second Third Nine Ninequarter quarter quarter months months
$ million 2019 2019 2018 2019 2018UpstreamReplacement cost profit (loss) before interest and tax adjusted for fair
value accounting effects (1,315) 2,647 3,757 4,256 10,345Impact of fair value accounting effects 265 (178) (285) 47 (185)Replacement cost profit (loss) before interest and tax (1,050) 2,469 3,472 4,303 10,160DownstreamReplacement cost profit (loss) before interest and tax adjusted for fair
value accounting effects 1,869 1,334 2,074 4,932 5,077Impact of fair value accounting effects 147 (46) 175 137 (275)Replacement cost profit (loss) before interest and tax 2,016 1,288 2,249 5,069 4,802Total groupProfit (loss) before interest and tax adjusted for fair value accounting
effects 462 4,240 6,273 10,370 16,674Impact of fair value accounting effects 412 (224) (110) 184 (460)Profit (loss) before interest and tax 874 4,016 6,163 10,554 16,214
BP p.l.c. Group results Third quarter and nine months 2019
29
Readily marketable inventory* (RMI)
30 September 31 December$ million 2019 2018RMI at fair value* 5,604 4,202Paid-up RMI* 2,754 1,641
Readily marketable inventory (RMI) is oil and oil products inventory held and price risk-managed by BP’s integrated supply andtrading function (IST) which could be sold to generate funds if required. Paid-up RMI is RMI that BP has paid for.We believe that disclosing the amounts of RMI and paid-up RMI is useful to investors as it enables them to better understand andevaluate the group’s inventories and liquidity position by enabling them to see the level of discretionary inventory held by IST and tosee builds or releases of liquid trading inventory.See the Glossary on page 32 for a more detailed definition of RMI. RMI, RMI at fair value, paid-up RMI and unpaid RMI are non-GAAP measures. A reconciliation of total inventory as reported on the group balance sheet to paid-up RMI is provided below.
30 September 31 December$ million 2019 2018Reconciliation of total inventory to paid-up RMIInventories as reported on the group balance sheet under IFRS 19,240 17,988Less: (a) inventories that are not oil and oil products and (b) oil and oil product
inventories that are not risk-managed by IST (13,805) (14,066)5,435 3,922
Plus: difference between RMI at fair value and RMI on an IFRS basis 169 280RMI at fair value 5,604 4,202Less: unpaid RMI* at fair value (2,850) (2,561)Paid-up RMI 2,754 1,641
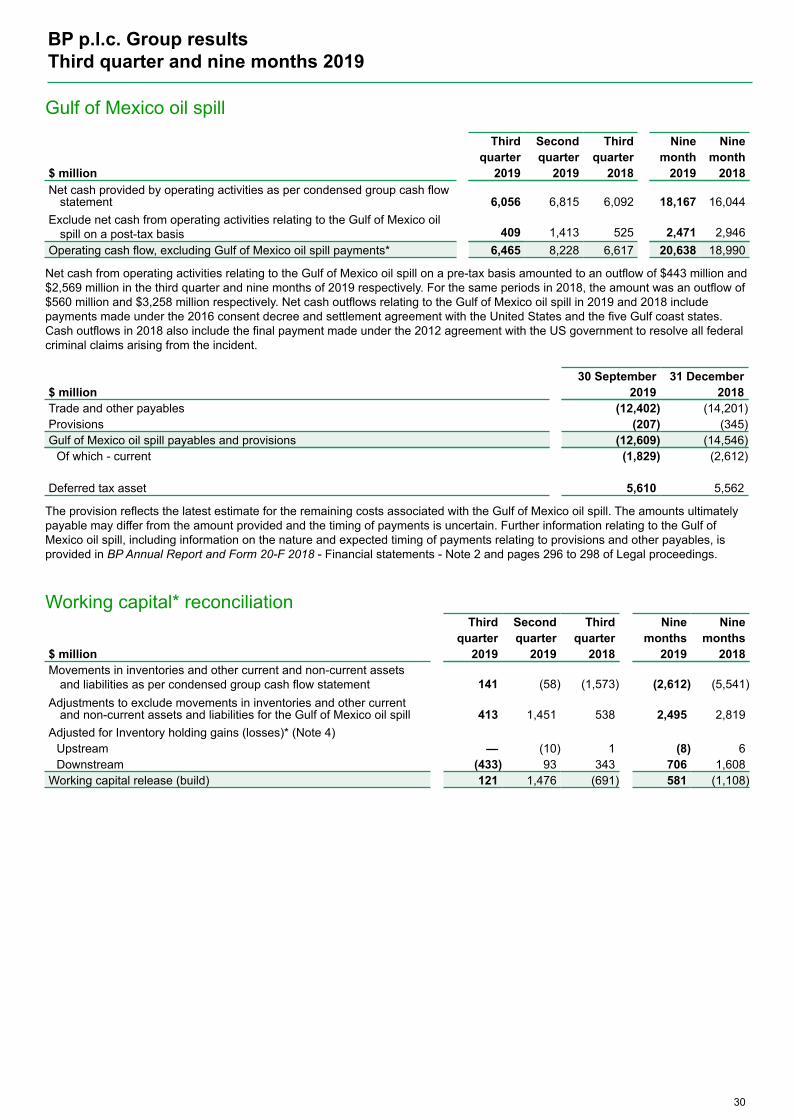
Gulf of Mexico oil spill
Third Second Third Nine Ninequarter quarter quarter month month
$ million 2019 2019 2018 2019 2018Net cash provided by operating activities as per condensed group cash flow
statement 6,056 6,815 6,092 18,167 16,044Exclude net cash from operating activities relating to the Gulf of Mexico oil
spill on a post-tax basis 409 1,413 525 2,471 2,946Operating cash flow, excluding Gulf of Mexico oil spill payments* 6,465 8,228 6,617 20,638 18,990
Net cash from operating activities relating to the Gulf of Mexico oil spill on a pre-tax basis amounted to an outflow of $443 million and$2,569 million in the third quarter and nine months of 2019 respectively. For the same periods in 2018, the amount was an outflow of$560 million and $3,258 million respectively. Net cash outflows relating to the Gulf of Mexico oil spill in 2019 and 2018 includepayments made under the 2016 consent decree and settlement agreement with the United States and the five Gulf coast states.Cash outflows in 2018 also include the final payment made under the 2012 agreement with the US government to resolve all federalcriminal claims arising from the incident.
30 September 31 December$ million 2019 2018Trade and other payables (12,402) (14,201)Provisions (207) (345)Gulf of Mexico oil spill payables and provisions (12,609) (14,546)
Of which - current (1,829) (2,612)
Deferred tax asset 5,610 5,562
The provision reflects the latest estimate for the remaining costs associated with the Gulf of Mexico oil spill. The amounts ultimatelypayable may differ from the amount provided and the timing of payments is uncertain. Further information relating to the Gulf ofMexico oil spill, including information on the nature and expected timing of payments relating to provisions and other payables, isprovided in BP Annual Report and Form 20-F 2018 - Financial statements - Note 2 and pages 296 to 298 of Legal proceedings.
BP p.l.c. Group results Third quarter and nine months 2019
30
Working capital* reconciliationThird Second Third Nine Nine
quarter quarter quarter months months$ million 2019 2019 2018 2019 2018Movements in inventories and other current and non-current assets
and liabilities as per condensed group cash flow statement 141 (58) (1,573) (2,612) (5,541)Adjustments to exclude movements in inventories and other current
and non-current assets and liabilities for the Gulf of Mexico oil spill 413 1,451 538 2,495 2,819Adjusted for Inventory holding gains (losses)* (Note 4)
Upstream — (10) 1 (8) 6Downstream (433) 93 343 706 1,608
Working capital release (build) 121 1,476 (691) 581 (1,108)
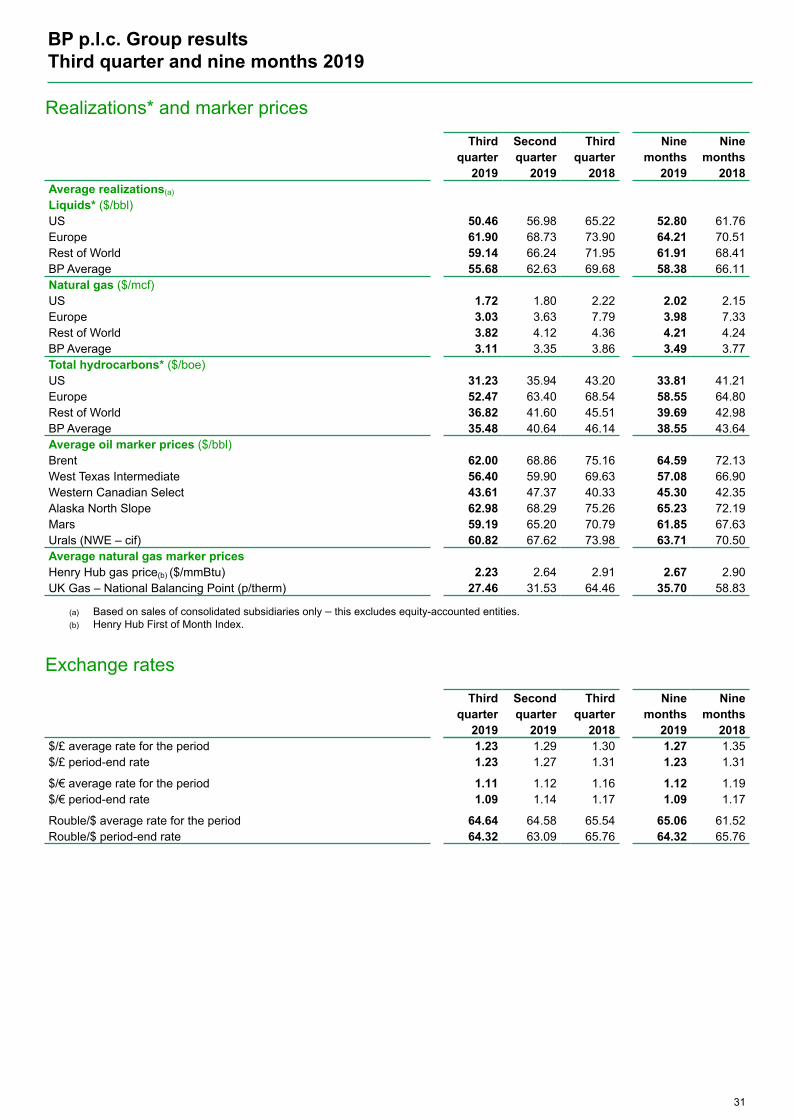
Realizations* and marker prices
Third Second Third Nine Ninequarter quarter quarter months months
2019 2019 2018 2019 2018Average realizations(a)
Liquids* ($/bbl)US 50.46 56.98 65.22 52.80 61.76Europe 61.90 68.73 73.90 64.21 70.51Rest of World 59.14 66.24 71.95 61.91 68.41BP Average 55.68 62.63 69.68 58.38 66.11Natural gas ($/mcf)US 1.72 1.80 2.22 2.02 2.15Europe 3.03 3.63 7.79 3.98 7.33Rest of World 3.82 4.12 4.36 4.21 4.24BP Average 3.11 3.35 3.86 3.49 3.77Total hydrocarbons* ($/boe)US 31.23 35.94 43.20 33.81 41.21Europe 52.47 63.40 68.54 58.55 64.80Rest of World 36.82 41.60 45.51 39.69 42.98BP Average 35.48 40.64 46.14 38.55 43.64Average oil marker prices ($/bbl)Brent 62.00 68.86 75.16 64.59 72.13West Texas Intermediate 56.40 59.90 69.63 57.08 66.90Western Canadian Select 43.61 47.37 40.33 45.30 42.35Alaska North Slope 62.98 68.29 75.26 65.23 72.19Mars 59.19 65.20 70.79 61.85 67.63Urals (NWE – cif) 60.82 67.62 73.98 63.71 70.50Average natural gas marker pricesHenry Hub gas price(b)
($/mmBtu) 2.23 2.64 2.91 2.67 2.90UK Gas – National Balancing Point (p/therm) 27.46 31.53 64.46 35.70 58.83
(a) Based on sales of consolidated subsidiaries only – this excludes equity-accounted entities.(b) Henry Hub First of Month Index.
BP p.l.c. Group results Third quarter and nine months 2019
31
Exchange rates
Third Second Third Nine Ninequarter quarter quarter months months
2019 2019 2018 2019 2018$/£ average rate for the period 1.23 1.29 1.30 1.27 1.35$/£ period-end rate 1.23 1.27 1.31 1.23 1.31
$/€ average rate for the period 1.11 1.12 1.16 1.12 1.19$/€ period-end rate 1.09 1.14 1.17 1.09 1.17
Rouble/$ average rate for the period 64.64 64.58 65.54 65.06 61.52Rouble/$ period-end rate 64.32 63.09 65.76 64.32 65.76
Legal proceedingsFor a full discussion of the group’s material legal proceedings, see pages 296-298 of BP Annual Report and Form 20-F 2018, andpage 35 of BP p.l.c. Group results second quarter and half-year 2019.
BP p.l.c. Group results Third quarter and nine months 2019
32
GlossaryNon-GAAP measures are provided for investors because they are closely tracked by management to evaluate BP’s operatingperformance and to make financial, strategic and operating decisions. Non-GAAP measures are sometimes referred to as alternativeperformance measures.Capital expenditure is total cash capital expenditure as stated in the condensed group cash flow statement.
Consolidation adjustment – UPII is unrealized profit in inventory arising on inter-segment transactions.
Divestment proceeds are disposal proceeds as per the condensed group cash flow statement.
Effective tax rate (ETR) on replacement cost (RC) profit or loss is a non-GAAP measure. The ETR on RC profit or loss iscalculated by dividing taxation on a RC basis by RC profit or loss before tax. Information on RC profit or loss is provided below. BPbelieves it is helpful to disclose the ETR on RC profit or loss because this measure excludes the impact of price changes on thereplacement of inventories and allows for more meaningful comparisons between reporting periods. The nearest equivalent measureon an IFRS basis is the ETR on profit or loss for the period.
Fair value accounting effects are non-GAAP adjustments to our IFRS profit (loss). They reflect the difference between the way BPmanages the economic exposure and internally measures performance of certain activities and the way those activities aremeasured under IFRS. Further information on fair value accounting effects is provided on page 28.
Free cash flow is operating cash flow less net cash used in investing activities and lease liability payments included in financingactivities, as presented in the condensed group cash flow statement.
Gearing and net debt are non-GAAP measures. Net debt is calculated as finance debt, as shown in the balance sheet, plus the fairvalue of associated derivative financial instruments that are used to hedge foreign currency exchange and interest rate risks relatingto finance debt, for which hedge accounting is applied, less cash and cash equivalents. Gearing is defined as the ratio of net debt tothe total of net debt plus total equity. BP believes these measures provide useful information to investors. Net debt enables investorsto see the economic effect of finance debt, related hedges and cash and cash equivalents in total. Gearing enables investors to seehow significant net debt is relative to total equity. The derivatives are reported on the balance sheet within the headings ‘Derivativefinancial instruments’. The nearest equivalent GAAP measures on an IFRS basis are finance debt and finance debt ratio. Areconciliation of finance debt to net debt is provided on page 23.
We are unable to present reconciliations of forward-looking information for gearing to finance debt ratio, because withoutunreasonable efforts, we are unable to forecast accurately certain adjusting items required to present a meaningful comparableGAAP forward-looking financial measure. These items include fair value asset (liability) of hedges related to finance debt and cashand cash equivalents, that are difficult to predict in advance in order to include in a GAAP estimate.Hydrocarbons – Liquids and natural gas. Natural gas is converted to oil equivalent at 5.8 billion cubic feet = 1 million barrels.
Inorganic capital expenditure is a subset of capital expenditure and is a non-GAAP measure. Inorganic capital expenditurecomprises consideration in business combinations and certain other significant investments made by the group. It is reported on acash basis. BP believes that this measure provides useful information as it allows investors to understand how BP’s managementinvests funds in projects which expand the group’s activities through acquisition. Further information and a reconciliation to GAAPinformation is provided on page 26.
Inventory holding gains and losses represent the difference between the cost of sales calculated using the replacement cost ofinventory and the cost of sales calculated on the first-in first-out (FIFO) method after adjusting for any changes in provisions wherethe net realizable value of the inventory is lower than its cost. Under the FIFO method, which we use for IFRS reporting, the cost ofinventory charged to the income statement is based on its historical cost of purchase or manufacture, rather than its replacementcost. In volatile energy markets, this can have a significant distorting effect on reported income. The amounts disclosed represent thedifference between the charge to the income statement for inventory on a FIFO basis (after adjusting for any related movements innet realizable value provisions) and the charge that would have arisen based on the replacement cost of inventory. For this purpose,the replacement cost of inventory is calculated using data from each operation’s production and manufacturing system, either on amonthly basis, or separately for each transaction where the system allows this approach. The amounts disclosed are not separatelyreflected in the financial statements as a gain or loss. No adjustment is made in respect of the cost of inventories held as part of atrading position and certain other temporary inventory positions. See Replacement cost (RC) profit or loss definition below.
Glossary (continued)Liquids – Liquids for Upstream and Rosneft comprises crude oil, condensate and natural gas liquids. For Upstream, liquids alsoincludes bitumen.
Net debt including leases is a non-GAAP measure. Net debt including leases is calculated as net debt plus lease liabilities, less thenet amount of partner receivables and payables relating to leases entered into on behalf of joint operations. BP believes thismeasure provides useful information to investors as it enables investors to understand the impact of the group’s lease portfolio onnet debt. The nearest equivalent GAAP measure on an IFRS basis is finance debt. A reconciliation of finance debt to net debtincluding leases is provided on page 23.
Net wind generation capacity is the sum of the rated capacities of the assets/turbines that have entered into commercial operation,including BP’s share of equity-accounted entities.
Non-operating items are charges and credits included in the financial statements that BP discloses separately because it considerssuch disclosures to be meaningful and relevant to investors. They are items that management considers not to be part of underlyingbusiness operations and are disclosed in order to enable investors better to understand and evaluate the group’s reported financialperformance. Non-operating items within equity-accounted earnings are reported net of incremental income tax reported by theequity-accounted entity. An analysis of non-operating items by region is shown on pages 7, 9 and 11, and by segment and type isshown on page 27.
Operating cash flow is net cash provided by (used in) operating activities as stated in the condensed group cash flow statement.When used in the context of a segment rather than the group, the terms refer to the segment’s share thereof.
Operating cash flow excluding Gulf of Mexico oil spill payments is a non-GAAP measure. It is calculated by excluding post-taxoperating cash flows relating to the Gulf of Mexico oil spill from net cash provided by operating activities as reported in thecondensed group cash flow statement. BP believes net cash provided by operating activities excluding amounts related to the Gulf ofMexico oil spill is a useful measure as it allows for more meaningful comparisons between reporting periods. The nearest equivalentmeasure on an IFRS basis is net cash provided by operating activities.
Organic capital expenditure is a subset of capital expenditure and is a non-GAAP measure. Organic capital expenditure comprisescapital expenditure less inorganic capital expenditure. BP believes that this measure provides useful information as it allowsinvestors to understand how BP’s management invests funds in developing and maintaining the group’s assets. An analysis oforganic capital expenditure by segment and region, and a reconciliation to GAAP information is provided on page 26.
We are unable to present reconciliations of forward-looking information for organic capital expenditure to total cash capitalexpenditure, because without unreasonable efforts, we are unable to forecast accurately the adjusting item, inorganic capitalexpenditure, that is difficult to predict in advance in order to derive the nearest GAAP estimate.Production-sharing agreement (PSA) is an arrangement through which an oil and gas company bears the risks and costs ofexploration, development and production. In return, if exploration is successful, the oil company receives entitlement to variablephysical volumes of hydrocarbons, representing recovery of the costs incurred and a stipulated share of the production remainingafter such cost recovery.
Readily marketable inventory (RMI) is inventory held and price risk-managed by our integrated supply and trading function (IST)which could be sold to generate funds if required. It comprises oil and oil products for which liquid markets are available andexcludes inventory which is required to meet operational requirements and other inventory which is not price risk-managed. RMI isreported at fair value. Inventory held by the Downstream fuels business for the purpose of sales and marketing, and all inventoriesrelating to the lubricants and petrochemicals businesses, are not included in RMI.
Paid-up RMI excludes RMI which has not yet been paid for. For inventory that is held in storage, a first-in first-out (FIFO) approach isused to determine whether inventory has been paid for or not. Unpaid RMI is RMI which has not yet been paid for by BP. RMI, RMI atfair value, Paid-up RMI and Unpaid RMI are non-GAAP measures. Further information is provided on page 29.Realizations are the result of dividing revenue generated from hydrocarbon sales, excluding revenue generated from purchasesmade for resale and royalty volumes, by revenue generating hydrocarbon production volumes. Revenue generating hydrocarbonproduction reflects the BP share of production as adjusted for any production which does not generate revenue. Adjustments mayinclude losses due to shrinkage, amounts consumed during processing, and contractual or regulatory host committed volumes suchas royalties.
Refining availability represents Solomon Associates’ operational availability for BP-operated refineries, which is defined as thepercentage of the year that a unit is available for processing after subtracting the annualized time lost due to turnaround activity andall planned mechanical, process and regulatory downtime.
The Refining marker margin (RMM) is the average of regional indicator margins weighted for BP’s crude refining capacity in eachregion. Each regional marker margin is based on product yields and a marker crude oil deemed appropriate for the region. Theregional indicator margins may not be representative of the margins achieved by BP in any period because of BP’s particular refineryconfigurations and crude and product slate.
BP p.l.c. Group results Third quarter and nine months 2019
33

Glossary (continued)Replacement cost (RC) profit or loss reflects the replacement cost of inventories sold in the period and is arrived at by excludinginventory holding gains and losses from profit or loss. RC profit or loss for the group is not a recognized GAAP measure. BP believesthis measure is useful to illustrate to investors the fact that crude oil and product prices can vary significantly from period to periodand that the impact on our reported result under IFRS can be significant. Inventory holding gains and losses vary from period toperiod due to changes in prices as well as changes in underlying inventory levels. In order for investors to understand the operatingperformance of the group excluding the impact of price changes on the replacement of inventories, and to make comparisons ofoperating performance between reporting periods, BP’s management believes it is helpful to disclose this measure. The nearestequivalent measure on an IFRS basis is profit or loss attributable to BP shareholders. A reconciliation to GAAP information isprovided on page 1. RC profit or loss before interest and tax is the measure of profit or loss that is required to be disclosed for eachoperating segment under IFRS.
RC profit or loss per share is a non-GAAP measure. Earnings per share is defined in Note 8. RC profit or loss per share iscalculated using the same denominator. The numerator used is RC profit or loss attributable to BP shareholders rather than profit orloss attributable to BP shareholders. BP believes it is helpful to disclose the RC profit or loss per share because this measureexcludes the impact of price changes on the replacement of inventories and allows for more meaningful comparisons betweenreporting periods. The nearest equivalent measure on an IFRS basis is basic earnings per share based on profit or loss for theperiod attributable to BP shareholders.
Reported recordable injury frequency measures the number of reported work-related employee and contractor incidents thatresult in a fatality or injury per 200,000 hours worked. This represents reported incidents occurring within BP’s operational HSSEreporting boundary. That boundary includes BP’s own operated facilities and certain other locations or situations.
Solomon availability – See Refining availability definition.
Tier 1 and tier 2 process safety events – Tier 1 events are losses of primary containment from a process of greatest consequence– causing harm to a member of the workforce, damage to equipment from a fire or explosion, a community impact or exceedingdefined quantities. Tier 2 events are those of lesser consequence. These represent reported incidents occurring within BP’soperational HSSE reporting boundary. That boundary includes BP’s own operated facilities and certain other locations or situations.
Underlying effective tax rate (ETR) is a non-GAAP measure. The underlying ETR is calculated by dividing taxation on anunderlying replacement cost (RC) basis by underlying RC profit or loss before tax. Taxation on an underlying RC basis is taxation ona RC basis for the period adjusted for taxation on non-operating items and fair value accounting effects. Information on underlyingRC profit or loss is provided below. BP believes it is helpful to disclose the underlying ETR because this measure may help investorsto understand and evaluate, in the same manner as management, the underlying trends in BP’s operational performance on acomparable basis, period on period. The nearest equivalent measure on an IFRS basis is the ETR on profit or loss for the period.
We are unable to present reconciliations of forward-looking information for underlying ETR to ETR on profit or loss for the period,because without unreasonable efforts, we are unable to forecast accurately certain adjusting items required to present a meaningfulcomparable GAAP forward-looking financial measure. These items include the taxation on inventory holding gains and losses, non-operating items and fair value accounting effects, that are difficult to predict in advance in order to include in a GAAP estimate.Underlying production – 2019 underlying production, when compared with 2018, is production after adjusting for BPX Energy,other acquisitions and divestments, and entitlement impacts in our production-sharing agreements.
Underlying RC profit or loss is RC profit or loss after adjusting for non-operating items and fair value accounting effects. UnderlyingRC profit or loss and adjustments for fair value accounting effects are not recognized GAAP measures. See pages 27 and 28 foradditional information on the non-operating items and fair value accounting effects that are used to arrive at underlying RC profit orloss in order to enable a full understanding of the events and their financial impact. BP believes that underlying RC profit or loss is auseful measure for investors because it is a measure closely tracked by management to evaluate BP’s operating performance and tomake financial, strategic and operating decisions and because it may help investors to understand and evaluate, in the same manneras management, the underlying trends in BP’s operational performance on a comparable basis, period on period, by adjusting for theeffects of these non-operating items and fair value accounting effects. The nearest equivalent measure on an IFRS basis for thegroup is profit or loss attributable to BP shareholders. The nearest equivalent measure on an IFRS basis for segments is RC profit orloss before interest and taxation. Underlying earnings on page 1 refer to underlying RC profit for the group. A reconciliation to GAAPinformation is provided on page 1.
Underlying RC profit or loss per share is a non-GAAP measure. Earnings per share is defined in Note 8. Underlying RC profit orloss per share is calculated using the same denominator. The numerator used is underlying RC profit or loss attributable to BPshareholders rather than profit or loss attributable to BP shareholders. BP believes it is helpful to disclose the underlying RC profit orloss per share because this measure may help investors to understand and evaluate, in the same manner as management, theunderlying trends in BP’s operational performance on a comparable basis, period on period. The nearest equivalent measure on anIFRS basis is basic earnings per share based on profit or loss for the period attributable to BP shareholders.
BP p.l.c. Group results Third quarter and nine months 2019
34
Glossary (continued)Upstream plant reliability (BP-operated) is calculated taking 100% less the ratio of total unplanned plant deferrals divided byinstalled production capacity. Unplanned plant deferrals are associated with the topside plant and where applicable the subseaequipment (excluding wells and reservoir). Unplanned plant deferrals include breakdowns, which does not include Gulf of Mexicoweather related downtime.
Upstream unit production cost is calculated as production cost divided by units of production. Production cost does not include advalorem and severance taxes. Units of production are barrels for liquids and thousands of cubic feet for gas. Amounts disclosed arefor BP subsidiaries only and do not include BP’s share of equity-accounted entities.
Working capital - Change in working capital is movements in inventories and other current and non-current assets and liabilities asreported in the condensed group cash flow statement. Change in working capital adjusted for inventory holding gains/losses is a non-GAAP measure. It is calculated by adjusting for inventory holding gains/losses reported in the period and this therefore representswhat would have been reported as movements in inventories and other current and non-current assets and liabilities, if the startingpoint in determining net cash provided by operating activities had been replacement cost profit rather than profit for the period. Thenearest equivalent measure on an IFRS basis for this is movements in inventories and other current and non-current assets andliabilities. In the context of describing operating cash flow excluding Gulf of Mexico oil spill payments, change in working capital alsoexcludes movements in inventories and other current and non-current assets and liabilities relating to the Gulf of Mexico oil spill. Seepage 30 for further details.
BP utilizes various arrangements in order to manage its working capital including discounting of receivables and, in the supply andtrading business, the active management of supplier payment terms, inventory and collateral.
BP p.l.c. Group results Third quarter and nine months 2019
35
Cautionary statement In order to utilize the ‘safe harbor’ provisions of the United States Private Securities Litigation Reform Act of 1995 (the ‘PSLRA’) andthe general doctrine of cautionary statements, BP is providing the following cautionary statement: The discussion in this resultsannouncement contains certain forecasts, projections and forward-looking statements - that is, statements related to future, not pastevents and circumstances - with respect to the financial condition, results of operations and businesses of BP and certain of theplans and objectives of BP with respect to these items. These statements may generally, but not always, be identified by the use ofwords such as ‘will’, ‘expects’, ‘is expected to’, ‘aims’, ‘should’, ‘may’, ‘objective’, ‘is likely to’, ‘intends’, ‘believes’, ‘anticipates’, ‘plans’,‘we see’ or similar expressions. In particular, the following, among other statements, are all forward looking in nature: expectationsregarding the expected quarterly dividend payment and timing of such payment and the suspension of the scrip dividend alternativeand introduction of dividend reinvestment plans; expectations regarding the underlying effective tax rate in 2019; expectationsregarding 2019 organic capital expenditure and depreciation, depletion and amortization charges; expectations that net debt levelswill trend down over time and that gearing will remain above the target 20-30% range before reducing towards the middle of therange in 2020; expectations regarding share buybacks, including to offset the impact of dilution from the scrip program; plans andexpectations relating to divestments and disposals, including that around $10 billion of divestment transactions will be announced bythe end of 2019; plans and expectations regarding the announced sale of BP’s interests in Alaska to a subsidiary of Hilcorp Energy,including the completion of the sale and expected timing and proceeds thereof; plans and expectations with respect to the jointventure in India with Reliance Industries Limited; plans and expectations regarding BP’s low-carbon business, including with regardto BP’s joint venture with DiDi to develop an electric vehicle charging network in China and to the installation of 400 ultra-fastchargers at BP Chargemaster’s UK retail sites; plans and expectations to run jointly branded workshop pilots in China and the USwith Bosch; plans and expectations regarding BP Infinia; plans to deploy continuous measurement of methane emissions on allfuture major operated oil and gas processing projects; expectations regarding Upstream fourth-quarter 2019 reported production,seasonal maintenance and turnaround activities; expectations regarding Downstream fourth-quarter 2019 refining margins andturnaround activity; expectations regarding the amount of the Rosneft dividend; plans and expectations regarding Lightsource BP,including to develop a solar facility in Colorado and negotiate power purchase agreements to supply customers across Spain’sZaragoza province; plans and expectations with respect to the joint venture between BP’s Brazilian biofuels business and Bunge,including the completion of the joint venture transaction and the timing thereof; expectations regarding the Other businesses andcorporate 2019 average quarterly charges excluding non-operating items; and expectations with respect to the amount of futurepayments relating to the Gulf of Mexico oil spill. By their nature, forward-looking statements involve risk and uncertainty because theyrelate to events and depend on circumstances that will or may occur in the future and are outside the control of BP. Actual resultsmay differ materially from those expressed in such statements, depending on a variety of factors, including: the specific factorsidentified in the discussions accompanying such forward-looking statements; the receipt of relevant third party and/or regulatoryapprovals; the timing and level of maintenance and/or turnaround activity; the timing and volume of refinery additions and outages;the timing of bringing new fields onstream; the timing, quantum and nature of certain acquisitions and divestments; future levels ofindustry product supply, demand and pricing, including supply growth in North America; OPEC quota restrictions; PSA effects;operational and safety problems; potential lapses in product quality; economic and financial market conditions generally or in variouscountries and regions; political stability and economic growth in relevant areas of the world; changes in laws and governmentalregulations; regulatory or legal actions including the types of enforcement action pursued and the nature of remedies sought orimposed; the actions of prosecutors, regulatory authorities and courts; delays in the processes for resolving claims; amountsultimately payable and timing of payments relating to the Gulf of Mexico oil spill; exchange rate fluctuations; development and use ofnew technology; recruitment and retention of a skilled workforce; the success or otherwise of partnering; the actions of competitors,trading partners, contractors, subcontractors, creditors, rating agencies and others; our access to future credit resources; businessdisruption and crisis management; the impact on our reputation of ethical misconduct and non-compliance with regulatoryobligations; trading losses; major uninsured losses; decisions by Rosneft’s management and board of directors; the actions ofcontractors; natural disasters and adverse weather conditions; changes in public expectations and other changes to businessconditions; wars and acts of terrorism; cyber-attacks or sabotage; and other factors discussed elsewhere in this report, and under“Risk factors” in BP Annual Report and Form 20-F 2018 as filed with the US Securities and Exchange Commission.
Contacts
London Houston
Press Office David Nicholas Brett Clanton+44 (0)20 7496 4708 +1 281 366 8346
Investor Relations Craig Marshall Brian Sullivanbp.com/investors +44 (0)20 7496 4962 +1 281 892 3421
BP p.l.c. Group results Third quarter and nine months 2019
36