Embed Size (px)
Citation preview

FACTORS ASSOCIATED WITH EXERCISE IN REINED COW HORSES COMPETING IN
BOXING AND FENCING CLASSES
by
KATHRYN MARIE CAMPBELL
(Under the Direction of Kari K. Turner)
ABSTRACT
Currently there are no reports on the exercise metabolics of horses performing reined cow
work. Fifteen privately owned quarter horses and paint horses were used for this study. The
horses were placed into a group based on the type of competition they were competing in. Box
group (n=8) included horses performing a reining pattern followed by box cow work only. The
Box-Fence group (n=7) included horses that were performing a reining pattern followed by box
and fence cow work. Blood samples were obtained from the jugular vein at rest, immediately
after warm-up but before beginning exercise, immediately after exercise, and 15 minutes after
recovery. Significant changes (P<0.05) between the two groups were observed immediately
after exercise in blood lactate, pH, glucose, hematocrit, hemoglobin, bicarbonate, base excess
extracellular fluid, Na+, K+, Cl- and anion gap. Results indicate that the Box horses primarily
exercised under aerobic conditions while Box-Fence horses relied on a portion of anaerobic
metabolism and exercised at higher intensities than the Box horses.
Additional research was conducted on four privately owned quarter horses (n=4) to
isolate exercise workload associated with cow work. Blood samples were obtained from the
jugular vein at rest, 5 minutes after completion of reining pattern, 5 minutes after completion of
cow work (both box and fence), and 10 minutes after the previous sample. Significant changes
(P<0.05) were observed immediately after cow work in blood lactate, pH, glucose, hematocrit,

hemoglobin, K+, Cl-, anion gap, total carbon dioxide, and bicarbonate. Results indicated that the
addition of cow work resulted in horses relying on a significant portion of anaerobic respiration.
INDEX WORDS: Equine, Horses, Reined Cow Horse, Exercise Metabolics, Cow Work

FACTORS ASSOCIATED WITH EXERCISE IN REINED COW HORSES COMPETING IN
BOXING AND FENCING CLASSES
by
Kathryn Marie Campbell
B.S., Virginia Tech, 2006
A Thesis Submitted to the Graduate Faculty of The University of Georgia in Partial Fulfillment
of the Requirements for the Degree
MASTERS OF SCIENCE
ATHENS, GEORGIA
2008

© 2008
Kathryn Marie Campbell
All Rights Reserved

FACTORS ASSOCIATED WITH EXERCISE IN REINED COW HORSES COMPETING IN
BOXING AND FENCING CLASSES
by
KATHRYN MARIE CAMPBELL
Major Professor: Kari K. Turner
Committee: Gary L. Heusner Kylee J. Johnson
T.D. Pringle
Electronic Version Approved:
Maureen Grasso Dean of the Graduate School The University of Georgia August 2008

DEDICATION
I would like to dedicate this work to my family for their continuous love and support. To
my parents, Mark and Elizabeth for exposing me to agriculture and encouraging my interests and
education in the animal sciences. Also, for instilling in me a respect for myself and the
acknowledgement that I can do anything I set my mind to. I have learned by example as you
taught me more about life, hard work, and the value of an education than you know. To my
sisters, Emily and Maggie for always being there for me when it counted. To Chris Jackson for
his unwavering love, encouragement, support, and belief in my abilities. All of you mean the
world to me. I love you all. Thank you for everything and I dedicate this work to you all.
iv

ACKNOWLEDGMENTS
I would like to acknowledge and thank my major professor, Dr. Kari Turner for this
wonderful opportunity and for the effort put into making this happen. I would also like to thank
Dr. Kylee Johnson for her support and help along the way. Other members of my committee I
would like to thank are Dr. T.D. Pringle, and Dr. Gary Heusner, for their assistance. None of
this would have been possible without you all.
I would also like to thank the multiple friends that I have made at UGA over the past two
years. Paul Cline and Edith Hayden, thank you for all of the time and effort that you contributed
to my project and for being wonderful friends. To Robin Harvey, for being my mom away from
home, for always lending an ear, and for taking care of all kinds of paperwork for me. To Neely
Heidorn, and Lucy Ray for being amazing supportive friends and helping me both inside and
outside the classroom. Also, thank you to the many other friends I have made over the past two
years.
I would also like to thank Andra Nelson for helping me become statistically coherent and
the many other faculty members that helped mold me as a student.
I would also like to thank the faculty and staff at Virginia Tech for the excellent
educational foundation and strong background in practical as well as academic aspects of equine
science. I am also very appreciative to all other friends I and family that have helped shape me
as a person.
v

TABLE OF CONTENTS
ACKNOWLEDGEMENTS………………………………………………………………………v
LIST OF TABLES..…………………………………………………………………………….viii
LIST OF FIGURES………………………………………………………………………..……...x
CHAPTER
1 INTRODUCTION.……..…………………………………………………………1
Literature Cited…...……………………………………………………….3
2 REVIEW OF LITERATURE.…………………………………………………….4
Aerobic Exercise…………………………………………………………..4
Anaerobic Exercise………………………………………………………..5
Glucose……………………………………………………………………8
Blood Lactate and Exercise Intensity……………………………………..9
Heart Rate………………………………………………………………..10
Hematocrit………………………………………………………………..12
Acid-Base Levels………………………………………………………...14
Electrolytes………………………………………………………………17
Muscle Contractions……...……………………………………………...22
Muscle Fibers…...………………………………………………………..24
Literature Cited....………………………………………………………..29
3 FACTORS ASSOCIATED WITH EXERCISE IN REINED COW HORSES
COMPETING IN BOXING AND FENCING CLASSES
Abstract…………………………………………………………………..34
Introduction………………………………………………………………36
vi

Materials and Methods…………………………………………………...39
Results……………………………………………………………………43
Discussion………………………………………………………………..47
Literature Cited……….……………………...…………………………..56
4 FACTORS ASSOCIATED WITH COW WORK EXERCISE AFTER
COMPLETION OF A REINING PATTERN IN REINED COW
HORSES…………………………..…………..…..……………………………..59
Abstract…………………………………………………………………..59
Introduction………………………………………………………………61
Materials and Methods…………………………………………………...65
Results……………………………………………………………………68
Discussion………………………………………………………………..71
Literature cited…………………………………………………………...77
5 CONCLUSIONS...………………………………………………………………79
HORSE OWNER QUESTIONNAIRE…...……………………………………………...83
NRCHA REINING PATTERN #5………………………………………………………84
NRCHA REINING PATTERN #3………………………………………………………85
vii

LIST OF TABLES
Table 1: Muscle fiber type changes in response to endurance training and detraining………….27
Table 2: Muscle fiber response to sprint training in thoroughbred horses…………………..…..28
Table 3: Blood lactate, pH, and glucose concentration by time effects (P < 0.05) as a result of
workload in horses performing box cow work (Box) and box cow work followed by
fence work (Box Fence) in a reined cow horse competition..…………………………43
Table 4: Blood HCO3-, TCO2, pCO2, and BEecf concentration by time effects (P<0.05) as a
result of workload in horses performing box cow work (Box) and Box work followed
by fence work (Box Fence) in a reined cow horse competition..……………………...44
Table 5: Blood hematocrit and hemoglobin by time effects (P < 0.05) as a result of workload in
horses performing box cow work (Box) and box cow work followed by fence work
(Box Fence) in a reined cow horse competition ………………………………………45
Table 6: Blood Na+, K+, Cl-, and anion gap concentration by time effects (P < 0.05) on workload
in horses performing box cow work (Box) and box cow work followed by fence work
(Box Fence) in a reined cow horse competition……………………………………….46
Table 7: Exercise duration (splits) for each exercise phase in Box and Box-Fence groups……..46
Table 8: Blood lactate, pH, and glucose concentration by time effects (P < 0.05) as a result of
workload in reined cow horses performing a reining pattern followed by box and fence
cow work …………........................................................................................................68
Table 9: Blood HCO3-, TCO2, and pCO2 concentration by time effects (P < 0.05) as a result of
workload in reined cow horses performing a reining pattern followed by box and fence
cow work ………………................................................................................................68
viii

Table 10: Blood hematocrit and hemoglobin by time effects (P < 0.05) as a result of workload in
reined cow horses performing a reining pattern followed by box and fence cow
work……………………………………………………………………………………69
Table 11: Blood Na+, K+, Cl-, and anion gap concentration by time effects (P < 0.05) as a result
of workload in reined cow horses performing a reining pattern followed by box and
fence cow work ……..…………………………………………………………………69
ix

LIST OF FIGURES
Figure 1: Conversion of lactate to pyruvate and pyruvate to lactate via enzyme lactate
dehydrogenase.…………………………………………………………………….6
Figure 2: Bicarbonate buffer system……………………………………………………………..16
x

CHAPTER 1
INTRODUCTION
Several studies have previously investigated the workload of multiple horse riding
disciplines, primarily of racehorses (Lucke and Hall, 1980; Rose et al., 1977; Rose et al., 1980;
Snow et al., 1982) and jumping horses (Aguilera-Tejero et al., 2000; Art et al., 1990; Sloet van
Oldruitenborgh-Oosterbaan et al., 2006). However, there is limited information regarding the
demands of exercise in stock horse disciplines. To the author’s knowledge there has been no
investigation evaluating the workload required of exercising reined cow horses.
This study was performed in an effort to better understand the exercise metabolics
involved with reined cow horses. This study was designed to also evaluate the difference in
exercise workloads in horses performing only boxed cow work compared to horses performing
both boxed and fenced cow work. Determination of workload in reined cow horses performing
reining patterns and cow work could potentially be used to modify training protocols to better fit
the horse’s performance requirements. This study specifically was concerned with gathering
information that determines the workload of reined cow horses based on known workload
parameters such as blood lactate, blood glucose, electrolyte levels, and other metabolic
byproducts. Data collected will indicate whether the horse is functioning more aerobically or
more anaerobically under specific exercises. As a result, training protocols can be altered to
adapt the horse’s metabolic and muscular functions. Preparing horses to compete working
primarily under anaerobic conditions would require incorporating sprint work, hills, and other
fast paced short duration exercises into training. When training a horse to compete primarily
under aerobic conditions exercise training would require incorporating exercises that were
performed at a slower speed for longer periods of time. These training methods allow the muscle
1

fibers that are capable of adapting to either aerobic or anaerobic workloads to acclimate to the
required workload. Ultimately, a modified training protocol for horses based on what they are
specifically competing in could result in an overall increase in performance level within a given
discipline by prolonging the onset of fatigue.
2

LITERATURE CITED
Aguilera-Tejero, E., J.C. Estepa, I. Lopez, S. Bas, R. Mayer-Valor, and M. Rodriguez. 2000. Quantitative analysis of acid-base balance in show jumpers before and after exercise. Res Vet Sci 68: 103-108.
Art, T., H. Amory, D. Desmecht, and P. Lekeux. 1990. Effect of show jumping on heart rate, blood lactate and other plasma biochemical values. Equine Vet J Suppl: 78-82.
Lucke, J. N., and G. N. Hall. 1980. Further studies on the metabolic effects of long distance riding: Golden horseshoe ride 1979. Equine Vet J 12: 189-192.
Rose, R. J., K. S. Arnold, S. Church, and R. Paris. 1980. Plasma and sweat electrolyte concentrations in the horse during long distance exercise. Equine Vet J 12: 19-22.
Rose, R. J., R. A. Purdue, and W. Hensley. 1977. Plasma biochemistry alterations in horses during an endurance ride. Equine Vet J 9: 122-126.
Sloet van Oldruitenborgh-Oosterbaan, M. M., A. J. Spierenburg, and E. T. van den Broek. 2006. The workload of riding-school horses during jumping. Equine Vet J Suppl: 93-97.
Snow, D. H., M. G. Kerr, M. A. Nimmo, and E. M. Abbott. 1982. Alterations in blood, sweat, urine and muscle composition during prolonged exercise in the horse. Vet Rec 110: 377-384.
3

CHAPTER 2
FACTORS ASSOCIATED WITH EXERCISE IN REINED COW HORSES COMPETING IN
BOX COW WORK AND BOX-FENCE COW WORK.
REVIEW OF LITERATURE
Aerobic Exercise
While at rest or under low intensity exercise aerobic respiration serves as the primary
source of exercise metabolism. Under aerobic metabolic conditions there are no constraints on
oxygen availability, and all energy pathways associated with aerobic respiration are capable of
meeting the demands of exercise. As a result aerobic respiration is highly efficient. Aerobic
respiration produces energy by utilizing three systems known as glycolysis, the tricarboxylic acid
(TCA) cycle, and electron transport chain. The primary source of energy in the body during
exercise is the carbohydrate glucose which is utilized by glycolysis and results in the net
production of two adenosine triphosphate (ATP), two nicotinamide adenine dinucleotide hydride
(NADH), and two pyruvate molecules (Levintow, 1961; Morell and Froesch, 1973; Paul, 1965).
Pyruvate or pyruvic acid is modified into acetyl CoA by the enzyme phosphodehydrogenase
(PDH) and continues into the TCA cycle (Reitzer et al., 1979). The TCA cycle is triggered
primarily by nicotinamide adenine dinucleotide (NAD+) availability. Ultimately, flavin adenine
dinucleotide (FAD), NAD+, water (H2O), guanine diphosphate (GDP), and inorganic phosphate
(Pi) are required for the TCA cycle to proceed (McComas, 1996). The primary function of the
TCA cycle is not to produce significant amounts of energy in the form of adenosine triphosphate
(ATP), or guanine triphosphate (GTP) but instead yield NADH and FADH2. Each TCA cycle
produces three NADH and one FADH2. These byproducts of the TCA cycle are utilized in the
4

electron transport chain where significant amounts of energy in the form of ATP are synthesized
(McComas, 1996) .
Flavin adenine dinucleotide and NADH are initially received by hydrogen receptor
molecules along the electron transport chain. After FADH2 and NADH are reduced to FAD and
NAD+ they are passed along a series of molecules in the mitochondria(Garrett and Grisham,
1994). As electrons are passed along the respiratory chain their energy levels become
progressively lower. Energy that is released from FAD and NAD+ is used to actively transport
protons across the inner mitochondrial membrane against the concentration gradient. Protons
continue to become more concentrated in the intermembrane space resulting in mitochondrial
matrix having a surplus of negative charges. Protons then diffuse back across the membrane and
move down the electrochemical gradient. The re-entry of protons to the mitochondrial matrix is
regulated at the F-complex of the inner mitochondria and is coupled with the enzyme ATP
synthase which is responsible for phosphorylating ADP to form ATP(Garrett and Grisham,
1994). Oxygen is utilized as a hydrogen acceptor, and is reduced to water (H2O). Without the
presence of oxygen a build up of hydrogen protons would occur within the mitochondrial matrix
causing the proton gradient to be disrupted. The consequences of a disrupted proton gradient are
a decrease in ATP production.
Anaerobic Exercise
While at rest or during low levels of exercise aerobic conditions are the predominate form
of exercise metabolism in the body. Although lactic acid production is due to anaerobic
respiration, under primarily aerobic conditions low levels of anaerobic metabolism are taking
place. This results in a low level of net lactate production by skeletal muscles. The net lactate is
released into the blood where it is either oxidized to carbon dioxide (CO2) or transformed to
5

glucose (Shulman, 2005). Carbon dioxide is released from the muscles as a byproduct of
exercise metabolism and is removed by red blood cells (RBC). Red blood cells bind and
transport CO2 to the lungs to be released during respiration.
Gluconeogenesis takes place in the liver and serves as the primary system of which
lactate levels are balanced within the body under aerobic conditions. Gluconeogenesis balances
low levels of lactate in the body by oxidizing lactate to form glucose (Brooks, 1985). Lactate is
removed from skeletal muscle during exercise and shuttled into the liver by the circulatory
system where it is then converted to pyruvate by the enzyme lactate dehyrdogenase (Figure 1).
The resulting pyruvate then continues through gluconeogenesis, consuming one ATP to
ultimately reform glucose. Glucose is then shuttled by the circulatory system out of the liver
back into the muscle to be utilized as a source of energy in glycolysis (Garrett and Grisham,
1994).
PPyyrruuvvaattee ++ NNAADDHH ++ HH+ + LLaaccttaattee ++ NNAADD+ +Lactate dehydrogenase
Figure: 1 : Conversion of lactate to pyruvate and pyruvate to lactate via enzyme lactate dehydrogenase.
As exercise intensity increases to a more rapid pace or a sprint muscles increasingly rely
on anaerobic conditions instead of aerobic conditions. Anaerobic metabolism is associated with
a lack of oxygen in the body. In some instances a lack of oxygen is cause by an increase in
exercise intensity as the body cannot import enough oxygen to accommodate the needs of
exercising muscle cells. Regardless of oxygen intake, as exercise intensity increases the TCA
cycle and ETC cannot convert molecules at a rapid enough rate to produce adequate amounts of
ATP. The lack of adequate ATP production is due to limited oxidative capacity or lack of
mitochondria size, number of mitochondria, and more importantly limited number of enzymes
and F-complexes. As a result pyruvic acid cannot be converted to acetyl CoA to proceed into the
6

TCA cycle followed by the ETC. Glycolysis then becomes the primary energy producing
mechanism. Pyruvic acid, the end product of glycolysis is converted to lactic acid as a byproduct
of muscle exercise metabolism and passes into the circulatory system. While the liver is capable
of neutralizing low levels of lactate in the blood by way of gluconeogenesis it is not capable of
performing gluconeogenesis at a rapid enough rate to support the high levels of lactate that is
produced in association with sprint work, running on an incline, pulling and other high intensity
exercises. The lack of pace at which the TCA and ETC cycles can function under high exercise
intensities rapidly hinders the rate of gluconeogenesis. Gluconeogenesis is slowed by anaerobic
conditions because of the lack of NAD+ or the imbalance of the NADH/NAD+ ratio (Bentley et
al., 2007). As the NADH/NAD+ ratio continues to increase, glycolysis becomes the primary
source of energy (Garrett and Grisham, 1994). Glycolysis and the TCA cycle regularly convert
NAD+ to NADH under low intensity exercising conditions; however, under anaerobic exercise
the regeneration of NAD+ from NADH does not occur at a rapid enough rate within the electron
transport chain. As a result there is an overall lack of NAD+ availability which results in the
cessation of gluconeogenesis, a slowed rate of glycolysis, and ultimately the build up of lactate
in the blood (hence the term ‘lactate threshold’) (Poso, 2002). The resulting lactate accumulation
is identified as the ‘lactate’ or ‘anaerobic threshold’ and within the horse is considered to occur
at a blood lactate concentration of 4mmol/L (Lindner, 1996; Werkmann, 1996). Once blood
lactate concentration reaches the lactate threshold a steady state is reached where lactate
utilization and lactate production are equal (Kindermann et al., 1979). As exercise intensity
increases and lactate production exceeds its utilization lactate begins to accumulate in the blood
above 4mmol/L as the horse is functioning under primarily anaerobic conditions (Courouce,
1999).
7

The conversion of pyruvate to lactate contributes to glycolysis and gluconeogenesis by
utilizing an NADH and producing an NAD+. As previously mentioned the functional ability of
both gluconeogenesis and glycolysis are hindered by a lack of NAD+. Once pyruvate is formed
as the end product of glycolysis it is converted to lactate under anaerobic conditions by enzyme
lactate dehydrogenase and NAD+ is produced. Therefore, production of lactate under anaerobic
metabolism promotes the continuation of glycolysis and gluconeogenesis (Katz and Sahlin,
1988).
Glucose
As previously mentioned glucose is initially utilized for energy in glycolysis. As a result
glucose is known to be the preferred source of energy for the majority of tissues within the body.
This highly demanded molecule is primarily derived from soluble carbohydrates that are
consumed in the diet. Both glucose and glycogen are derived from glucose 6-phosphate which is
an important intermediate in carbohydrate metabolism because of its ability to be converted into
glucose or stored as glycogen. Glycogen is the stored form of glucose and is maintained in the
form of glycogen until the body is in high demand of energy (Rhoades, 2003). Previous research
has illustrated that in horses there is a direct relationship between exercise intensity and blood
glucose changes during both anaerobic and aerobic exercise (Romijn et al., 1993). Endocrine
factors play an important role in exercise metabolism and are therefore important in the
regulation of glucose changes. These include but are not limited to counter-regulatory hormones
insulin, glucagon, epinephrine, and norepinephrine (Coggan, 1991).
Glucose availability is highly regulated by glycogenolysis and glycogenesis which are
both hormonally regulated. When glucose levels increase in the blood the pancreas reacts,
releasing insulin into the portal blood. Due to the liver’s extreme sensitivity it reacts first to the
8

change in blood insulin levels by removing about half of the insulin in the blood the first time it
travels through the liver. Insulin stimulates glycogenesis and suppresses glycogenolysis and
gluconeogenesis, lowering blood glucose. Conversely, under exercising conditions glucagon is
responsible for stimulating glycogenolysis and gluconeogenesis, resulting in an increase in blood
glucose levels (Coggan et al., 1995). Epinephrine is also responsible for stimulating
glycogenolysis in proportion to excitation intensity. Thus, during exercise when epinephrine is
released glycogenolysis is stimulated, suppressing insulin, stimulating glucagon and
glycogenolysis, and ultimately releasing glucose into the blood (Rhoades, 2003).
Other than glucose, another source of energy utilized at the onset of exercise is
Phosphocreatine (PCr). PCr in combination with the enzyme creatine kinase (CK) is utilized to
donate the inorganic phosphate (Pi) to ADP to produce ATP. ATP production from PCr occurs
during the lapse in ATP production that occurs at the onset of exercise. However, the amount of
energy that can be produced from PCr is rather small and can only maintain ATP production for
a very short period of time (approximately 10 seconds). ATP production increases after the
initial onset of exercise utilizing other metabolic processes to meet the energy demands. If any
remaining stores of phosphocreatine (PCr) are present intramuscularly during anaerobic exercise
they will be used to produce ATP (Sahlin et al., 1998).
Blood Lactate and Exercise Intensity
Measuring blood lactate concentration is an accurate quantitative tool used to determine
not only the fitness level of the horse but in some cases to identify competition success (Trilk et
al., 2002). It has been observed by Sexton and Erickson (1990) that an increase in blood lactate
concentration is directly indicative of increased anaerobic workloads. This was determined as an
increase in treadmill elevation at the same speed resulted in an increase in blood lactate level.
9

The observed increase in blood lactate levels is a result of an increased recruitment of muscle
fibers that are dependent on anaerobic metabolism. During lighter, aerobic workloads there is a
lower level of anaerobic muscle fiber recruitment resulting in little to no blood lactate (Sexton
and Erickson, 1990). Blood lactate levels in horses show muscle fiber recruitment patterns which
are indicative of the workload placed on horses. It is possible to identify muscle fiber
recruitment patterns based on blood lactate levels by the varying oxidative capacity associated
with different muscle fibers. As exercises such as sprinting or running on an incline occur, fast
twitch type II glycolytic fibers are recruited for exercise. These type II fibers utilize glycogen
stores and are used to function primarily under anaerobic conditions. As a result of the anaerobic
conditions lactate begins to accumulate in larger volume from these muscle fibers.
It is also possible to correlate blood lactate concentration with exercise heart rate during
exercise tests and workload. This allows for assessment of the relative work intensity associated
with the onset of blood lactate accumulation. As previously discussed, blood lactate
accumulation is ultimately a result of an increased workload so high that the horse begins to
accumulate lactate in the blood that cannot be metabolized rapidly enough to maintain a steady
state (Courouce, 1999). Due to the increase in demand for oxygen in the body under anaerobic
metabolism heart rate increases and vasodilation occurs to increase blood flow rate by decreasing
blood pressure. The decrease in blood pressure occur in an attempt to circulate as much oxygen
bound RBC’s as possible to nourish exercising skeletal muscle throughout the body. Previous
studies in humans have correlated heart rate to blood lactate levels and workload based on this
principle and found that heart rate is a direct indicator of submaximal work level (Wilson, 1983;
Yoshida, 1984).
Heart Rate
10

Heart rate is a consistent factor that can be used to evaluate the workload of any animal.
This becomes especially pertinent to horses due to the large size of a horse’s heart. The large
heart size compared to body mass allows the horse to be capable of significantly increasing both
stroke volume and rate during strenuous exercise. This increase helps to circulate oxygen bound
RBC’s throughout the body to accommodate the demands of exercising muscle tissues and to
push carbon dioxide (a byproduct of respiration) to the lungs to be released (Weber et al., 1987).
Horses functioning under aerobic metabolism are capable of sustaining an elevated heart rate for
prolonged periods of time. However, the significantly higher stroke volume and heart rate that
are associated with anaerobic exercise cannot be sustained for prolonged periods of time
(Kinnunen et al., 2006). It has previously been demonstrated that heart rate response to an
increase in exercise workload is linear between 120 and 210 beats/min (Persson, 1974).
It has been determined that heart rate is also a linear function of oxygen consumption in
horses during submaximal exercise. This is because heart rate is driven by oxygen and carbon
dioxide levels in the blood (Freeman, 2008). Heart rate can also become elevated due to
excitement and pain, which is a result of the release of epinephrine. This particular regulation
mechanism occurs because of the increase in demand of oxygen required by exercising tissues.
Therefore, the heart is required to pump faster and with a larger stroke volume to provide
exercising tissues with as much oxygen as possible. A plateau in heart rate is recognized when
the relationship between heart rate and exercise intensity is graphed and the horse reaches a
steady state of work (Persson, 1983; Thornton, 1987).
Resting heart rate in a horse ranges from 32 to 45 beats per minute (Cardinet et al., 1963).
Maximum heart rates in standardbreds under maximal effort have been determined to range from
230 to 255 beats per minute with the absolute maximum predicted to be approximately 260 beats
11

per minute (Elsner, 1966). During aerobic exercise heart rates rise and plateau to accommodate
the requirements of the animal based on workload intensity or speed. During anaerobic exercise
heart rates rise and plateau again but to the maximum exercising heart rate sustainable by the
individual horse.
As previously discussed the anaerobic threshold in the horse is an excellent indicator of
fitness and exercise intensity. A heart rate range of 150 to 170 beats per minute is considered to
be the benchmark at which the horse begins to accumulate blood lactate and function primarily
under anaerobic conditions, or reach the anaerobic threshold. Any heart rate above this
parameter is considered to have surpassed the anaerobic threshold of 4mmol/L and accumulating
lactate in the blood (Freeman, 2008).
Heart rate can also be used to evaluate fitness level (Kinnunen et al., 2006). Despite
previous contradiction by Seeherman and Morris (1990) who found no difference in heart rate
maximum across various fitness levels, it has been shown that the maximum heart rate decreases
with decreasing levels of fitness (Vincen et al., 2006).
Hematocrit
Hematocrit is determined by the proportion of blood volume occupied by red blood cells
(RBC) in any given blood sample and is frequently evaluated when measuring exercise workload
in horses as it is indicative of exercise intensity. A feature that is unique to the physiology of the
horse is their capability to naturally increase their RBC concentration due to an external
excitation stimulus (Persson, 1969; Torten and Schalm, 1964). The horse’s spleen is responsible
for storing one third to one half of the total number of RBC’s within the horse (Householder,
2005). The term referring to the increase in RBC’s upon stimulus is ‘blood doping’.
Epinephrine is commonly associated with excitation and is responsible for inducing the splenic
12

contraction that results in a release of stored RBC’s into the circulatory system. Epinephrine is
released to varying degrees that are proportional to level of excitation or stimulus, ultimately,
resulting in a contraction of the spleen to the same degree of excitation. Splenic contraction
results in the spleen releasing stored RBC’s into the circulatory system (Jimenez et al., 1998).
The increased number of RBC’s in the body is used to increase oxygen uptake and delivery rate
to nourish exercising tissues. Ultimately, this feature allows the horse to circulate the maximum
amount of oxygen throughout the body during exercise.
As previously mentioned epinephrine is responsible for stimulating the contraction of the
spleen during excitation. Epinephrine is released from the adrenal cortex as a result of direct
sympathetic nervous stimulation causing a smooth muscle contraction resulting in an increase in
titre of circulating catecholamine’s particularly epinephrine. The sympathetic nervous system is
responsible for inducing relaxation upon stimulation from the autonomic nervous system in the
brain. The autonomic nervous system responds to external stimuli in proportion to the stimulus.
Excitation stimulus to the horse results in the sympathetic nervous system inducing relaxation of
the adrenal cortex and a release of epinephrine in proportion to the stimulus (Davies and
Withrington, 1973; Snow, 1979).
Splenic contraction occurs in proportion to epinephrine stimulus and is indicative of
workload and oxygen consumption. Sexton and Erickson (1990) found that ponies exercising at
varying elevations (1o, 4o, 7o) on treadmills illustrated a linear correlation between the increased
hematocrit and an increase in exercise intensity. This research also supported the contention that
increasing treadmill elevation results in graded increases in workload. The increase in RBC’s is
required to increase oxygen uptake from the lungs and increase the amount of oxygen that is
delivered and utilized in exercising muscle tissues throughout the body.
13

Although a splenic contraction is generally associated with exercise and fitness in the
horse it is not always a result of increased levels of exercise. A contraction of the spleen and a
resulting increase in hematocrit may occur upon any release of epinephrine from the adrenal
cortex. Splenic contractions vary between horses due to the individual varying release of
epinephrine from the adrenal cortex. As a result of varying splenic contractions complete
contractions of the spleen can occur, as well as incomplete contractions of the spleen, and in
some instances no contraction of the spleen. This is primarily due to lower sympathetic activity
at submaximal exercise (Art et al., 1990).
Acid-Base Levels
Changes in the acid-base status of the blood are associated with exercise duration and
intensity and as previously discussed, anaerobic exercise results in a build up of lactate in the
blood. The build up of lactate in the blood results in a decrease in blood pH or a change of the
acid-base status of the blood. Acidosis of the blood is known to correlate with impaired
performance during exercise. A primary reason for the correlation between impaired
performance during exercise and a decrease in blood pH is due to enzymes in glycolysis that
illustrate a pronounced pH sensitivity and are ultimately hindered as pH decreases (Sahlin et al.,
1998). The change of acid-base status of the blood is indicated by respiratory alkalosis, which
commonly results in hyperventilation. Respiratory alkalosis is considered to be an increase in
blood base level due to an increase in gas exchange within the lungs. In an effort to neutralize
the blood, hyperventilation occurs and is considered to be a state of breathing faster or deeper
and is associated with occurring under strenuous exercise conditions in an attempt to consume
enough oxygen to nourish all exercising tissues. There is a resulting build up of CO2 in the
14

blood due to hyperventilation, and acidosis due to a lack of oxygen resulting in accumulation of
lactate in the blood.
Acid-base levels are often difficult to analyze during exercise because fluctuations of the
acid-base status are occurring at the same time and at a relatively rapid rate in opposite directions
(Aguilera-Tejero et al., 2000). Stewart’s quantitative analysis of acid-base status was developed
in order to consider all variables that affect acid base status (Stewart, 1983). The independent
variables that are used to quantitatively analyze all aspects of acid-base status during exercise are
partial pressure of carbon dioxide (pCO2), strong ion difference (SID), and total weak acid
concentrations (Stewart, 1983). Each of the previously listed three variables help in maintaining
homeostasis during exercise and are regulated by independent variables. Partial pressure of
carbon dioxide is regulated by the respiratory system releasing CO2 from the lungs or
maintaining levels of CO2 in the blood to help maintain blood pH. Strong ion difference is
primarily regulated by the transmembrane ionic exchanges of electrolytes during exercise (Fencl
and Leith, 1993). As electrolytes carrying a charge pass in either direction across the
transmembrane of the muscle cell a net charge is produced under strenuous exercising
conditions.
It has been found in exercising horses that venous pCO2 generally increases during
strenuous exercise and decreases during the recovery phase or during aerobic respiration (Taylor
et al., 1995). This observed increase in pCO2 during strenuous exercise could be predicted based
on strenuous exercise being associated with hyperventilation. During less intense exercise or
exercise under more aerobic conditions there is a decrease in venous pCO2 initially, followed by
an increase later as exercise duration continues (Pan et al., 1983). The observed initial decrease
in venous pCO2 during aerobic exercise is due to the increase in RBC’s and lack of
15

hyperventilation. These circumstances allow the body to function very efficiently resulting in
CO2 being readily released into the lungs at a highly efficient rate. Also, the lack of
hyperventilation results in very little decrease in blood pH. Therefore, there is little need for a
build up of CO2 for use as a buffer for the blood during early stages of aerobic respiration.
Regardless of the changes in venous pCO2 levels, changes are always secondary to
hyperventilation. These changes in venous pCO2 levels occur in order to maintain arterial partial
pressure of oxygen (pO2), for thermoregulation, and ultimately to maintain blood pH during
anaerobic exercising conditions (Aguilera-Tejero et al., 2000). Figure 2 illustrates the
relationship between CO2 as a byproduct of muscle metabolism, water, and bicarbonate as a
blood pH buffer.
H3O+(aq) + HCO3
- (aq) ↔ H2CO3(aq) + H2O(l) ↔ 2 H2O(l) + CO2(g)
Figure: 2: Conversion of water and carbon dioxide to form bicarbonate creating the bicarbonate buffer system.
It has previously been determined in humans that strong ion difference (SID), which is
defined as the difference between sodium and potassium ions and bicarbonate and chloride ions,
increases during heavy exercise despite the simultaneous increase in lactate (Fencl and Leith,
1993). Strong ion difference increases are frequently due to the changes in electrolytes (Na+, K+,
Cl-). During exercise there is regularly an increase in Na+ levels caused by an increase in the
loss of plasma volume due to diffusion. This represents the initial alkalotic trend which then
leads to contraction alkalosis (Fencl and Rossing, 1989). Initially during exercise the loss of
intravascular water is accompanied by a simultaneous increase in plasma Cl- concentration. As
exercise continues a chloride shift occurs causing a decrease in Cl- in venous blood. This
ultimately will aid CO2 excretion and facilitate the unloading of oxygen from hemoglobin to
16

tissues (primarily skeletal muscle tissue during exercise) in need of oxygen (Taylor et al., 1995).
Chloride has previously been demonstrated to move into red blood cells to assist with this
facilitation of CO2 movement (McKelvie et al., 1991) as well as move into muscle cells for
repolarization (Kowalchuk et al., 1988; Stainsby and Eitzman, 1988). Thus, during exercise an
alkalotic effect can be observed. This is due to red blood cells increasing in concentration during
exercise as well as the ability of Cl- to move into hemoglobin. The alkalotic effect would be due
to the increase in SID which is mediated by the ion exchange between plasma and erythrocytes
(Aguilera-Tejero et al., 2000).
Base excess extracellular fluid is a measurement that can be assessed to determine the
amount of primarily lactic acid required to return the blood to a normal resting pH. Although
base excess extracellular fluid is based on the amount of acid required to return the blood to
resting pH, this value can be either positive or negative. Therefore, base excess extracellular
fluid is indicative of the pCO2 available to regulate or buffer blood pH. A negative base excess
extracellular value is indicative of a lack of CO2 available in the blood and a resulting below
normal or acidic blood pH. A positive value of base excess extracellular fluid demonstrates that
there is an excessive amount of CO2 in the blood resulting in an above normal blood pH. This
value is another indicator of blood pH and is particularly useful when evaluating electrolytes,
bicarbonate, and other byproducts of exercise metabolism. Base excess extra cellular fluid
indicates the amount of acid required to return the blood to normal and takes into account other
factors that may be contributing to a change in blood pH such as the previously-mentioned
electrolytes or SID, and total weak ion concentrations (Schwartz and Relman, 1963).
Electrolytes
17

Electrolytes play a very important role in various exercise metabolic functions. For
example, muscle contractions require the propagation of action potentials within muscle cells.
Skeletal muscle cells are surrounded by an outer plasma membrane called the sarcolemma which
is covered by the glycocalyx layer. From the cell surface, invaginations of the sarcolemma
extend into the cell interior, forming a grid of tubules running transversely across the cell. This
grid of tubules is known as the transverse-tubule (t-tubule) system which is responsible for
transmitting actions potentials through the sarcolemma and ending in the t-tubules (Clausen,
2003). Once stimulated t-tubules activate the voltage-gated sensors within the cell and cause a
release of Ca2+ from the sarcoplasmic reticulum (SR). The SR is separated from the t-tubule
system by two receptor molecules, both of which play a pivotal role in excitation contraction
coupling resulting in calcium release and calcium induced calcium release.
The first of these two receptor molecules is known as the ryanodine receptor (RYR).
Ryanodine receptors are found both in cardiac and skeletal muscle and are composed of
membrane protein complexes that reside in the endoplasmic reticulum (ER) of the muscle cell.
Ryanodine receptors comprise high conductance ion channels that are responsible for mediating
the massive release of calcium from the sarcoplasmic reticulum into t-tubule system resulting in
depolarization of the muscle cell (Yin et al., 2008).
Dihydropyridine receptors (DHPR) also play a pivotal role in calcium release.
Dihydropyridine receptors are calcium channels that are responsible for initiating excitation
contraction coupling events by functioning as a voltage sensor (Adams et al., 1990; Protasi et al.,
1997; Rios and Brum, 1987; Tanabe et al., 1988). The mechanical coupling hypothesis supports
the idea that interaction between the RYR’s and voltage sensors DHPR’s involves a direct
18

functional link between the two proteins (Schneider and Chandler, 1973). When DHPR’s are
activated the RYR is signaled to open and release calcium into the t-tubule system.
Calcium induced calcium release is also an important aspect of muscle cell excitation and
contraction. Calcium induced calcium release functions to induce calcium release from other SR
stores upon a rapid increase of free calcium concentration at the outer surface of the SR. This
calcium induced calcium release can be inhibited by RYR’s which suggests another mechanism
is responsible for opening RYR’s upon calcium induced calcium release. To date this secondary
mechanism has not yet been discovered (Fabiato, 1992).
The release of Ca2+ ions from the SR into the cell results in depolarization of the cell
membrane. When depolarization reaches a threshold voltage gated Na+ channels open, allowing
an influx of Na+, and an efflux of K+(Clausen, 2003). The influx of Na+ is driven by an
electrochemical gradient and leads to further depolarization of the cell causing more channels to
open. The repolarization of the cell begins to take place when Na+ voltage gated channels close
and K+ voltage gated channels open. The electrochemical gradient along with Na+/K+ pumps
drives K+ outward and the axon is repolarized to its initial resting membrane potential (McKenna
et al., 2007).
During early exercise there is an initial rapid increase of K+ plasma concentration from
contracting skeletal muscles. Interstitial K+ aids in exercise; however, a build up of interstitial
K+ stimulates cranial nerve 3 and 4 directly increasing heart rate and rate of respiration. Despite
positive respiratory and cardiovascular responses to a build up of interstitial and plasma K+ there
is a decrease in strength of muscle contractions upon build up of extracellular K+. The reduction
in strength of contraction is due a decrease of K+ level in the muscle. This reduction in strength
of muscle contraction is considered muscle fatigue. Thus, muscle fatigue can be directly related
19

to loss of K+. At the end of exercise intracellular K+ concentrations rapidly restore to resting
values, resulting in improvements in muscle contractions. As a result previous research has
demonstrated that horses that are more fit may exhibit a higher level of resting intracellular K+,
and a lower level of plasma K+ at rest (Lindinger and Sjogaard, 1991).
Muscle K+ loss is proportional to the magnitude and frequency of muscle contractions
and are therefore, proportional to exercise intensity (Fenn, 1934). During exercise there are three
main mechanisms responsible for the rise in levels of K+ in plasma. The first of which is a
release of K+ from contracting muscle cells (Lindinger and Sjogaard, 1991). Potassium is
released from muscle cells during exercise via Na+/K+ pumps. Na+/K+ pumps are imperative to
muscle function and ultimately play a vital role in the depolarization and repolarization of
muscle cells. The second mechanism is a decrease in plasma volume or hemoconcentration due
to capillaries within the muscle’s net filtration system filtering at a much higher pressure on the
arteriole side than the venous side. This higher filtration pressure results in an increased
filtration rate. As a result, there is an increase in the amount of water that diffuses out of the
blood plasma compartment and into the interstitial and intracellular compartments of the
contracting muscles. These excess fluids are ultimately picked up by the lymphatic system to
prevent edema. Thus, a portion of the increase in K+ plasma concentration can be accounted for
by the loss of plasma volume (Kilburn, 1966; Olszewski et al., 1977; Tibes et al., 1977). A third
reason for a possible increase in plasma K+ concentration is a release of K+ from erythrocytes.
Although the exact mechanism has yet to be determined, previous research in humans exercising
under prolonged physical conditions has suggested that erythrocytes serve as a reservoir for K+
and release K+ stores with an increasing magnitude of K+ loss as exercise progresses.
20

While K+ concentration levels increase interstitially and decrease intracellularly during
exercise Na+ concentration levels are affected inversely. There is a decline in interstitial Na+ and
an increase in intracellular Na+ concentration during exercise. Higher resting levels of Na+ have
been found within slow twitch muscles, implicating that these cells require less neurological
stimulation to contract (McKenna et al., 2007). As a result of stimulating a skeletal muscle to
contract there is a marked increase in intracellular Na+ levels by Na+/K+ pumps. After
depolarization of the cell to threshold and contraction of the muscle cell occurs the cell actively
transports Na+ out of the cell and K+ back into the cell by way of active transport. Active
transport of Na+ out of the cell and K+ to back into the cell is required to repolarize the cell to
resting membrane potential in preparation for the next muscle contraction (Clausen, 2003).
When skeletal muscles are exposed to high levels of K+ extracellularly skeletal muscles
lose excitability. This is due to the depolarization and ensuing inactivation of voltage dependent
Na+ channels. Continuous depolarization causes a slower inactivation of Na+ channels resulting
in long lasting reduction in excitability. Ultimately, if K+ levels continue to rise muscle paralysis
occurs. Because muscle contractions occur as a result of an influx of Na+ along with an efflux of
K+ over exertion of muscles and loss of muscle control is primarily due to excessive amounts of
extracellular K+. Over exertion due to excessive levels of extracellular K+ is primarily due to the
Na+/K+ pumps requiring an increased length in time to fully repolarize the cell (Clausen, 2003).
Stimulation and muscle contraction of the skeletal muscle fiber requires threshold to be
reached generating an action potential. Change in membrane potential in response to excitatory
currents depends upon passive membrane properties and chloride conductance which accounts
for approximately 80% of total membrane conductance at rest (Pedersen et al., 2005). Therefore,
action potential generation and propagation strongly depend on the balance between the
21

excitatory or depolarizing Na+ and the inhibitory or repolarizing Cl- currents (Pedersen et al.,
2005). During exercise the extracellular plasma levels of Cl- change very little. This is due to a
simultaneous loss of Cl- and water in perspiration (Cohen et al., 1993). During fatiguing
exercise, intracellular muscle Cl- increases, however, under intense exercise there has been no
observed change in intracellular muscle Cl- (McKenna et al., 2007).
Muscle contraction
The neuromuscular junction is the synapse at which the motor neuron branches to
innervate and communicate with a variable number of skeletal muscle fibers. The synapse is
considered a chemical synapse as its form of communication or nerve impulse transmitted
between the axon terminal and the myofiber membrane is by acetylcholine (Ach). In mammals
each skeletal muscle fiber is innervated at a single sarcolemma endplate by a single motor axon
(Wilson and Deschenes, 2005). Acetylcholine is released in packaged vesicles at the active zone
of the terminal bouton of the axon by exocytosis which is facilitated by calcium. Exocytosis is
considered to be the transport of material out of the cell by vesicles. Acetylcholine filled
vesicles are docked at active zones on the terminal bouton and release Ach into the primary
synaptic cleft. After vesicles dock and release Ach calcium ions move into the axon terminal
through voltage-gated Ca2+ channels. Empty vesicles are then repackaged with Ach and reused.
Active zones are positioned over invaginations of the muscle cell sarcolemma known as
secondary synaptic clefts. The post synaptic secondary synaptic clefts contain a cluster of Ach
receptors (AchR’s) which serves as the binding site of Ach (Wood and Slater, 2001). Upon Ach
binding to AchR’s voltage-gated Na+ channels lining the deeper portion of the secondary post
synaptic cleft open to further depolarize the cell. As a result, there is a change in permeability
of the postsynaptic membrane which elicits an endplate potential (EPP) which then spreads to the
22

extracellular sarcolema. This triggers an action potential which enters the T-tubules and
stimulates the release of Ca2+ from the sarcoplasmic reticulum (SR) (Wilson and Deschenes,
2005). Troponin is a protein of muscle tissue that binds Ca2+ ions (troponin T) to allow myosin
actin interaction and is responsible for inhibiting myosin head groups form interacting with actin
filaments to form a cross bridge (troponin I) when Ca2+ is not available. When Ca2+ levels rise
Ca2+ binds to troponin C resulting in a conformational change and allowing troponin T (interacts
with tropomyosin to prevent actin myosin interaction) to alter the structure of troponin I
exposing tropomyosin actin binding sites. This exposure of the actin binding sites on
tropomyosin allows cross bridges to join (Wood and Slater, 2001).
Once cross-bridges are able to form there are four steps involved in a muscle contraction
which is also called cross-bridge cycling. Adenosine triphosphate is imperative to muscle
function and is required to begin cross-bridge cycling. Cross-bridge cycling begins as ATP
binds to the cleft at the back of the myosin head causing a conformational change. The
conformational change of the myosin head results in a dissociation of the myosin head from
actin. The second step is caused by ATP being hydrolyzed, resulting in the myosin head
swinging back to approximately 5nm into the cocked position. Adenosine diphosphate and Pi
remain bound at this point. The third and fourth steps to the cross-bridge cycle are known to be
the force generating stages. Inorganic phosphorus leaves myosin during this stage and the
myosin head group binds to actin. At this point the ‘power stroke’ occurs pulling actin back and
generating force. ADP is then released to continue the cycle.
Adenosine triphosphate plays an extremely important role in resuming cross bridge cycle
after the power stroke has occurred. Until another ATP binds to the myosin head group to
23

induces a conformational change and inhibit myosin from binding to actin the muscle is in a
temporary state of rigor or a temporary state of contraction (Lymn and Taylor, 1971).
Muscle Fibers
Aerobic capacity varies between breeds of horses as well as horses individually. For
example, horses such as Arabians that have historically been genetically engineered to race
longer races or subjected to living conditions where high levels of endurance were required to
survive have a resulting high level of slow oxidative (type I) muscle fibers (D'Angelis et al.,
2005). With the strong breed influence that Arabians have in Thoroughbred bloodline
Thoroughbreds also will have a higher number of slow oxidative muscle fibers. Whereas horses
that have been selected and bred over time for quickness and agility to work cows, pull quickly,
or race short distances (such as Quarter horses and draft breeds) have higher levels of fast
glycolytic (type II) muscle fibers. These types of muscle fibers are necessary for the short
powerful bursts of energy that are required for their workloads (Stull, 1981).
The muscle cell myosin heavy chain (MHC) is composed of either fast or slow isoforms
which are coded by various different combinations of gene. Myosin heavy chains are used to
differentiate muscle cells based on their unique oxidative capacities (Serrano et al., 1996).
Although there are a wide variety of hybrid MHC’s found in muscle fibers there are four major
MHC isoforms identified in skeletal muscle. These four fall under two different categories (type
I & type II). The first muscle fiber is the slow oxidative or MHC-Iβ muscle fibers. The other
three muscle fibers fall under the type II muscle fiber category and are considered the fast
oxidative-glycolytic muscle fibers. The type II muscle fibers are listed in descending order of
oxidative capacity MHC-IIA, MHC-IIX or MHC-IID (Bar and Pette, 1988; Schiaffino et al.,
1989; Serrano et al., 2000).
24

Aerobic respiration recruits and utilizes primarily slow twitch oxidative muscle fiber.
Type I muscle fibers have a higher aerobic capacity than other muscle fibers and appear to be
red. The red appearance of type I muscle fibers is due to high levels of oxygenated blood flow
due to higher capillary density. Type I muscle fibers also have larger, as well as more
mitochondria. Because the type I muscle fiber is primarily used under aerobic conditions for
muscle contractions the high numbers and large size of mitochondria associated with type I
muscle fibers are necessary to maximize oxidative capacity. As previously discussed the TCA
cycle and electron transport chain occur within mitochondria and together are responsible for
producing a large amount of ATP under aerobic conditions. Therefore, by having more
mitochondria that are also larger the average that oxidative capacity of the type I muscle fiber is
maximized. As a result in both human (Costill et al., 1976; Saltin et al., 1977) and equine (Snow
et al., 1981) endurance events there have been multiple reports relating high proportion of slow-
twitch fibers in muscles of athletes with superior performance.
With an increase in oxidative capacity associated with type I muscle fibers, energy is
synthesized primarily within the mitochondria. As a result, stored energy in the form of
glycogen (the storage form of glucose) is not imperative to muscle function. Previous research
in horses has reported that there is an inverse relationship between glycogen storing capacity in
the muscle and oxidative capacity within type I and type II muscle fibers (Andrews and
Spurgeon, 1986). Type I muscle fibers had high oxidative capacity and a low glycogen capacity,
whereas, type II muscle fibers had intermediate (MHC-IIA & MHC-IIX) to high glycogen
(MHC-IID) storage capacity and intermediate (MHC-IIA & MHC-IIX) to low oxidative
capacity(MHC-IID)(Andrews and Spurgeon, 1986).
25

The oxidative capacity of type I muscle fibers is extremely important for energy
production. Because of the high oxidative capacity associated with type I muscle fibers at low
intensity exercise fatty acid stores within adipose tissues can be utilized for energy through beta
oxidation (Hurley et al., 1986; Martin, 1994; Romijn et al., 1993). Short chain fatty acids can be
transported into the mitochondrial matrix as free acids and form an acyl-CoA derivative. Long
chain fatty acyl-CoA derivatives cannot be transported into the matrix directly but with the
assistance of enzyme carnitine acyltransferase I long chain fatty acyl-CoA can catalyze the
formation of O-acylcarnitine which can then be transported across the inner membrane by
enzyme translocase(Garrett and Grisham, 1994). Once inside the mitochondrial matrix
acylcarnitine is passed to carnitine acyltransferase II which converts acylcarnitine back to fatty
acyl CoA. At this point fatty acyl CoA with the addition of FAD and enzyme Acyl-CoA is
converted to trans-Δ2-Enoyl-CoA. Trans-Δ2-Enoyl-CoA is then hydrated with a water molecule
and enzyme enoyl-CoA hydratase helps to form L-β-hydroxyacyl-CoA. L-β-hydroxyacyl-CoA
which is then oxidized by enzyme L-hydroxyacyl-CoA dehydrogenase forming and releasing
NADH + H+(Garrett and Grisham, 1994). The resulting product is β-ketoacyl-CoA which is
combined with CoASH and cleaved by enzyme thiolase to form Acetyl-CoA which is utilized by
the TCA cycle and fatty acyl-CoA which continues into successive cycles until the entire
molecule is converted to acetyl-CoA (Garrett and Grisham, 1994).
As previously discussed type II fast twitch muscle fibers range from somewhat oxidative
to running almost completely on glycogen (McMiken, 1986). As a result beta oxidation and fat
utilization is not an option leaving glycogen stores to be the primary source of energy. However,
the glycogen energy dependency and oxidative capacity of type II muscle fiber characteristics
are found to be relatively species specific and dependent on training (Poso et al., 1996; Roneus et
26
al., 1994). Training mechanisms that affect the characterization and development of muscle
fibers are primarily due to availability of oxygen and the oxidative capacity to fully utilize it
(Poso, 2002). MHC-IIA fast oxidative muscle fibers have the unique ability to adapt to function
better under either anaerobic or aerobic respiration depending upon genetic predisposition and
training mechanisms. It has also been found that fast twitch type II muscle fibers can contain up
to 15-20% more PCr than slow oxidative or slow twitch type I muscle fibers which is in
accordance with the higher glycolytic capacity previously discussed in association with this fiber
type (Soderlund and Hultman, 1991).
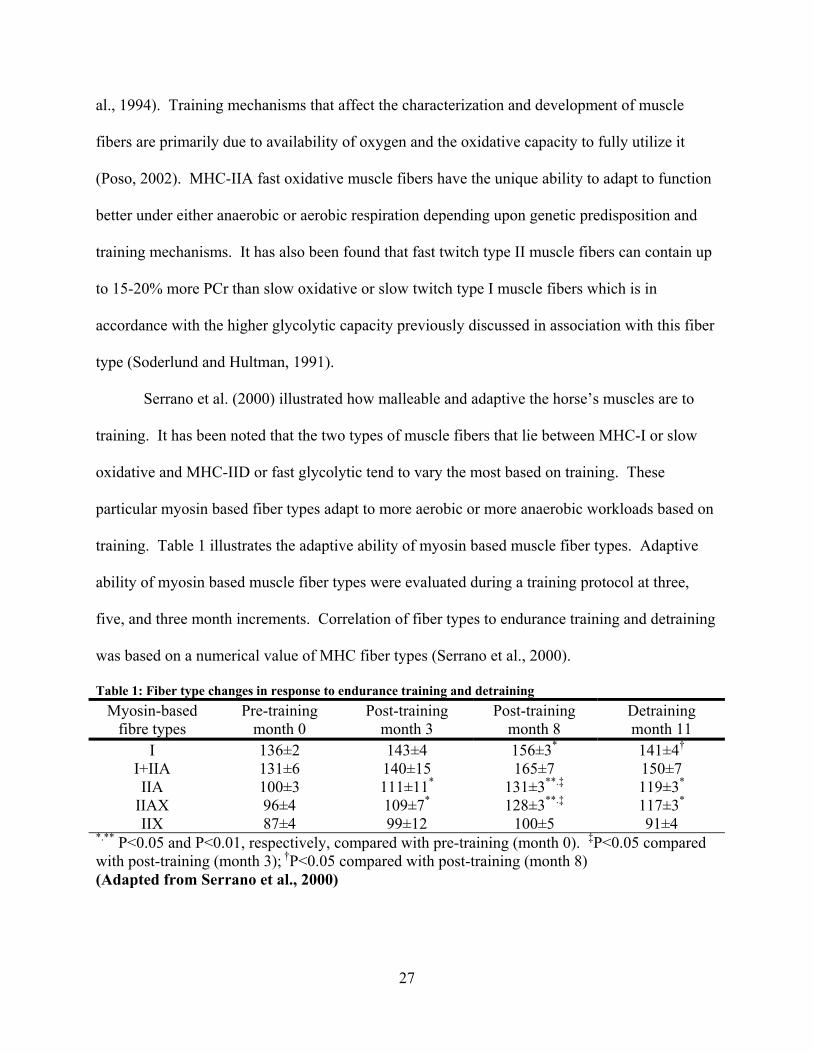
Serrano et al. (2000) illustrated how malleable and adaptive the horse’s muscles are to
training. It has been noted that the two types of muscle fibers that lie between MHC-I or slow
oxidative and MHC-IID or fast glycolytic tend to vary the most based on training. These
particular myosin based fiber types adapt to more aerobic or more anaerobic workloads based on
training. Table 1 illustrates the adaptive ability of myosin based muscle fiber types. Adaptive
ability of myosin based muscle fiber types were evaluated during a training protocol at three,
five, and three month increments. Correlation of fiber types to endurance training and detraining
was based on a numerical value of MHC fiber types (Serrano et al., 2000).
Table 1: Fiber type changes in response to endurance training and detraining Myosin-based
fibre types Pre-training
month 0 Post-training
month 3 Post-training
month 8 Detraining month 11
I 136±2 143±4 156±3* 141±4†
I+IIA 131±6 140±15 165±7 150±7 IIA 100±3 111±11* 131±3**.‡ 119±3*
IIAX 96±4 109±7* 128±3**.‡ 117±3*
IIX 87±4 99±12 100±5 91±4 *.** P<0.05 and P<0.01, respectively, compared with pre-training (month 0). ‡P<0.05 compared with post-training (month 3); †P<0.05 compared with post-training (month 8) (Adapted from Serrano et al., 2000)
27

Alterations in appearance and ability of fiber types are due to an increase in blood caused by
capillary density, and an increase in mitochondria size and number. Previous research in humans
has consistently correlated higher proportions of muscle fiber MHCI and IIA with greater
oxidative capacities and excellent performers (Rivero and Henckel, 1996).
Eto et al. (2004) evaluated the effects of high intensity training on anaerobic capacity of
muscles in the Thoroughbred horse and found that there is significant trainability for anaerobic
capacity. However, conventional training programs may not be enough to develop maximum
anaerobic capacity in the horse. As illustrated in Table 2 no significant differences were
measured in the proportions of myosin heavy chain fibers found in the horse working under an
anaerobic workout protocol which is thought to be due to their inability to increase oxidative
capacity through an increase in numbers of mitochondria and mitochondria size (Eto et al.,
2004). Also, there was not an increase in slow twitch oxidative myosin heavy chains which is
normally associated with aerobic or endurance workloads. Ultimately, this implies that MHCIIA
muscle fibers are more malleable to transitioning to become more oxidative than they are to
becoming more glycolytic or storing more glycogen. Increasing oxidative capacity would
involve a marked increase in both mitochondria numbers and size. However, no muscle fibers,
including MHCIIA are capable of increasing oxidative capacity to match that of type I fibers.
Table 2: Muscle fiber response to sprint training in thoroughbred horses Pre-study 4 weeks 12 weeks
MHC I (%) 16.4±4.4 13.8±4.6 18.2±8.7 MHC II (%) 43.9±6.2 44.9±6.0 42.8±4.7
MHC IIx (%) 39.7±5.5 41.3±8.4 39.0±8.5 The composition of myosin heavy chain (MHC) isoforms No significant differences were found among groups. Values are presented as means ±SD (Adapted from Serrano et al., 2000)
28

LITERATURE CITED
Adams, B. A., T. Tanabe, A. Mikami, S. Numa, and K. G. Beam. 1990. Intramembrane charge movement restored in dysgenic skeletal muscle by injection of dihydropyridine receptor cdnas. Nature 346: 569-572.
Aguilera-Tejero, E. J.C. Estepa, I. Lopez, S. Bas, R. Mayer-Valor, and M. Rodriguez. 2000. Quantitative analysis of acid-base balance in show jumpers before and after exercise. Res Vet Sci 68: 103-108.
Andrews, F. M., and T. L. Spurgeon. 1986. Histochemical staining characteristics of normal horse skeletal muscle. Am J Vet Res 47: 1843-1852.
Art, T., H. Amory, D. Desmecht, and P. Lekeux. 1990. Effect of show jumping on heart rate, blood lactate and other plasma biochemical values. Equine Vet J Suppl: 78-82.
Bar, A., and D. Pette. 1988. Three fast myosin heavy chains in adult rat skeletal muscle. FEBS Lett 235: 153-155.
Bentley, D. J., J. Newell, and D. Bishop. 2007. Incremental exercise test design and analysis: Implications for performance diagnostics in endurance athletes. Sports Med 37: 575-586.
Brooks, G. A. 1985. Anaerobic threshold: Review of the concept and directions for future research. Med Sci Sports Exerc 17: 22-34.
Cardinet, G. H., 3rd, M. E. Fowler, and W. S. Tyler. 1963. Heart rates and respiratory rates for evaluating performance in horses during endurance trail ride competition. J Am Vet Med Assoc 143: 1303-1309.
Clausen, T. 2003. Na+-k+ pump regulation and skeletal muscle contractility. Physiol Rev 83: 1269-1324.
Coggan, A. R. 1991. Plasma glucose metabolism during exercise in humans. Sports Med 11: 102-124.
Coggan, A. R., S. C. Swanson, L. A. Mendenhall, D. L. Habash, and C. L. Kien. 1995. Effect of endurance training on hepatic glycogenolysis and gluconeogenesis during prolonged exercise in men. Am J Physiol 268: E375-383.
Cohen, N. D., A.J. Roussel, J.H. Lumsden, A.C. Cohen, E. Grift, and C. Lewis. 1993. Alterations of fluid and electrolyte balance in thoroughbred racehorses following strenuous exercise during training. Can J Vet Res 57: 9-13.
Costill, D. L., W. J. Fink, and M. L. Pollock. 1976. Muscle fiber composition and enzyme activities of elite distance runners. Med Sci Sports 8: 96-100.
Courouce, A. 1999. Field exercise testing for assessing fitness in french standardbred trotters. Vet J 157: 112-122.
D'Angelis, F. H., G. C. Ferraz, I. C. Boleli, J. C. Lacerda-Neto, and A. Queiroz-Neto. 2005. Aerobic training, but not creatine supplementation, alters the gluteus medius muscle. J Anim Sci 83: 579-585.
Davies, B. N., and P. G. Withrington. 1973. The actions of drugs on the smooth muscle of the capsule and blood vessels of the spleen. Pharmacol Rev 25: 373-413.
Elsner, R. W., and D.W. Kenney. 1966. Muscle blood flow and heart rate in the exercising horse. Federation Proc. 25: 333.
Eto, D., S.Yamano, K. Mukai, T. Sugiura, T. Nasu, M. Tokuriki, and H. Miyata. 2004. Effect of high intensity training on anaerobic capacity of middle gluteal muscle in thoroughbred horses. Res Vet Sci 76: 139-144.
29

Fabiato, A. 1992. Two kinds of calcium-induced release of calcium from the sarcoplasmic reticulum of skinned cardiac cells. Adv Exp Med Biol 311: 245-262.
Fencl, V., and D. E. Leith. 1993. Stewart's quantitative acid-base chemistry: Applications in biology and medicine. Respir Physiol 91: 1-16.
Fencl, V., and T. H. Rossing. 1989. Acid-base disorders in critical care medicine. Annu Rev Med 40: 17-29.
Fenn, W. O., and D.M. Cobb. 1934. The potassium equilibrium in muscle. J. Gen. Physiol. 17: 629-656.
Garrett, R., and C. M. Grisham. 1994. Biochemistry. Saunders College Pub., Fort Worth. Householder, D. D. and R. H. Douglas. 2005. Total blood volume and thoroughbred racing
performance. J. Eq Vet Sci: 14-15. Hurley, B. F. et al. 1986. Muscle triglyceride utilization during exercise: Effect of training. J
Appl Physiol 60: 562-567. Jimenez, M., K. W. Hinchcliff, and J. W. Farris. 1998. Catecholamine and cortisol responses of
horses to incremental exertion. Vet Res Commun 22: 107-118. Katz, A., and K. Sahlin. 1988. Regulation of lactic acid production during exercise. J Appl
Physiol 65: 509-518. Kilburn, K. H. 1966. Muscular origin of elevated plasma potassium during exercise. J Appl
Physiol 21: 675-678. Kindermann, W., G. Simon, and J. Keul. 1979. The significance of the aerobic-anaerobic
transition for the determination of work load intensities during endurance training. Eur J Appl Physiol Occup Physiol 42: 25-34.
Kinnunen, S., R. Laukkanen, J. Haldi, O. Hanninen, and M. Atalay. 2006. Heart rate variability in trotters during different training periods. Equine Vet J Suppl: 214-217.
Kowalchuk, J. M., G. J. Heigenhauser, M. I. Lindinger, J. R. Sutton, and N. L. Jones. 1988. Factors influencing hydrogen ion concentration in muscle after intense exercise. J Appl Physiol 65: 2080-2089.
Levintow, L., and Eagle, H. . 1961. Biochemistry of cultured mammalian cells. Annual Review of Biochemistry: 605-640.
Lindinger, M. I., and G. Sjogaard. 1991. Potassium regulation during exercise and recovery. Sports Med 11: 382-401.
Lindner, A. 1996. Measurement of plasma lactate concentration with accusport. Equine Vet J 28: 403-405.
Lymn, R. W., and E. W. Taylor. 1971. Mechanism of adenosine triphosphate hydrolysis by actomyosin. Biochemistry 10: 4617-4624.
Martin, G., and M. Morad. 1982. Activity-induced potassium accumulation and its uptake in frog ventricular muscle. J Physiol 328: 205-227.
McComas, A. J. 1996. Skeletal muscle : Form and function. Human Kinetics, Champaign, IL. McKelvie, R. S., M. I. Lindinger, G. J. Heigenhauser, and N. L. Jones. 1991. Contribution of
erythrocytes to the control of the electrolyte changes of exercise. Can J Physiol Pharmacol 69: 984-993.
McKenna, M. J., J. Bangsbo, and J. M. Renaud. 2007. Muscle K+, Na+, Cl- disturbances and Na+, K+-pump inactivation: Implications for fatigue. J Appl Physiol.
McMiken, D. 1986. Muscle fiber types and horse performance Equine Prac. 8: 6-15.
30

Morell, B., and E. R. Froesch. 1973. Fibroblasts as an experimental tool in metabolic and hormone studies. Ii. Effects of insulin and nonsuppressible insulin-like activity (nsila-s) on fibroblasts in culture. Eur J Clin Invest 3: 119-123.
Olszewski, W., A. Engeset, P. M. Jaeger, J. Sokolowski, and L. Theodorsen. 1977. Flow and composition of leg lymph in normal men during venous stasis, muscular activity and local hyperthermia. Acta Physiol Scand 99: 149-155.
Pan, L. G., H.V. Forster, G.E. Bisgard, R.P. Kaminski, S.M. Dorsey, and M.A. Busch. 1983. Hyperventilation in ponies at the onset of and during steady-state exercise. J Appl Physiol 54: 1394-1402.
Paul, J. 1965. Cells and tissues in culture. Academic Press, New York 1: 239-276. Pedersen, T. H., F. de Paoli, and O. B. Nielsen. 2005. Increased excitability of acidified skeletal
muscle: Role of chloride conductance. J Gen Physiol 125: 237-246. Persson, S. G. B. 1969. On blood volume and working capacity in horses. Acta. Vet. Scand. 19:
1-189. Persson, S. G. B. 1983. Evaluation of exercise tolerance and fitness in the performance horse.
Equine Exercise Physiology: 441-457. Persson, S. G. B.1974. Blood volume in relation to exercise tolerance in trotters. J. S. Afr. vet.
Ass. 45: 293-299. Poso, A. R. 2002. Monocarboxylate transporters and lactate metabolism in equine athletes: A
review. Acta Vet Scand 43: 63-74. Poso, A. R., M. Nieminen, J. Raulio, L. A. Rasanen, and T. Soveri. 1996. Skeletal muscle
characteristics of racing reindeer (rangifer tarandus). Comp Biochem Physiol A Physiol 114: 277-281.
Protasi, F., C. Franzini-Armstrong, and B. E. Flucher. 1997. Coordinated incorporation of skeletal muscle dihydropyridine receptors and ryanodine receptors in peripheral couplings of bc3h1 cells. J Cell Biol 137: 859-870.
Reitzer, L. J., B. M. Wice, and D. Kennell. 1979. Evidence that glutamine, not sugar, is the major energy source for cultured hela cells. J Biol Chem 254: 2669-2676.
Rhoades, R. A., and G.A. Tanner. 2003. The endocrine pancreas. In: R. A. Rhoades, Tanner, G.A. (ed.) Medical physiology No. 2. p 623-633.
Rios, E., and G. Brum. 1987. Involvement of dihydropyridine receptors in excitation-contraction coupling in skeletal muscle. Nature 325: 717-720.
Rivero, J. L., and P. Henckel. 1996. Muscle biopsy index for discriminating between endurance horses with different performance records. Res Vet Sci 61: 49-54.
Romijn, J. A., E.F. Coyle, L.S. Sidossis, A. Gastaldelli, J.F. Horowitz, E.Endert, R.Wolfe. 1993. Regulation of endogenous fat and carbohydrate metabolism in relation to exercise intensity and duration. Am J Physiol 265: E380-391.
Roneus, M., S. G. Persson, B. Essen-Gustavsson, and T. Arnason. 1994. Skeletal muscle characteristics in red blood cell normovolaemic and hypervolaemic standardbred racehorses. Equine Vet J 26: 319-322.
Sahlin, K., M. Tonkonogi, and K. Soderlund. 1998. Energy supply and muscle fatigue in humans. Acta Physiol Scand 162: 261-266.
Saltin, B., J. Henriksson, E. Nygaard, P. Andersen, and E. Jansson. 1977. Fiber types and metabolic potentials of skeletal muscles in sedentary man and endurance runners. Ann N Y Acad Sci 301: 3-29.
31

Schiaffino, S., L. Gorza, S. Sartore, L. Saggin, S. Ausoni, M. Vianello, K. Gundersen, and T. Lomo. 1989. Three myosin heavy chain isoforms in type 2 skeletal muscle fibres. J Muscle Res Cell Motil 10: 197-205.
Schneider, M. F., and W. K. Chandler. 1973. Voltage dependent charge movement of skeletal muscle: A possible step in excitation-contraction coupling. Nature 242: 244-246.
Schwartz, W. B., and A. S. Relman. 1963. A critique of the parameters used in the evaluation of acid-base disorders. "Whole-blood buffer base" And "Standard bicarbonate" Compared with blood ph and plasma bicarbonate concentration. N Engl J Med 268: 1382-1388.
Seeherman, H. J., and E. A. Morris. 1990. Application of a standardised treadmill exercise test for clinical evaluation of fitness in 10 thoroughbred racehorses. Equine Vet J Suppl: 26-34.
Serrano, A. L., J. L. Petrie, J. L. Rivero, and J. W. Hermanson. 1996. Myosin isoforms and muscle fiber characteristics in equine gluteus medius muscle. Anat Rec 244: 444-451.
Serrano, A. L., E. Quiroz-Rothe, and J. L. Rivero. 2000. Early and long-term changes of equine skeletal muscle in response to endurance training and detraining. Pflugers Arch 441: 263-274.
Sexton, W. L., and H. H. Erickson. 1990. Effects of treadmill elevation on heart rate, blood lactate concentration and packed cell volume during graded submaximal exercise in ponies. Equine Vet J Suppl: 57-60.
Shulman, R. G. 2005. Glycogen turnover forms lactate during exercise. Exerc Sport Sci Rev 33: 157-162.
Snow, D. H. 1979. Metabolic and physiological effects of adrenoceptor agonists and antagonists in the horse. Res Vet Sci 27: 372-378.
Snow, D. H., P. Baxter, and R. J. Rose. 1981. Muscle fibre composition and glycogen depletion in horses competing in an endurance ride. Vet Rec 108: 374-378.
Soderlund, K., and E. Hultman. 1991. ATP and phosphocreatine changes in single human muscle fibers after intense electrical stimulation. Am J Physiol 261: E737-741.
Stainsby, W. N., and P. D. Eitzman. 1988. Roles of co2, o2, and acid in arteriovenous [h+] difference during muscle contractions. J Appl Physiol 65: 1803-1810.
Stewart, P. A. 1983. Modern quantitative acid-base chemistry. Can J Physiol Pharmacol 61: 1444-1461.
Stull, C. L., and W.W. Albert. 1981. Comparison of muscle fiber types from 2-year-old fillies of the belgian, standardbred, thoroughbred, quarter horse and welsh breeds. J. Anim Sci 51: 340-343.
Tanabe, T., K. G. Beam, J. A. Powell, and S. Numa. 1988. Restoration of excitation-contraction coupling and slow calcium current in dysgenic muscle by dihydropyridine receptor complementary DNA. Nature 336: 134-139.
Taylor, L. E., P. L. Ferrante, D. S. Kronfeld, and T. N. Meacham. 1995. Acid-base variables during incremental exercise in sprint-trained horses fed a high-fat diet. J Anim Sci 73: 2009-2018.
Thornton, J. R., J. Pagan, and S. Persson. 1987. The oxygen cost and weight loading and inclined treadmill exercise in the horse. Equine Exercise Physiology 2: 206-215.
Tibes, U., E. Haberkorn-Butendeich, and F. Hammersen. 1977. Effect of contraction on lymphatic, venous, and tissue electr-lytes and metabolites in rabbit skeletal muscle. Pflugers Arch 368: 195-202.
32

Torten, M., and O. W. Schalm. 1964. Influence of the equine spleen on rapid changes in the concentration of erythrocytes in peripheral blood. Am J Vet Res 25: 500-504.
Trilk, J. L., A. J. Lindner, H. M. Greene, D. Alberghina, and S. J. Wickler. 2002. A lactate-guided conditioning programme to improve endurance performance. Equine Vet J Suppl: 122-125.
Vincen, T. L., J.R. Newton, C.M. Deaton, S.H. Franklin, T. Biddick, K.H. McKeever, P.McDonough, L.E.Youn, D.R. Hodgson, and D.J., Marlin. 2006. Retrospective study of predictive variables for maximal heart rate (hrmax) in horses undergoing strenuous treadmill exercise. Equine Vet J Suppl: 146-152.
Weber, J. M., G.P.Dobson, W.S. Parkhouse, D.Wheeldon, J.C.Harmon, D.H. Snow, and P.W. Hochachka. 1987. Cardiac output and oxygen consumption in exercising thoroughbred horses. Am J Physiol 253: R890-895.
Werkmann, J., Lindner, A. and Sasse, H.H.L. 1996. Conditioning effects in horses of exercise of 5, 15, and 25 minutes' duration at two blood lactate concentrations. Pferdeheilkunde 12: 474-479.
Wilson, M. H., and M. R. Deschenes. 2005. The neuromuscular junction: Anatomical features and adaptations to various forms of increased, or decreased neuromuscular activity. Int J Neurosci 115: 803-828.
Wilson, R. G. 1983. Heart rate, lactic acid production, and speed during a standardised exercise test in standardbred horses. Equine Ex Phys J: 487-496.
Wood, S. J., and C. R. Slater. 2001. Safety factor at the neuromuscular junction. Prog Neurobiol 64: 393-429.
Yin, C. C., L. G. D'Cruz, and F. A. Lai. 2008. Ryanodine receptor arrays: Not just a pretty pattern? Trends Cell Biol 18: 149-156.
Yoshida, T. 1984. Effect of exercise duration during incremental exercise on the determination of anaerobic threshold and the onset of blood lactate accumulation. Eur J Appl Physiol Occup Physiol 53: 196-199.
33

CHAPTER 3
FACTORS ASSOCIATED WITH EXERCISE IN REINED COW HORSES COMPETING IN
BOXING AND FENCING CLASSES
ABSTRACT
This study investigated physiological responses to exercise performed by privately
owned, seasoned reined cow horses during a reined cow horse show. The primary objectives
were to better understand exercise effects associated with exercising reined cow horses by
determining changes in heart rate, blood lactate, and other blood variables after the completion of
a reined cow horse competition and to compare the workloads of horses competing in boxing
only to horses competing in boxing and fence work.
The effects of reined cow work on heart rate, blood lactate, blood glucose as well as other
blood variables and exercise duration times were studied in fifteen normal horses competing
within the Georgia Reined Cow Horse Association show season. Horses were separated into two
groups based on survey information provided by owners. The first group (n=8) contained horses
performing a reining pattern followed by boxed cow work (Box group). The second group (n=7)
was comprised of horses performing the same reining pattern followed by boxed cow work and
fence work (Box-Fence group). Venous blood samples were taken before warm-up (rest),
immediately after warm-up prior to competition (pre), immediately after competition (post-
exercise), and fifteen minutes after competition (recovery). Blood samples were then analyzed
for lactate, pH, glucose, bicarbonate (HCO3), partial pressure of carbon dioxide (pCO2), total
carbon dioxide concentration (TCO2), base excess extracellular fluid (BEecf), hematocrit
(%PCV), hemoglobin (Hb), sodium (Na+), potassium (K+), chloride (Cl-), and anion gap. In post-
exercise samples, lactate (P = 0.0028), hematocrit (P = 0.033), hemoglobin (P = 0.031), K+ (P =
34

0.05), and anion gap (P = 0.023) were found to be higher in the Box-Fence group. pH (P =
0.026), HCO3 (P = 0.03), TCO2 (P = 0.031), and BEecf (P = 0.026), were found to be lower in
the Box-Fence group. Exercise duration (seconds) for the boxed phase of exercise (P = 0.012)
was lower in the Box-Fence group. The differences between blood lactate, heart rate, and other
blood variables determined after completion of reined cow work demonstrate that the workload
of reined cow horses performing in the Box-Fence group represent an exertion beyond that of
those horses in the Box group. This additional exertion requires the use of anaerobic
metabolism. This study illustrates that the extra workload of fence cow work should be taken
into account in the training programs of reined cow horses.
35

INTRODUCTION
While at rest or under low intensity exercise aerobic respiration serves as the primary
source of exercise metabolism. Under aerobic metabolic conditions there are no constraints on
oxygen availability or utilization. As a result aerobic respiration is highly efficient. Aerobic
respiration produces energy by utilizing three systems known as glycolysis, the tricarboxylic acid
(TCA) cycle, and electron transport chain. As exercise intensity increases the byproduct of
glycolysis pyruvate cannot be utilized rapidly enough by the TCA cycle. Also, the electron
transport chain cannot make use of TCA cycle byproducts at a rapid enough rate. As a result
there is a build up of pyruvate outside of the mitochondria. In order to produce adequate
amounts of NAD+ to facilitate glycolysis pyruvate is converted to lactate by enzyme the lactate
dehydrogenase. Lactate can be adequately utilized by gluconeogenesis to prevent build up in
the blood until the blood lactate concentration reaches 4mmol/L (Trilk et al., 2002; Wilson,
1983). Four mmol/L is considered to be the lactate threshold and has been determined to be a
reliable quantitative variable associated with the point at which lactate begins to accumulate
within the blood and the body is primarily functioning under anaerobic conditions (Lindner,
1996a, b; Trilk et al., 2002; Werkmann, 1996). Blood lactate measurements are frequently used
to assess exercise intensity in horses (Aguilera-Tejero et al., 2000; Art et al., 1990; Sexton and
Erickson, 1990; Sloet van Oldruitenborgh-Oosterbaan et al., 2006) as lactate accumulation serves
as a direct indicator of exercise intensity (Trilk, et al., 2002). An increase in exercise intensity
and blood lactate accumulation have been associated with an increase in velocity of racing
standardbreds and thoroughbreds (Lindner, 1996a, b, 2000; Werkmann, 1996), in show jumpers
with the addition of jumps (Aguilera-Tejero et al., 2000; Art et al., 1990; Sloet van
36

Oldruitenborgh-Oosterbaan et al., 2006), and in ponies as elevation increased on treadmills
(Sexton and Erickson, 1990).
An increase in exercise intensity is also associated with changes in pH, bicarbonate
(HCO3-), partial pressure carbon dioxide (pCO2), total carbon dioxide (TCO2), base excess
extracellular fluid, hematocrit, hemoglobin, potassium (K+), sodium (Na+), chloride (Cl-), and
glucose. An increase in exercise intensity and lactate accumulation in the blood results in a
correlating decrease in blood pH (Aguilera-Tejero et al., 2000; Art et al., 1990; Sloet van
Oldruitenborgh-Oosterbaan et al., 2006). The decrease in blood pH is primarily due to the
reduction of lactate to lactic acid. In association with the decrease in pH blood HCO3-
concentration decreases as HCO3- buffers blood pH and is neutralized by lactic acid (Aguilera-
Tejero et al., 2000; Art et al., 1990; Foreman, 2004). Associated with the decrease in HCO3- is a
decrease in pCO2, TCO2, and base excess extracellular fluid as CO2 is utilized in the bicarbonate
buffer system to create HCO3- (Aguilera-Tejero et al., 2000; Art et al., 1990; Foreman, 2004;
Forster et al., 1990; Sloet van Oldruitenborgh-Oosterbaan et al., 2006). Heart rate is a consistent
factor that can be used to evaluate the workload of horses. As exercise intensity increases there
is a correlating increase in heart rate which increases the rate at which RBC’s circulate
throughout exercising tissue and deliver oxygen (Art et al., 1990; Cottin et al., 2006; Sexton and
Erickson, 1990; Sloet van Oldruitenborgh-Oosterbaan et al., 2006). Heart rate in association
with anaerobic threshold has been determined to be between 150 to 160 beats per minute
(Persson, 1983). An increase in hematocrit and hemoglobin concentration is a well known
response to an increase in exercise intensity in horses. Increase in hematocrit and hemoglobin
serves to increase the oxygen carrying capacity of blood, and is due to the release of the splenic
reserve of red blood cells (RBC) (Art et al., 1990; Geor et al., 1994; Sloet van Oldruitenborgh-
37

Oosterbaan et al., 2006). Electrolytes (Na+, K+, Cl-) also serve as an indicator of exercise
intensity in horses. As exercise intensity increases there is a subsequent accumulation in
extracellular Na+, and K+, and a slight decrease or no change in Cl- (Aguilera-Tejero et al., 2000).
Changes in blood glucose concentration are indicative of workload. As exercise intensity
increases there is a resulting increase in glucose for utilization by exercising muscle tissue (Geor
et al., 2002).
Although several studies have previously investigated the workload of multiple horse
riding disciplines, primarily of racehorses (Lucke and Hall, 1980; Rose et al., 1977; Rose et al.,
1980; Snow et al., 1982), endurance horses (Barton et al., 2003; Marlin et al., 1995; Schott et al.,
2006), and jumping horses (Aguilera-Tejero et al., 2000; Art et al., 1990; Sloet van
Oldruitenborgh-Oosterbaan et al., 2006) there is limited information regarding the demands of
exercise in Quarter and Paint horse disciplines and to the authors’ knowledge no research has
been done on these horses participating in reined cow horse events. Reined cow horses appear to
exercise at high intensities, and knowledge about their exercise metabolics would be beneficial
and may improve training protocols.
The objectives of the study were to better 1) understand exercise effects associated with
exercising reined cow horses by determining changes in heart rate, blood lactate, and other blood
variables after the completion of a reined cow horse competition and 2) to compare the
workloads of horses competing in boxing only to horses competing in boxing and fence work.
Our hypotheses are that 1) heart rate and blood biochemical values will show that reined
cow horses will rely on a portion of anaerobic metabolism to complete the required exercise
regime and 2) the combination of boxing and fence work will increase workload more than
boxed work.
38

MATERIALS AND METHODS
Horses
Fifteen privately owned American Quarter Horses and American Paint Horses with
owner permission were used for this study. All horses used are seasoned reined cow horses
competing regularly within the Georgia Reined Cow Horse Association. The horses were
competing in a standard reined cow horse competition, following guidelines set forth by the
National Reined Cow Horse Association (NRCHA). This study was approved by the Animal
Care and Use Committee at the University of Georgia.
Questionnaires (Appendix 1) were conducted to evaluate potential candidates for this
study. Surveys assessed the age, gender, average weekly training, dietary supplements fed to the
horse, and type of competition that was to be performed. Horses competed in one of two types
of competition groups: boxing only (Box), and boxing followed by fence cow work (Box-Fence).
Eight horses (4 mares, 3 geldings, 1 stallion; age 7.25±0.84 yr) were selected for the Box group,
and seven horses (3 geldings, 3 stallions, 1 mare; age 6.43±0.57 yr) were selected for the Box-
Fence group.
Warm Up Period
All horses performed a warm-up at their rider’s discretion. At the completion of warm up
prior to the horse beginning exercise 20mL blood samples were drawn by venipuncture of the
jugular vein by a 20gauge needle and placed into one sodium citrate heprin 10mL tube and one
lithium heprin 10mL tube.
Exercise
The reining pattern that was performed was pattern 5 designed by the NRCHA and is
illustrated in appendix 2.
39

Upon completion of the reining pattern horses in both groups continued into boxed cow
work. Box cow work is performed by the horse and rider maintaining the cow between the rail
and the horse and turning it on the short end of the arena until the judge determines the horse has
had an opportunity to demonstrate their abilities.
Horses in the Box-Fence group proceeded immediately into fenced cow work following
completion of boxed cow work. Fence work allows the rider to determine when they have
performed adequate box work. At the time the rider determines enough box work has been
performed the horse and rider send the cow down the long side of the arena fence, turning the
cow in the opposite direction and running the cow back down the long end of the fence. The
cow is then turned in the opposite direction again and the horse and rider run the cow down the
long end of the fence for the final time. The horse and rider then proceed to ride a circle along
side the cow with the cow on the inside of the circle. After completing the first circle the horse
and rider then proceed to perform another circle in the opposite direction with the cow on the
opposite side of the horse and rider with the horse and rider again on the outside of the circle.
Heart Rate
During warm up and prior to beginning the exercise, the horses were equipped with Polar
S610i heart rate monitorsTM (Polar Electro Oy, Finland) (HRM) with one electrode placed under
the girth behind the left elbow, and the other under the saddle at the withers. Heart rate memory
began at the start of the reining pattern and recorded at 5 second intervals until completing the
cow work in both Box group and Box-Fence group. Throughout the duration of exercise, time
splits were recorded and noted between exercise phase transitions. Transition times were
considered to be the time between the reining pattern and boxed cow work and the time between
boxed cow work and fenced cow work. Time was recorded marking transition in an effort to
40

correlate transition points with changes in heart rate. By recording time and marking transitions
during performance it was possible to match exercise phase transitions with the changes in heart
rate. At completion of exercise HRM’s were removed from the horse and rider and all heart rate
information recorded during exercise on watches was downloaded onto a computer.
Blood Sampling and Analyses
Blood samples of 20 mL were taken via venipuncture of the jugular vein with a 20 gauge
needle and a 20ml syringe. Samples were obtained while the horses were at rest 12hrs before
competition (rest), after warm-up/prior to entering arena (pre), within 2 minutes after the
completion of the cow work (post-exercise), and fifteen minutes after cessation of exercise
(recovery). Blood samples were placed into a 20ml 16 x 100 vacuum lithium heparin tube for
analysis of pH, glucose, bicarbonate (HCO3-), partial pressure carbon dioxide (pCO2), total
carbon dioxide (TCO2), base excess extracellular fluid (BEecf), hematocrit, hemoglobin, sodium
(Na+), potassium (K+), chloride (Cl-), anion gap and 20ml 16 x 100 vacuum sodium citrate tube
for lactate analysis. Although vacuum heparin tubes were used, lids were removed and blood
samples were placed into the tubes by the syringe to avoid any chance of hemolysis of red blood
cells. Lids were then placed back onto the tubes and the tubes were inverted multiple times to
prevent clotting of RBC’s.
Seventy μL of blood was used to determine pH, glucose, HCO3-, pCO2, TCO2, BEecf,
hematocrit, hemoglobin, Na+, K+, Cl-, anion gap using an i-STAT analyzer with an EC8+
cartridge (Heska, Loveland, Co.). The EC8+ self calibrates the i-STAT for each sample
analyzed. Results from the i-STAT were determined and printed within 2 minutes of placing the
cartridge with 70 μL blood into the i-STAT and within 10 minutes after the blood sample was
originally taken from the horse.
41

Five μL of blood was used to determine lactate concentration by the Lactate Pro (FaCT,
Quesnel Canada). The Lactate Pro calculated lactate concentration in blood samples within 60
seconds per sample after the lactate pro came in contact with blood and within 10 minutes after
blood sample was drawn from the horse. Results were then recorded by hand. Blood lactate
values were unable to be determined at a concentration of 0.8 mmol/L or less on the Lactate Pro.
As a result statistical analysis was determined based on a 0.8 value for the pre sample.
Statistics
Values determined from blood samples were statistically evaluated using the MIXED
procedure for repeated measures by SAS (SAS Inst. Inc., Cary, NC). Differences among
treatments were determined using orthogonal contrasts. The experimental unit was individual
horse, with repeated collections at rest, after warm-up, after performance, and after 15 minutes of
recovery. Differences between means were considered significant at P < 0.05 and to resemble a
trend at P<0.10. Baseline blood samples and age were set as covariates to ensure that
statistically both groups did not vary. Group, gender, time, and group by time were set as fixed
effects within the model.
The Box group and the Box-Fence group exercise splits were analyzed using the GLM
procedure of SAS (SAS Inst. Inc., Cary, NC). The experimental unit was individual horse, with
split times being measured at the end of the reining pattern, between the beginning of the box
cow work to the end of box cow work, and lastly the duration of the fence cow work.
42

RESULTS
Thirteen metabolic parameters were determined from blood samples from a total of
fifteen exercising reined cow horses. The results for blood lactate, blood pH, and blood glucose
are illustrated in Table 3.
Table 3 Treatment*time effects (P < 0.05) on workload in horses performing box cow work (Box) and box cow work followed by fence work (Box Fence) in a reined cow horse competition
Treatment Pre Post-Exercise Recovery Box § 2.65±1.13 1.52±1.21 Lactate
(mmol/L) Box-Fence §a 8.43±1.24b,z 5.07±1.24c,y
Box 7.45±0.02a 7.40±0.02b 7.42±0.02a,bpH Box-Fence 7.45±0.02a 7.34±0.02b,y 7.40±0.02c
Box 97.3±7.09 97.2±6.92 106±6.92 Glucose (mmol/L) Box-Fence 80.6±5.73a,x 106±5.73b 109±5.73b
a, b, c Means within a row with different superscripts are different (P<0.05) x,y,z Means within columns variable exhibit a trend (P<0.10), or differ (P<0.05), (P<0.01) § Means that blood lactate values were ≤ 0.08 mmol/L
Blood lactate was higher at the exercise (P=0.0028) and recovery (P= 0.049) samples in
the Box-Fence group compared to the Box group. Blood lactate concentration was determined to
increase (P<0.0001) at post-exercise within the Box-Fence group and to still be higher
(P=0.0001) than the pre sample at recovery. At post-exercise pH was determined to be lower
(P=0.026) in the Box-Fence group than the Box group. pH decreased within the Box-Fence
group (P=0.0001) and the Box group (P=0.049) at post-exercise compared to pre. pH was still
lower (P=0.022) within the Box-Fence group at the recovery sample compared to pre but higher
(P=0.039) than at post-exercise. There was a trend for glucose concentration to be lower
(P=0.091) at the pre sample within the Box-Fence group compared to the Box group. At post-
exercise and recovery glucose increased (P<0.0001 and P<0.0001) from pre within the Box-
Fence group.
Values for HCO3-, TCO2, pCO2, and BEecf are shown in Table 4. At post-exercise the
Box-Fence group demonstrated a decrease (P=0.03, P=0.031, and P=0.026) in HCO3-, TCO2, and
43

BEecf compared to the Box group. Within the Box-Fence group HCO3-, TCO2, pCO2, and
BEecf were lower (P<0.0001, P<0.0001, P=0.0065, and P<0.0001) at post-exercise compared to
pre. Within the Box-Fence group HCO3-, TCO2, and BEecf and demonstrated an increase
(P=0.0017, P=0.0019, and P=0.0022) at recovery compared to pre.
Table 4 Treatment*time effects (P < 0.05) on workload in horses performing box cow work (Box) and box cow work followed by fence cow (Box Fence) in a reined cow horse competition
Treatment Pre Post-Exercise Recovery
Box 31.1±2.13 28.8±2.10 30.6±2.10 HCO3 -(mmol/L)) Box Fence 31.0±2.11a 22.0±2.11b,y 25.9±2.11c
Box 43.1±1.78 44.1±1.73 45.0±1.74
pCO2 (mmHg) Box Fence 45.6±1.74a 41.2±1.74b 43.0±1.74a,b
Box 32.4±2.21 30.1±2.18 32.1±2.18 TCO2 (mmol/L)
Box Fence 32.3±2.20a 23.1±2.20b,y 27.3±2.20c
Box 7.34±2.42 4.30±2.37 6.55±2.37 BEecf
(mmol/L) Box Fence 7.44±2.43a -3.56±2.43b,y 1.30±2.43c
a, b, c Means within a row with different superscripts are different (P<0.05) y Means within columns variables differ (P<0.05)
Hematocrit and hemoglobin results are illustrated in Table 4. Differences between the
Box and Box-Fence groups were determined at post-exercise as both hematocrit and hemoglobin
were higher (P=0.033 and P=0.031) in the Box-Fence group than in the Box group. Within both
the Box and the Box-Fence groups hematocrit (P<0.0001 and P<0.0001) and hemoglobin
(P<0.0001 and P<0.0001) increased at post-exercise.
44

Table 5 Treatment*time effects (P < 0.05) on workload in horses performing box cow work (Box) and box cow work followed by fence cow (Box Fence) in a reined cow horse competition
Treatment Pre Post-Exercise Recovery
Box 35.3±1.52a 43.7±1.45b 35.7±1.45aHematocrit (%PCV) Box-Fence 36.6±1.51a 48.4±1.51b,y 37.0±1.51a
Box 11.9±0.44a 14.9±0.41b 12.1±0.41aHemoglobin (g/dL) Box-Fence 12.5±0.44a 16.5±0.51b,y 12.6±0.51a
a, b Means within a row with different superscripts are different (P<0.05) y Means within columns within variable differ (P<0.05)
Electrolytes including Na+, K+, and Cl- and anion gap are shown in Table 6. A trend for
an increase (P=0.073) in Na+ in the Box-Fence group was determined at post-exercise. Within
the Box-Fence group Na+ concentration was higher (P=0.0045 and P=0.0045) at post-exercise
than at pre or recovery. Differences between the Box and Box-Fence existed as K+ was
determined to be higher (P=0.05 and P=0.02) at post-exercise and at recovery in the Box-Fence
group horses. Also a trend was determined for a higher (P=0.085) K+ concentration in the Box-
Fence group at pre. Potassium concentration was determined to decrease (P=0.0072 and
P=0.039) within both the Box and the Box-Fence group between the pre sample and recovery. A
trend for higher (P=0.87) Cl- concentration was determined at post-exercise in the Box-Fence
group compared to the Box group. Chloride differed within the Box-Fence group as Cl- was
higher (P=0.0043) at post-exercise compared to recovery. Anion Gap was determined to be
higher (P=0.023) in the Box-Fence group at post-exercise and demonstrate a trend to be higher
(P=0.065) at recovery compared to the Box group. Differences in Anion Gap were determined
within the Box-Fence group with exercise and recovery being higher (P<0.0001 and P=0.0004)
than pre.
45

Table 6 Treatment*time effects (P < 0.05) on workload in horses performing box cow work (Box) and box cow work followed by fence cow (Box Fence) in reined cow horse competition
Treatment Pre Post-Exercise Recovery Box 135±0.49 136±0.47 136±0.47 Na+ (mmol/L) Box-Fence 135±0.49a 137±0.49b,x 135±0.49a
Box 3.77±0.15a 3.61±0.14a,b 3.21±0.14bK+ (mmol/L) Box-Fence 4.13±0.14a,x 4.02±0.14a,b,y 3.71±0.14b,y
Box 101±0.83 102±0.80 101±0.80 Cl- (mmol/L) Box-Fence 103±0.85a,b 104±0.85a,x 102±0.85b
Box 5.28±2.09 7.50±2.06 6.07±2.06 AnGap (mmol/L) Box-Fence 5.71±1.87a 14.4±1.87b,y 11.6±1.87b,x
a, b Means within a row with different superscripts are different (P<0.05) x,y Means within columns within variable demonstrate a trend (P<0.1) or differ (P<0.05)
Exercise durations of horses in the Box or Box-Fence groups are shown in Table 7.
Differences existed between the two groups during the box cow work phase of exercise as horses
in the Box-Fence group demonstrated a shorter (P=0.012) exercise duration. Box-Fence group
horses also demonstrate a trend to have a lower (P=0.076) total time than Box group horses.
Table 7 Duration of exercise (seconds) in horses performing box cow work (Box) and box cow work followed by fence cow work (Box Fence) in reined cow horse competition
Group Reining Rest Box Fence Total
Box 155±8.53 36.5±5.57 120±11.5 - 276±16.5
Box Fence 130±9.85 36.0±6.43 53.3±13.3y 39.0±3.17 219±19.0x
x,y Means within columns within variable demonstrate a trend (P<0.1) or differ (P<0.05)
Unfortunately, due to unforeseen technical difficulties we were unable to record adequate
numbers of individual heart rate to statistically analyze the data.
46

DISCUSSION
This study demonstrated changes in metabolic parameters associated with horses
exercising in the Box group compared to horses exercising in the Box-Fence group. The
differing metabolic parameters determined between the Box and Box-Fence groups after exercise
suggest that post-exercise intensity differed between the two groups. The results of this study
demonstrate that the addition of fence cow work induced changes in blood lactate, pH,
bicarbonate (HCO3-), total carbon dioxide (TCO2), base excess extracellular fluid (BEecf),
hematocrit, hemoglobin, potassium (K+), and anion gap.
The addition of fence work resulted in an increase in the blood lactate concentration
within the Box-Fence group compared to the Box group. The resulting higher accumulation of
blood lactate concentration in the Box-Fence group horses is attributed to the increase in
anaerobic workload that was associated with the increase in exercise intensity. Previous studies
in horses (Aguilera-Tejero et al., 2000; Art et al., 1990; Sexton and Erickson, 1990; Sloet van
Oldruitenborgh-Oosterbaan et al., 2006) have demonstrated that an increase in exercise intensity
resulted in accumulation of lactate and are consistent with our findings. Previous research has
also determined that a concentration of 4 mmol/L of blood lactate is associated with the point at
which the body can no longer utilize lactate in gluconeogenesis as rapidly as lactate is being
produced (Stainsby et al., 1991; Trilk et al., 2002; Wilson, 1983). As a result 4mmol/L is termed
the lactate threshold and is considered to be a reliable quantitative variable associated with
lactate accumulation and the body functioning primarily under anaerobic metabolism (Lindner,
1996a, b; Trilk et al., 2002; Werkmann, 1996). Accumulation of blood lactate beyond the
4mmol/L lactate threshold in the Box-Fence group horses and the lack of lactate concentration
beyond the lactate threshold in Box group horses indicates that that addition of fence cow work
47

resulted not only in an increase in exercise intensity beyond that of the Box group but also in an
increased anaerobic workload. The resulting decrease in blood lactate concentrations within the
Box-Fence group at recovery is due to lactate clearance as a consequence of metabolism under
aerobic conditions (Harris et al., 1987).
Blood pH fluctuation was consistent with changes in lactate concentration reflecting
anaerobic metabolism of muscle cells. Previous research in horses associated an increase in
exercise intensity to a resulting decrease in pH (Aguilera-Tejero et al., 2000; Foreman, 2004;
Sloet van Oldruitenborgh-Oosterbaan et al., 2006). The resulting decrease in blood pH can be
attributed to the reduction of accumulated blood lactate associated with anaerobic metabolism to
lactic acid (Aguilera-Tejero et al., 2000; Sloet van Oldruitenborgh-Oosterbaan et al., 2006). At
post-exercise the Box-Fence group demonstrated a lower blood pH value than the Box group
which is consistent with the increase in blood lactate concentration within the Box-Fence group
at post-exercise. This result is indicative of the increase in exercise intensity associated with the
addition of fence work and reflecting the acidosis associated with the accumulation of lactate
from anaerobic metabolism of muscle cells. The fluctuation of blood pH within the Box-Fence
group was consistent with the fluctuation of blood lactate concentration as pH was determined to
be at its lowest value at post-exercise in association with the highest lactate concentration
observed. At recovery blood pH was determined to be at a value in between exercise and pre at
recovery which again is consistent with the associated blood lactate concentration. Although
blood lactate did not differ within the Box group blood pH was determined to decrease at post-
exercise. A possibility for this may a result of the reduction of low levels of lactate present at
post-exercise in the Box group along with some utilization of HCO3-.
48

Glucose concentrations demonstrated an increase within the Box-Fence group between
pre and exercise. An increase in blood glucose concentrations can be associated with an increase
in exercise intensity as glucose is released during exercise to be utilized in glycolysis for energy
production (Geor et al., 2002; Romijn et al., 1993; Treiber et al., 2006). During intense exercise
proportional levels of epinephrine are released resulting in a proportional release of glucose into
circulation (Davies and Withrington, 1973). Circulating glucose is then utilized as the primary
energy source within the body. Thus, due to the increase in exercise intensity associated with the
addition of fence work higher levels of glucose were at post-exercise and at recovery within the
Box-Fence group. A trend for a higher blood glucose concentration in the Box group horses was
determined at pre. A possible explanation for this may be that horses in the Box group exercised
earlier in the morning as a result horses may have consumed roughages or grains within an hour
to two hours prior to exercise. Previous research has demonstrated that blood glucose
concentrations in horses increase after consuming roughages and grains and can remain above
average for hours depending on how much was consumed as well as physiological factors
associated with the individual animal (Evans, 1971; Ford and Evans, 1982; Hintz, 1975; Hintz et
al., 1971).
Previous research in horses has demonstrated that exceeding the lactate threshold as a
result of increased exercise intensity results in a correlating decrease in pH which is responsible
for a decrease in blood HCO3- concentration (Aguilera-Tejero et al., 2000; Foreman, 2004;
Forster et al., 1990; Sloet van Oldruitenborgh-Oosterbaan et al., 2006). The decrease in HCO3-
concentration is considered to be a compensatory mechanism to prevent an extreme decrease in
blood pH (Aguilera-Tejero et al., 2000). Under primarily anaerobic exercise conditions a
decrease in blood HCO3- concentration is the result of blood HCO3
- being neutralized primarily
49

by lactic acid in order to buffer blood pH. As determined by previous research, changes in
HCO3- concentration commensurate with changes in lactate concentration and pH in association
with increased exercise intensity (Taylor et al., 1995). Results determined in this study also
demonstrated a reciprocal relationship between blood lactate concentration, pH, and the addition
of fence work to horses in the Box-Fence group. As a result of an increase in blood lactate,
HCO3- was determined to be lower in the Box-Fence group at post-exercise than in the Box
group. Bicarbonate concentration fluctuated within the Box-Fence group as a result of exercise,
decreasing at the exercise sample and increasing at recovery. These results are indicative of the
increase in exercise demands and anaerobic metabolism associated with the addition of fence
work in the Box-Fence group.
Base excess extracellular fluid (BEecf) is indicative of blood pH and is a measure of the
amount of acid required to restore the blood to a resting pH of 7.4. Total carbon dioxide (TCO2)
is a measure of the total amount of CO2 in the blood. Both BEecf and TCO2 fluctuated
simultaneously with HCO3- and resulted in a decrease in TCO2 and BEecf at post-exercise in the
Box-Fence group horses compared to Box group horses. Base excess extracellular fluid and
TCO2 also were significantly lower at the post 1 time in the Box-Fence group compared to the
Box group. The resulting decrease in TCO2 and BEecf in Box-Fence horses can be associated
with the utilization of blood CO2 to form HCO3- in the bicarbonate buffer system. Results were
consistent with previous research that determined a correlation between consumption of
bicarbonate and a fall in blood TCO2 and BEecf in association with exercise intensity (Aguilera-
Tejero et al., 2000; Foreman, 2004; Forster et al., 1990). The resulting decrease in TCO2 and
BEecf within the Box-Fence group at post exercise followed by the increase at recovery is
consistent with the fluctuation of HCO3-.
50

Partial pressure of carbon dioxide (pCO2) is a measurement of the amount of CO2
dissolved in the blood and in previous research fluctuates similarly to TCO2 and HCO3- and
decrease with an increase in exercise intensity and anaerobic workload (Art et al., 1990;
Foreman, 2004; Forster et al., 1990; Sloet van Oldruitenborgh-Oosterbaan et al., 2006).
However, no differences were determined between the Box-Fence group and the Box group. A
previous study in horses determined similar results when comparing exercise workloads in
jumping horses and attributed this lack of change of pCO2 to only evaluating 6 horses for
changes in pCO2 (Sloet van Oldruitenborgh-Oosterbaan et al., 2006). Although this could be the
cause of the observed lack of change in pCO2 between the two groups despite the addition of
fence work to the Box-Fence group, another possibility could be that pCO2 was utilized at the
same rate in both the Box and Box-Fence groups whereas TCO2 and HCO3- were not. Consistent
with results evaluating an increase in exercise intensity previous findings in previous research
pCO2 decreased at post-exercise in the Box-Fence group (Art et al., 1990; Sloet van
Oldruitenborgh-Oosterbaan et al., 2006). In association with an increase in anaerobic
metabolism the decrease in pCO2 can be attributed to increased consumption of HCO3- .
An increase in hematocrit and hemoglobin within both groups was determined at the
post-exercise compared to pre. The increase in hematocrit and hemoglobin at the post-exercise
time period was followed by a decrease to a near resting value within 15 minutes after exercise.
The increase in hematocrit is due to an overall increase in exercise intensity within both groups.
As exercise level increases the proportional direct sympathetic nervous stimulation resulting in
an increases in circulating catecholamines which are responsible for causing a proportional
release of red blood cell (RBC’s) stored in the spleen of the horse (Davies and Withrington,
1973; Persson, 1969; Snow, 1979; Torten and Schalm, 1964). This is termed ‘natural blood
51

doping’ which takes place in the horse as an effort to accommodate the exercising tissues’
oxidative demands. The proportional increase in hemoglobin is due to RBC’s composition
containing multiple hemoglobin groups. The Box-Fence group had a higher hematocrit and
hemoglobin value at the post-exercise time period. The increase in hematocrit and hemoglobin
in the Box-Fence group suggests that the addition of fence work induced an increase in exercise
intensity. A previous study in ponies observed similar results as a result of increased workload
and also determined that there was a proportional increase in anaerobic metabolism, oxygen
demand, and hematocrit (Sexton and Erickson, 1990). Both hematocrit and hemoglobin
increased at post-exercise within both groups as a result of an increase in exercise intensity.
Blood Na+ concentration demonstrated a trend at the post-exercise time period for an
increase in the Box-Fence group horses compared to the Box group. Similarly, within the Box-
Fence group there was an increase in Na+ at the post-exercise time period. Previous research has
determined that Na+ concentration is normally maintained within a narrow range during exercise,
however, changes that do occur generally reflect changes in extracellular fluid balance (Leaf,
1962). As a result the increase in Na+ at the post-exercise time period could signify a net
movement of fluid out of the extracellular fluid compartment in the Box-Fence group horses
resulting in an increase in Na+ concentration. The increase in rate of loss of extracellular fluid
associated with the Box-Fence group horses could be attributed to an increase in exercise
workload as previous research has observed an increase in rate of extracellular fluid loss with an
increase in exercise intensity (Art et al., 1990).
Potassium concentration was found to be significantly higher within the Box-Fence group
compared to the Box group at post-exercise and at recovery. An increase in K+ concentration
with an increase in exercise intensity has previously been reported in humans (Bergstrom et al.,
52

1971; Coester et al., 1973) and horses (Rose et al., 1977). The higher level of K+ concentration
can be attributed to the increase in exercise associated with fence work. Similar research in
humans has determined that accumulation of extracellular potassium is proportional to the
frequency and duration of an applied stimulus (Martin and Morad, 1982). Both the Box-Fence
group and the Box group demonstrated a decrease in K+ at recovery compared to pre. As other
research evaluating workload have observed the resulting decrease in K+ after recovery is
associated with K+ is being actively pumped back into muscle cells (Sloet van Oldruitenborgh-
Oosterbaan et al., 2006).
Although it has previously been determined in humans that plasma Cl- levels generally
fluctuate very little during exercise because of a simultaneous loss of Cl- and water in
perspiration during and after exercise (Cohen et al., 1993) there was a trend associated with
horses in the Box-Fence group demonstrating a higher Cl- value at post-exercise compared to the
Box-group. A possible explanation for this observation could be due to the ionic association of
Na+ and Cl- and the possible loss of extracellular fluid in the Box-Fence group that resulted in a
similar trend in Na+ results. A higher rate of extracellular fluid loss could be associated with the
Box-Fence group compared to the Box group due to an increase in exercise workload associated
with the addition of fence work. The increase in rate of extracellular fluid loss has been
determined in previous research which observed an increase in rate of extracellular fluid loss in
association with an increase in exercise intensity (Andrews et al., 1994; Art et al., 1990; Carlson,
1987). The Box-Fence group demonstrated a decrease in Cl- between post-exercise and recovery.
The resulting decrease in Cl- concentration at recovery could be the result of loss of Cl- in
perspiration after exercise associated with Box-Fence group horses. Chloride concentration in
equine sweat has previously been found to be higher than Na+ concentration (McCutcheon et al.,
53

1995); as a result loss of Cl- by sweat could explain the decrease in Cl- found at recovery. As
previous research in humans indicates an increase in exercise intensity has been concluded result
in an increased perspiration rate (Convertino, 1983). The additional exercise intensity
associated with the addition of fence work in the Box-Fence group horses may have resulted in
an increased perspiration rate, resulting, in a decrease in Cl- at recovery.
Anion gap is defined as the difference between the sum of cations (particularly Na+ and
K+) and the sum of anions (particularly HCO3- and Cl-). During high intensity exercise previous
research indicates that there is an increase in Na+ and K+ accompanied by no change or a
tendency to decrease in Cl- and a decrease in HCO3- which results in an elevated anion gap after
exercise (Aguilera-Tejero et al., 2000; Carlson, 1987). Results were consistent with previous
research as the Box-Fence group demonstrated an increase in anion gap post-exercise and at
recovery. However, the observed increase in anion gap associated with the Box-Fence group can
be attributed to the consumption of HCO3- primarily by lactic acid in association with an increase
in anaerobic workload. As previously determined changes in HCO3- concentration
commensurate with changes in lactate concentration and pH in association with increased
exercise intensity (Taylor et al., 1995). Also, an increase in K+ as a result of an increase in
exercise intensity contributed to the change in anion gap as previous research in humans
determined that accumulation of extracellular potassium is proportional to the frequency and
duration of an applied stimulus (Martin and Morad, 1982). Anion gap increased at post-exercise
and recovery in Box-Fence group horses. The fluctuation within the Box-Fence group is also
due to the decrease of HCO3- and the increase of extracellular K+ in due to the previously
discussed reasons.
54

The results of duration of exercise phases or exercise phase splits between the two groups
demonstrated a trend in the Box-Fence group for a lower total exercise time than the Box group
despite the addition of fence cow work. The observed trend may be attributed to box cow work
being performed for a shorter duration of time in the Box-Fence group compared to the Box
group. These results indicate that the changes in blood biochemical variables associated with the
Box-Fence group were not due to an increase in exercise duration but instead a result of
increased exercise intensity in association with the addition of fence work.
In conclusion, when results are evaluated as a whole results implicate that the addition of
fence work to the Box-Fence group increases exercise intensity. As indicated by changes in
blood lactate concentration, pH, HCO3-, and TCO2 associated with exercise in the Box-Fence
group the addition of fence work not only increased exercise intensity compared to Box group
horses but also resulted a portion of exercise being performed under anaerobic conditions. Based
on this information future studies assessing workload associated in reined cow horses would be
highly beneficial and should take into consideration biochemical changes that might be
associated with each phase of exercise. Results evaluating the Box group horses indicate that
they are primarily functioning under aerobic respiration during exercise. As a result, an increase
in aerobic training might help to improve their aerobic capacity and as a consequence improve
overall performance. Training mechanisms that would help improve aerobic capacity might
consist of prolonged trotting, and an overall increase in exercise duration.
55

LITERATURE CITED
Aguilera-Tejero, E., J.C. Estepa, I. Lopez, S. Bas, R. Mayer-Valor, and M. Rodriguez. 2000. Quantitative analysis of acid-base balance in show jumpers before and after exercise. Res Vet Sci 68: 103-108.
Andrews, F. M., and T. L. Spurgeon. 1986. Histochemical staining characteristics of normal horse skeletal muscle. Am J Vet Res 47: 1843-1852.
Art, T., H. Amory, D. Desmecht, and P. Lekeux. 1990. Effect of show jumping on heart rate, blood lactate and other plasma biochemical values. Equine Vet J Suppl: 78-82.
Barton, M. H., L. Williamson, S. Jacks, and N. Norton. 2003. Body weight, hematologic findings, and serum and plasma biochemical findings of horses competing in a 48-, 83-, or 159-km endurance ride under similar terrain and weather conditions. Am J Vet Res 64: 746-753.
Bergstrom, J., G. Guarnieri, and E. Hultman. 1971. Carbohydrate metabolism and electrolyte changes in human muscle tissue during heavy work. J Appl Physiol 30: 122-125.
Carlson, G. P. 1987. Hematology and body fluids in the equine athlete: A review. Equine Exercise Physiology 2: 426-437.
Coester, N., J. C. Elliott, and U. C. Luft. 1973. Plasma electrolytes, ph, and ecg during and after exhaustive exercise. J Appl Physiol 34: 677-682.
Cohen, N. D., A.J. Roussel, J.H. Lumsden, A.C. Cohen, E. Grift, and C. Lewis.. 1993. Alterations of fluid and electrolyte balance in thoroughbred racehorses following strenuous exercise during training. Can J Vet Res 57: 9-13.
Convertino, V. A. 1983. Heart rate and sweat rate responses associated with exercise-induced hypervolemia. Med Sci Sports Exerc 15: 77-82.
Cottin, F., E. Barrey, P. Lopes, and V. Billat. 2006. Effect of repeated exercise and recovery on heart rate variability in elite trotting horses during high intensity interval training. Equine Vet J Suppl: 204-209.
Davies, B. N., and P. G. Withrington. 1973. The actions of drugs on the smooth muscle of the capsule and blood vessels of the spleen. Pharmacol Rev 25: 373-413.
Evans, J. W. 1971. Effect of fasting, gestation, lactation and exercise on glucose turnover in horses. J Anim Sci 33: 1001-1004.
Ford, E. J., and J. Evans. 1982. Glucose utilization in the horse. Br J Nutr 48: 111-117. Foreman, J. H., J.K. Waldsmith, and R.B. Lalum. 2004. Physical, acid-base and elctrolyte
changes in horses competing in training, preliminary and intermediate horse trials. Equine and Comparative Exercise Physiology 1: 99-105.
Forster, H. V., C. L. Murphy, A. G. Brice, L. G. Pan, and T. F. Lowry. 1990. In vivo regulation of plasma [h+] in ponies during acute changes in pco2. J Appl Physiol 68: 316-321.
Geor, R. J., L. J. McCutcheon, K. W. Hinchcliff, and R. A. Sams. 2002. Training-induced alterations in glucose metabolism during moderate-intensity exercise. Equine Vet J Suppl: 22-28.
Harris, R. C., D. J. Marlin, and D. H. Snow. 1987. Metabolic response to maximal exercise of 800 and 2,000 m in the thoroughbred horse. J Appl Physiol 63: 12-19.
Hintz, H. F. 1975. Digestive physiology of the horse. J S Afr Vet Assoc 46: 13-17. Hintz, H. F., D. E. Hogue, E. F. Walker, Jr., J. E. Lowe, and H. F. Schryver. 1971. Apparent
digestion in various segments of the digestive tract of ponies fed diets with varying roughage-grain ratios. J Anim Sci 32: 245-248.
56

Leaf, A. 1962. The clinical and physiologic significance of the serum sodium concentration. N Engl J Med 267: 77-83 concl.
Lindner, A. 1996a. Determination of maximal lactate steady state in blood of horses. . Proc. Am. Ass. equine Practners. 42: 326-327.
Lindner, A. 1996b. Measurement of plasma lactate concentration with accusport. Equine Vet J 28: 403-405.
Lucke, J. N., and G. N. Hall. 1980. Further studies on the metabolic effects of long distance riding: Golden horseshoe ride 1979. Equine Vet J 12: 189-192.
Marlin, D. J., P.A. Harris, R.C. Schroter, R.C. Harris, C.A. Robers, C.M. Scott, C.E. Orme, M. Dunnett, S.J. Dyson, and F. Barrelet. 1995. Physiological, metabolic and biochemical responses of horses competing in the speed and endurance phase of a cci*****3-day-event. Equine Vet J Suppl: 37-46.
Martin, G., and M. Morad. 1982. Activity-induced potassium accumulation and its uptake in frog ventricular muscle. J Physiol 328: 205-227.
McCutcheon, L. J., R. J. Geor, M. J. Hare, G. L. Ecker, and M. I. Lindinger. 1995. Sweating rate and sweat composition during exercise and recovery in ambient heat and humidity. Equine Vet J Suppl: 153-157.
Persson, S. G. B. 1969. On blood volume and working capacity in horses. Acta. Vet. Scand. 19: 1-189.
Romijn, J. A., E.F. Coyle, L.S. Sidossis, A. Gastaldelli, J.F. Horowitz, E. Endert, and R. Wolfe. 1993. Regulation of endogenous fat and carbohydrate metabolism in relation to exercise intensity and duration. Am J Physiol 265: E380-391.
Rose, R. J., R. A. Purdue, and W. Hensley. 1977. Plasma biochemistry alterations in horses during an endurance ride. Equine Vet J 9: 122-126.
Rose, R. J., K. S. Arnold, S. Church, and R. Paris. 1980. Plasma and sweat electrolyte concentrations in the horse during long distance exercise. Equine Vet J 12: 19-22.
Schott, H. C. 2nd. 2006. Changes in selected physiological and laboratory measurements in elite horses competing in a 160 km endurance ride. Equine Vet J Suppl: 37-42.
Sexton, W. L., and H. H. Erickson. 1990. Effects of treadmill elevation on heart rate, blood lactate concentration and packed cell volume during graded submaximal exercise in ponies. Equine Vet J Suppl: 57-60.
Sloet van Oldruitenborgh-Oosterbaan, M. M., A. J. Spierenburg, and E. T. van den Broek. 2006. The workload of riding-school horses during jumping. Equine Vet J Suppl: 93-97.
Snow, D. H. 1979. Metabolic and physiological effects of adrenoceptor agonists and antagonists in the horse. Res Vet Sci 27: 372-378.
Snow, D. H., P. Baxter, and R. J. Rose. 1981. Muscle fibre composition and glycogen depletion in horses competing in an endurance ride. Vet Rec 108: 374-378.
Stainsby, W. N., W. F. Brechue, and D. M. O'Drobinak. 1991. Regulation of muscle lactate production. Med Sci Sports Exerc 23: 907-911.
Taylor, L. E., P. L. Ferrante, D. S. Kronfeld, and T. N. Meacham. 1995. Acid-base variables during incremental exercise in sprint-trained horses fed a high-fat diet. J Anim Sci 73: 2009-2018.
Torten, M., and O. W. Schalm. 1964. Influence of the equine spleen on rapid changes in the concentration of erythrocytes in peripheral blood. Am J Vet Res 25: 500-504.
Treiber, K. H., R.J. Geor, R.C. Boston, T.M. Hess, P.A. Harris, and D.S. Kronfeld. 2006. Glucose dynamics during exercise: Dietary energy sources affect minimal model
57

parameters in trained arabian geldings during endurance exercise. Equine Vet J Suppl: 631-636.
Trilk, J. L., A. J. Lindner, H. M. Greene, D. Alberghina, and S. J. Wickler. 2002. A lactate-guided conditioning programme to improve endurance performance. Equine Vet J Suppl: 122-125.
Werkmann, J., Lindner, A. and Sasse, H.H.L. 1996. Conditioning effects in horses of exercise of 5, 15, and 25 minutes' duration at two blood lactate concentrations. Pferdeheilkunde 12: 474-479.
Wilson, R. G. 1983. Heart rate, lactic acid production, and speed during a standardised exercise test in standardbred horses. Equine Exercise Physiology: 487-496.
58

CHAPTER 4
FACTORS ASSOCIATED WITH COW WORK EXERCISE AFTER COMPLETION OF A
REINING PATTERN IN REINED COW HORSES
ABSTRACT
This study was conducted in an attempt to gather more information related to the increase
in exercise metabolics associated with cow work in seasoned reined cow horses. With owner
permission four privately owned, healthy reined cow horses participating in a reined cow horse
clinic were used for this study. The objectives of the study are to 1) evaluate exercise workload
in reined cow horses performing cow work after completion of a reining pattern by measuring
heart rate and blood biochemical values. The hypotheses of this study is that 1) heart rate and
blood biochemical values will show that reined cow horses rely on a portion of anaerobic
metabolism to complete required cow work and 2) that performing a reining pattern requires less
anaerobic metabolism than cow work. Venous blood samples were taken by venipuncture of the
jugular vein before exercise (PRE), 5 minutes after the reining pattern was complete (REIN), 5
minutes after completion of cow work (COW), and 10 minutes after the previous sample
(RECOVERY). Blood samples were then analyzed for blood lactate, pH, glucose, bicarbonate
(HCO3-), partial pressure of carbon dioxide (pCO2), total carbon dioxide concentration (TCO2),
hematocrit (%PCV), hemoglobin (Hb), sodium (Na+), potassium (K+), chloride (Cl-), and anion
gap. Differences (P<0.05) associated with cow work were found in blood lactate, pH, glucose,
HCO3-, TCO2, hematocrit, hemoglobin, K+, Cl-, and anion gap. Mean blood lactate levels were
found to be higher with COW (7.5±0.78 mmol/L; P=0.0002) and RECOVERY samples
(6.05±0.78 mmol/L; P=0.001) compared to REIN (0.8±0.78 mmol/L). Blood pH values after
cow work were lower (7.35±0.014; P=0.0003) than after reining (7.46±0.014). Blood glucose
59

increased at COW (101±2.34 mmol/L; P=0.0012) and at RECOVERY (106±2.34 mmol/L;
P=0.0002) compared to REIN (85.8±2.34). Hematocrit and hemoglobin increased at COW
(49.3±0.89 %PCV; P=0.0008 and 16.7±0.31 g/dL; P=0.0009) compared to values obtained at
REIN (43.0±0.89 %PCV and 14.6±0.31 g/dL). Potassium concentration was determined to be
lower at COW (3.45±0.05 mmol/L; P=0.048) compared to the K+ concentration obtained at PRE
(3.63±0.05 mmol/L). Chloride concentration and anion gap were higher (P=0.03 and P=0.0015)
at COW (105±0.21 mmol/L and 14.3±1.06 mmol/L) compared to PRE. Bicarbonate and TCO2
both decreased (P=0.0007 and P=0.0007) within 5 minutes after cow work (21.3±1.14 mmol/L
and 22.5±1.16 mmol/L) compared to REIN (29.38±1.14 and 30.75±1.16). The results of this
study demonstrate that cow work provokes an increase in exercise intensity in reined cow horses.
The results also indicate that the workload of reined cow horses performing a reining pattern
requires less anaerobic metabolism to complete exercise. Due to the increase in anaerobic
exercise that is associated with cow work utilizing training mechanisms that are known to
increase anaerobic capacity could enhance performance.
60

INTRODUCTION
Aerobic respiration serves as the primary source of exercise metabolism while at rest or
under low intensity exercise. As a consequence of no constraints on oxygen availability or
utilization associated with aerobic respiration, aerobic respiration is considered to be highly
efficient resulting in maximal ATP production. Energy is produced by three systems known as
glycolysis, the tricarboxylic acid (TCA) cycle, and electron transport chain under aerobic
respiration. As exercise intensity increases pyruvate, the end product of glycolysis, cannot be
utilized rapidly enough by the TCA cycle. Also, the electron transport chain cannot utilize TCA
cycle byproducts at a rapid enough rate. As a result there is a build up of pyruvate outside of the
mitochondria. In order to produce adequate amounts of NAD+ to facilitate glycolysis pyruvate is
converted to lactate by enzyme the lactate dehydrogenase. Lactate can be adequately utilized by
gluconeogenesis to prevent build up in the blood until the blood lactate concentration reaches
4mmol/L (Trilk et al., 2002; Wilson, 1983). The lactate threshold is considered to be the point at
which horses accumulate 4 mmol/L of lactate in the blood. This has been determined to be a
reliable quantitative variable associated with the point at which lactate beings to accumulate
within the blood and the body is primarily functioning under anaerobic conditions (Lindner,
1996a, b; Trilk et al., 2002; Werkmann, 1996). Blood lactate measurements are frequently used
to evaluate exercise intensity in horses (Aguilera-Tejero et al., 2000; Art et al., 1990; Sexton and
Erickson, 1990; Sloet van Oldruitenborgh-Oosterbaan et al., 2006) as lactate accumulation serves
as a direct indicator of exercise intensity (Trilk, et al., 2002). An increase in exercise intensity
and blood lactate accumulation have been associated with an increase in velocity of racing
standardbreds and thoroughbreds (Lindner, 1996a, b, 2000; Werkmann, 1996), in show jumpers
with the addition of jumps (Aguilera-Tejero et al., 2000; Art et al., 1990; Sloet van
61

Oldruitenborgh-Oosterbaan et al., 2006), and in ponies as elevation increased on treadmills
(Sexton and Erickson, 1990). In a sister study blood lactate concentrations evaluated in reined
cow horses at a reined cow competition demonstrated an increase associated with the addition of
fence work to a reining pattern and box cow work.
An increase in blood lactate concentration as a result of exercise intensity is also
associated with changes in pH, bicarbonate (HCO3-), partial pressure carbon dioxide (pCO2), and
total carbon dioxide (TCO2) (Aguilera-Tejero et al., 2000; Art et al., 1990; Sloet van
Oldruitenborgh-Oosterbaan et al., 2006). Other variables such as hematocrit, hemoglobin,
potassium (K+), sodium (Na+), chloride (Cl-), and glucose have also been determined to fluctuate
with changes in exercise intensity (Art et al., 1990; Sexton and Erickson, 1990; Sloet van
Oldruitenborgh-Oosterbaan et al., 2006). An increase in exercise intensity and lactate
accumulation in the blood results in a correlating decrease in blood pH. The decrease in blood
pH is primarily due to the reduction of lactate to lactic acid. In association with the decrease in
pH blood HCO3- concentration decreases as HCO3
- buffers blood pH and is neutralized by lactic
acid (Aguilera-Tejero et al., 2000; Art et al., 1990; Foreman, 2004). Associated with the
decrease in HCO3- is a decrease in pCO2, TCO2, and base excess extracellular fluid as CO2 is
utilized in the bicarbonate buffer system to create HCO3- (Aguilera-Tejero et al., 2000; Art et al.,
1990; Foreman, 2004; Forster et al., 1990; Sloet van Oldruitenborgh-Oosterbaan et al., 2006).
Heart rate is a consistent factor that can be used to evaluate the workload of horses. As exercise
intensity increases there is a correlating increase in heart rate which increases the rate at which
RBC’s circulate throughout exercising tissue and deliver oxygen (Art et al., 1990; Cottin et al.,
2006; Sexton and Erickson, 1990; Sloet van Oldruitenborgh-Oosterbaan et al., 2006). Heart rate
in association with anaerobic threshold has been determined to be between 150 to 160 beats per
62

minute (Persson, 1983). An increase in hematocrit and hemoglobin concentration is a well
known response to an increase in exercise intensity in horses. Increase in hematocrit and
hemoglobin occurs to increase the oxygen carrying capacity of blood, and is due to the release of
the splenic reserve of red blood cells (RBC) (Art et al., 1990; Geor et al., 1994; Sloet van
Oldruitenborgh-Oosterbaan et al., 2006). Electrolytes (Na+, K+, Cl-) also serve as an indicator of
exercise intensity in horses. As exercise intensity increases there is a subsequent accumulation
in extracellular Na+, and K+, and a slight decrease or no change in Cl- (Aguilera-Tejero et al.,
2000). Changes in blood glucose concentration are indicative of workload. As exercise intensity
increases there is a resulting increase in glucose for utilization by exercising muscle tissue (Geor
et al., 2002).
Although several studies have previously investigated the workload of multiple horse
riding disciplines, primarily of racehorses (Lucke and Hall, 1980; Rose et al., 1977; Rose et al.,
1980; Snow et al., 1982), endurance horses (Barton et al., 2003; Marlin et al., 1995; Schott et al.,
2006), and jumping horses (Aguilera-Tejero et al., 2000; Art et al., 1990; Sloet van
Oldruitenborgh-Oosterbaan et al., 2006) there is limited information regarding the demands of
exercise in Quarter and Paint horse disciplines and to the authors’ knowledge no research has
been done on these horses participating in reined cow horse events. Reined cow horses appear to
exercise at high intensities, and knowledge about their exercise metabolics would be beneficial
and may improve training protocols. In a sister study conducted evaluating reined cow horses
performing a reining pattern followed by box cow work and horses performing a reining pattern
followed by box cow work with the addition of fence cow work indicated that the addition of
fence work to a reining pattern and box cow work caused a resulting increase in exercise
intensity. The determined increase in exercise intensity associated with fence work resulted in a
63

portion of anaerobic metabolism being required for completion of exercise. However, we were
unable to separate cow work from the reining pattern when collecting blood samples. As a result
this study was conducted in 4 privately owned reined cow horses in an effort to primarily focus
on the exercise effects associated with cow work.
The objectives of the study is to evaluate exercise workload in reined cow horses
performing cow work after completion of a reining pattern by measuring heart rate and blood
biochemical values.
Our hypotheses is that 1) heart rate and blood biochemical values will show that reined
cow horses rely on a portion of anaerobic metabolism to complete required cow work and 2) that
performing a reining pattern requires less anaerobic metabolism than cow work.
64

MATERIALS AND METHODS Horses
Four privately owned American Quarter Horses with owner permission were used for this
study. All horses used are seasoned reined cow horses participating in a reined cow horse clinic
instructed by a professional reined cow horse trainer.
Exercise
All horses performed reining pattern 3 designed by the NRCHA (Appendix 3). After 5
minutes horses continued into box cow work followed immediately by fence cow work. The box
portion of cow work is conducted by the horse and rider maintaining the cow between the rail
and the horse and turning it on the short end of the arena until the judge determines the horse has
had an opportunity to demonstrate their abilities.
After completion of box cow work horses then proceeded immediately into fenced cow
work. Fence work allows the rider to determine when they have performed adequate box work.
Once the rider decides adequate box work has been performed the horse and rider send the cow
down the long side of the arena fence. Upon reaching the end of the arena the horse and rider
turn the cow in the opposite direction and run the cow back down the long end of the fence. The
cow is then turned in the opposite direction again and the horse and rider again run the cow down
the long end of the fence. The horse and rider then proceed to ride a circle along side the cow
with the cow on the inside of the circle. After completing the first circle the horse and rider then
proceed to perform another circle in the opposite direction with the cow on the opposite side of
the horse and rider with the horse and rider again on the outside of the circle.
Heart Rate
Prior to beginning the exercise the horses were equipped with Polar S610i heart rate
monitorsTM (Polar Electro Oy, Finland) (HRM) with one electrode placed under the girth behind
65

the left elbow, and the other under the saddle at the withers. Heart rate memory began at the
start of the reining pattern and recorded at 5 second intervals until completing the cow work.
Throughout the duration of exercise time splits were recorded and noted between exercise phase
transitions. Transition times were considered to be between the reining pattern and boxed cow
work and between boxed cow work and fenced cow work. Time was recorded marking
transition in an effort to correlate transition points with changes in heart rate. By recording time
and marking transitions during performance it was possible to match exercise phase transitions
with the changes in heart rate. As horses completed exercise HRM’s were removed from the
horse and rider and all heart rate data recorded during exercise was downloaded onto the
computer for further analysis.
Blood Sampling and Analyses
Twenty mL blood samples were taken by venipuncture of the jugular vein with a 20
gauge needle and 20mL syringe. Samples were obtained while horses were at rest within 10
minutes prior to competition (PRE), 5 minutes after reining pattern (REIN), 5 minutes after cow
work was complete (COW), and the final sample (RECOVERY) was obtained 10 minutes after
the previous sample. Blood samples were then placed into a 10ml 16 x 100 vacuum lithium
heparin tube for analysis of lactate, pH, glucose, bicarbonate (HCO3-), total carbon dioxide
(TCO2), partial pressure carbon dioxide (pCO2), hematocrit, hemoglobin, sodium (Na+),
potassium (K+), chloride (Cl-), and anion gap, and a 10ml 16 x 100 vacuum sodium citrate tube
for analysis of lactate. Although vacuum heparin tubes were used lids were removed and blood
samples were placed into the tubes by the syringe to avoid any chance of hemolysis of red blood
cells. Lids were then placed back onto the tubes and the tubes were inverted multiple times to
prevent clotting of RBC’s.
66

Seventy μL of blood was used to determine lactate, pH, glucose, HCO3-, TCO2, pCO2,
hematocrit, hemoglobin, Na+, K+, Cl-, and anion gap using an i-STAT analyzer with an E8C+
cartridge (Heska, Loveland, Co.). The EC8+ self calibrates the i-STAT for each sample
analyzed. Results from the i-STAT were determined within 10 minutes after blood samples were
drawn and printed within 2 minutes after placing the cartridge with 70μL of blood into the i-
STAT.
Five μL of blood was used to determine lactate concentration by the lactate pro (FaCT,
Quesnel Canada). The Lactate Pro calculated lactate levels in blood samples within 5 minutes
after blood samples were drawn and 60 seconds after blood was exposed to the lactate pro.
Results were recorded by hand. Blood lactate values were unable to be determined at a
concentration of 0.8 mmol/L or less on the Lactate Pro. As a result statistical analysis was
determined based on a 0.8 value for the PRE sample
Statistics
Blood samples were analyzed using the GLM procedure of SAS (SAS Inst. Inc., Cary,
NC). The model evaluated the statistical significance between blood samples and time during
exercise. Differences between means were considered significant at P < 0.05 and to resemble a
trend at P<0.10.
67

RESULTS Blood lactate, pH, and glucose values are illustrated in Table 8. As demonstrated by
Table 8 there was an increase (P=0.0002 and P=0.001) in blood lactate and a decrease (P=0.0003
and P=0.0027) in pH at COW and RECOVERY compared to REIN and PRE. Blood glucose
concentration was found to be lower at REIN compared to PRE (P=0.011), COW (P=0.0012),
and RECOVERY (P=0.0002).
Table 8 Blood value*time effects (P < 0.05) on workload in reined cow horses performing a reining pattern followed by box and fence cow work
Time: PRE REIN COW RECOVERY
Lactate (mmol/L) §a §a 7.5±0.78b 6.05±0.78b
pH 7.46±0.014a 7.46±0.014a 7.35±0.014b 7.38±0.014b
Glucose (mmol/L) 96.3±2.34a 85.8±2.34b 101±2.34a 106±2.34a
a, b, Means within a row with different superscripts are different (P<0.05) § Means values were ≤ 0.08mmol/L
Bicarbonate, TCO2, and pCO2 are illustrated in Table 9. As shown TCO2 and HCO3-
fluctuate similarly as they demonstrated a decrease at the COW compared to PRE (P=0.002 and
P=0.0019) or REIN (P=0.0007 and P=0.0007). Total carbon dioxide and HCO3 remained lower
at RECOVERY than PRE (P=0.014 and P=0.014) or REIN (P=0.0041 and P=0.0047).
Table 9 Blood value*time effects (P < 0.05) on workload in reined cow horses performing a reining patternfollowed by box and fence cow work
Time: PRE REIN COW RECOVERY
HCO3- (mmol/L) 28.3±1.14a 29.4±1.14a 21.3±1.14b 23.4±1.14b
pCO2 (mmHg) 39.8±0.79 41.0±0.79 38.8±0.79 39.3±0.79
TCO2 (mmol/L) 29.5±1.16a 30.8±1.16a 22.5±1.16b 24.5±1.16b
a, b Means within a row with different superscripts are different (P<0.05)
68

Hematocrit and hemoglobin values obtained from blood samples are shown below in
Table 10. Hematocrit and hemoglobin fluctuated simultaneously, with an increase demonstrated
at REIN (P=0.0004 and P=0.0005) and RECOVERY (P=0.001 and P=0.0012) compared to PRE.
Hematocrit and hemoglobin were found to be higher at COW compared to PRE (P<0.0001 and
P<0.0001), REIN (P=0.0008 and P=0.0009), and RECOVERY (P=0.0003 and P=0.0004).
Table 10 Blood value*time effects (P < 0.05) on workload in reined cow horses performing a reining pattern followed by box and fence cow work
Time: PRE REIN COW RECOVERY
Hematocrit (%PCV) 36.0±0.89a 43.0±0.89b 49.3±0.89c 42.0±0.89b
Hemoglobin (g/dL) 12.3±0.31a 14.6±0.31b 16.7±0.31c 14.3±0.31b
a, b, c Means within a row with different superscripts are different (P<0.05)
Blood electrolyte (Na+ K+ Cl-) values associated with exercise as well as anion gap are
represented in Table 11. Anion gap is calculated based on the difference in the sum of cations
Na+ K+ and the sum of anions Cl- and HCO3-. Potassium revealed an increase (P= 0.048) at
COW compared to PRE. Chloride demonstrated an increase (P=0.031) at COW compared to
PRE. Anion gap concentration showed an increase at COW and RECOVERY compared to PRE
(P=0.0015 and P=0.012) and REIN (P=0.0007 and P=0.0052).
Table 11 Blood value*time effects (P < 0.05) on workload in reined cow horses performing a reining pattern followed by box and fence cow work
Time: Pre Rein Cow Recovery
Na+ (mmol/L) 136±0.29 136±0.29 137±0.29 139±0.29
K+ (mmol/L) 3.63±0.05a 3.58±0.05a,b 3.45±0.05b 3.53±0.05a,b
Cl- (mmol/L) 104±0.21a 104±0.21a,b 105±0.21b 104±0.21a,b
AnGap (mmol/L) 7.5±1.06a 6.75±1.06a 14.3±1.06b 12.3±1.06b
a, b Means within a row with different superscripts are different (P<0.05)
69

Unfortunately, due to unforeseen technical difficulties we were unable to record adequate
numbers of individual heart rate to statistically analyze the data.
70

DISCUSSION
Based on variables determined, cow work can be associated with an increase in exercise
intensity. Blood lactate changes associated with cow work was very indicative of this increase in
workload as it demonstrated that workload was increased to a level at which a portion of
anaerobic respiration was required for completion of exercise. Conversely, after performing a
reining pattern horses did not demonstrate an increase in blood lactate concentration. The
increase in blood lactate concentration at COW (7.5±0.78) and at RECOVERY (6.05±0.78)
indicated that the lactate threshold (4mmol/L) was crossed as a result of cow work. Blood
lactate concentrations increases the 4mmol/L concentration is termed the anaerobic threshold and
is considered to be a reliable quantitative variable associated with lactate accumulation and the
body functioning primarily under anaerobic conditions (Lindner, 1996a, b; Trilk et al., 2002;
Werkmann, 1996). Previous research has determined that lactate produced below a
concentration of 4mmol/L can be utilized as rapidly as it is produced and as a result does not
accumulate (Stainsby et al., 1991; Trilk et al., 2002; Wilson, 1983). Because the blood lactate
concentration did not exceed the anaerobic threshold after completion of a reining pattern (≤0.8)
the reining pattern was performed primarily under aerobic conditions. Blood lactate
accumulation as a result of exercise can be attributed to the increase in exercise intensity
associated with cow work. Previous research in horses evaluating exercise intensity also
determined that an increase in exercise intensity was responsible for lactate accumulation beyond
the lactate threshold (Aguilera-Tejero et al., 2000; Art et al., 1990; Sexton and Erickson, 1990;
Sloet van Oldruitenborgh-Oosterbaan et al., 2006).
Blood pH level fluctuated simultaneously with blood lactate concentration throughout
exercise. This simultaneous fluctuation is a well known response to an increase in exercise
71

intensity resulting in accumulation of blood lactate. Previous research in horses has associated
an increase in exercise intensity resulting in an increase in blood lactate concentration to a
simultaneous decrease in blood pH (Aguilera-Tejero et al., 2000; Foreman, 2004; Sloet van
Oldruitenborgh-Oosterbaan et al., 2006). As demonstrated in a previous study accumulation of
lactic acid, results in a correlating acidosis of the blood causing a decrease in blood pH under
primarily anaerobic conditions (Aguilera-Tejero et al., 2000). The pH values measured in this
study were found to be consistent with previous research. In association with cow work blood
lactate concentration was determined to increase at cow and recovery compared to pre or rein
and resulted in a decrease in pH at cow and recovery as well.
Previous research in horses has demonstrated that exceeding the lactate threshold as a
result of increased exercise intensity results in a correlating decrease in pH which is responsible
for a decrease in blood HCO3- concentration (Aguilera-Tejero et al., 2000; Foreman, 2004;
Forster et al., 1990; Sloet van Oldruitenborgh-Oosterbaan et al., 2006). The decrease in HCO3-
concentration is considered to be a compensatory mechanism to prevent an extreme decrease in
blood pH (Aguilera-Tejero et al., 2000). Under primarily anaerobic exercise conditions a
decrease in blood HCO3- concentration is the result of blood HCO3
- being neutralized primarily
by lactic acid in order to buffer blood pH. As determined by previous research, changes in
HCO3- concentration commensurate with changes in lactate concentration and pH in association
with increased exercise intensity (Taylor et al., 1995). Results determined in this study also
demonstrated a reciprocal relationship between blood lactate concentration, pH, and the increase
in exercise intensity associated with cow work. As a result of an increase in blood lactate,
HCO3- were reduced at cow and remained reduced at recovery as well. Ultimately, the decrease
in blood HCO3- concentration can be attributed to the significant increase in blood lactate
72

concentration as a result of cow work. According to a previous study in standardbred horses
changes in HCO3 and blood lactate concentrations can only occur under intense exercise
conditions such as running at 600m/min (Milne et al., 1976). As a result the significant decrease
in HCO3- resulting from cow work illustrates the exercise intensity associated with cow work in
reined cow horses.
Blood HCO3- production is a result of the bicarbonate buffer system which utilizes the
build up of CO2 in the blood that occurs under intense exercise. As a result total carbon dioxide
(TCO2) in the blood as well as partial pressure of carbon dioxide or dissolved carbon dioxide in
the blood (pCO2) significantly fluctuates simultaneously with HCO3- due to increased utilization
of CO2 in the bicarbonate buffer system. As a result studies in horses have observed a
simultaneous fluctuation in pCO2, TCO2, and HCO3- as a result of exercise intensity (Art et al.,
1990; Foreman, 2004; Forster et al., 1990). Results in this study were consistent with those
previously determined as TCO2 and HCO3- fluctuated simultaneously, decreasing as a result of
cow work. However, pCO2 did not fluctuate with TCO2 and HCO3-. A previous study in horses
determined similar results when comparing exercise workloads in jumping horses and attributed
this lack of change in pCO2 to a lack of observations (Sloet van Oldruitenborgh-Oosterbaan et
al., 2006). Although a lack of observations is a possible justification for the lack of fluctuation in
pCO2, a sister study evaluating workload in reined cow horses observed a similar lack in
fluctuation of blood pCO2 in association with cow work. A possible explination for the lack in
pCO2 fluctuation is that TCO2 is initially utilized in the bicarbonate buffer system and that
exercise did not occur for a long enough period of time to observe changes in pCO2 .
Under intense exercise conditions a proportional stimulation from the sympathetic
nervous system results in an increase in circulating catecholamines in the blood stream
73

(Celander, 1954; Davies and Withrington, 1973). Circulating catecholamines such as epinephrine
are responsible for the stimulation of glycogenolysis and other factors associated with exercise
such as an increase in hematocrit (Rhoades, 2003). The decrease in blood glucose at rein could
be attributed to a lack of exercise intensity and a lack of circulating catecholamines associated
with performing a reining pattern. Due to a lack of circulating catecholamines glycogenolysis is
not stimulated to release glucose into circulation. As a result glucose in the blood is utilized
without being replenished by glycogenolysis. Previous research in ponies has associated a lower
exercise intensity to a lack of increase in blood glucose concentration (Romijn et al., 1993). An
increase in blood glucose from rein to cow was determined and can be recognized as the result of
an increase in exercise intensity associated with cow work. The increase in blood glucose in
association with cow work is consistent with other research associating an increase in exercise
intensity to an increase in blood glucose concentration (Geor et al., 2002; Romijn et al., 1993;
Treiber et al., 2006).
An increase in hematocrit is a well known response to exercise in horses (Sexton and
Erickson, 1990). In ponies and horses hematocrit increases during exercise as a result of splenic
contraction (Persson, 1969; Torten and Schalm, 1964). Similar to an increase in blood glucose
concentration associated with exercise, splenic contraction is the result of direct sympathetic
nervous stimulation and a resulting increase in circulating catecholamines (Davies and
Withrington, 1973; Snow, 1979). Because hemoglobin is found within red blood cells (RBC)
hemoglobin fluctuates consistently with hematocrit. The resulting increase in hematocrit and
hemoglobin observed during exercise at rein, and again at cow demonstrate elevations in stress
specifically associated with exercise intensity. Results are consistent with previous research
evaluating exercise intensity in ponies and horses (Art et al., 1990; Sexton and Erickson, 1990;
74

Sloet van Oldruitenborgh-Oosterbaan et al., 2006). At recovery hematocrit and hemoglobin
represent an increase compared to pre, however, these findings can be attributed to the 15
minutes of recovery and RBC’s being sequestered in the spleen for storage. These results are
consistent with a recovery period of 15 minutes in jumping horses after exercise (Sloet van
Oldruitenborgh-Oosterbaan et al., 2006).
Although previous studies in horses have observed an increase in Na+ concentration, Na+
concentration during exercise in this study did not fluctuate. (Aguilera-Tejero et al., 2000;
Harris et al., 1987; Sloet van Oldruitenborgh-Oosterbaan et al., 2006). However, studies have
determined that an increase in Na+ as a result of exercise is frequently due to dehydration.
(Andrews et al., 1994; Marlin et al., 1995) Thus, the lack of any significant changes in Na+
concentration after cow work are not indicative of a lack of exercise intensity, but instead,
possibly because horses did not exercise for a long enough period of time to become dehydrated.
Previous research had found an increase in K+ as a result of exercise (Aguilera-Tejero et
al., 2000; Sloet van Oldruitenborgh-Oosterbaan et al., 2006). However, K+ concentration
demonstrated a significant decrease after cow work compared to immediately before. A possible
justification for this result may be due to an increase in K+ uptake rate and intensity that has been
associated with a high fitness level in animals (Martin and Morad, 1982). Because the horses
were given 5 minutes after completion of both the reining pattern and cow work Na+/ K+ pumps
could have pumped accumulated extracellular K+ back into muscle cells before the rein and cow
samples were taken. This result would also be consistent with the lack of fluctuation in blood
Na+ concentration after exercise as Na+ is pumped out of the cell by Na+/ K+ pumps simultaneous
with K+ being pumped into muscle cells.
75

Although Cl- concentration generally fluctuates very slightly if at all during exercise
because of the simultaneous loss of Cl- and water in perspiration during and after exercise
(Carlson, 1987; Cohen et al., 1993) Cl- concentration increased 5 minutes after completion of
cow work. A possible reason for this may be due to the increase in exercise intensity associated
with cow work. Previous research has demonstrated that a result factor of exercise intensity is an
increased loss of extracellular fluid by perspiration (Andrews et al., 1994; Art et al., 1990;
Carlson, 1987). Because of the possible extracellular fluid loss associated with the completion of
cow work a brief increase in chloride concentration could have been the result.
Anion gap is calculated based on the difference between the sum of cations (primarily
Na+ and K+) and the sum of anions (primarily Cl- and HCO3-). Because there was no change in
Na+ concentration, K+ concentration decreased, and Cl- increased the increase in anion gap at
cow and recovery can be primarily attributed to the decrease in HCO3- concentration at cow.
Once all results are taken into consideration results implicate that cow work can be
associated with an increase in exercise intensity. Based on results such as lactate, pH, HCO3- ,
and TCO2 the increase in exercise intensity associated with cow work required a portion of
exercise to occur under anaerobic conditions. A similar conclusion was determined in a sister
study, however, results from this study isolated cow work from reining pattern supporting the
conclusion of the sister study that was conducted. These results also indicate that increasing
exercises associated with increasing anaerobic capacity such as power training such as short
sprints, cow work, and exercising on hills could be highly beneficial to horses performing cow
work.
76

LITERATURE CITED
Aguilera-Tejero, E., J.C. Estepa, I. Lopez, S. Bas, R. Mayer-Valor, and M. Rodriguez. 2000. Quantitative analysis of acid-base balance in show jumpers before and after exercise. Res Vet Sci 68: 103-108.
Andrews, F. M., and T. L. Spurgeon. 1986. Histochemical staining characteristics of normal horse skeletal muscle. Am J Vet Res 47: 1843-1852.
Art, T., H. Amory, D. Desmecht, and P. Lekeux. 1990. Effect of show jumping on heart rate, blood lactate and other plasma biochemical values. Equine Vet J Suppl: 78-82.
Carlson, G. P. 1987. Hematology and body fluids in the equine athlete: A review. Equine Exercise Physiology 2: 426-437
Celander, O. 1954. The range of control exercised by the sympathico-adrenal system; a quantitative study on blood vessels and other smooth muscle effectors in the cat. Acta Physiol Scand Suppl 32: 1-132.
Cohen, N. D., A.J. Roussel, J.H. Lumsden, A.C. Cohen, E. Grift, and C. Lewis.. 1993. Alterations of fluid and electrolyte balance in thoroughbred racehorses following strenuous exercise during training. Can J Vet Res 57: 9-13.
Cottin, F., E. Barrey, P. Lopes, and V. Billat. 2006. Effect of repeated exercise and recovery on heart rate variability in elite trotting horses during high intensity interval training. Equine Vet J Suppl: 204-209.
Davies, B. N., and P. G. Withrington. 1973. The actions of drugs on the smooth muscle of the capsule and blood vessels of the spleen. Pharmacol Rev 25: 373-413.
Foreman, J. H., J.K. Waldsmith, and R.B. Lalum. 2004. Physical, acid-base and elctrolyte changes in horses competing in training, preliminary and intermediate horse trials. Equine and Comparative Exercise Physiology 1: 99-105.
Forster, H. V., C. L. Murphy, A. G. Brice, L. G. Pan, and T. F. Lowry. 1990. In vivo regulation of plasma [h+] in ponies during acute changes in pco2. J Appl Physiol 68: 316-321.
Geor, R. J., L. J. McCutcheon, K. W. Hinchcliff, and R. A. Sams. 2002. Training-induced alterations in glucose metabolism during moderate-intensity exercise. Equine Vet J Suppl: 22-28.
Lindner, A. 1996a. Determination of maximal lactate steady state in blood of horses. . Proc. Am. Ass. equine Practners. 42: 326-327.
Lindner, A. 1996b. Measurement of plasma lactate concentration with accusport. Equine Vet J 28: 403-405.
Lucke, J. N., and G. N. Hall. 1980. Further studies on the metabolic effects of long distance riding: Golden horseshoe ride 1979. Equine Vet J 12: 189-192.
Marlin, D. J., P.A. Harris, R.C. Schroter, R.C. Harris, C.A. Robers, C.M. Scott, C.E. Orme, M. Dunnett, S.J. Dyson, and F. Barrelet. 1995. Physiological, metabolic and biochemical responses of horses competing in the speed and endurance phase of a cci*****3-day-event. Equine Vet J Suppl: 37-46.
Martin, G., and M. Morad. 1982. Activity-induced potassium accumulation and its uptake in frog ventricular muscle. J Physiol 328: 205-227.
Milne, D. W., R. T. Skarda, A. A. Gabel, L. G. Smith, and K. Ault. 1976. Effects of training on biochemical values in standardbred horses. Am J Vet Res 37: 285-290.
Persson, S. G. B. 1969. On blood volume and working capacity in horses. Acta. Vet. Scand. 19: 1-189.
77

Persson, S. G. B. 1983. Evaluation of exercise tolerance and fitness in the performance horse. Equine Exercise Physiology: 441-457.
Rhoades, R. A., and G.A.Tanner. 2003. The endocrine pancreas. In: R. A. Rhoades, Tanner, G.A. (ed.) Medical physiology No. 2. p 623-633. Lippincott Williams & Wilkins A Wolters Kluwer Company, Baltimore, MD., Philadelphia, PA.
Romijn, J. A., E.F. Coyle, L.S. Sidossis, A. Gastaldelli, J.F. Horowitz, E. Endert, and R. Wolfe. 1993. Regulation of endogenous fat and carbohydrate metabolism in relation to exercise intensity and duration. Am J Physiol 265: E380-391.
Rose, R. J., K. S. Arnold, S. Church, and R. Paris. 1980. Plasma and sweat electrolyte concentrations in the horse during long distance exercise. Equine Vet J 12: 19-22.
Sexton, W. L., and H. H. Erickson. 1990. Effects of treadmill elevation on heart rate, blood lactate concentration and packed cell volume during graded submaximal exercise in ponies. Equine Vet J Suppl: 57-60.
Sloet van Oldruitenborgh-Oosterbaan, M. M., A. J. Spierenburg, and E. T. van den Broek. 2006. The workload of riding-school horses during jumping. Equine Vet J Suppl: 93-97.
Snow, D. H. 1979. Metabolic and physiological effects of adrenoceptor agonists and antagonists in the horse. Res Vet Sci 27: 372-378.
Snow, D. H., M. G. Kerr, M. A. Nimmo, and E. M. Abbott. 1982. Alterations in blood, sweat, urine and muscle composition during prolonged exercise in the horse. Vet Rec 110: 377-384.
Stainsby, W. N., W. F. Brechue, and D. M. O'Drobinak. 1991. Regulation of muscle lactate production. Med Sci Sports Exerc 23: 907-911.
Taylor, L. E., P. L. Ferrante, D. S. Kronfeld, and T. N. Meacham. 1995. Acid-base variables during incremental exercise in sprint-trained horses fed a high-fat diet. J Anim Sci 73: 2009-2018.
Torten, M., and O. W. Schalm. 1964. Influence of the equine spleen on rapid changes in the concentration of erythrocytes in peripheral blood. Am J Vet Res 25: 500-504.
Treiber, K. H., R.J. Geor, R.C. Boston, T.M. Hess, P.A. Harris, and D.S. Kronfeld. 2006. Glucose dynamics during exercise: Dietary energy sources affect minimal model parameters in trained arabian geldings during endurance exercise. Equine Vet J Suppl: 631-636.
Trilk, J. L., A. J. Lindner, H. M. Greene, D. Alberghina, and S. J. Wickler. 2002. A lactate-guided conditioning programme to improve endurance performance. Equine Vet J Suppl: 122-125.
Werkmann, J., A. Lindner, and H.H.L. Sasse. 1996. Conditioning effects in horses of exercise of 5, 15, and 25 minutes' duration at two blood lactate concentrations. Pferdeheilkunde 12: 474-479.
Wilson, R. G. 1983. Heart rate, lactic acid production, and speed during a standardised exercise test in standardbred horses. Equine Exercise Physiology: 487-496.
78

CHAPTER 5
CONCLUSIONS
Results indicate that in reined cow horses competing in boxing and fence classes that the
reined cow horses competing in the Box-Fence group are subject to an increase in exercise
intensity compared to the Box group. Based on exercise duration information that was gathered
horses in the Box-Fence group did not exercise for a longer period of time than horses in the Box
group despite the addition of fence work. As a result the increase in exercise intensity
demonstrated by blood variables can be attributed to the addition of the fence cow work to
exercise, ultimately resulting in an increased level of anaerobic metabolism compared to horses
in the Box group. Accumulation of blood lactate levels beyond the lactate threshold (4mmol/L)
immediately after exercise in the Box-Fence group compared to horses in the Box group was a
primary indicator of the increased level of anaerobic metabolism associated with the addition of
fence cow work. Although horses in the Box-Fence group demonstrated a blood lactate
concentration (8.43±1.24mmol/L) that exceeded the lactate threshold, horses within the Box
group did not exceed the lactate threshold and functioned primarily under aerobic conditions
during exercise. Other blood biochemical values such as blood pH, Na+, K+, hematocrit,
hemoglobin, glucose, and bicarbonate illustrated significant differences that also supported an
increase in anaerobic metabolism and in overall exercise intensity in horses in the Box-Fence
group compared to horses in the Box group.
Similar results were found in a sister study when evaluating cow work isolated from the
reining pattern. The goal of this study was to more precisely determine the effects of cow work
on reined cow horses. As we hypothesized there was a substantial increase in blood lactate
concentrations that were well beyond the lactate threshold of 4mmol/L, indicating that the short
79

sprints and quick turns associated with cow work induced an increase in exercise intensity. The
increase in exercise intensity required a portion of anaerobic metabolism for horses to complete
cow work. This was not the case for performance of a reining pattern as the blood lactate
concentration did not exceed the anaerobic threshold implying that performing a reining pattern
occurs under lower exercise intensity and as a result exercise occurs under primarily aerobic
conditions. Other biochemical variables such as pH, glucose, HCO3, and TCO2 also indicated
that the short sprints and rapid turns required to perform cow work induced an increase in
exercise intensity requiring exercise to occur primarily under anaerobic conditions to complete
cow work.
Previous research in thoroughbred horses has determined that transitioning from
primarily aerobic to anaerobic metabolism is associated with a speed of 350 to 400m/min
(Persson, 1983). Although we did not measure the speed at which the horse was exercising
during cow work the short sprints associated with cow work most certainly were responsible for
the increase in exercise intensity and the resulting increase in anaerobic exercise.
Intramuscular glycogen depletion patterns in horses have demonstrated that mainly type I
and low levels of type IIa fibers are recruited for exercise at low speeds and fibres are recruited
in a sequence governed by neuron diameter as speed increases. As speed increases utilization of
type IIb fibers which have a lower oxidative capacity than do type I and IIa fibers are recruited
for exercise (Lindholm and Saltin, 1974). Because cow work requires the horse to perform short
rapid sprints and quick turns it is likely that type IIb fibers were required to be recruited for
exercise. As a result additional power training for horses performing cow work would be highly
beneficial. The addition of power training would provide stimulation and recruitment of fast
contracting muscle fibers, which are required for speed and power during exercise. Also, power
80

training would improve the horses anaerobic capacity allowing the horse to exercise under
anaerobic conditions for prolonged periods of time.
As a result the horses performing cow work and more particularly horses performing both
boxing and fence cow work could improve by practicing different training methods. Horses
performing fence work are subject to work under more anaerobic metabolic conditions than
horses only performing box work and therefore might improve performance by including power
training. The addition of power training could benefit horses performing cow work by
increasing their anaerobic capacity. An increase in anaerobic capacity would primarily result in
a slower rate of lactate accumulation, a decrease in rate at which heart rate increases and
plateaus, and possibly, a slight increase in glycogen storage capacity in muscle cells. As a result
horses would be able to function under anaerobic conditions more efficiently and for a longer
period of time. Horses in the Box group might also include power training in their workouts but
not to the extent required by the horses in the Box-Fence group as they do not rely on as large a
proportion of anaerobic metabolism as do the horses in the Box-Fence group.
81

LITERATURE CITED
Lindholm, A., and B. Saltin. 1974. The physiological and biochemical response of standardbred horses to exercise of varying speed and duration. Acta Vet Scand 15: 310-324.
Persson, S. G. B. 1983. Evaluation of exercise tolerance and fitness in the performance horse.
Equine Exercise Physiology: 441-457.
82

APPENDIX A
Horse # Contact information: Owner: Address: Stall #: Phone:
Questionnaire
1. Year foaled?_______________ Please circle: mare gelding stallion 2. What is your horses breed?___________________________________________ 3. When working your horse does the workout consist of any cow work? 4. For how many years has the horse been competing as a reined cow horse? ______ 5. What other events does this horse compete in? . 6. What is the average number of shows your horse competes in on a yearly basis? . 7. How many shows have you been to this year? . 8. What class(es) are you entered in with this horse this weekend and is this the class you are
normally entered in(if not what are you normally entered in)? Please check one: Boxing only Boxing & Fence work .
9. Please list any supplements or treatments your horse is currently on: 10. Please describe your horses workout for an average week (include duration and intensity):
Sunday: Monday: Tuesday: Wednesday: Thursday: Friday: Saturday:
83

APPENDIX B
NRCHA PATTERN # 5
Trot to center of arena, stop. Start pattern facing away from judge. 1. Begin at center of arena. Take a right lead and complete a circle to the right, away from the judge. 2. At the center of arena, change leads and do 2 circles to the left, of approximately the same size. 3. At the center of arena, change leads. 4. Continue loping to run down. 5. Do a square sliding stop, hesitate. 6. Do 2 1/2 spins to the right. 7. Run full length of arena past end marker and do a square sliding stop, hesitate. 8. Do 2 1/2 spins to the left. 9. Run past center marker of arena; do a square sliding stop. 10. Back at least 10 feet to center of arena. 11. Do 360-spin right or left. 12. Do a 360-degree spin opposite direction taken in #11. 13. Hesitate to show completion of pattern.
84

APPENDIX C
NRCHA PATTERN #3
Trot to center of arena, stop. Start pattern facing towards judge. 1. Begin on right lead complete 3 circles to right, 2 large fast circles followed by 1 small slow circle, change to left lead. 2. Complete 3 circles to left, 2 large, fast circles followed by 1 small slow circle. Change to right lead. 3. Continue loping around end of arena without breaking gait. 4. Run up center of arena to far end past the end marker and come to a sliding stop. 5. Complete 2 1/2 spins to the right. 6. Run up center of arena past the end marker, come to a sliding stop. 7. Complete 2 1/2 spins to the left. 8. Run back to middle of the arena past the center marker and come to a sliding stop. 9. Back at least 10 feet in a straight line. 10. Hesitate to complete pattern.
85


![appendix8 - · PDF fileIll-avg 4] 137 4.2 Sports like Boxing, Fencing, Judo, Karate, Malkhamb, Martial Arts, Taekwondo, Wrestling; Recreational Games like Relay Games, Minor Games,](https://img.dokumen.tips/doc/110x75/5ab94e327f8b9ad5338dcc1e/appendix8-4-137-42-sports-like-boxing-fencing-judo-karate-malkhamb-martial.jpg)


![4] 137 4.2 Sports like Boxing, Fencing, Judo, Karate, Malkhamb, Martial Arts, Taekwondo, Wrestling; Recreational Games like Relay Games, Minor Games, Lead-up Games; Indigenous Sports](https://img.dokumen.tips/doc/110x75/5add99af7f8b9a8b6d8d27d9/4-137-42-sports-like-boxing-fencing-judo-karate-malkhamb-martial-arts-taekwondo.jpg)