Embed Size (px)
Citation preview
Bounty of the seas...and the trees? Modeling the effects of terrestrial
inputs on marine ecosystem services in the US
Jodie Toft, J. Burke, M. Carey, G. Spiridonov,A. Guerry, P. Levin, , T. Minello, M. Plummer, M. Ruckelshaus, H.
Townsend

In what situations do watershed-based activities affect the success of marine
resource management?


watershed
water quality
oysters crabs
Simple linked watershed-marine models for application in the 3
systems?

Land use: upland
Land use: estuarine
Climate: SST
Climate: Precipitation

Puget Sound1. Hood Canal2. Whidbey
Basin

Chesapeake Bay1. Rappahann
ock2. Eastern
shore

Galveston Bay

HOOD CANAL

watershed
Establish baseline conditions (2004-6):
• discharge• total nitrogen

Discharge

kg/yr kg/ha/yr
Total Nitrogen Export
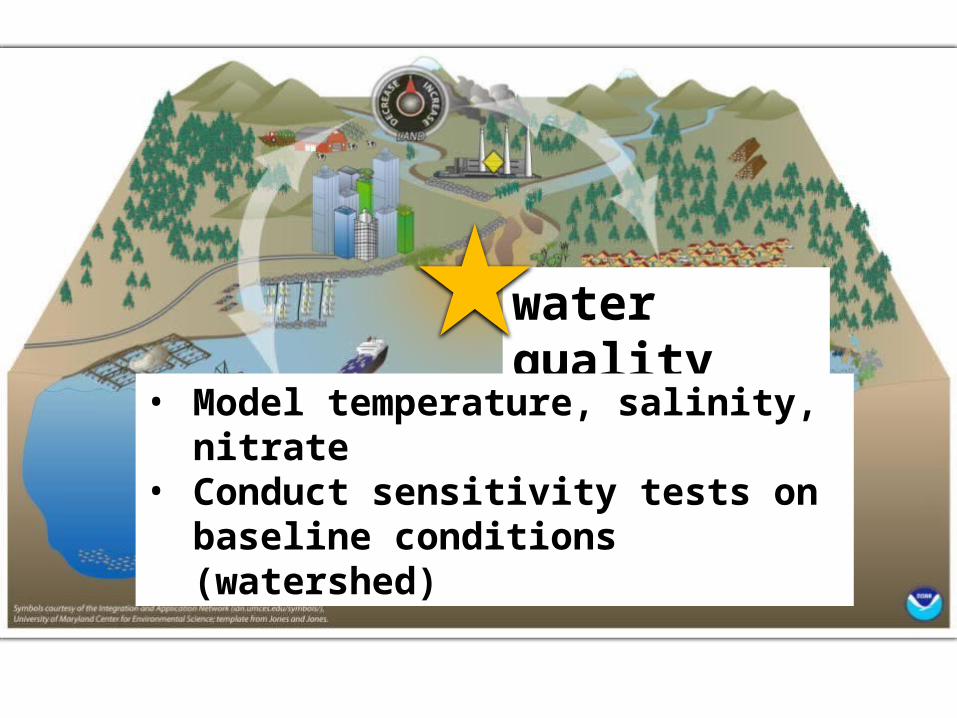
water quality
• Model temperature, salinity, nitrate
• Conduct sensitivity tests on baseline conditions (watershed)

12
3
45
6

8.5
9
9.5
10
10.5
11TEMPERATURESURFACE BOTTOM
25
26
27
28
29
30
31SALINITYSURFACE BOTTOM
02468
1012141618
1 2 3 4 5 6
BOX
NITRATESURFACE BOTTOM
BASELINE
12
3
45
6

% C
han
ge f
rom
Baselin
e T
em
p.
SENSITIVITY TESTS:Effect to Surface Temperature from +/- of Land-Based Discharge
-100%
-75%
-50%
-25%
0%
25%
50%
75%
100%
125%
150% Box 1
25% 50% 100%*
-100%
-75%
-50%
-25%
0%
25%
50%
75%
100%
125%
150%
DecreaseIncrease
Box 2 Box 3
Box 4
25% 50% 100%*
Box 5 Box 6

% C
han
ge f
rom
Baselin
e T
em
p.
SENSITIVITY TESTS:Effect to Surface Temperature from +/- of Land-Based Discharge
-100%
-75%
-50%
-25%
0%
25%
50%
75%
100%
125%
150% Box 1
25% 50% 100%*
-100%
-75%
-50%
-25%
0%
25%
50%
75%
100%
125%
150%
DecreaseIncrease
Box 2 Box 3
Box 4
25% 50% 100%*
Box 5 Box 6
-300%
-250%
-200%
-150%
-100%
-50%
0%
50%
100%
150%
200%
250%
300%
Boxes 1 6
% C
han
ge f
rom
Baselin
e T
em
p.
+/- 2 degree change in Sea Surface
Temperature at Ocean Boundary

Pacificoysters
Model effects to production and value from:
1. Changes in temperature, salinity, nutrients
2. Dissolved oxygen events3. Loss/gain of nearshore habitat
Dungeness crab

0.0
0.1
0.3
0.2
0.3
0.2
0.4
0.4
0.4
0.3
0.5
0.5
0.6
0.6
0.8
0.7
0.7
0.3
0.20.1
0.0
Temperature (C)
6 8 10 12 14 16 18 20 22
Sal
inity
(pp
t)
21222324252627282930
Years
0 20 40 60 80 100
Du
ng
en
ess
cra
b (
No
. m
ale
Ag
e 4
+)
200000
400000
600000
800000
Survival larvae

Pacific oysters

In what situations do watershed-based activities affect the success of marine
resource management?

Land use: upland
Land use: estuarine
Climate: SST
Climate: Precipitation


watershed
water quality
Pacificoysters
Dungeness crab

Uptake?

Water Yield Model

Average Annual Discharge ComparedTo USGS and WADOE gauge observations
2006
Snapshot:Land CoverAvailable Water ContentSoil DepthTopographyWatershedsSub-Watersheds
Annual Values:PrecipitationPotential Evapotranspiration
LU Tables:Rooting DepthPlant ET coefficientWater Demand

Subwatershed Source Years N-SDuckabushRiverBrinno
n USGS Daily 2006 0.99
Hamma Hamma near Eldon USGS Daily 1951-1971 -0.46
SkokomishRiverPotlatch USGS Daily 2006 0.99
BigBeefCreekatmouth USGS Daily 2006 0.19LittleQuilceneatMouth WA Dept Ecy Daily 2006 0.67
BigQuilceneRiveratmouth WA Dept Ecy Daily 2006 0.60
DosewallipsRiveratBrinnon WA Dept Ecy Daily 2007-2011 -0.73

Nutrient Model: Total Nitrogen and Phosphorus
Phosphorus, TotalSubwatershed Years Difference
Duckabush Brinnon 1972-2010 57.245Skokomish Potlatch 1960-2010 90.271Big Beef at mouth 2004-2010 58.006
Nitrogen, TotalSubwatershed Years Difference
Big Quilcene at mouth 1999-2010 72.880Duckabush Brinnon 2006 0.184Skokomish Potlatch 2006 79.663Big Beef at mouth 2006 7.209

Skokomish
1
3
45
6
Duckabush
Hamma Hamma
Dosewallips
Big QuilceneLittle Quilcene
Big Beef Creek
• 2-Layer Box Model, 6 Regions
• Based on Babson et al. (2006), but rewritten in MATLAB for more general use
• 6 boxes in HC, 7 rivers
• IC’s: from MoSSea
• BC’s: from ADM001 DoE station
ADM001 (DoE)
Hans (ORCA)
2
Physical transport model

Biogeochemical Cycling
NPZDO modeling: Oxygen is added in proportional to nutrient uptake (Banas et al. 2009)
or see: http://faculty.washington.edu/banasn/models/lynch/