Embed Size (px)
Citation preview

Norwegian University of Life SciencesA Zooming Theory of Anomalies in Intertemporal Choice 1
Bounded awareness and anomalies in
intertemporal choice: Google Earth as
metaphor and model
Paper by Stein Holden & John Quiggin
https://www.youtube.com/watch?v=0vnA_KIojLghttps://www.youtube.com/watch?v=0vnA_KIojLg

Zooming In…or… Out?
https://www.youtube.com/watch?v=0vnA_KIojLg

Introduction
• Anomalies in inter-temporal choice include hyperbolic
discounting, magnitude effects and present bias
• The logic behind the first two of these phenomena is
poorly understood
–The hyperbolic discounting model is only a descriptive
model
• Cognitive limitations leading to hyperbolic discounting
and magnitude effects in intertemporal choice may be
described in terms of bounded awareness (unintended
inconsistent behavior), and represented by phenomena
familiar from visualization software such as Google Earth.
Norwegian University of Life SciencesA Zooming Theory of Anomalies in Intertemporal Choice 3
Theory
• Given bounded cognitive resources, decision-makers
must engage in both restriction and coarsening if they are
to reduce even relatively simple decision problems to a
manageable scale. Moreover, there is a trade-off
between the two processes: the fewer possibilities are
excluded from consideration, the coarser must be the
aggregation of those that remain
• Cognitive limits on visualization impose constraints on
both the area being viewed and the level of detail of the
view, with a trade-off between the two.
• Increasing detail at the expense of limiting the area
viewed may be described as zooming
Norwegian University of Life SciencesA Zooming Theory of Anomalies in Intertemporal Choice 4

A mental zooming theory
• In many situations the brain works as a mental zooming
device and narrows in the focus on some specific issues
or aspects of prospects that are compared and does not
evaluate these holistically
• Narrow framing (Barberis, Huang and Thaler 2006) or
choice bracketing (Read, Loewenstein and Rabin 1999)
in some contexts are more specific outcomes of the
zooming behavior of the brain
• This is a form of reference dependent utility
• The implication is a form of partial and variable degree of
asset integration
Norwegian University of Life SciencesA Zooming Theory of Anomalies in Intertemporal Choice 5

Google Earth as a metaphor
• Visualization software inspired by Google Earth provides
a metaphor that is familiar to many.
–As one zooms in new details appear but the frame
becomes much narrower.
–Zooming permits more focus on the details within a
narrow frame but causes the user to lose sight of the
larger landscape
• Can such mental zooming explain the systematic
anomalies in inter-temporal choice?
• Assess it with a Field Experiment
Norwegian University of Life SciencesA Zooming Theory of Anomalies in Intertemporal Choice 6

Credible methods for elicitation of time
preferences
• Multiple Price List (MPL) approach introduced for
elicitation of risk preferences by Holt and Laury
(2002) have gained popularity and credibility
(Andersen et al. 2007; 2008)
• Advantages of MPL
–Transparency
–With incentives; should reveal truthful
responses
• Disadvantages
–Only identifies an interval response
–Can be sensitive to framing effects
7

Time preference experiments
Time preference series
11
Task Receive at far
future period
Choice Receive at near
future period
Choice
3 months from now, MK 1 week from now, MK
111 10000 10000
112 10000 9500
113 10000 9000
114 10000 8000
115 10000 7000
116 10000 6000
117 10000 5000
118 10000 4000
119 10000 3000
120 10000 2000

Time preference experiment treatments• Far future point in time:
• 1 month, 3 months, 6 months, 1 year
• Near future point in time:
– Today, 1 week, 1 month
• Future amounts: 5x, 10x and 20x the basic magnitude level
– MK 1000, MK 5000, MK 10000, MK 20000
• Randomized across households
• 10% probability that there will be a real payout for the
households
– Random selection of series and game for households that
win in the lottery
– Arranged for future payment for the winning households
(must have sufficient trust among respondents)
Time preference experiments in Malawi 1
• The choices are between amounts of money to be
received with certainty at different points in the future
• In each case the respondent chooses between two
options and indicates the one he/she prefers
• In each price list we kept the future option constant while
we vary the near future (current) option till we identify the
switch point for the respondents
• Expect only one switch point per series for responses to
be consistent in that specific series
• Randomized starting point in each series
Time preference experiments in Malawi 2
• Experiments linked to a household panel survey
– Introduced the experiments in each district/village one
week after the survey
– Experiment participation seen partly as a compensation
for participation in survey (4th round panel survey of the
same households)
– Households had learnt that we are coming back
– NMBU/University of Malawi collaboration since 2005/06
– Recruited 4 enumerators (with MSc degree in agricultural
economics) (one was replaced later)
– Trained them for one week, including pilot testing of
experimental protocol
– One day in each village
– Local schools as «field labs»
– Minimize communication among respondents11

Estimation Issues
• Exponential discounting with dummies for treatments
–Test for deviations from the standard model
• Choice of utility function versus ignoring risk aversion
–Choice of a CEMU utility function in time preference
models
– Incentivized Holt and Laury (2002) MPL-type of risk
experiments to estimate relative risk aversion
(RRA=>EMU)
• Similar correction as Andersen, Harrison et al.
studies in Denmark
12

Theoretical framework: structural
model
• The decision problem can be framed as a two-period
problem choosing between one amount at a near period
time and another bigger amount at a more distant point in
time:
Prospects are integrated with some background level of
income (y): The literature is not very clear on what y should
be13
1 0 2 0
1 0 2 0
1 2
1 2
t t t t
A A
t t t t
B B
U e u y M e u y
U e u y e u y M

Our alternative model: Zooming as a
form of reference-dependent partial
asset integration
• We propose that the amount that respondents integrate
the prospect with depends on the prospect characteristics
such as time horizon and magnitude (zooming
adjustment: reference dependent asset integration):
Norwegian University of Life SciencesZooming: Reference-dependent partial asset integration 14
1 0 2 0
1 0 2 0
1 2 1 2 2 1
1 2 1 2 2 1
, ,
, ,
t t t t
A B A B
t t t t
B B B B
U e u y f t t M M e u y f t t M
U e u y f t t M e u y f t t M M

Structural model specification
• The latent index may also be written in ratio form;
• 2)
• A further extension of the estimation of the above models
is to include stochastic errors. We applied the Luce
specification
• 3)
• With the following likelihood function used for estimation:
• relevant parameters and variables such as the discount
rate (δ), the noise parameter (µ), treatment (prospect)
characteristics (Z) and respondent characteristics (X );15
/ ( )A A BU U U U
1/ 1/ 1//A A BU U U U
ln , ; , , ((ln ( ) | 1) (ln (1 ) | 0))ij i j ij ij
j
L Choice Z X U Choice U Choice

Relative risk aversion coefficient
estimates from Holt & Laury MPLs
Norwegian University of Life SciencesTittel på presentasjon 16

Alternative zooming models tested
Norwegian University of Life Sciencess 17
Zooming
model
Base consumption adjustment
Base
model
Zoom
Model 1
MK5000 – calibrated to give positive discount
rates for the largest amounts and longest
horizons
MK 1000*Time horizon (months)
Zoom
Model 2
MK300*(Time horizon)*(Future amount/10000)
Zoom
Model 3
MK 300*(Time horizon)^2*sqrt(Future amount
/10000)

Time horizon and magnitude effects: Predicted
discount rate distribution with base model
consumption=MK5000
18

Predicted discount rates with Zooming Model 1:
Linear in time horizon
19

Predicted discount rates with Zooming Model 2:
Linear in time horizon and magnitude
20

Predicted discount rates with Zooming Model 3:
Non-linear in time horizon and magnitude
21
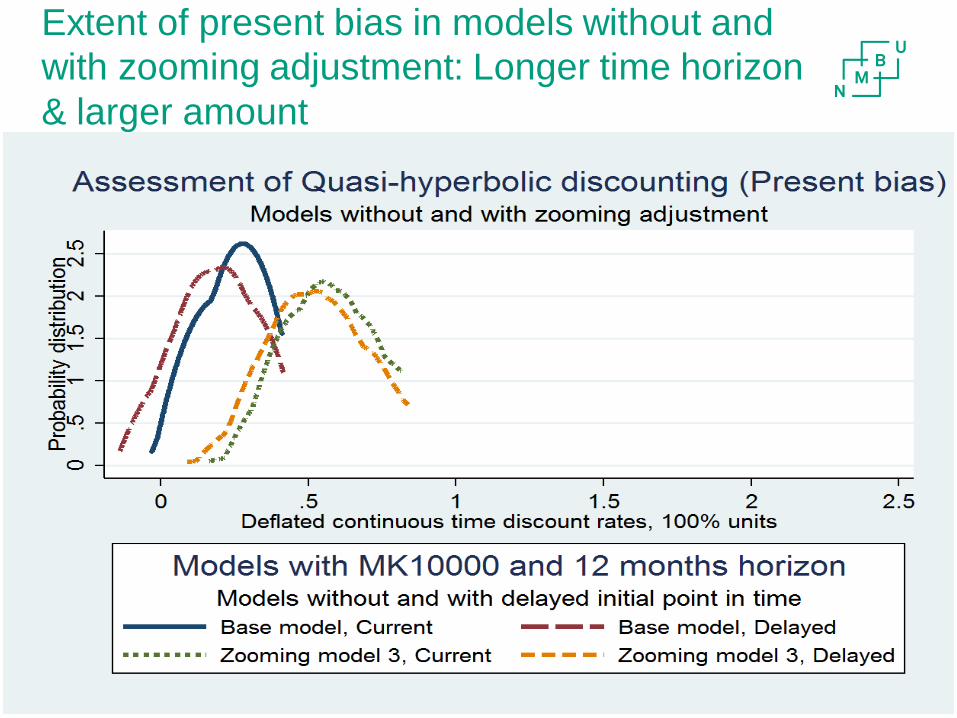
Extent of present bias in models without and
with zooming adjustment: Longer time horizon
& larger amount
22
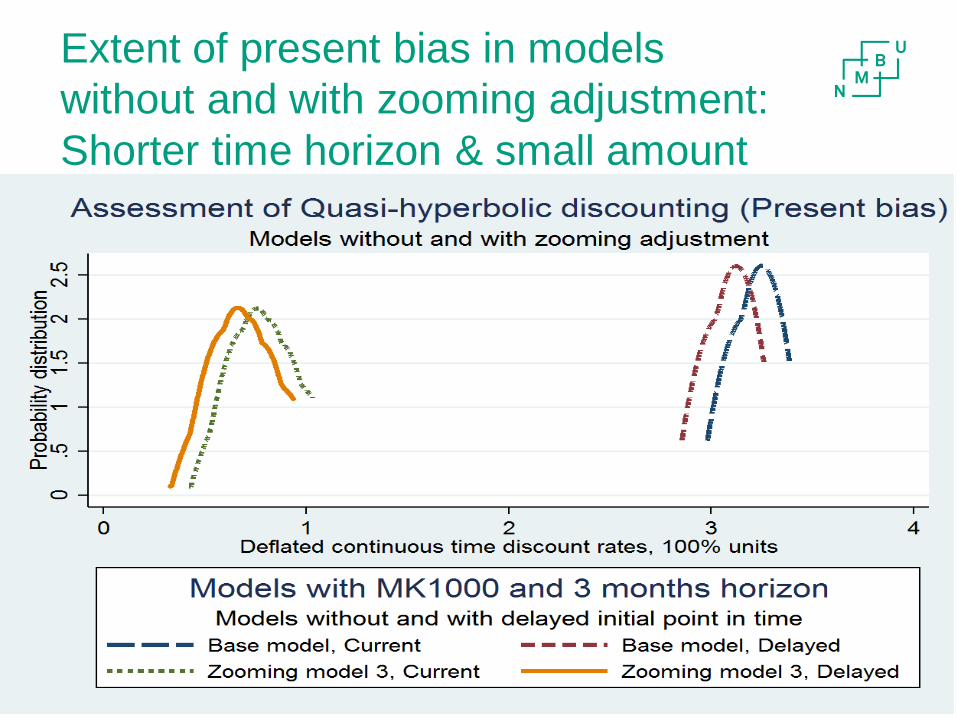
Extent of present bias in models
without and with zooming adjustment:
Shorter time horizon & small amount
Norwegian University of Life SciencesTittel på presentasjon 23

Econometric results
Norwegian University of Life SciencesTittel på presentasjon 24
Base model
Bc: MK5000
Zooming
adjustment
1
Zooming
adjustment
2
Zooming
adjustment
3
Future amount: Base: MK20000 0.000 0.000 0.000 0.000
Future amount: MK10000 0.137 0.143 -0.150 -0.073
Future amount: MK5000 0.465**** 0.370**** -0.186* -0.010
Future amount: MK1000 2.146**** 1.175**** -0.223*** 0.155**
Time horizon: Base: 12 months 0.000 0.000 0.000 0.000
Time horizon: 6 months 0.606**** -0.027 0.193* -0.018
Time horizon: 3 months 0.966**** 0.050 0.318*** -0.013
Time horizon: 1 month 1.940**** 0.542*** 0.989**** 0.578****
Dummy for front end point=current 0.126** 0.073 0.105*** 0.097**
Dummy for front end point=1
month
0.132*** 0.087* 0.128*** 0.118**
Random starting point*Task
number
-0.018**** -0.019**** -0.020**** -0.023****
Enumerator dummies (5
enumerators)
n.s. n.s. n.s. n.s.
Constant 0.129 0.947**** 0.746**** 0.673****
Luce error constant 0.040**** 0.043**** 0.072**** 0.090****
Prob > F 0.000 0.000 0.000 0.000
Number of observations 33586 33586 33586 33586

Conclusions• We have proposed a zooming model based on the idea of
bounded awareness and reference dependent utility.
• We hope that the model will contribute to a deeper understanding of
hyperbolic discounting and magnitude effects
• Doubt about the existence of these phenomena has arisen because
they have been mostly identified in hypothetical experiments that do not
meet the quality standards of experimental economics (Andersen et al.
2011)
• Based on an incentive-compatible field experiment with prospects
characterized by alternative time horizons and magnitudes, we
demonstrate that these phenomena are highly significant and cannot be
explained by present bias/quasi-hyperbolic discounting
• They are, however, consistent with the zooming model proposed here.
On the other hand, our findings indicate that small amounts and short
horizons are associated with additional mark-ups of discount rates and
that our zooming theory cannot explain present bias (quasi-hyperbolic
discounting)
25