Embed Size (px)
Citation preview
Boulder Homeless Workgroup Session
Friday, January 27, 2017 1:00 – 3:15 PM
Annotated Agenda
Time Topic Notes
1:00- 1:15 Welcome &
Introductions
Opening Remarks (if any from Wendy or the City)
Introductions
Annie will review agenda for the day
1:15 –
1:35
Level Setting & Purpose of Strategic
Planning Work Session
Review
Guiding principles
Level setting: meeting flow and ground rules
Purpose of the comprehensive strategic plan
Structure for the strategic planning process vs. short term/crisis solution
1:35 –
2:10 System Flow Maps
Objectives:
Shift from Program level thinking to System level thinking
Understand system performance and client experience
Define Shared System Goal & Metrics Review System Maps – Annie/Katie to present (15 min)
Single Adults
Families System Redesign Exercise – small groups or one large (20 min)
Groups will rearrange the pieces of the system to achieve shared goal
2:10 -
3:10 Building your Plan
Objectives:
Define your New System Framework and Guiding Principles based on the system mapping exercises
Define your milestone goals by subpopulation
Identify the broad strategies necessary to achieve each milestone goal
Large Group Exercise: Go BIG - Bold, Inspire, Guide (20 min)
Sub Pop Goals: Federal Strategic Goals; rare, brief, non-recurring, How much and by when? Order?
Measure: Simplest way to answer - How do you know you have succeeded?
Large Group Exercise: (15 min)
Revisit system themes from guiding principles – think about how they relate to your new system orientation and milestone goals.
Revisit the System Map – What does this map represent? Why doesn’t your system function like this today? What has to be changed for this to be real?
What activities are the most important to achieve your goals? Small Group Exercise: Translating Your Gaps (25 min)
In this new orientation, what gaps are the most important? Each group will have a set of cards with gaps identified from homework along with blank cards to add. They will rank the gaps into categories: Essential or non-essential and then order.
Report out and grouping to extract common themes and summarized reorientation.
3:10 -
3:15
Closing Remarks & Next Steps
Annie
Boulder Homelessness Work Group Meeting: January 27, 2017
• Your Name and organization
• Something people in this room may not know about you?

• Agenda Items
• Meeting Ground Rules
• Timeline
• Project Goals and Structure
System Performance Mapping
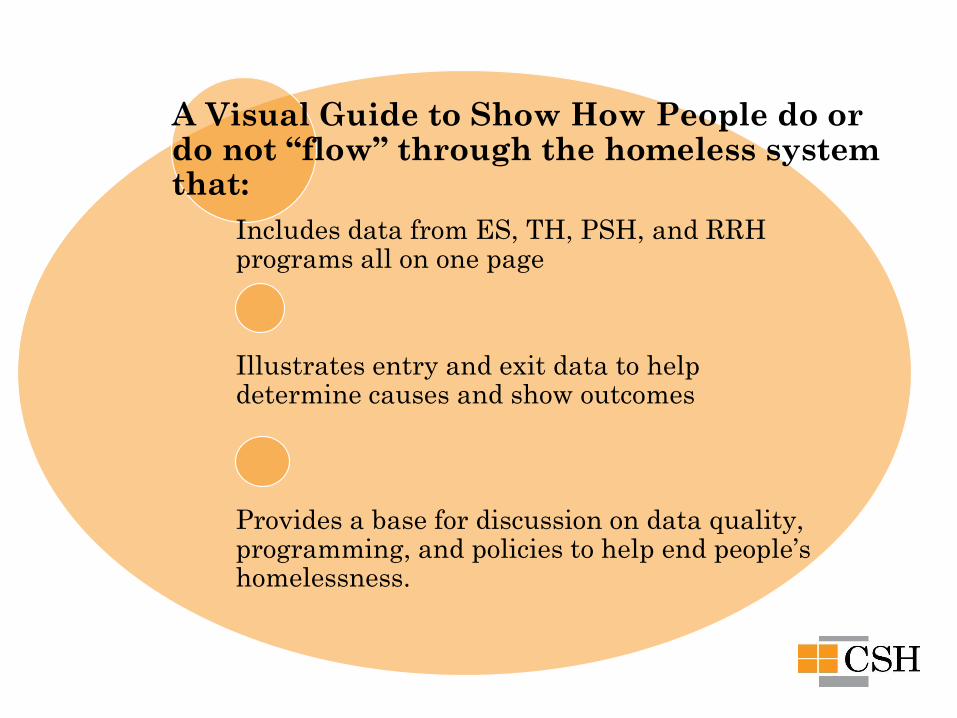
What is a Systems/Data Map?
A Visual Guide to Show How People do or do not “flow” through the homeless system that:
Includes data from ES, TH, PSH, and RRH programs all on one page
Illustrates entry and exit data to help determine causes and show outcomes
Provides a base for discussion on data quality, programming, and policies to help end people’s homelessness.
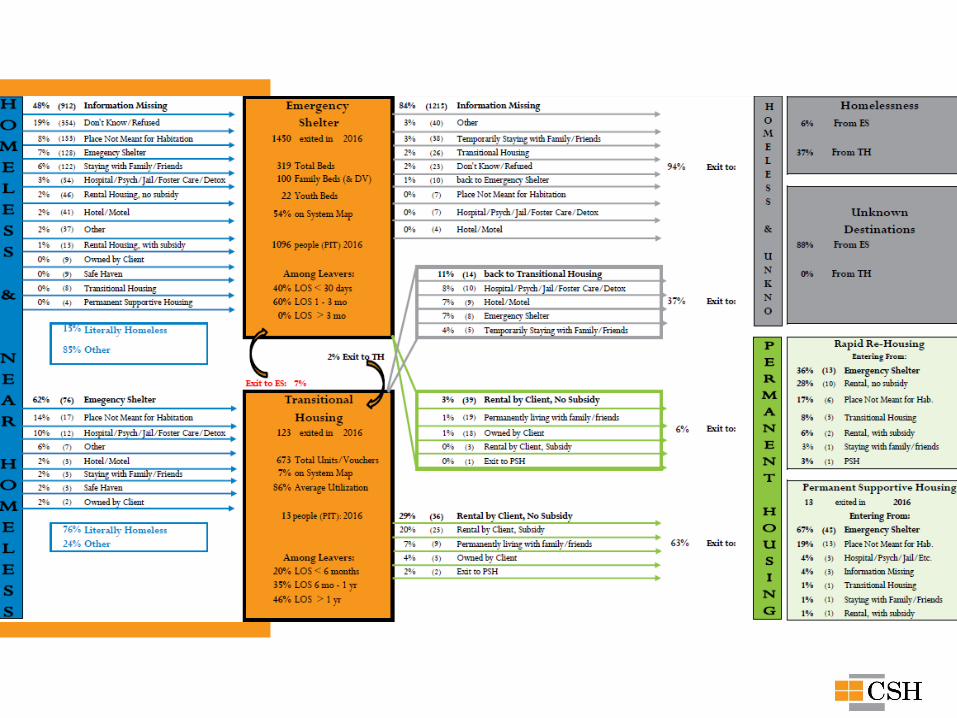
Boulder City & County Homeless System Map
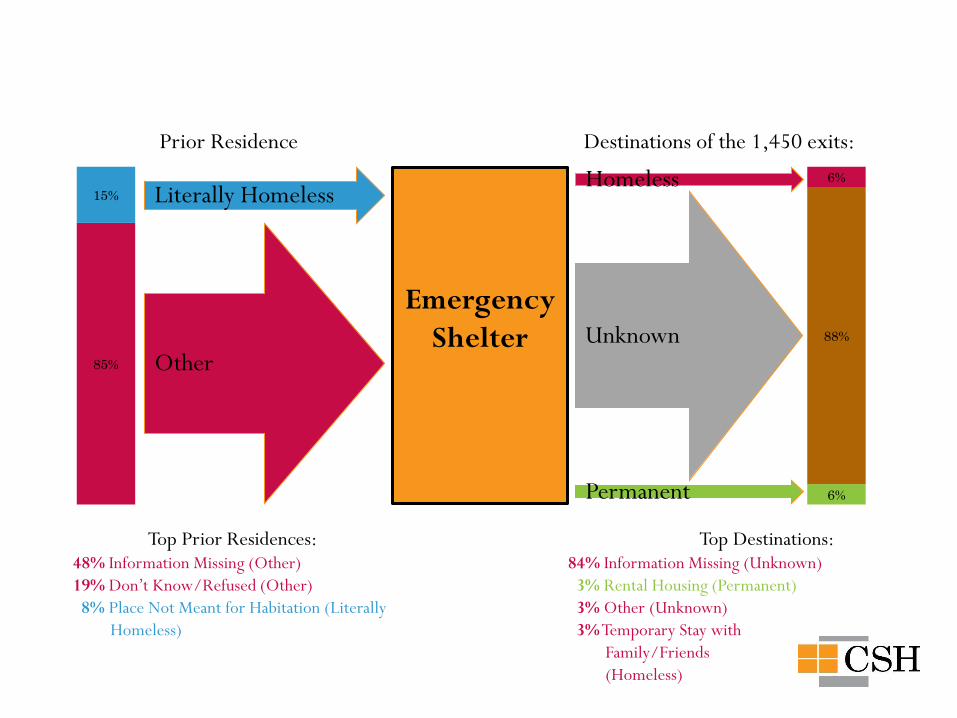
Boulder System Map: Emergency Shelter
Prior Residence
Emergency
Shelter
Destinations of the 1,450 exits:
Homeless
6%
88%
6%
Unknown
Permanent
85%
15% Literally Homeless
Other
Top Prior Residences: 48% Information Missing (Other)
19% Don’t Know/Refused (Other)
8% Place Not Meant for Habitation (Literally
Homeless)
Top Destinations: 84% Information Missing (Unknown)
3% Rental Housing (Permanent)
3% Other (Unknown)
3% Temporary Stay with
Family/Friends
(Homeless)
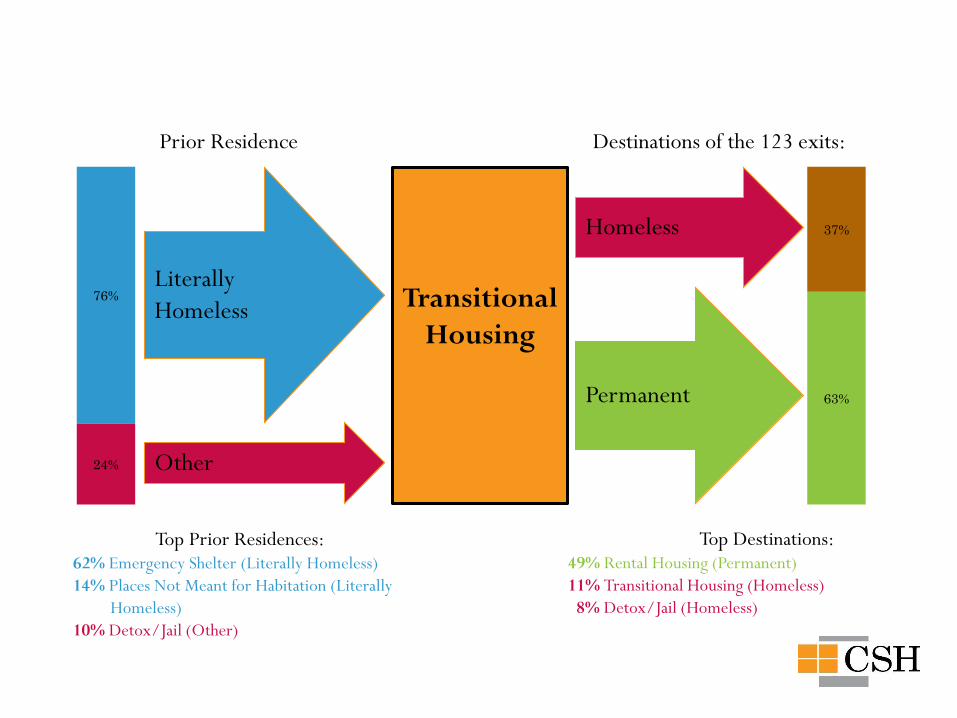
Boulder System Map: Transitional Housing
Prior Residence
Transitional
Housing
Destinations of the 123 exits:
Homeless
63%
37%
Permanent
24%
76% Literally
Homeless
Other
Top Prior Residences: 62% Emergency Shelter (Literally Homeless)
14% Places Not Meant for Habitation (Literally
Homeless)
10% Detox/Jail (Other)
Top Destinations: 49% Rental Housing (Permanent)
11% Transitional Housing (Homeless)
8% Detox/Jail (Homeless)
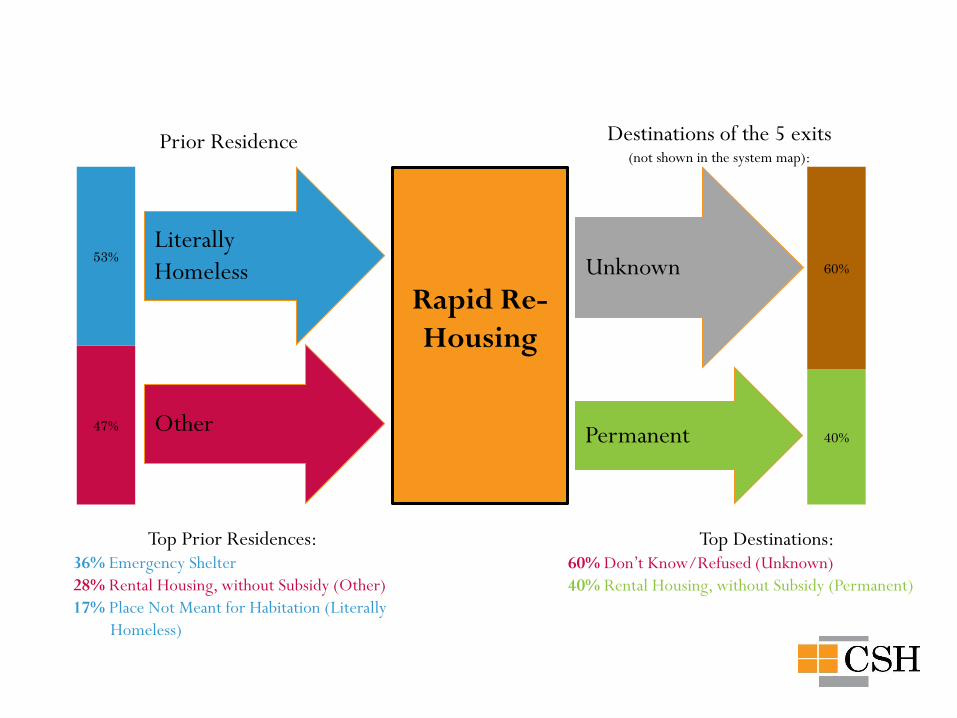
Boulder System Map: Rapid Re-Housing
Prior Residence
Rapid Re-
Housing
Destinations of the 5 exits (not shown in the system map):
40%
60% Unknown
Permanent 47%
53% Literally
Homeless
Other
Top Prior Residences: 36% Emergency Shelter
28% Rental Housing, without Subsidy (Other)
17% Place Not Meant for Habitation (Literally
Homeless)
Top Destinations: 60% Don’t Know/Refused (Unknown)
40% Rental Housing, without Subsidy (Permanent)
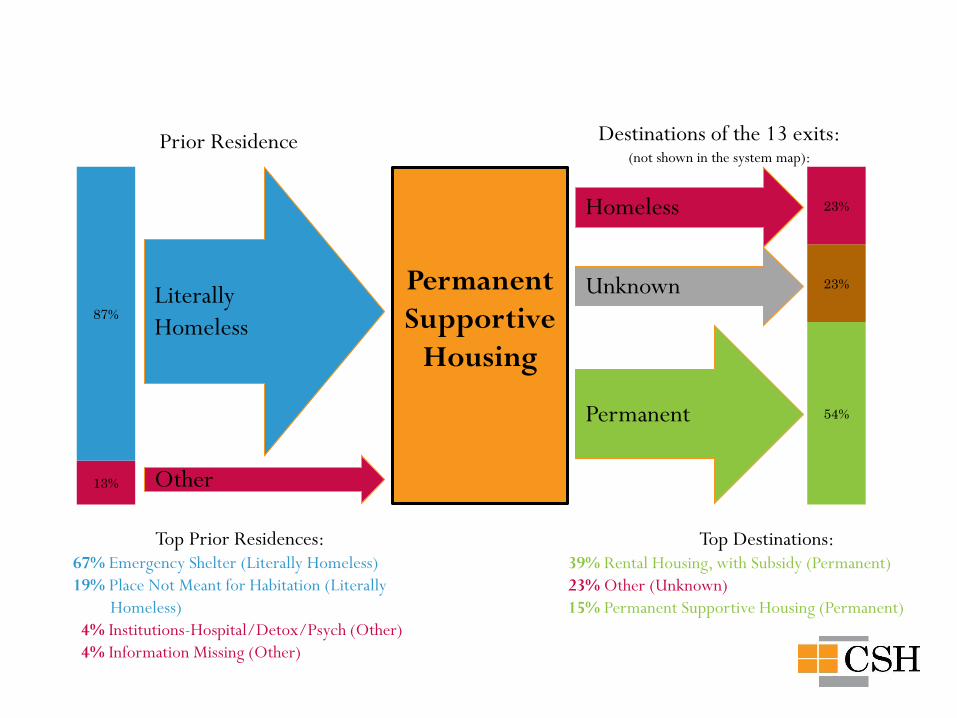
Boulder System Map: Permanent Supportive Housing
Prior Residence
Permanent
Supportive
Housing
Destinations of the 13 exits: (not shown in the system map):
Homeless
54%
23%
23%
Unknown
Permanent
13%
87%
Literally
Homeless
Other
Top Prior Residences: 67% Emergency Shelter (Literally Homeless)
19% Place Not Meant for Habitation (Literally
Homeless)
4% Institutions-Hospital/Detox/Psych (Other)
4% Information Missing (Other)
Top Destinations: 39% Rental Housing, with Subsidy (Permanent)
23% Other (Unknown)
15% Permanent Supportive Housing (Permanent)
Points for Discussion
All
Populations Combined
System Map
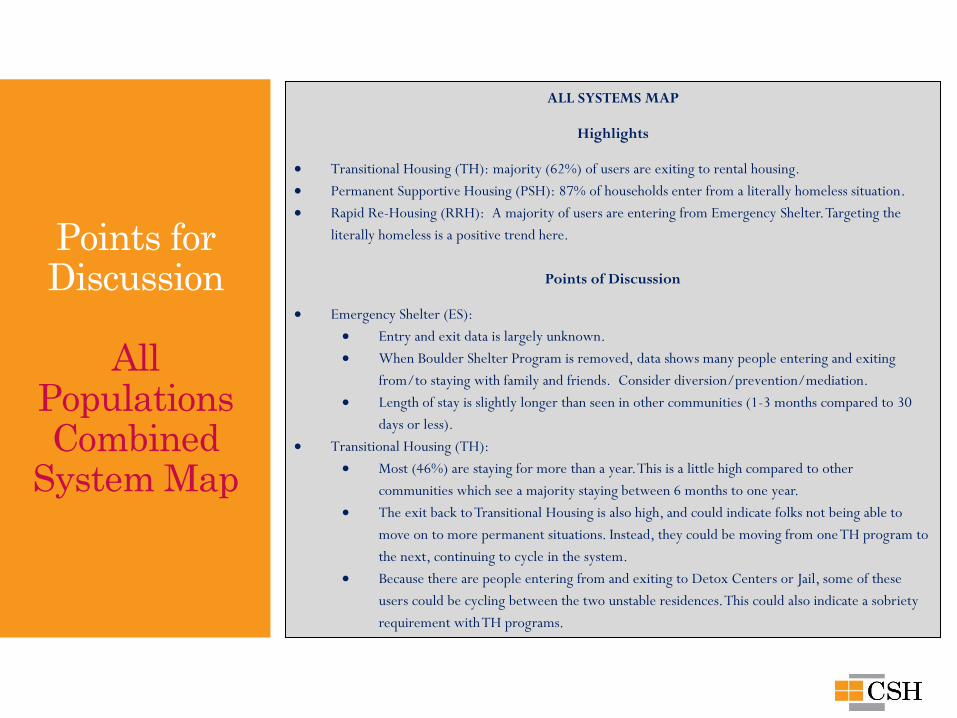
ALL SYSTEMS MAP
Highlights
Transitional Housing (TH): majority (62%) of users are exiting to rental housing.
Permanent Supportive Housing (PSH): 87% of households enter from a literally homeless situation.
Rapid Re-Housing (RRH): A majority of users are entering from Emergency Shelter. Targeting the
literally homeless is a positive trend here.
Points of Discussion
Emergency Shelter (ES):
Entry and exit data is largely unknown.
When Boulder Shelter Program is removed, data shows many people entering and exiting
from/to staying with family and friends. Consider diversion/prevention/mediation.
Length of stay is slightly longer than seen in other communities (1-3 months compared to 30
days or less).
Transitional Housing (TH):
Most (46%) are staying for more than a year. This is a little high compared to other
communities which see a majority staying between 6 months to one year.
The exit back to Transitional Housing is also high, and could indicate folks not being able to
move on to more permanent situations. Instead, they could be moving from one TH program to
the next, continuing to cycle in the system.
Because there are people entering from and exiting to Detox Centers or Jail, some of these
users could be cycling between the two unstable residences. This could also indicate a sobriety
requirement with TH programs.
Building the Strategic Framework
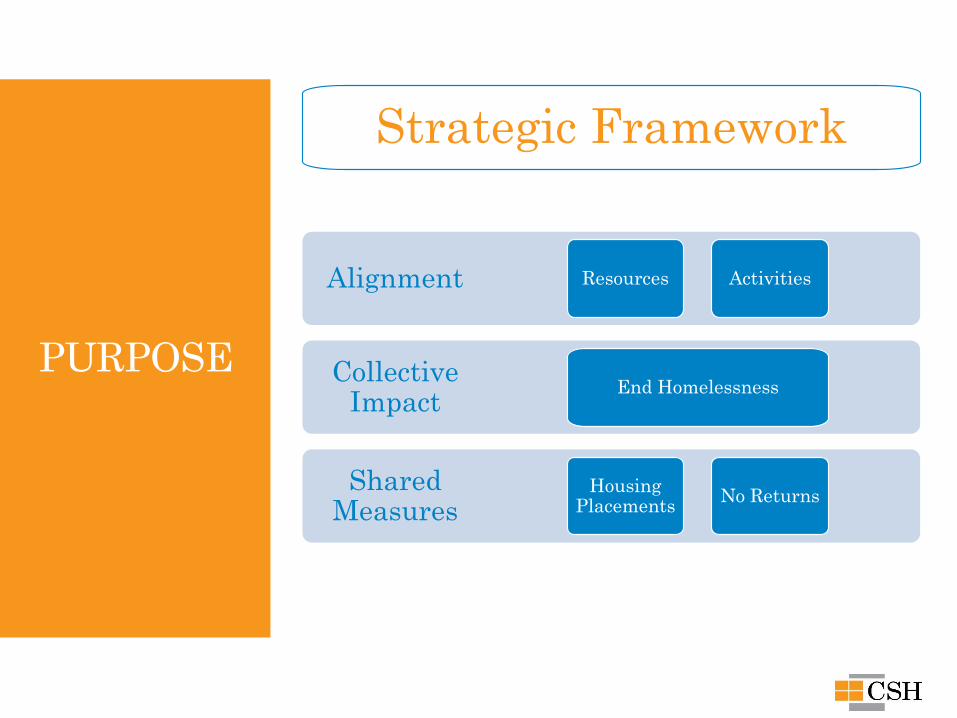
PURPOSE
Shared Measures
Collective Impact
Alignment Resources Activities
End Homelessness
Housing Placements
No Returns
Strategic Framework
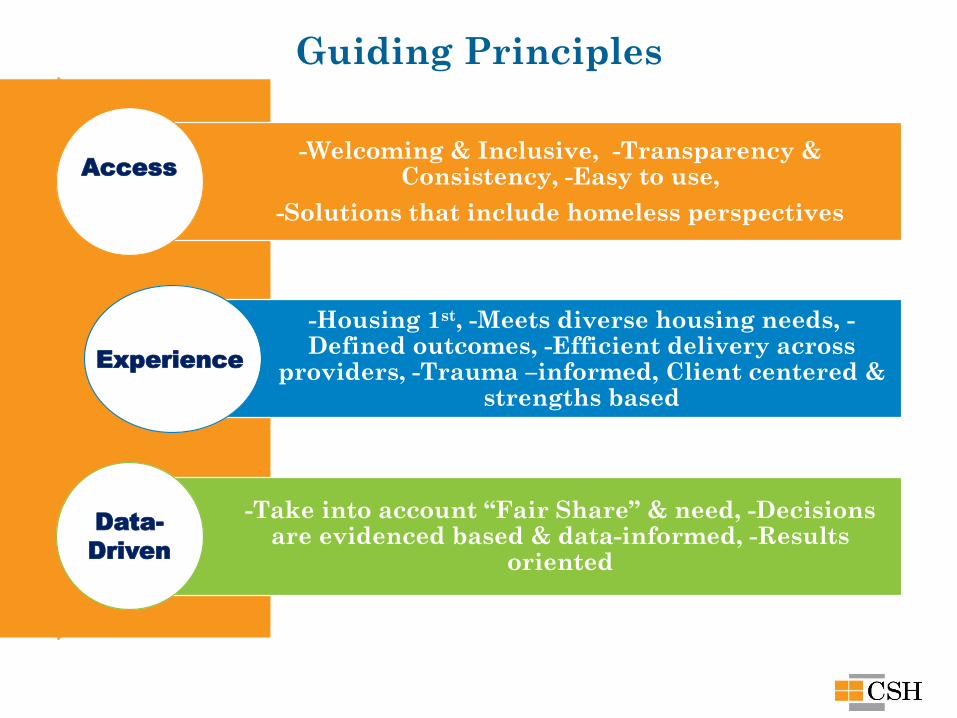
-Welcoming & Inclusive, -Transparency & Consistency, -Easy to use,
-Solutions that include homeless perspectives
-Housing 1st, -Meets diverse housing needs, -Defined outcomes, -Efficient delivery across
providers, -Trauma –informed, Client centered & strengths based
-Take into account “Fair Share” & need, -Decisions are evidenced based & data-informed, -Results
oriented
Access
Experience
Data-
Driven
Guiding Principles
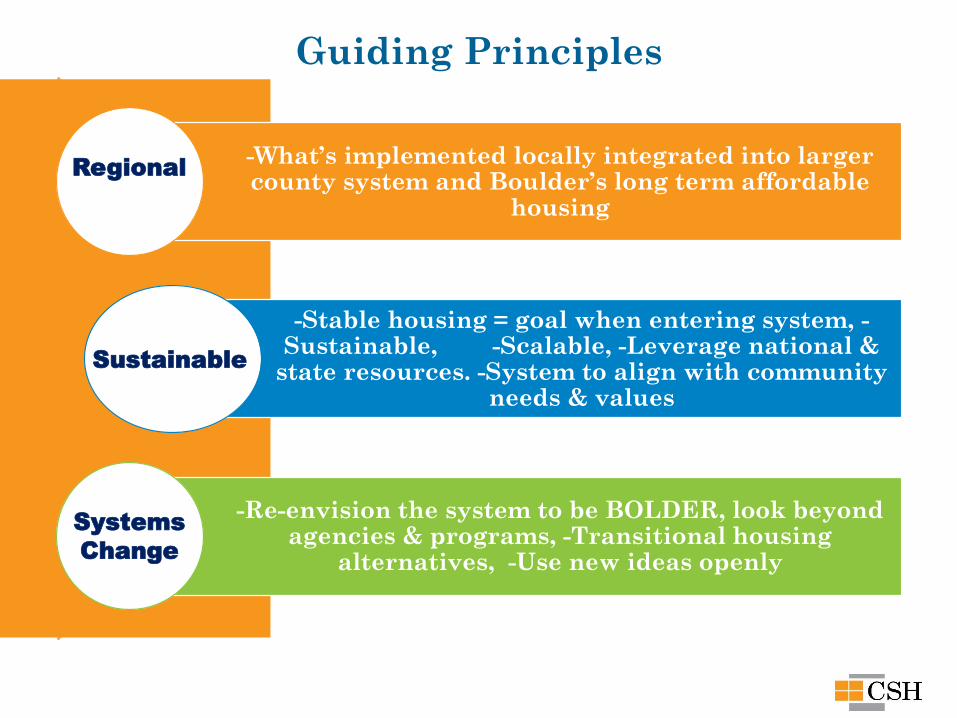
-What’s implemented locally integrated into larger county system and Boulder’s long term affordable
housing
-Stable housing = goal when entering system, -Sustainable, -Scalable, -Leverage national &
state resources. -System to align with community needs & values
-Re-envision the system to be BOLDER, look beyond agencies & programs, -Transitional housing
alternatives, -Use new ideas openly
Regional
Sustainable
Systems
Change
Guiding Principles
System Redesign Exercise
CRITICAL GAPS
1. Front door
2. Inside the System
3. Back door
Thank You

Boulder Homeless Working Group 1/27/17 – Notes
Attendees: WG members- Wendy, Ron, Bill, Greg, Barb, Mike, Jim, Jason, Karen, Daphne, Isabel,
Claire, Robin, Kurt
Annie reviewed scope of work with CSH and how we should use our time today. This is a big
task, conversations have been happening for a long time, but it is time getting to tactical
decision points, strategic plan will be delivered at the end of the project. What we need to do
first is be aligned around the system as it is now and where we want it to be. For today think
about the system as you desire it to look without considerations for resource limitations. Focus
on system from a broader perspective, not as an organization or individual. We will focus on
system redesign. We will work together to identify gaps and critical action steps from there.
Annie timeline review:
o February 1st – right sizing analysis, unit projections, where does shelter sit, who is the
priority population that we want to serve, how do we enable people to self-resolve or
move to permanent housing
o March 3rd – Coordinated Entry Lab. The what, how and when will be covered in a one
day retreat.
o March 15th – WG will review first draft of report and recommendations.
o March 29th – share final report with the City and stakeholders.
Please reach out to Annie with questions anytime between meetings.
Katie overview of the systems map
o A visual guide to show how people do or do not “flow” through the homeless system
that:
Includes data from ES, TH, PSH, and RRH programs all on one page
Illustrates entry and exit data to help determine causes and show outcomes
Provides a base for discussion on data quality, programming, and policies to
help end people’s homelessness.
o Not all programs use HMIS, so we used what was available.
o How to read:
From left to right = entry to exit
Blue = Entering the system
Grey = Exiting the system to homelessness or unknown destinations
Green = Exiting the system to permanent destinations
view one intervention at a time – ES, TH, RRH, PSH
o Again, not all agencies enter in HMIS which creates some limitations so we compared to
Boulder’s Homeless Inventory Chart:
54% of emergency shelter beds in the map
7% of TH slots in the map
o Emergency Shelter:
Data from Attention Homes BCP Program, Boulder Shelter Emergency Program,
EFAA Boulder County, EFAA City of Boulder. BOHO and Bridge House are not
included because they do not collect this entry/exit information
A majority of entry and exit data was not collected and is listed as “Information
Missing.” This is mostly from Boulder Shelter Program. When participants exit
Boulder Emergency Shelter, they exit everyone at the same time, so individual
data is not collected at this time.
Boulder Shelter accounts for 87% of the entrance data and 84% of the exit data,
which skews the information. (1215 exits missing destination). If BS was taken
out of the analysis for data quality reasons, this section would look much
different.
36% entering from Staying with Family and Friends
16% exiting to Temporarily Stay with Family and Friends (Homeless)
In this case, trends might be looking at some folks cycling between shelter and
staying with family and friends or between shelter and rental housing if they
don’t have a subsidy. Diversion and Prevention programs might help in these
cases.
Length of stay for a majority of users (60%) is 1-3 months. This is slightly higher
than other communities, which usually see a majority of shelter participants
staying for less than 30 days.
o Is there a way to get different data so that it’s not “skewed”?
BSH/BOHO data doesn’t reflect the LOS data from the systems map, will take a
look at this- could be that chunks of people are being exited at one time which
makes LOS seem longer
BSH can help CSH understand from other sources how they manage exit data
BOHO had 1500 exits last year so our systems map is only reflecting ½ of the
population served by shelter
o Transitional housing:
Data included: EFAA Boulder County, EFAA City of Boulder, Bridge House –
Ready to work. Data not included: Boulder Shelter 12 unit program.
Most users enter Transitional Housing from Emergency Shelter and Places Not
Meant for Habitation.
Most (46%) are staying for more than a year. This is a little high compared to
other communities which see a majority staying between 6 months to one year.
This could indicate a lack of permanent housing available or the inability of
participants to move on to a more permanent residence.
A majority of users are exiting to Rental Housing.
The exit back to Transitional Housing is also high, and could indicate folks not
being able to move on to more permanent situations. Instead, they could be
moving from one TH program to the next, continuing to cycle in the system.
Because there are people entering from and exiting to Detox Centers or Jail,
some of these users could be cycling between the two unstable residences. This
could also indicate a sobriety requirement with TH programs.
o RRH
Small cohort of RRH slots, with only 5 exits. Data from MDHI.
A majority of users are entering from Emergency Shelter, which is common for
Rapid Re-housing programs. Targeting the literally homeless is a positive trend
here.
Similarly, the fact that there are folks entering from Rental Housing and then
exiting back to Rental Housing without a subsidy further seems to indicate that
they may need more assistance. They could be cycling. Maybe a subsidy or
some benefit would help them better maintain the Rental Housing.
Most are exiting to Don’t Know or Refused, which indicates the need for data
quality improvements.
o PSH
Data from: Lee Hill and Boulder Shelter Scattered Site
Most enter PSH from shelter and places not meant for habitation. Usually, PSH
programs target the literally homeless, so this is a positive trend.
A majority of exits are to permanent destinations. However, 54% is a little low
compared to other communities.
The high percentage of Unknown and Homeless exits (46%) is a bit concerning.
Though, with the low total exit number, this only accounts for 6 people (3 to
Other, 1 to ES, 1 to Hotel/Motel, and 1 to Foster Care).
Strategic framework – we have the systems map, but how do we align resources, align
investments and activities, collective impact, shared measures to know that we are successful,
how are we going to measure these,
Guiding principles:
o Access:
o Experience:
o Data driven: targeting
o Regional:
o Sustainable:
o Systems change:
Exercise: Systems Redesign – how do we picture the system without resource limitations?
o Front Door
o Inside
o Back door
o Each group presented their systems maps.
Boulder has done some data analysis that shows that 80% of people who come into the system
have shorts stays and are not seen again. This means that the majority of ES resources are
used on people who don’t end up in the community long term.
Parking lot: engagement for unconnected pops – jail, hospital, not connected to homeless
systems – to make sure there is an entry point for them and engagement within once they
enter.
Homework:
o Identify critical gaps in systems redesign – 5 post-it notes.
Follow up:
o List of data points needed to update the map to make it more reflective of what is
happening.
o List of shared terms so everyone is one the same page when discussion.