Embed Size (px)
Citation preview

BOSTON PUBLIC SCHOOLS Course 437: Middle School Pre-Algebra Scope and Sequence Guide 2013-2014 Background The 2013-2014 Scope and Sequence documents are the product of many hours of analysis, planning, and professional development among representatives of all corners of Boston’s mathematics community: teachers, administrators, and math office staff. This domain-by-domain, standard-by-standard work has been driven by the ongoing goal of providing students with wider access to Algebra 1 in grade 8 as well as to higher level math courses, including advanced placement. Our work has been informed by 2011 Massachusetts Frameworks, as well as the PARCC Model Content Frameworks for Mathematics, with particular focus on the learning trajectories for grades 5 through 8. The title, “Common Core State Standards” is often referenced in the media and in Federal statements on education policy. Massachusetts adopted the Common Core State Standards, and have incorporated them into the Commonwealth’s curriculum frameworks. Accordingly, the new 2011 standards are correctly referred to as the “Massachusetts Curriculum Framework for Mathematics.” The scope and sequence documents reflect the Common Core Instructional Shifts for Mathematics: Focus, Coherence, and Rigor. 1. Focus strongly where the standards focus. 2. Coherence: Think across grades, and link to major topics within grades. 3. Rigor: Require fluency, application and deep understanding. New curricular resources have been acquired by Boston Public Schools, and distributed to schools during the 2012-2013 school year to support instruction in these areas, as well as transition to the 2011 Massachusetts Frameworks. BPS will continue to use these supporting resources in forming mathematics instruction:
• Grade 6: CMP2 Common Core Investigations • Grade 7: CMP2 Common Core Investigations and Data Distributions • Grade 8: CMP2 Common Core Investigations and Kaleidoscopes, Hubcaps, and Mirrors.
Throughout the academic year, professional development opportunities will be offered to support our implementation Massachusetts Frameworks. Through this process, schools leaders and teachers are urged to regularly consult the Middle School Math page of MyBPS and MyLearningPlan for curriculum and instruction and professional development announcements. Additionally, the BPS

2
Curriculum and Instruction Weebly page has been established as a resource, and can be accessed at http://bpscurriculumandinstruction.weebly.com/
The Standards for Mathematical Practice The standards for mathematical practice describe varieties of expertise that mathematics educators at all levels should seek to develop in their students. These practices are based on two sets of processes and proficiencies which retain longstanding importance in mathematics education: the NCTM Process Standards (Problem Solving, Reasoning and Proof, Communication, Representation, Connections) and the strands of mathematical proficiency established by the National Research Council report, “Adding it Up.” These proficiencies include: Adaptive Reasoning, Strategic Competence, Conceptual Understanding (the comprehension of mathematical concept, operations, and relations), Procedural Fluency (the skill that enables students to apply procedures flexibly, accurately, efficiently, and appropriately), and Productive Disposition (the habitual inclination to see mathematics as sensible, useful, and worthwhile, coupled with a belief in diligence and one’s own efficacy). The Standards for Mathematical Practice describe the way in which developing mathematics students engage with the subject matter throughout learning trajectories. Accordingly, the Boston Public Schools Scope and Sequences documents for Secondary Mathematics Courses are designed to address the need to connect the mathematical practices to mathematical content throughout mathematics instruction. Standard for Mathematical Practice 1: Make sense of problems and persevere in solving them. In grade 7, students solve problems involving ratios and rates and discuss how they solved them. Students solve real world problems through the application of algebraic and geometric concepts. Students seek the meaning of a problem and look for efficient ways to represent and solve it. They may check their thinking by asking themselves, “What is the most efficient way to solve the problem?”, “Does this make sense?”, and “Can I solve the problem in a different way?”. Standard for Mathematical Practice 2: Reason abstractly and quantitatively In grade 7, students represent a wide variety of real world contexts through the use of real numbers and variables in mathematical expressions, equations, and inequalities. Students contextualize to understand the meaning of the number or variable as related to the problem and decontextualize to manipulate symbolic representations by applying properties of operations. Standard for Mathematical Practice 3: Construct viable arguments and critique the reasoning of others In grade 7, students construct arguments using verbal or written explanations accompanied by expressions, equations, inequalities, models, and graphs, tables, and other data displays (i.e. box plots, dot plots, histograms, etc.). They further refine their mathematical communication skills through mathematical discussions in which they critically evaluate their own thinking and the thinking of other students. They pose questions like “How did you get that?”, “Why is that true?” “Does that always work?”. They explain their thinking to others and respond to others’ thinking. Standard for Mathematical Practice 4: Model with Mathematics

3
In grade 7, students model problem situations symbolically, graphically, tabularly, and contextually. Students form expressions, equations, or inequalities from real world contexts and connect symbolic and graphical representations. Students explore covariance and represent two quantities simultaneously. They use measures of center and variability and data displays (i.e. box plots and histograms) to draw inferences, make comparisons and formulate predictions. Students use experiments or simulations to generate data sets and create probability models. Students need many opportunities to connect and explain the connections between the different representations. They should be able to use all of these representations as appropriate to a problem context. Standard for Mathematical Practice 5: Use appropriate tools strategically Students consider available tools (including estimation and technology) when solving a mathematical problem and decide when certain tools might be helpful. For instance, students in grade 7 may decide to represent similar data sets using dot plots with the same scale to visually compare the center and variability of the data. Students might use physical objects or applets to generate probability data and use graphing calculators or spreadsheets to manage and represent data in different forms. Standard for Mathematical Practice 6: Attend to precision In grade 7, students continue to refine their mathematical communication skills by using clear and precise language in their discussions with others and in their own reasoning. Students define variables, specify units of measure, and label axes accurately. Students use appropriate terminology when referring to rates, ratios, probability models, geometric figures, data displays, and components of expressions, equations or inequalities. Standard for Mathematical Practice 7: Look for and make use of structure Students routinely seek patterns or structures to model and solve problems. For instance, students recognize patterns that exist in ratio tables making connections between the constant of proportionality in a table with the slope of a graph. Students apply properties to generate equivalent expressions (i.e. 6 + 2x = 3 (2 + x) by distributive property) and solve equations (i.e. 2c + 3 = 15, 2c = 12 by subtraction property of equality), c=6 by division property of equality). Students compose and decompose two- and three-dimensional figures to solve real world problems involving scale drawings, surface area, and volume. Students examine tree diagrams or systematic lists to determine the sample space for compound events and verify that they have listed all possibilities. Standard for Mathematical Practice 8: Look for and express regularity in repeated reasoning In grade 7, students use repeated reasoning to understand algorithms and make generalizations about patterns. During multiple opportunities to solve and model problems, they may notice that a/b ÷ c/d = ad/bc and construct other examples and models that confirm their generalization. They extend their thinking to include complex fractions and rational numbers. Students formally begin to make connections between covariance, rates, and representations showing the relationships between quantities. They create, explain, evaluate, and modify probability models to describe simple and compound events. The Need for Efficiency and Collaboration

4
It is our collective responsibility to work together to continually seek and develop strategies that add power and efficiency to the instruction process. It is also our responsibility to ensure that we prepare our students adequately for each subsequent year of learning, realizing that no matter the grade at which we teach, we are preparing young minds for success in high school, college, and career. The Boston Public Schools, as well as the developers of Connected Mathematics 2, have identified a workshop model of instruction as the most efficient model currently available to optimize student gains in mathematics. Workshop is an inquiry-based model. It is the expectation of the district that the workshop model of instruction will be the primary and core instructional model used in all math classes in the district. In broad terms, the intent of the model is to provide an instructional framework that supports a blend of individual and group strategies that vary from explicitly teacher led direct instruction experiences to student led collaborative experiences. It is a model that emphasizes the recognition of students’ prior learning and allows students to increase their confidence by using their prior knowledge along side of their teachers in a variety of individual and group experiences. The savings in time that come from continual student engagement with their teacher and the confidence that comes from skillfully using prior knowledge to develop new knowledge, creates the energy and momentum among all members of the classroom community that is a necessary prerequisite for the successful completion of this scope and sequence. In short, classes who master our curricula collaborate to apply efficient strategies that combine the strengths of the teacher with the strengths of the students to achieve our learning goals. They are classes in which everyone understands the mission of the day, week, month, and year and everyone works collaboratively to achieve it. They are classes that are grounded in the common belief that we will be successful in our academic and personal goals. In addition, any highlighted standards within this document are listed on the MCAS Assessable Standards lists for spring 2013 and 2014. See the DESE website for more details: http://www.doe.mass.edu/mcas/transition/2013-14g10math.html?section=list. Essential Question(s) for the course: What does it mean for two quantities to be related proportionally? How are properties of numbers and operations applied to different classes of numbers (whole numbers, integers, rational numbers)? How are expressions and linear equations used to communicate mathematically? How are area, surface area, and volume used to solve problems with 2-dimensional and 3-dimensional shapes? How are probability models used to investigate chance processes? Why is the ability to draw inferences about populations based on representative sampling important? What will students have learned by the end of this course? In Grade 7, instruction focuses on four critical areas: (1) developing understanding of an applying proportional relationships; (2) developing understanding of operations with rational numbers and working with expressions and linear equations; (3) solving problems
5
involving scale drawings and informal geometric constructions, and working with two- and three-dimensional shapes to solve problems involving area, surface area, and volume; and (4) drawing inferences about populations based on samples.
• Students extend their understanding of ratios and develop understanding of proportionality to solve single- and multi-step problems. Students use their understanding of ratio and proportion to solve a wide variety of percent problems, including those involving discounts, interest, taxes, tips, and percent increase or decrease. Students solve problems about scale drawings by relating corresponding lengths between objects or by using the fact that relationships of lengths within an object are preserved in similar objects. Students graph proportional relationships and understand unit rate informally as a measure of the steepness of the related line, called the slope. They distinguish proportional relationships from other relationships.
• Students develop a unified understanding of number, recognizing fractions, decimals, and percents as different representations of rational numbers. Students extend operations to all rational numbers, maintaining the properties of operations and the relationships between addition and subtraction and multiplication and division. Applying these properties and viewing negative numbers in terms of everyday contexts, students explain and interpret rules for operations with negative numbers. They use the arithmetic of rational numbers as they formulate expressions and equations in one variable and use these equations to solve problems.
• Students extend their work from grade 6, solving problems involving the area and circumference of a circle and surface area of three-dimensional objects. To prepare for Grade 8 work on congruence and similarity, they reason about relationships among two-dimensional figures using scale drawings and informal geometric constructions, and they gain familiarity with the relationships between angles formed by intersecting lines. Students work with three-dimensional figures, relating them to two-dimensional figures by examining cross-sections. They solve real-world and mathematical problems involving area, surface area, and volume of two- and three-dimensional objects.
• Students build on previous work with single data distributions to compare two data distributions and address questions about differences between populations. They begin informal work with random sampling to generate data sets and learn about the importance of representative samples for drawing inferences.
According to the MA Curriculum Frameworks 2011, “in grade 7, instructional time should focus on 1.) developing understanding of and applying proportional relationships; 2.) developing understanding of operations with rational numbers and working with expressions and linear equations; 3.) solving problems involving scale drawings, and working with two- and three-dimensional shapes to solve problems involving area, surface area, and volume; and 4.) drawing inferences about populations based on samples.” The transition from additive to proportional thinking is a key stage in a student’s mathematical development. Real-world applications allow students to identify changing attributes in a context, to use ratios as multiplicative comparisons of two quantities, and to reason about the effect of change in one or both quantities. Sense making is key to the development of symbolic representation and algorithms for solving problems with ratios and proportions.

6
Mathematical communication is based on the use of numbers and symbols to represent and to act on quantities. Knowledgeable use of operations (addition, subtraction, multiplication, and division) on all rational numbers in both real-world and mathematical problems is an expected goal. Formalizing the use of variables to represent unknown or changing quantities in expressions and equations further extends mathematical communication and reasoning. Students recognize constant rate of change problems and represent them with tables, graphs, and equations. Students use properties of numbers and operations to solve equations. The course emphasis on proportional relationships, operations with rational numbers, equivalent expressions, and solving equations continues in the study of geometry, probability, and statistics. Explicit connections to these big ideas will strengthen student learning and emphasize discipline coherence. Students explore the relationship between scale, angle measure, area, surface area, and volume with 2-dimensional and 3-dimensional shapes. They investigate chance processes and develop, use, and evaluate probability models. They use random sampling to draw inferences about a population, and develop strategies to compare populations. What must students have learned by the middle of the academic year? By mid-year, students should have worked extensively with real-world and mathematical problems to reason proportionally and solve problems. They should compute fluently with rational numbers. They should recognize change in a linear pattern, identify the variables, and represent the relationship with tables, graphs, and equations. They should be able to recognize and form equivalent algebraic expressions and equations, and to solve equations.

7
Unit 1: Operations with Rational Numbers Primary Curricular Resource: Accentuate the Negative Instructional Time: 17 days Overarching Questions:
1. How do you decide if sums, differences, products, and quotients of two numbers are positive, negative, or zero? 2. Which operations on rational numbers are commutative? 3. What is the order of operations and why is it important? 4. What does it mean to say that multiplication distributes over addition?
Instructional Notes: • Fluency Marker: Solve multistep problems posed with positive and negative rational numbers in any form (whole numbers, fractions, and
decimals). • Fluency Marker: Apply and extend previous understandings of operations with fractions to add, subtract, multiply and divide rational
numbers. • Fluency Marker: Use properties of operations to generate equivalent fractions. • The 2011 Massachusetts Frameworks establish a strong focus on operations with positive and negative numbers. • Instruction in this unit should maintain a strong emphasis on rational numbers in any form (whole numbers, fractions, and decimals). • Investigation 1 of Accentuate the Negative is taught in grade 6.
Concepts developed in this unit • Extend rules for addition, subtraction, multiplication, and division to all rational numbers. • Understand negative numbers in everyday contexts. • Explain and interpret rules for adding, subtracting, multiplying, and dividing with negative numbers.
Standards for Mathematical Practice Focus #4 Model with mathematics. #8 Look for an express regularity in repeated reasoning.
Prior knowledge expected • Fluently add, subtract, multiply and divide multi-digit decimals using standard algorithms for each operation. • Understand that positive and negative numbers are used together to describe quantities having opposite directions or values. • Understand a rational number as a point on a number line. • Understand ordering and absolute value of rational numbers. • Solve real-world and mathematical problems by graphing points in all four quadrants of the coordinate plane.

8
Academic language developed in this unit absolute value, additive inverse, algorithm, associative property, commutative property, distributive property, estimate, evaluate, expression, integers, inverse operations, negative number, non-zero divisor, number line, number sentence, opposites, order of operations, positive number, rational numbers, repeating decimal, signed number, substitution, terminating decimal
Academic language from prior units or experiences algorithm, decimal, exponent, fact family, mixed number, rational number, reciprocal, repeating decimal, terminating decimal, x-axis, y-axis
Learning Outcomes
7.NS.1 Apply and extend previous understandings of addition and subtraction to add and subtract rational numbers; represent addition and subtraction on a horizontal or vertical number line diagram. a. Describe situations in which opposite quantities combine to make 0. For example, a hydrogen atom has 0 charge because its two
constituents are oppositely charged. b. Understand p + q as the number located a distance |q| from p, in the positive or negative direction depending on whether q is positive
or negative. Show that a number and its opposite have a sum of 0 (are additive inverses). Interpret sums of rational numbers by describing real-world contexts.
c. Understand subtraction of rational numbers as adding the additive inverse, p – q = p + (–q). Show that the distance between two rational numbers on the number line is the absolute value of their difference, and apply this principle in real-world contexts.
d. Apply properties of operations as strategies to add and subtract rational numbers.
7.NS.2 Apply and extend previous understandings of multiplication and division and of fractions to multiply and divide rational numbers. a. Understand that multiplication is extended from fractions to rational numbers by requiring that operations continue to satisfy the
properties of operations, particularly the distributive property, leading to products such as (–1)(–1) = 1 and the rules for multiplying signed numbers. Interpret products of rational numbers by describing real-world contexts.
b. Understand that integers can be divided, provided that the divisor is not zero, and every quotient of integers (with non-zero divisor) is a rational number. If p and q are integers, then –(p/q) = (–p)/q = p/(–q). Interpret quotients of rational numbers by describing real-world contexts.
c. Apply properties of operations as strategies to multiply and divide rational numbers. d. Convert a rational number to a decimal using long division; know that the decimal form of a rational number terminates in 0s or
eventually repeats.
7.NS.3 Solve real-world and mathematical problems involving the four operations with rational numbers. 7.EE.3 Solve multi-step real-life and mathematical problems posed with positive and negative rational numbers in any form (whole numbers,
fractions, and decimals), using tools strategically. Apply properties of operations to calculate with numbers in any form; convert between forms as appropriate; and assess the reasonableness of answers using mental computation and estimation strategies. For example: If a woman making $25 an hour gets a 10% raise, she will make an additional 1/10 of her salary an hour, or $2.50, for a new salary of $27.50. If you want to place a towel bar 9¾ inches long in the center of a door that is 27½ inches wide, you will need to place the bar about 9 inches from each edge; this estimate can be used as a check on the exact computation.

9
TERM
MA 2011 Framework
CItation
After completing each section, students will be able to:
Primary Curricular
Resource
Days

10
1
7.NS.1
7.NS.1.a
7.NS.1.b
7.NS.1.c
7.NS.1.d
7.NS.3 7.EE.3
2.1 Introducing Addition of Integers (7.NS.1a – d; 7.NS.3) o Model addition and subtraction of integers using distance/directions on a
number line and a chip model. o Understand absolute value as distance from zero on a number line. o Develop and use algorithms for adding and subtracting integers.
2.2 Introducing Subtraction of Integers (7.NS.1c, d; 7.NS.3) o Model addition and subtraction of integers using distance/directions on a
number line and a chip model. o Develop and use algorithms for adding and subtracting integers.
2.3 Addition & Subtraction Relationships (7.NS.1c, d; 7.NS.3) o Demonstrate that the Commutative Property holds for addition but not
subtraction of rational numbers. o Solve real-world and mathematical problems involving addition and
subtraction of integers.
2.4 Fact families (7.NS.c, d; 7.NS.3) o Solve equations with missing values by using related fact families.
2.5 Coordinate Graphing (6.NS.6-review) Extend graphing with positive and negative coordinates to all four quadrants.
ACCENTUATE THE NEGATIVE Inv. 2 Adding and Subtracting Integers 2.1 Introducing Addition of Integers 2.2 Introducing Subtraction of Integers 2.3 Addition and Subtraction Relationships 2.4 Fact Families 2.5 Coordinate Graphing Additional Notes: 2.2 – 2.4: Have students rewrite subtraction sentences as related addition sentences using Leave, Change, Opposite (L.C.O.) or similar strategy. This will help students deepen their understanding of the inverse relationship between addition & subtraction that will be useful when solving single and two-step equations later in the year. 2.5: Should be a review from 6th grade so could be done as a series of Do Now problems
6 days

11
1
7.NS.2
7.NS.2.a
7.NS.2.b
7.NS.2.c
7.NS.2.d
7.NS.3
7.EE.3
3.1 Introducing Multiplication of Integers (7.NS.2a) ° Model the relationship between repeated addition and multiplication of
integers using the number line 3.2 Multiplication Patterns (7.NS.2a, c; 7.NS.3) ° Use patterns to develop and use algorithms for multiplying integers. ° Solve real-world and mathematical problems involving multiplication of
integers (ACE Homework Problems). 3.3 Introducing Division of Integers (7.NS.2.b, c; 7.NS.3) ° Explore division of integers using fact families. ° Use patterns to develop and use algorithms for dividing integers. ° Solve real-world and mathematical problems involving division of integers.
3.4 Multiplying Integers with the Product Game (7.NS.2a) ° Use algorithms for multiplying and dividing integers.
ACCENTUATE THE NEGATIVE Inv. 3 Multiplying and Dividing Integers 3.1 Introducing Multiplication of Integers 3.3 Introducing Division of Integers 3.4 Multiplying Integers with the Product Game Additional Notes: Use parts of 3.1 as a launch (Intro and part A 1-5) and have students explore and use the patterns in 3.2 to develop their own algorithms for multiplying integers. 3.4: Play the game to practice/reinforce algorithms for multiplying integers
3 days

12
2
7.NS.1
7.NS.1.d
7.NS.2
7.NS.2.c
7.EE.3
4.1 Order of Operations (7.NS.1d; 7.NS.2c; 7.NS.3; 7.EE.3) ° Explore the use of the order of operations for computation.
4.2 Distributing Operations (6.EE.3, 4; 7.EE.3) ° Model the Distributive Property with areas of rectangles ° Develop and use the Distributive Property of multiplication over addition. ° Apply the Distributive Property to solve real-world and mathematical
problems.
4.3 Distributive Property and Subtraction (6.EE.3, 4; 7.EE.2, 3) ° Develop and use the Distributive Property of multiplication over addition and
subtraction. ° Apply the Distributive Property to solve real-world and mathematical
problems.
ACCENTUATE THE NEGATIVE Inv. 4 Properties of Operations 4.1 Order of Operations 4.2 Distributing Operations 4.3 Distributive Property and Subtraction http://www.uen.org/Lessonplan/preview.cgi?LPid=23376 (Simplifying Expressions Using the Order of Operations) Additional Notes: 4.1: Ensure students are exposed to problems involving rational numbers 4.2 & 4.3: Students should come with some understanding of the Distributive Property (6.EE.3) Introduce the concept of combining like terms on the same side of the equation (7.EE.2)
5 days
End Unit 1: Operations with Rational Numbers – October 1, 2013 14 Days of Core Instruction
3 days discretionary/assessment days

13
Unit 2: Similarity & Congruence Primary Curricular Resource: Stretching & Shrinking Estimated Instructional Time: 16 days Overarching Questions: 1. What is the same and what is different about two similar figures? 2. What determines whether two shapes are similar? 3. When figures are similar, how are the lengths, areas, perimeters, angles, and scale factors related? 4. How can I use information about similar figures to solve problems in real life?
Instructional Notes: • Fluency marker: Draw, construct and describe geometrical figures and describe the relationships between them. • The 2011 Massachusetts Frameworks establish a strong focus on similarity. • Instruction in this unit should maintain a strong emphasis on similarity, congruence, and solving problems involving scale drawings. • Since Variables & Patterns is now being taught in grade 6, basic coordinate geometry (Quadrant I) needs to be reviewed.
Concepts developed in this unit • Identify similar figures by comparing corresponding parts. • Use scale factors and ratios to describe and predict relationships among the side lengths, angle measures, perimeters and areas of similar
figures. • Reproducing a scale drawing at a different scale • Solve problems involving scale drawings of geometric figures
Standards for Mathematical Practice #3 Construct viable arguments and critique the reasoning of others. #4 Model with mathematics. #7 Look for and make use of structure.
Prior knowledge expected • Understand the concept of a ratio and use ratio language to describe a ratio relationship between two quantities. • Interpret multiplication as scaling. • Write, read and evaluate expressions in which letters stand for numbers. • Find the area and perimeter of triangles and quadrilaterals. • Draw polygons in the coordinate plane.

14
Terms developed in this unit coordinate pair, corresponding, equivalent ratios, image, nested triangles, ordered pair, proportion, proportional relationship, relationship, scale factor, scaling, similar, table, x-coordinate, y-coordinate
Terms from prior units or experience angle, area, base, coordinate graph, degree, dimensions, equivalent fractions, factor, height, length, perimeter, quadrilateral, ratio, width, x-axis, y-axis
Learning Outcomes
7.RP.1 Compute unit rates associated with ratios of fractions, including ratios of lengths, areas, and other quantities measured in like or different units. For example, if a person walks ½ mile in each ¼ hour, compute the unit rate as the complex fraction ½/¼ miles per hour, equivalently 2 miles per hour.
7.G.1 Solve problems involving scale drawings of geometric figures, such as computing actual lengths and areas from a scale drawing and reproducing a scale drawing at a different scale.
7.G.5 Use facts about supplementary, complementary, vertical, and adjacent angles in a multi-step problem to write and use them to solve simple equations for an unknown angle in a figure.
TERM
MA 2011 Framework
Citation
After completing each section, students will be able to:
Primary Curricular
Resource
Days

15
1
7.G.1
7.G.2
2.1 Making Similar Figures (7.G.1) ° Use algebraic rules to produce similar figures on a coordinate grid. ° Focus student attention on both lengths and angles as criteria for similarity. ° Contrast similar figures with non-similar figures. ° Begin to develop an understanding of the relationships of angles, side
lengths, perimeters, and areas of similar polygons. ° Understand the role multiplication plays in similarity relationships. 2.3 Scale Factors (7.G.1, 7.G.2) ° Develop more formal ideas of the meaning of similarity, including the
vocabulary of scale factor. ° Understand the relationships of angles, side lengths, perimeters, and areas of
similar polygons.
STRETCHING & SHRINKING Inv. 2 Similar Figures 2.1 Making Similar Figures 2.3 Scale Factors Additional Notes: 2.1: This is a great opportunity to review different types of angles (obtuse, acute, right) and encourage students to use language when comparing figures Teachers should review how to evaluate expressions before having students complete the table (this could also be done for homework the night before) Be sure to expose students to problems like ACE page 14, 15, & 18
°
4 days

16
1
7.G.1 7.G.5
3.3 Scale Factors and Similar Figures (7.G.1) ° Connect the ratio of areas of 2 similar figures to scale factors. ° Generalize relationship between scale factor and area, and to scale factors
less than 1. ° Use scale factors to make similar shapes. ° Find missing corresponding side lengths in similar figures using scale factor.
° Find missing corresponding angle measures in similar figures.
ACE Problems 22, 23, 24 (7.G.5) ° Use facts about supplementary, complementary, vertical, and adjacent angles
to find unknown angle measures in a figure.
STRETCHING & SHRINKING Inv. 3 Similar Polygons 3.3 Scale Factors and Similar Shapes ACE Problems 22, 23, 24 1 day

17
1
7.RP.1 7.G.1
4.1 Ratios within Similar Parallelograms (7.RP.1, 7.G.1) ° Use ratios of corresponding sides within a figure to determine whether two
figures are similar.
4.2 Ratios within Similar Triangles (7.RP.1, 7.G.1) ° Use ratios to identify similar triangles. 4.3 Using Similarity to Find Measurements (7.RP.1, 7.G.1) ° Use ratios to identify similar triangles. ° Use ratios of corresponding sides or scale factors to find missing lengths in
similar figures.
STRETCHING & SHRINKING Inv. 4 Similarity and Ratios 4.1 Ratios within Similar Parallelograms 4.2 Ratios within Similar Triangles 4.3 Using Similarity to Find Measurements Additional Notes: Students have worked with ratios in 6th grade and developed strategies for finding whether two ratios are proportional, so teachers should review these strategies during the Launch of 4.1 Part C of 4.1 is an opportunity to assess whether students understand what it means to be mathematically similar
°
4 days
18
1
7.RP.1 7.G.1
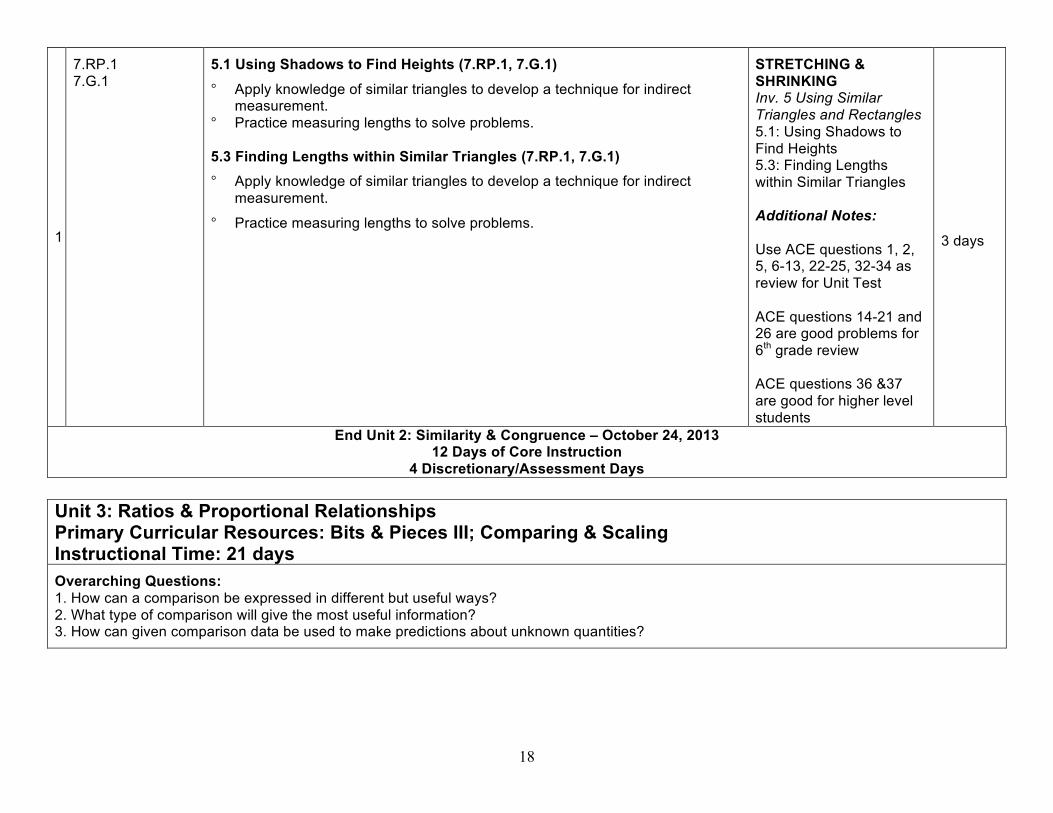
5.1 Using Shadows to Find Heights (7.RP.1, 7.G.1) ° Apply knowledge of similar triangles to develop a technique for indirect
measurement. ° Practice measuring lengths to solve problems. 5.3 Finding Lengths within Similar Triangles (7.RP.1, 7.G.1) ° Apply knowledge of similar triangles to develop a technique for indirect
measurement.
° Practice measuring lengths to solve problems.
STRETCHING & SHRINKING Inv. 5 Using Similar Triangles and Rectangles 5.1: Using Shadows to Find Heights 5.3: Finding Lengths within Similar Triangles Additional Notes: Use ACE questions 1, 2, 5, 6-13, 22-25, 32-34 as review for Unit Test ACE questions 14-21 and 26 are good problems for 6th grade review ACE questions 36 &37 are good for higher level students
3 days
End Unit 2: Similarity & Congruence – October 24, 2013 12 Days of Core Instruction
4 Discretionary/Assessment Days Unit 3: Ratios & Proportional Relationships Primary Curricular Resources: Bits & Pieces III; Comparing & Scaling Instructional Time: 21 days Overarching Questions: 1. How can a comparison be expressed in different but useful ways? 2. What type of comparison will give the most useful information? 3. How can given comparison data be used to make predictions about unknown quantities?

19
Instructional Notes: • Fluency marker: Analyze proportional relationships and use them to solve real-world and mathematical problems. • Fluency marker: Solve real-life and mathematical problems using numerical and algebraic expressions and equations. • The 2011 Massachusetts Frameworks establish a strong focus on ratios and proportional relationships. • Instruction in this unit should maintain a strong emphasis on proportional reasoning. • Investigation 4 from Bits & Pieces III is an essential review in order to address the details of standards 7.EE.2 and 7.RP.3.
Concepts developed in this unit • Analyze proportional relationships to solve real-world and mathematical problems
Standards for Mathematical Practice Focus #1 Make sense of problems and persevere in solving them. #3 Construct viable arguments and critique the reasoning of others. #8 Look for and express regularity in repeated reasoning.
Prior knowledge expected • Understand the concept of ratio and the concept of unit rate as it relates to ratios. • Use ratio and rate reasoning to solve real-world problems • Write, read and evaluate expressions in which letters stand for numbers • Know that Pi is the ratio of diameter to circumference of a circle.
Academic language developed in this unit coefficient, percent decrease, percent increase, mark ups, mark downs, rate, rate table, scaling (as a method of comparison), scale drawing, tax, unit rate
Academic language from prior units or experience data, decimal, denominator, equivalent fractions, equivalent ratios, fraction, improper fraction, mixed number, numerator, percent, proportion, proportional relationship, ratio, relationship, scale, scale factor, scaling, similar, survey, table

20
Learning Outcomes
7.RP.1 Compute unit rates associated with ratios of fractions, including ratios of lengths, areas, and other quantities measured in like or different units. For example, if a person walks ½ mile in each ¼ hour, compute the unit rate as the complex fraction ½/¼ miles per hour, equivalently 2 miles per hour.
7.RP.2 Recognize and represent proportional relationships between quantities.
a. Decide whether two quantities are in a proportional relationship, e.g., by testing for equivalent ratios in a table, or graphing on a coordinate plane and observing whether the graph is a straight line through the origin.
b. Identify the constant of proportionality (unit rate) in tables, graphs, equations, diagrams, and verbal descriptions of proportional relationships.
c. Represent proportional relationships by equations. For example, if total cost t is proportional to the number n of items purchased at a constant price p, the relationship between the total cost and the number of items can be expressed as t = pn.
d. Explain what a point (x, y) on the graph of a proportional relationship means in terms of the situation, with special attention to the points (0, 0) and (1, r ) where r is the unit rate.
7.RP.3 Use proportional relationships to solve multi-step ratio and percent problems. Examples: simple interest, tax, markups and markdowns,
gratuities and commissions, fees, percent increase and decrease, percent error. 7.EE.2 Understand that rewriting an expression in different forms in a problem context can shed light on the problem and how the quantities in it
are related. For example, a + 0.05a = 1.05a means that “increase by 5%” is the same as “multiply by 1.05.”
7.G.1 Solve problems involving scale drawings of geometric figures, such as computing actual lengths and areas from a scale drawing and reproducing a scale drawing at a different scale.
TERM
MA 2011 Framework
Citation
After completing each section, students will be able to:
Primary Curricular
Resource
Days

21
1
7.EE.2
7.RP.3
4.1 Determining Tax (7.RP.3, 7.EE.2) ° Using percent to solve problems involving tax and discount. ° Use proportional relationships to solve multi-step ratio and percent problems 4.2 Computing Tips (7.RP.3, 7.EE.2) ° Using percent to solve problems involving tip. ° Use proportional relationships to solve multi-step ratio and percent problems 4.3 Using Discounts (7.RP.3, 7.EE.2) ° Using percent to solve problems involving tax, discount, and tip. ° Use proportional relationships to solve multi-step ratio and percent problems ACE Problems (28, 29, 30, 34) (7.RP.3, 7.EE.2)
BITS & PIECES III Inv. 4 Using Percents 4.1 Determining Tax 4.2 Computing Tips 4.3 Using Discounts
Additional Notes:
Students should explore percents as a proportion (“out of 100”) to solve different types of percent problems
Students should also be able to recognize when a problem requires more than one step
Encourage students to annotate problems and identify what’s given (part, whole, percent) and what they’re being asked to find
Be sure to expose students to problems that involve simple interest, tax, markups and markdowns, gratuities and commissions, fees, percent increase and decrease, percent error
3 days

22
1
7.RP.2 7.RP.3
1.1 Exploring Ratios and Rates (7.RP.2a) ° Choose an appropriate method to make comparisons among quantities using
ratios, percents, fractions, rates, or differences.
1.2 Analyzing Comparison Statements (7.RP.2a) ° Choose an appropriate method to make comparisons among quantities using
ratios, percents, fractions, rates, or differences. ° Decide whether two quantities are in a proportional relationship and provide
evidence to support your claim. 1.3 Writing Comparison Statements (7.RP.2a, 7.RP.3) ° Choose an appropriate method to make comparisons among quantities using
ratios, percents, fractions, rates, or differences.
° Find equivalent forms of given ratios and rates to scale comparisons up and down
Additional Notes:
Emphasize the various types of comparisons that can be made from a data set, when one is better than another, and how to determine whether two comparison statements can come from the same data set
Encourage students use estimation and scale factors to find answers to questions in 1.1 and 1.3
Students may start to use proportions to test statements in 1.2
ACE questions 13-16 are good questions for connecting learning in last unit to this unit
COMPARING & SCALING Inv. 1 Making Comparisons
1.1 1.1 Exploring Ratios and Rates 1.2 Analyzing Comparison Statements 1.3 Writing Comparison
Statements
3 days

23
1
7.RP.2
7.RP.3
7.EE.2
2.1 Developing Comparison Strategies (7.RP.2, 7.EE.2) ° Find equivalent forms of given ratios and rates to scale comparisons up and
down. ° Understand that rewriting an expression in different forms in a problem
context can shed light on the problem and how to solve it. 2.2 More Comparison Strategies (7.RP.2, 7.EE.2) ° Find equivalent forms of given ratios and rates to scale comparisons up and
down. ° Understand that rewriting an expression in different forms in a problem
context can shed light on the problem and how to solve it. 2.3 Scaling Ratios (7.RP.2, 7.RP.3) ° Find equivalent forms of given ratios and rates to scale comparisons up and
down. ° Use proportional relationships to solve multi-step ratio and percent problems. Additional Notes:
At the end of this investigation, students should have several strategies for making comparisons (equivalent ratios, percents, unit rates)
Students should enter 7th grade having worked with ratios and rates, but may not know the term proportion or what it means for quantities to be proportional. This vocabulary should be reinforced throughout this Investigation.
Students should be encouraged to find scale factors (not divide) and always make the connection between multiplication being the inverse of division. This helps when solving equations with fractional coefficients
2.1 and 2.2 are great opportunities for students to share their strategies, assess the reasonableness of other students’ work, and generalize strategies for solving problems like these
Assign ACE problem 18 for spiral review
COMPARING & SCALING Inv. 2 Comparing Ratios, Fractions, Percents 2.1 Developing Comparison Strategies 2.2 More Comparison Strategies 2.3 Scaling Ratios
4 days

24
1
7.RP.1
7.RP.2
7.RP.2.b 7.RP.2.c 7.RP.2.d 7.RP.3
3.1 Making and Using a Rate Table (7.RP.1, 7.RP.2b, 7.EE.4a) ° Understand that a rate is a comparison of two quantities and requires
appropriate labeling. ° Find and interpret unit rates, and use them to make comparisons ° Use unit rates to write an equation to represent a pattern in a table of data 3.2 Finding Rates (7.RP.2) ° Introduce “steady” or “average” rate of progress. ° Understand that a rate is a comparison of two quantities and requires
appropriate labeling. ° Find and interpret unit rates, and use them to make comparisons 3.3 Unit Rates and Equations (7.RP.1, 7.RP.2b, 7.EE.4a) ° Find and interpret unit rates, and use them to make comparisons ° Use unit rates to write an equation to represent a pattern in a table of data 3.4 Two Different Rates (7.RP.1, 7.RP.2b) ° Understand that a rate is a comparison of two quantities and requires
appropriate labeling. ° Find and interpret unit rates, and use them to make comparisons Additional Notes: Help students make connections between a point on a graph of a proportional relationship and the constant of proportionality or unit rate. Have students make a graph of the data in 3.1 or a rate table and graph for 3.2. Ask students what a point on a graph means in terms of the situation and how you can identify the unit rate from a point on a graph. 3.4 is a great lesson for reinforcing the need to label quantities in rates
COMPARING & SCALING Inv. 3 Comparing and Scaling Rates 3.1 Making and Using a Rate Table 3.2 Finding Rates 3.3 Unit Rates and Equations 3.4 Two Different Rates
5 days
25
1
7.RP.2
7.RP.2.a
7.RP.2.b
7.RP.3
7.G.1
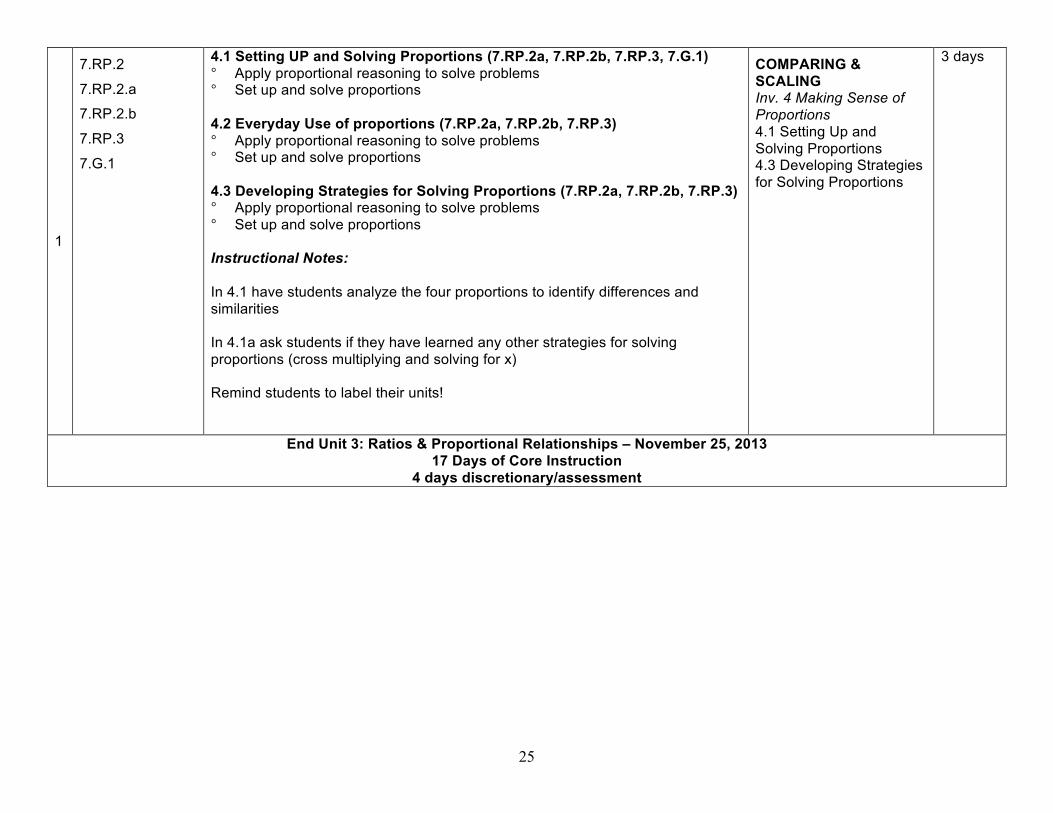
4.1 Setting UP and Solving Proportions (7.RP.2a, 7.RP.2b, 7.RP.3, 7.G.1) ° Apply proportional reasoning to solve problems ° Set up and solve proportions 4.2 Everyday Use of proportions (7.RP.2a, 7.RP.2b, 7.RP.3) ° Apply proportional reasoning to solve problems ° Set up and solve proportions 4.3 Developing Strategies for Solving Proportions (7.RP.2a, 7.RP.2b, 7.RP.3) ° Apply proportional reasoning to solve problems ° Set up and solve proportions Instructional Notes: In 4.1 have students analyze the four proportions to identify differences and similarities In 4.1a ask students if they have learned any other strategies for solving proportions (cross multiplying and solving for x) Remind students to label their units!
COMPARING & SCALING Inv. 4 Making Sense of Proportions 4.1 Setting Up and Solving Proportions 4.3 Developing Strategies for Solving Proportions
3 days
End Unit 3: Ratios & Proportional Relationships – November 25, 2013 17 Days of Core Instruction
4 days discretionary/assessment

26
Unit 4: Proportional Reasoning represented in Linear Relationships Primary Curricular Resources: Moving Straight Ahead, Common Core Investigations Instructional Time: 35 days Overarching Questions:
1. What patterns in the problem suggest a linear relationship? 2. How can a linear relationship be represented in a problem, with a table, in a graph, or with an equation? 3. How do changes in one variable affect changes in a related variable; and how can these changes be captured in a table, graph or
equation? 4. How are tables, graphs and equations interpreted to answer questions about linear relationships? 5. How can you find the slope of a line using a table, graph or equation? 6. How does finding the slope compare to finding the rate of change between two variables in a linear relationship?
Instructional Notes: • Fluency marker: Analyze proportional relationships and use them to solve real-world and mathematical problems. • Fluency marker: Solve real-life and mathematical problems using numerical and algebraic expressions and equations. • The 2011 Massachusetts Frameworks establish a strong focus on ratio and proportional reasoning through linear relationships
represented by the use of expressions, equations, tables, and graphs. This unit on linear relationships explicitly connects the constant of proportionality (unit rate) to the different representations.
• Instruction in this unit should maintain a strong emphasis on linear relationships. • A review of graphing relationships is essential to this unit. • Note that while slope is now encompassed within the 8th grade standards, the material in this unit provides a deeper understanding of
direct proportionality, which is a 7th grade standard. The unit rate is shown on the graph of a proportional relationship by the change between points (0,0) and (1, r), where r is the unit rate.
• Replace Moving Straight Ahead Inv. 3.5 with Variables & Patterns Inv. 2 ACE problem 6, page 38, to address the objective of applying the point of intersection of two equations in a real-world context.
• Common Core Investigation 1 will be taught after Moving Straight Ahead. Teachers need to make explicit connections between proportionality and writing equations.
Concepts developed in this unit • Recognize situations in which two or more variables have a linear relationship • Construct tables, graphs and equations that express linear relationships • Understand the connections between linear equations and the patterns in the tables and graphs of those equations; rate of change; slope;
and y-intercept • Solve linear equations • Use tables, graphs, and equations to answer questions about linear relationships

27
Standards for Mathematical Practice Focus #1 Make sense of problems and persevere in solving them. #4 Model with mathematics. #5 Use appropriate tools strategically. #7 Look for and make use of structure.
Prior knowledge expected • Write, read, and evaluate expressions in which letters stand for numbers. • Evaluate expressions at specific values of their variables. • Apply properties of operations to generate equivalent expressions. • Identify when two expressions are equivalent. • Use substitution to determine whether a given number in a specified set makes an equation or inequality true. • Use variables to represent numbers and write expressions when solving real-world or mathematical problems.
Academic language developed in this unit constant term, dependant variable, equation, independent variable, linear functions, linear relationship, origin, pattern, point of intersection, quadrants, rise, rule, run, scale, slope, solution, substitution, x-intercept, y-intercept
Academic language from prior units or experience coordinate pair, coordinate graph, dependent variable, equation, graph, independent variable, origin, pattern of change, rate, ratio, rule, scale, table, variable

28
Learning Outcomes 7.RP.1 Compute unit rates associated with ratios of fractions, including ratios of lengths, areas, and other quantities measured in like or different
units. For example, if a person walks ½ mile in each ¼ hour, compute the unit rate as the complex fraction ½/¼ miles per hour, equivalently 2 miles per hour.
7.RP.2 Recognize and represent proportional relationships between quantities.
a. Decide whether two quantities are in a proportional relationship, e.g., by testing for equivalent ratios in a table, or graphing on a coordinate plane and observing whether the graph is a straight line through the origin.
b. Identify the constant of proportionality (unit rate) in tables, graphs, equations, diagrams, and verbal descriptions of proportional relationships.
c. Represent proportional relationships by equations. For example, if total cost t is proportional to the number n of items purchased at a constant price p, the relationship between the total cost and the number of items can be expressed as t = pn.
d. Explain what a point (x, y) on the graph of a proportional relationship means in terms of the situation, with special attention to the points (0, 0) and (1, r ) where r is the unit rate.
7.EE.1 Apply properties of operations as strategies to add, subtract, factor, and expand linear expressions with rational coefficients. 7.EE.3 Solve multi-step real-life and mathematical problems posed with positive and negative rational numbers in any form (whole numbers,
fractions, and decimals), using tools strategically. Apply properties of operations to calculate with numbers in any form; convert between forms as appropriate; and assess the reasonableness of answers using mental computation and estimation strategies. For example: If a woman making $25 an hour gets a 10% raise, she will make an additional 1/10 of her salary an hour, or $2.50, for a new salary of $27.50. If you want to place a towel bar 9¾ inches long in the center of a door that is 27½ inches wide, you will need to place the bar about 9 inches from each edge; this estimate can be used as a check on the exact computation.
7.EE.4 Use variables to represent quantities in a real-world or mathematical problem, and construct simple equations and inequalities to solve
problems by reasoning about the quantities. a. Solve word problems leading to equations of the form px + q = r and p(x ÷ q) = r, where p, q, and r are specific rational numbers. Solve
equations of these forms fluently. Compare an algebraic solution to an arithmetic solution, identifying the sequence of the operations used in each approach. For example, the perimeter of a rectangle is 54 cm. Its length is 6 cm. What is its width?
b. Solve word problems leading to inequalities of the form px + q > r or px + q < r, where p, q, and r are specific rational numbers. Graph the solution set of the inequality and interpret it in the context of the problem. For example: As a salesperson, you are paid $50 per week plus $3 per sale. This week you want your pay to be at least $100. Write an inequality for the number of sales you need to make, and describe the solutions.
MA.7.EE.4c Extend analysis of patterns to include analyzing, extending, and determining an expression for simple arithmetic and geometric sequences (e.g., compounding, increasing area), using tables,graphs, words, and expressions
TERM
MA 2011
Framework Citation
After completing each section, students will be able to:
Primary Curricular
Resource
Days
29
2
7.EE.3
7.EE.4
7.EE.4.a
7.RP.1
7.RP.2
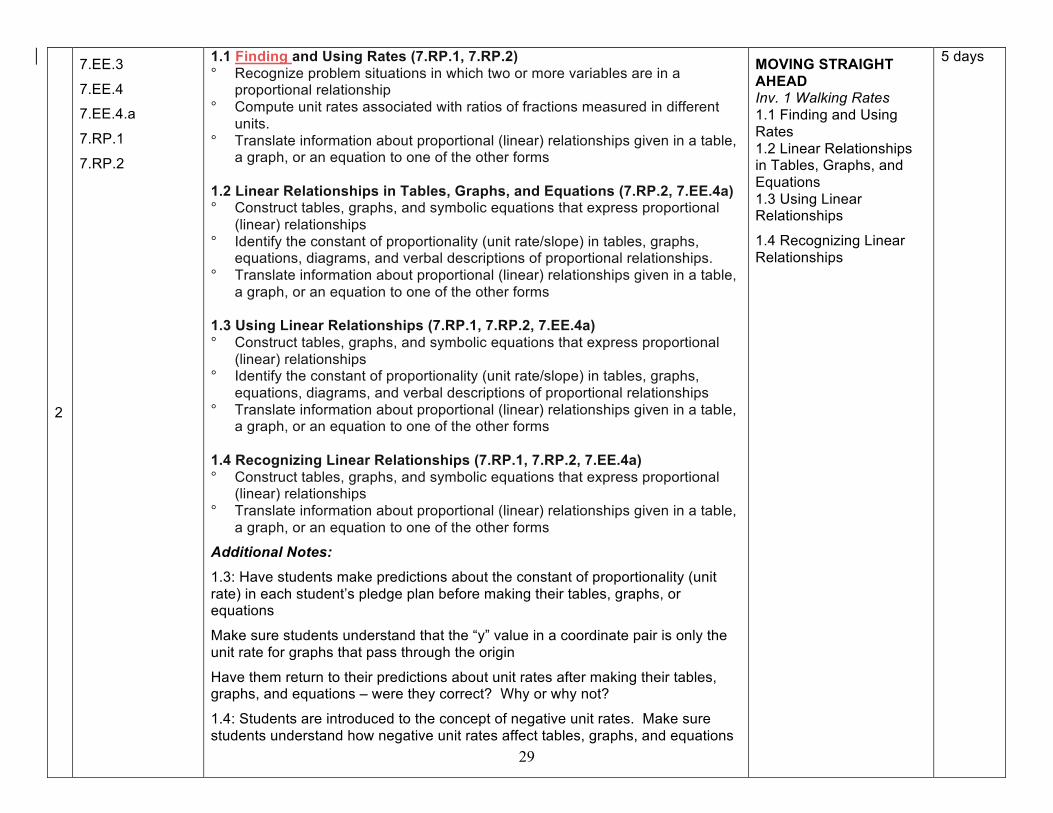
1.1 Finding and Using Rates (7.RP.1, 7.RP.2) ° Recognize problem situations in which two or more variables are in a
proportional relationship ° Compute unit rates associated with ratios of fractions measured in different
units. ° Translate information about proportional (linear) relationships given in a table,
a graph, or an equation to one of the other forms 1.2 Linear Relationships in Tables, Graphs, and Equations (7.RP.2, 7.EE.4a) ° Construct tables, graphs, and symbolic equations that express proportional
(linear) relationships ° Identify the constant of proportionality (unit rate/slope) in tables, graphs,
equations, diagrams, and verbal descriptions of proportional relationships. ° Translate information about proportional (linear) relationships given in a table,
a graph, or an equation to one of the other forms 1.3 Using Linear Relationships (7.RP.1, 7.RP.2, 7.EE.4a) ° Construct tables, graphs, and symbolic equations that express proportional
(linear) relationships ° Identify the constant of proportionality (unit rate/slope) in tables, graphs,
equations, diagrams, and verbal descriptions of proportional relationships ° Translate information about proportional (linear) relationships given in a table,
a graph, or an equation to one of the other forms 1.4 Recognizing Linear Relationships (7.RP.1, 7.RP.2, 7.EE.4a) ° Construct tables, graphs, and symbolic equations that express proportional
(linear) relationships ° Translate information about proportional (linear) relationships given in a table,
a graph, or an equation to one of the other forms
Additional Notes:
1.3: Have students make predictions about the constant of proportionality (unit rate) in each student’s pledge plan before making their tables, graphs, or equations
Make sure students understand that the “y” value in a coordinate pair is only the unit rate for graphs that pass through the origin
Have them return to their predictions about unit rates after making their tables, graphs, and equations – were they correct? Why or why not?
1.4: Students are introduced to the concept of negative unit rates. Make sure students understand how negative unit rates affect tables, graphs, and equations
MOVING STRAIGHT AHEAD Inv. 1 Walking Rates 1.1 Finding and Using Rates 1.2 Linear Relationships in Tables, Graphs, and Equations 1.3 Using Linear Relationships
1.4 Recognizing Linear Relationships
5 days

30
2
7.EE.3
7.EE.4
7.EE.4.a
7.EE.4.b
7.RP.1
7.RP.2.a 7.RP.2.b 7.RP.2.c 7.RP.2.d
2.1 Finding the Point of Intersection ° Generalize strategies for comparing different rates of change and finding the
point of intersection for two linear relationships.
2.2 Using Tables, Graphs, and Equations ° Understand the connections between linear equations and the patterns in the
tables and graphs of those equations: rate of change, slope, and y-intercept
° Formalize strategies for comparing different rates of change and finding the point of intersection for two linear relationships
2.3 Comparing Equations ° Understand the connections between linear equations and the patterns in the
tables and graphs of those equations: rate of change, slope, and y-intercept
2.4 Comparing Tables, Graphs, and Equations Understand the connections between linear equations and the patterns in the
tables and graphs of those equations: rate of change, slope, and y-intercept
Additional Notes:
2.1 could be used to launch Investigation 2.2 rather than as its own investigation
2.1 - Give students the opportunity to share answers to Part A and the strategies they used to find their answer
2.2 – Have students practice determining whether given points are solutions to equations, points on a graph, or values in a table
2.3 – Students do not formally learn to solve equations until the next investigation so many students will rely on making tables and graphs to determine the point of intersection for the two companies Throughout Investigation 2, ask students to identify the constant of proportionality
in each situation
MOVING STRAIGHT AHEAD Inv. 2 Exploring Linear Relationships with Graphs and Tables 2.1 Finding the Point of Intersection 2.2 Using Tables, Graphs, and Equations 2.3 Comparing Equations
2.4 Comparing Tables, Graphs, and Equations
5 days

31
2
7.EE.1
7.EE.3
7.EE.4
7.EE.4.a
3.1 Solving Equations Using Tables and Graphs (7.EE.1; 7.RP.2b-d; 7.EE.4) ° Solve problems and make decisions about linear relationships using
information given in tables, graphs, and symbolic expressions ° Use tables, graphs, and equations of linear relations to answer questions ° Connect solutions to equations to a table or a graph of the equation 3.2 Exploring Equality (7.EE.1; 7.EE.3; 7.EE.4; 7.NS.1b-d; 7.NS.2a-c) ° Begin to develop an understanding of equality ° Begin to use the properties of equality to solve equations that are represented
pictorially ° Translate equations that are represented pictorially into equations
represented using numbers and variables 3.3 Writing Equations (7.EE.1; 7.RP.2c; 7.EE.3; 7.EE.4; 7.NS.1b-d; 7.NS.2a-c) ° Use the properties of equality to solve equations ° Translate equations that are represented pictorially into equations
represented using numbers and variables ° Develop a strategy for solving equations without pictures ° Check solutions to equations 3.4 Solving Linear Equations (7.EE.1; 7.EE.3; 7.NS.1b-d; 7.NS.2a-c) ° Apply a strategy for solving linear equations ° Check solutions to equations
Additional Notes:
Throughout this investigation it is important that teachers and students be encouraged to translate the pictorial representations into numbers and variables
Students should be working toward developing a strategy for solving linear equations which relies heavily on their understanding of inverse operations
Teachers may want to review operations involving rational numbers before starting this investigation
MOVING STRAIGHT AHEAD Inv. 3 Solving Equations 3.1 Solving Equations with Tables and Graphs 3.2 Exploring Equality 3.3 Writing Equations 3.4 Solving Linear Equations
Also: VARIABLES & PATTERNS
Inv. 2 ACE Problem 6, page 38
5 days

32
2
7.EE.1
7.EE.3
7.EE.4
7.EE.4.a
4.1 (7.EE.1, 7.EE.3, 7.EE.4, 7.EE.4.a) ° Understand slope as the ratio of vertical change to horizontal change. 4.2 (7.EE.1, 7.EE.3, 7.EE.4, 7.EE.4.a) ° Connect slope to patterns of change. ° Recognize when the rate of change is equivalent from information in tables,
graphs, and equations ° Use information in tables, graphs, and equations to find the slope. 4.3 (7.EE.1, 7.EE.3, 7.EE.4, 7.EE.4.a) ° Explore patterns among lines with the same slope—parallel lines ° Explore patterns among lines whose slopes are negative reciprocals of each
other (perpendicular lines) Instructional Note:
• Special instructional emphasis should be placed upon the exploration of slope through proportional reasoning. This consolidates the ratio and proportion work students have worked on throughout the year, and prepares them for deeper exploration of linear relationships in Grade 8.
MOVING STRAIGHT AHEAD Inv. 4 Exploring Slope 4.1 Using Rise and Run 4.2 Finding the Slope of a Line 4.3 Exploring Patterns with Lines
4 days

33
2
7.RP.1
7.RP.2.a
7.RP.2.d
Investigation 1-Graphing Proportions 1.1 (7.RP.1, 7.RP.2a, 7.RP.2b, 7.RP.2d) ° Compute unit rates associated with ratios of fractions ° Decide whether two quantities are in a proportional relationship ° Explain what any point (x,y), including (0,0) and (1,r) where r is a unit rate, on
a graph of a proportional relationship means in terms of the situation 1.2 (7.RP.1, 7.RP.2a, 7.RP.2b, 7.NS.3) ° Compute unit rates associated with ratios of fractions ° Decide whether two quantities are in a proportional relationship 1.3 (7.RP.1, 7.RP.2a, 7.RP.2d) ° Compute unit rates associated with ratios of fractions ° Decide whether two quantities are in a proportional relationship ° Explain what any point (x,y), including (0,0) and (1,r) where r is a unit rate, on
a graph of a proportional relationship means in terms of the situation Additional Notes: 1.1 #5 asks students to identify the slope – this is an opportunity to help students make connections between the constant of proportionality and the slope 1.2: When reviewing problems in 1.2, ask students if the two quantities are in proportional relationship and how they know
COMMON CORE INVESTIGATIONS Inv. 1 Graphing Proportions Problem 1.1 Problem 1.2 Problem 1.3
4 days

34
2
7.EE.1
7.EE.2
Investigation 2 – Equivalent Expressions 2.1 (7.EE.1, 7.EE.2) ° Expand algebraic expressions by applying the properties of operations ° Use equivalent expressions in a problem context to show how quantities in
the problem are related 2.2 (7.EE.1, 7.EE.2) ° Expand algebraic expressions by applying the properties of operations ° Use equivalent expressions in a problem context to show how quantities in
the problem are related Additional Notes:
Review the properties of operations before starting this investigation
You may also want to review operations involving rational numbers
Students will also need to know how to combine like terms. If this was not taught in Accentuate the Negative, you will need to teach students how to do this before 2.1.
Be attentive to opportunities for mastery in and out of problem context and expose them to many problems involving rational numbers
COMMON CORE INVESTIGATIONS Inv. 2 Equivalent Expressions Problem 2.1 Problem 2.2
3 days

35
2
7.EE.4.b Investigation 3 – Inequalities 3.1 (7.EE.4b) ° Solve real world problems leading to one-step inequalities ° Graph the solutions to one-step inequalities and interpret the solution set in
the context of the problem 3.2 (7.EE.4b) ° Solve real world problems leading to one- and two-step inequalities involving
multiplication and division by positive numbers ° Graph the solutions to one- and two-step inequalities and interpret the
solution set in the context of the problem 3.3 (7.EE.4b) ° Solve real world problems leading to one- and two-step inequalities involving
multiplication and division by negative numbers ° Graph the solutions to one- and two-step inequalities and interpret the
solution set in the context of the problem Additional Notes: Review the inequality symbols and practice using them with rational numbers and expressions involving rational numbers (no variables) before starting this investigation
You will need to review how to solve equations in the form px + q = r or p(x÷q) = r before teaching students how to solve inequalities
COMMON CORE INVESTIGATIONS Inv. 3 Inequalities Problem 3.1 Problem 3.2 Problem 3.3
4 days
End Unit 4: Linear Relationships – January 29, 2014 30 days of Core Instruction
5 Discretionary/Assessment Days

36
Unit 5: Two-dimensional and Three-dimensional Geometry Primary Curricular Resources: Filling & Wrapping, Common Core Investigations Instructional Time: 32 days Overarching Questions: 1. What is the difference between surface area and volume? 2. Is it possible for 3-dimensional shapes to have the same volume, but different surface area? 3. How are the volumes of cylinders, cones, and spheres related? 4. What are some strategies in finding surface area and volume?
Instructional Notes: • Fluency marker: Solve real-life and mathematical problems involving angle measure, area, surface area and volume. • The 2011 Massachusetts Frameworks establish a strong focus on two- and three- dimensional shapes to solve problems on surface area
and volume. • Instruction in this unit should maintain a strong emphasis on surface area and volume. • During Inv. 5, teachers should make explicit connections between proportionality and scaling of boxes. • Surface area and volume of cylinders are needed for complete understanding of Investigation 3; however, surface area and volume of
cylinders are not specifically noted in CCSS for grade 7. This is a grade 8 standard 8.G.9.
Concepts developed in this unit • Relate 2-dimensional figures to 3-dimensional figures by examining cross-sections. • Solve real-world and mathematical problems involving area, surface area and volume of two and three-dimensional figures.
Standards for Mathematical Practice Focus #1 Make sense of problems and persevere in solving them. #4 Model with mathematics. #5 Use appropriate tools strategically. #6 Attend to precision.
Prior knowledge expected • Find the area of triangles, quadrilaterals, and other polygons by composing into rectangles or decomposing into triangles and other
shapes. • Understand radius, diameter and center of a circle and use them to find the circumference and area. • Find the volume of a right rectangular prism, including those with fractional edge lengths. • Represent 3-dimensional figures using nets made up of rectangles and triangles; and use the nets to find the surface area of these figures.

37
Academic language developed in this unit adjacent angle, area, base, complementary angles, cone, cube, cylinder, edge, formula, face, geometric figure, height, intersecting lines, net, polygon, prism, quadrilateral, rectangular prism, right prism, right triangle, sphere, supplementary angles, surface area, triangle, unit cube, vertical angle, volume
Academic language from prior units or experience acute angle, angle, circle, circumference, diagonal, diameter, dimensions, exterior angle, interior angle, obtuse angle, parallel lines, parallelogram, perpendicular lines, pi, radius, right angle, transversal, vertex
Learning Outcomes
7.G.1 Solve problems involving scale drawings of geometric figures, such as computing actual lengths and areas from a scale drawing and reproducing a scale drawing at a different scale.
7.G.3 Describe the two-dimensional figures that result from slicing three-dimensional figures, as in plane sections of right rectangular prisms and
right rectangular pyramids. 7.G.4 Know the formulas for the area and circumference of a circle and solve problems; give an informal derivation of the relationship between
the circumference and area of a circle. 7.G.5 Use facts about supplementary, complementary, vertical, and adjacent angles in a multi-step problem to write and use them to solve
simple equations for an unknown angle in a figure. 7.G.6 Solve real-world and mathematical problems involving area, volume, and surface area of two- and three-dimensional objects composed of
triangles, quadrilaterals, polygons, cubes, and right prisms. MA.7.G.7 Solve real-world and mathematical problems involving the surface area of spheres. 7.RP.1 Compute unit rates associated with ratios of fractions, including ratios of lengths, areas, and other quantities measured in like or different
units. For example, if a person walks ½ mile in each ¼ hour, compute the unit rate as the complex fraction ½/¼ miles per hour, equivalently 2 miles per hour.
TERM
MA 2011
Frameworks
After completing each section, students will be able to:
Primary Curricular
Resource
Days

38
3
7.G.6 ° Explain how to find the total area of all the faces of a rectangular box. ° Explain how to find the number of identical cubes it will take to fill a
rectangular box. ° Compare several different nets for a given box.
FILLING & WRAPPING Inv. 1 Building Boxes 1.1 Making Cubic Boxes
1.2 Making Rectangular Boxes 1.3Rectangular Prisms
1.4 Surface Area of Rectangular Prisms
4 days
3
7.G.6 ° Find volume and surface area of rectangular prisms ° Determine what type of arrangement will produce the least or greatest surface
area given a fixed volume.
FILLING & WRAPPING Inv. 2 Designing Rectangular Boxes 2.1 Finding Surface Area 2.2 Finding the Least Surface Area
2.3 Filling Rectangular Boxes
5 days
3
7.G.3
7.G.4
7.G.5
4.1 (7.G.3) Describe 2-dimensional cross sections of 3-dimensional figures 4.2 (7.G.4, 7.EE.4.a) ° Know and apply the formulas for area and circumference of circles ° Describe the relationship between the circumference and area of a circle
Additional Notes: 4.2: Incorporate practice using formulas to find the circumference and area of circles given the radius, diameter, circumference or area. Students should enter 8th grade fluent in finding area and circumference of circles in order to find the SA and Volume of Cylinders
COMMON CORE INVESTIGATIONS Inv. 4 Geometry Topics
4.1
4.2
1 day

39
3
7.G.4
7.G.6
MA.7.G.7
° Find volume and surface area of right prisms and cylinders. (see instructional note re: cylinders)
FILLING & WRAPPING Inv. 3 Prisms and Cylinders 3.1 Finding the Volumes of Other Prisms 3.2 Finding the Volumes of Cylinders 3.3 Finding the Surface Area of Cylinders and Prisms [LESSON ON SURFACE AREA OF SPHERES]
4 days
3
7.G.3
7.G.5
4.4 (7.G.3, 7.G.5) ° Use facts about supplementary, complementary, vertical, and adjacent angles
to solve single and multi-step problems
° Solve simple equations for unknown angles in a figure
Additional notes: 4.4: Opportunities for practice can be found on pages 14 & 15 of Filling and Wrapping
COMMON CORE INVESTIGATIONS Inv. 4 Geometry Topics
Problem 4.4
2 days

40
3
7.G.1
7.G.6
7.RP.1
5.1 Doubling the Volume of a Rectangular Prism ° Understand how changes in one or more dimensions of a rectangular prism
affect the prism’s volume ° Design rectangular prisms with a given volume 5.2 Applying Scale Factors of Rectangular Prisms ° Use scale factor to make new rectangular prisms; find the volume and surface
area of the new rectangular prisms ° Begin to understand the effect on surface area and volume of applying a scale
factor to a rectangular prism 5.3 Similarity and Scale Factors ° Determine how the volume and surface area of a rectangular prism changes
as any of its dimensions is scaled up or down.
Additional Notes: Before starting this investigation, review how to find the volume and surface area of cubes and rectangular prisms as well as the formulas used to find each
5.1: Include a review of similarity by asking students which if any boxes are similar and how students made their decisions
5.1 B2 & 3 helps students begin to think about the relationship between scale factor and the new box’s volume
5.2: Allow students to complete the table and then ask them to analyze the table and record any patterns they observe
Students may not be able to formally explain the effect on volume and surface area of applying a scale factor, but should be able to recognize how many times greater the volume & surface area are
5.3: Omit part C, as finding surface area and volume of cylinders is now an Grade 8 content standard.
FILLING & WRAPPING Inv. 5 Scaling Boxes 5.1 Doubling the Volume of a Rectangular Prism 5.2 Applying Scale Factors to Rectangular Prisms
5.3 Similarity and Scale Factors
5 days
3
7.G.5 ° Use facts about supplementary, complementary, vertical, and adjacent angles to solve single and multi-step problems
° Solve simple equations for unknown angles in a figure
COMMON CORE INVESTIGATIONS Inv. 4 Geometry Topics
Problem 4.4
2 days

41
End Unit 5: 2-dimensional and 3-dimensional Geometry – March 24, 2014 23 days of Core Instruction,
9 Discretionary/Assessment Days
42
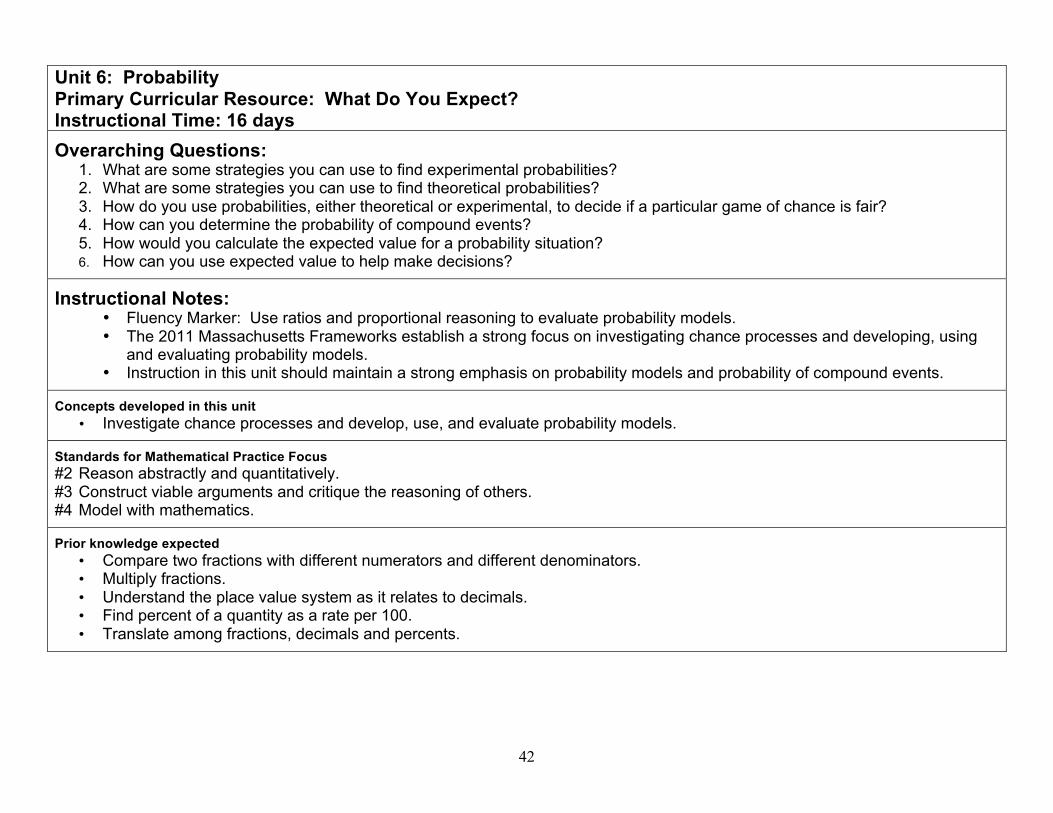
Unit 6: Probability Primary Curricular Resource: What Do You Expect? Instructional Time: 16 days Overarching Questions:
1. What are some strategies you can use to find experimental probabilities? 2. What are some strategies you can use to find theoretical probabilities? 3. How do you use probabilities, either theoretical or experimental, to decide if a particular game of chance is fair? 4. How can you determine the probability of compound events? 5. How would you calculate the expected value for a probability situation? 6. How can you use expected value to help make decisions?
Instructional Notes: • Fluency Marker: Use ratios and proportional reasoning to evaluate probability models. • The 2011 Massachusetts Frameworks establish a strong focus on investigating chance processes and developing, using
and evaluating probability models. • Instruction in this unit should maintain a strong emphasis on probability models and probability of compound events.
Concepts developed in this unit • Investigate chance processes and develop, use, and evaluate probability models.
Standards for Mathematical Practice Focus #2 Reason abstractly and quantitatively. #3 Construct viable arguments and critique the reasoning of others. #4 Model with mathematics.
Prior knowledge expected • Compare two fractions with different numerators and different denominators. • Multiply fractions. • Understand the place value system as it relates to decimals. • Find percent of a quantity as a rate per 100. • Translate among fractions, decimals and percents.

43
Academic language developed in this unit expected value, prediction, sample space, tree diagram, unlikely event
Academic language from prior units or experience certain outcome, chance, equally likely events, event experimental probability, fair game, favorable outcome, impossible outcome, outcome, possible, probability, probable, theoretical probability, trial
Learning Outcomes 7.SP.5 Understand that the probability of a chance event is a number between 0 and 1 that expresses the likelihood of the event occurring. Larger numbers
indicate greater likelihood. A probability near 0 indicates an unlikely event, a probability around ½ indicates an event that is neither unlikely nor likely, and a probability near 1 indicates a likely event.
7.SP.6 Approximate the probability of a chance event by collecting data on the chance process that produces it and observing its long-run relative frequency,
and predict the approximate relative frequency given the probability. For example, when rolling a number cube 600 times, predict that a 3 or 6 would be rolled roughly 200 times, but probably not exactly 200 times.
7.SP.7 Develop a probability model and use it to find probabilities of events. Compare probabilities from a model to observed frequencies; if the agreement is
not good, explain possible sources of the discrepancy. a. Develop a uniform probability model by assigning equal probability to all outcomes, and use the model to determine probabilities of events. For
example, if a student is selected at random from a class, find the probability that Jane will be selected and the probability that a girl will be selected. b. Develop a probability model (which may not be uniform) by observing frequencies in data generated from a chance process. For example, find the
approximate probability that a spinning penny will land heads up or that a tossed paper cup will land open-end down. Do the outcomes for the spinning penny appear to be equally likely based on the observed frequencies?
7.SP.8 Find probabilities of compound events using organized lists, tables, tree diagrams, and simulation.
a. Understand that, just as with simple events, the probability of a compound event is the fraction of outcomes in the sample space for which the compound event occurs.
b. Represent sample spaces for compound events using methods such as organized lists, tables, and tree diagrams. For an event described in everyday language (e.g., “rolling double sixes”), identify the outcomes in the sample space which compose the event.
c. Design and use a simulation to generate frequencies for compound events. For example, use random digits as a simulation tool to approximate the answer to the question: If 40% of donors have type A blood, what is the probability that it will take at least 4 donors to find one with type A blood?
TERM
MA 2011
Frameworks Citation
After completing each section, students will be able to:
Primary Curricular Resource
Days

44
3
7.SP.5
7.SP.7a
7.SP.7b
° Review basic probability concepts, such as fair game, experimental probability, theoretical probability, and fraction notation for expressing probabilities
WHAT DO YOU EXPECT? Inv. 1 Evaluating Games of Chance 1.1 Experimental and Theoretical Probability 1.2 Using and Organized List
1.3 Determining Whether a Game is Fair
3 days
3
7.SP.6 7.SP.7 7.SP.7a 7.SP.7b 7.SP.8 7.SP.8.a 7.SP.8.b 7.SP.8.c
° Use an area model to analyze the theoretical probabilities for two-stage outcomes ° Simulate and analyze probability situations involving two-stage outcomes ° Distinguish between equally likely and non–equally likely outcomes by collecting data
and analyzing experimental probabilities
WHAT DO YOU EXPECT? Inv. 2 Analyzing Situations Using an Area Model 2.1 Area Models and Probability 2.2 Using an Area Model
2.3 Finding the Best Arrangement
4 days
End Unit 6: Probability – April 17, 2014 13 days of Core Instruction
7 Discretionary/Assessment Days

45
Unit 7: Statistics Primary Curricular Resource: Data Distributions; Samples & Populations Instructional Time: 43 days Overarching Questions: 1. Meaningful Statistics:
What question was asked that resulted in these data being collected? How do you think the data were collected? Why are these data represented using this kind of presentation/display? What are the ways to describe the data distribution? What questions do the data raise? What is your response?
2. What makes a sample representative? 3. What does it mean to infer? How does random sampling allow me to draw inferences about a population? 4. What strategies can I use to compare two different data sets? Where do the data cluster in the distributions? How are the mean, median, range, and variability used to understand and describe data distributions? 5. Can I use my results to make predictions or generalizations about the populations?

46
Instructional Notes: o Fluency Marker: Use percentages and proportional reasoning to draw inferences about a population from a sample. o The 2011 Massachusetts Frameworks emphasize drawing inferences about populations based on relevant samples. o Instruction in this unit should maintain a focus on valid generalizations about a population derived from statistical analysis of
representative samples. o Use of relevant data promotes student engagement and learning. Consider the following data sets and resources for
classroom use. o Statistics Unit – Suggested Links for Data
http://www.cityofboston.gov/doit/databoston/ http://www.bostonindicators.org/Indicators2008/Default.aspx http://www.cityofboston.gov/dnd/U_Neighborhood_Profiles.asp http://www.bostonredevelopmentauthority.org/Research/ResearchSubject.asp?SubjectID=25 http://metrobostondatacommon.org/ http://www.hsph.harvard.edu/hyvpc/research/ http://quickfacts.census.gov/qfd/states/25/2507000.html http://www.census.gov/
o Frameworks 6.SP.1 through 6.SP5 will need to be included/reviewed in 7th grade in 2012-2013 only. Data Distributions Inv 1 and Samples and Populations Inv 1 will move to 6th grade in 2013-2014.
o The 7th grade statistics standards require use of both Data Distributions and Samples and Populations. o Manipulation of data sets with technology will help students understand how changes in data affect median and mean Data
Distributions Problem 2.4. o Another real-world problem with local relevance could be substituted here in place of Problem 3.2 application practice.
Concepts developed in this unit • Use random sampling to draw inferences about a population. • Note connection to major work of grade: Opportunity to apply percentages and proportional reasoning. • Draw informal comparative inferences about two populations.
Standards for Mathematical Practice Focus #2 Reason abstractly and quantitatively. #3 Construct viable arguments and critique the reasoning of others. #4 Model with mathematics. #5 Use appropriate tools strategically.

47
Prior knowledge expected • Recognize a statistical question as one that anticipates variability. • Understand that a data distribution can have different measures of center and can be described by identifying clusters, peaks,
gaps, and symmetry. • Display numerical data in line plots, histograms, circle graphs (MA.4.a), and box plots. • Summarize numerical data sets by quantitative measures of center (median and/or mean), and variability (interquartile range
and/or absolute deviation).
Academic language developed in this unit Data Distributions attribute, counts, distribution measures of center, ordered value bar graph, range, value of an attribute, value bar graph, variability of a set of numerical data
Samples and Populations box-and-whisker plot, convenience sample, five-number summary, histogram, population, random sample, sample, systematic sample, voluntary response sample, quartile
Academic language from prior units or experience categorical data, line plot, mean, median, mode, numerical data, outlier, scatter plot, stem-and-leaf plot, bar graph, coordinate graph, data, range, survey, table, x-axis, y-axis

48
Learning Outcomes 6.SP.1 Recognize a statistical question as one that anticipates variability in the data related to the question and accounts for it in the answers. For example,
“How old am I?” is not a statistical question, but “How old are the students in my school?” is a statistical question because one anticipates variability in students’ ages.
6.SP.2 Understand that a set of data collected to answer a statistical question has a distribution which can be described by its center, spread, and overall
shape. 6.SP.3 Recognize that a measure of center for a numerical data set summarizes all of its values with a single number, while a measure of variation describes
how its values vary with a single number. 6.SP.4 Display numerical data in plots on a number line, including dot plots, histograms, and box plots.
MA.4.a. Read and interpret circle graphs. 6.SP.5 Summarize numerical data sets in relation to their context, such as by:
a. Reporting the number of observations. b. Describing the nature of the attribute under investigation, including how it was measured and its units of measurement. c. Giving quantitative measures of center (median and/or mean) and variability (interquartile range and/or mean absolute deviation), as well as
describing any overall pattern and any striking deviations from the overall pattern with reference to the context in which the data were gathered. d. Relating the choice of measures of center and variability to the shape of the data distribution and the context in which the data were gathered.
7.SP.1 Understand that statistics can be used to gain information about a population by examining a sample of the population; generalizations about a
population from a sample are valid only if the sample is representative of that population. Understand that random sampling tends to produce representative samples and support valid inferences.
7.SP.2 Use data from a random sample to draw inferences about a population with an unknown characteristic of interest. Generate multiple samples (or
simulated samples) of the same size to gauge the variation in estimates or predictions. For example, estimate the mean word length in a book by randomly sampling words from the book; predict the winner of a school election based on randomly sampled survey data. Gauge how far off the estimate or prediction might be.
7.SP.3 Informally assess the degree of visual overlap of two numerical data distributions with similar variabilities, measuring the difference between the centers
by expressing it as a multiple of a measure of variability. For example, the mean height of players on the basketball team is 10 cm greater than the mean height of players on the soccer team, about twice the variability (mean absolute deviation) on either team; on a dot plot, the separation between the two distributions of heights is noticeable.
7.SP.4 Use measures of center and measures of variability for numerical data from random samples to draw informal comparative inferences about two populations. For example, decide whether the words in a chapter of a seventh-grade science book are generally longer than the words in a chapter of a fourth-grade science book.

49
TERM
MA2011
Frameworks Citation
After completing each section, students will be able to:
Primary Curricular Resource
Days
4
6.SP.1 6.SP.2 6.SP.4 6.SP.5
° Recognize that variability occurs when data are collected. ° Use properties of distributions to describe variability. ° (Statistics such as measures of central tendency (mean, median, ° mode), Variability (outliers, range), and Characteristics of shape ° (clumps, gaps, skewed distributions)) ° Use counts or percents to report frequencies of data. ° Read a data table and use it to make a bar graph. ° Use line plots and value bar graphs to display data distributions. ° Decide if a difference among data values matters in the context of the problem. ° Identify sources of variability.
DATA DISTRIBUTION Inv. 1 Making Sense of Variability 1.1 Variability in Categorical Data 1.2 Variability in Numerical Counts 1.3 Variability in Numerical Measurements 1.4 Two Kinds of Variability
5 days
4
6.SP.3
7.SP.4
° Recognize that variability occurs when data are collected. ° Use properties of distributions to describe variability. ° Decide if a difference among data values matters in the context of the problem. ° Read and understand bar graphs and line plots used to display data distributions ° Understand and use different models to make sense of the mean ° Decide when to use the mean, median, or mode to describe a distribution ° Develop and use strategies for comparing equal-size and unequal-size data sets ° Understand when and how changes in data values affect the median or mean ° Relate the shape of a distribution to the location of its mean and median
DATA DISTRIBUTION Inv. 2 Making Sense of Measures of Center 2.1 The Mean as an Equal Share 2.2 The Mean as a Balance Point in a Distribution 2.3 Repeated Values in a Distribution 2.4 Measures of Center and
Shapes of Distributions
5 days
4
7.SP.1
7.SP.4
° Decide when to use the mean, median, or mode to describe a distribution ° Recognize the importance of having the same scales on graphs that are used to
compare data distributions ° Develop and use strategies for comparing equal-size data sets to solve problems ° Understand and use three components of graph comprehension: ° Reading the data: use data in the graph to answer explicit questions ° Reading between the data: interpret and integrate information presented in a graph ° Reading beyond the data: extend, predict, or infer from data to
answer implicit questions
DATA DISTRIBUTION Inv. 3 Comparing Distributions: Equal Numbers of Data Values 3.1 Measuring and Describing Reaction Times 3.2 Comparing Reaction Times 3.3 Comparing Many Data Values
3.4 Comparing Larger Distributions
5 days

50
4
7.SP.1
7.SP.4
° Develop and use strategies for comparing unequal-size data sets to solve problems ° Use shape of a distribution to estimate locations of the mean and median ° Understand and use three components of graph comprehension: ° Reading the data: use data in the graph to answer explicit questions ° Reading between the data: interpret and integrate information
presented in a graph ° Reading beyond the data: extend, predict, or infer from data to
answer implicit questions
DATA DISTRIBUTION Inv. 4 Comparing Distributions: Unequal Numbers of Data Values 4.1 Representing Survey Data
4.2 Comparing Speed
3 days
4
6.SP.4 ° Learn how to make and use histograms, five-number summaries, and box-and-whisker plots
° Compare sample distributions using measures of center (mean, median), measures of variability (minimum and maximum values, range), and data displays that group data (histograms and box-and-whisker plots)
SAMPLES AND POPULATIONS Inv. 1 Comparing Data Sets 1.1 From Line Plots to Histograms 1.2 Using Histograms 1.3 Box-and-Whisker Plot
1.4 Analyzing Data
5 days
4
7.SP.1 7.SP.2 7.SP.4
° Distinguish between a sample and a population ° Use data from samples to make predictions about a population ° Consider various ways of developing a sample plan ° Select a random sample from a population ° Use sampling distributions, measures of center, and measures of variability to
describe and compare samples ° Note the effect of sample size on distribution and summary statistics
SAMPLES AND POPULATIONS Inv. 2 Choosing a Sample from a Population 2.1 Using a Sample to Make Predictions 2.2 Selecting a Sample 2.3 Choosing Random Samples 2.4 Choosing a Sample Size
5 days
4
7.SP.1 7.SP.3 7.SP.4
° Distinguish between samples and populations ° Use information from samples to draw conclusions about populations
SAMPLES AND POPULATIONS Inv. 3 Solving Real-World Problems
3.1 Comparing and Analyzing Data
2 days
End Unit 7: Statistics – June 13, 2014 30 days of Core Instruction
13 Discretionary/Assessment Days