Embed Size (px)
Citation preview

Country fact sheet
September 2017
Photo: © Toni García, My City/EEA
Land cover 2012
Bosnia and Herzegovina
Bosnia & Herzegovina
1
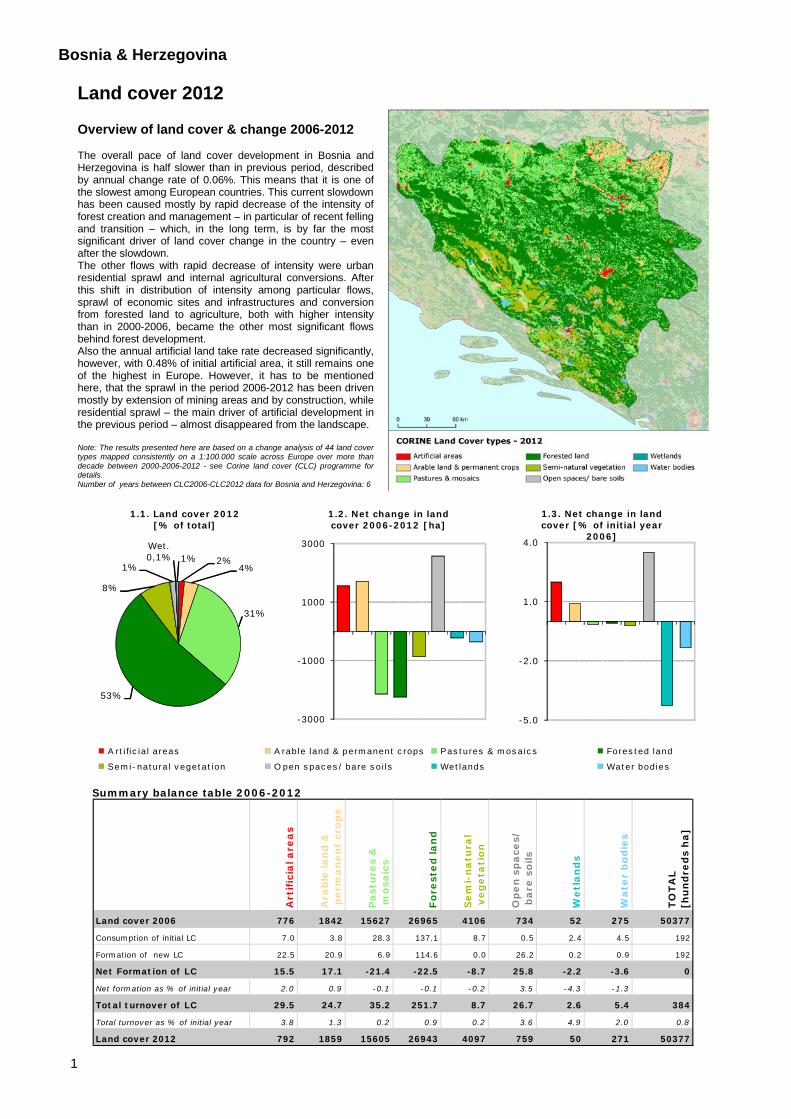
Land cover 2012 Overview of land cover & change 2006-2012 The overall pace of land cover development in Bosnia and Herzegovina is half slower than in previous period, described by annual change rate of 0.06%. This means that it is one of the slowest among European countries. This current slowdown has been caused mostly by rapid decrease of the intensity of forest creation and management – in particular of recent felling and transition – which, in the long term, is by far the most significant driver of land cover change in the country – even after the slowdown. The other flows with rapid decrease of intensity were urban residential sprawl and internal agricultural conversions. After this shift in distribution of intensity among particular flows, sprawl of economic sites and infrastructures and conversion from forested land to agriculture, both with higher intensity than in 2000-2006, became the other most significant flows behind forest development. Also the annual artificial land take rate decreased significantly, however, with 0.48% of initial artificial area, it still remains one of the highest in Europe. However, it has to be mentioned here, that the sprawl in the period 2006-2012 has been driven mostly by extension of mining areas and by construction, while residential sprawl – the main driver of artificial development in the previous period – almost disappeared from the landscape. Note: The results presented here are based on a change analysis of 44 land cover types mapped consistently on a 1:100.000 scale across Europe over more than decade between 2000-2006-2012 - see Corine land cover (CLC) programme for details. Number of years between CLC2006-CLC2012 data for Bosnia and Herzegovina: 6
2%4%
31%
53%
8%
1%
Wet. 0,1% 1%
1.1. Land cover 2012[% of total]
-3000
-1000
1000
3000
1.2. Net change in land cover 2006-2012 [ha]
-5.0
-2.0
1.0
4.0
1.3. Net change in land cover [% of initial year
2006]
A rtific ial areas A rable land & permanent c rops Pas tures & mosaics Fores ted land
Semi-natural vegetation O pen spaces/ bare soils Wetlands Water bodies
Summary balance table 2006-2012
Art
ific
ial a
rea
s
Ara
ble
lan
d &
pe
rma
ne
nt
cro
ps
Pa
stu
res
& m
osa
ics
Fo
rest
ed
lan
d
Se
mi-
na
tura
l v
eg
eta
tio
n
Op
en
sp
ace
s/ b
are
so
ils
We
tla
nd
s
Wa
ter
bo
die
s
TO
TA
L[h
un
dre
ds
ha
]
Land cover 2006 776 1842 15627 26965 4106 734 52 275 50377
Consumption of initial LC 7.0 3.8 28.3 137.1 8.7 0.5 2.4 4.5 192
Formation of new LC 22.5 20.9 6.9 114.6 0.0 26.2 0.2 0.9 192
Net Formation of LC 15.5 17.1 -21.4 -22.5 -8.7 25.8 -2.2 -3.6 0
Net formation as % of initial year 2.0 0.9 -0.1 -0.1 -0.2 3.5 -4.3 -1.3
Total turnover of LC 29.5 24.7 35.2 251.7 8.7 26.7 2.6 5.4 384
Total turnover as % of initial year 3.8 1.3 0.2 0.9 0.2 3.6 4.9 2.0 0.8
Land cover 2012 792 1859 15605 26943 4097 759 50 271 50377

Bosnia & Herzegovina
2
Land cover trends comparison 2000-2006 vs. 2006-2012
0.11%
0.06%
0 2000 4000 6000
2000-2006
2006-2012
2.4. Annual land cover change[ha/year, % of total area]
0 2000 4000 6000 8000
Artificial areas
Arable land& permanent crops
Pastures& mosaics
Forested land
Semi-natural vegetation
Open spaces/ bare soils
Wetlands
Water bodies
2.5. Annual turnover of LC types [ha/year]
2000-2006
2006-2012
-1000 -500 0 500 1000
Artificial areas
Arable land& permanent crops
Pastures& mosaics
Forested land
Semi-natural vegetation
Open spaces/ bare soils
Wetlands
Water bodies
2.6. Net annual change of LC types [ha/year]
Summary trend figures 2000-2006 2006-2012
Annual land cover change [ha/year] 5769 3204
Annual land cover change as % of initial year 0.11% 0.06%Land uptake by artificial development as mean annual change [ha/year] 979 367
Agricultural land uptake by urban and infrastructures development as mean annual change [ha/year] 872 198
Net uptake of forests and semi-natural land by agriculture as mean annual change [ha/year] -136 164
Net conversion from pasture to arable land and permanent crops as mean annual change [ha/year] 452 44
Forest & other woodland net formation as mean annual change [ha/year] -73 -374
Dry semi-natural land cover net formation as mean annual change [ha/year] 128 302
Wetlands & water bodies net formation as mean annual change [ha/year] 23 -98
0
1000
2000
3000
4000
lcf1
Urb
an la
nd m
anag
emen
t
lcf2
Urb
an r
esid
entia
l spr
awl
lcf3
Spr
awl o
f ec
onom
ic s
ites
and
infr
astr
uctu
res
lcf4
Agr
icul
ture
inte
rnal
con
vers
ions
lcf5
Con
vers
ion
from
for
este
d &
natu
ral l
and
to a
gric
ultu
re
lcf6
Withd
raw
al o
f fa
rmin
g
lcf7
For
ests
cre
atio
n an
dm
anag
emen
t
lcf8
Wat
er b
odie
s cr
eatio
n a
ndm
anag
emen
t
lcf9
Cha
nges
due
to
natu
ral a
ndm
ultip
le c
ause
s
2.7. Intensity of main change drivers (LC FLOWS) [ha/year]
2000-2006
2006-2012

Bosnia & Herzegovina
3
Artificial surfaces sprawl (2006-2012)
1.40
%
0.47
%
0
500
1000
2000-2006 2006-2012
3.8. Artificial land take [ha/year,
% of initial year]
Residential sprawl disappeared
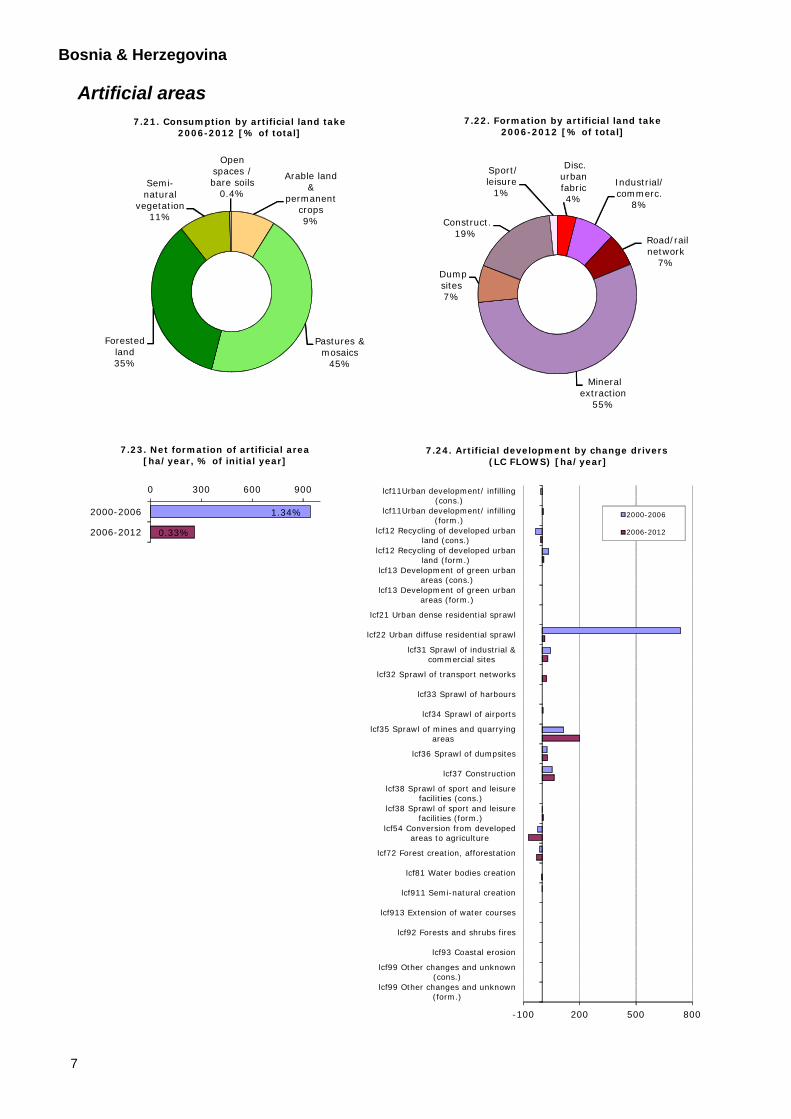
Despite rapid decrease of its intensity, the rate of artificial land take still remains one of the highest among European countries. The diffuse residential sprawl, which was by far the most powerful driver of the artificial development in the previous period 2000-2006, lost most of its intensity and almost disappeared from the landscape. In the period 2006-2012, the sprawl is driven mostly by extension of mines, quarries and waste dumpsites and also by construction. Geographically, the artificial development is distributed over the whole country, with similar pattern as in the previous period, however, with significantly lower intensity. In particular, the central region of the country, including the capital city Sarajevo, shows rapid decrease of sprawl, in comparison with previous period – there is almost no more artificial development in this region in the period 2006-2012.
77%
8%
2%
12% 1%
3.9. Artificial surfaces 2012 [% of total area]
0 100 200 300
3.10. Artificial land take 2006-2012 [ha/year]
-100
200
500
800
Con
tinu
ous
urba
n fa
bric
Dis
cont
inuo
us u
rban
fab
ric
Ind
ustr
ial o
r co
mm
erci
alun
its
Roa
d an
d ra
il ne
twor
ks a
ndas
soci
ated
land
Por
t ar
eas
Airpo
rts
Min
eral
ext
ract
ion
site
s
Dum
p si
tes
Con
stru
ctio
n si
tes
Gre
en u
rban
are
as
Spo
rt a
nd le
isur
e fa
cilit
ies
3.11. Mean annual artificial change by class [ha/year]
2000-2012
2006-2012

Bosnia & Herzegovina
4
Agriculture (2006-2012)
Rapid slowdown of pasture consumption
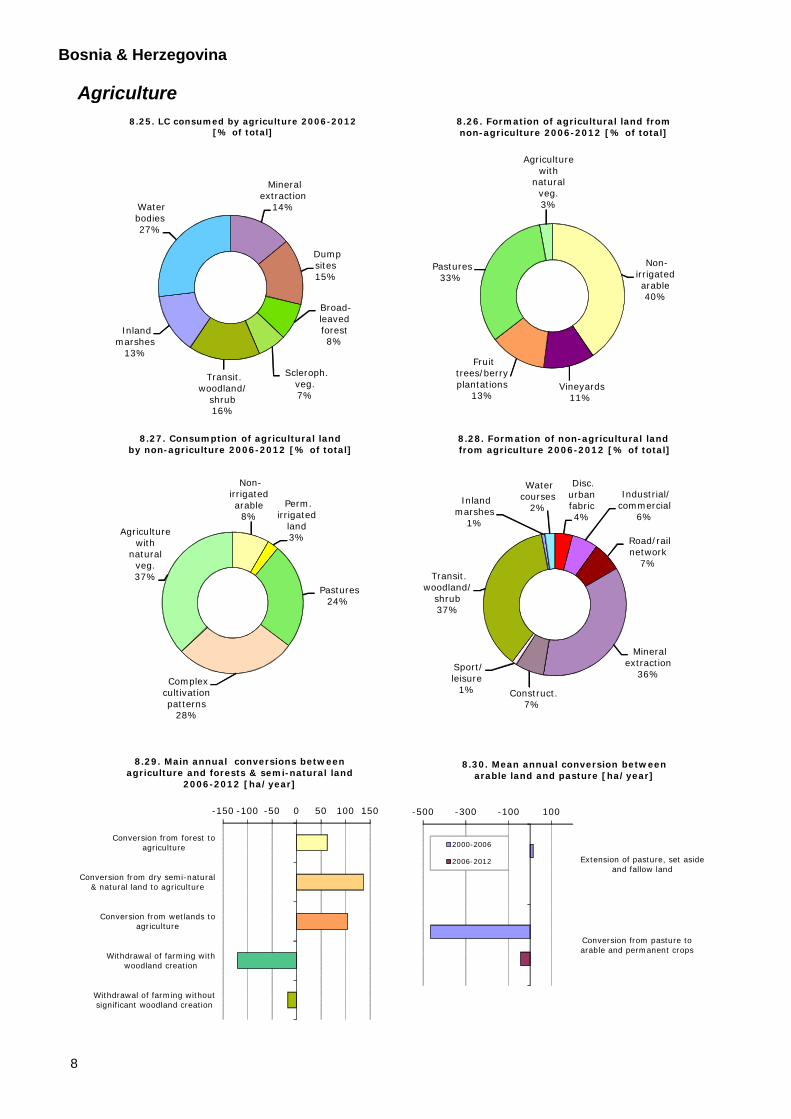
The pattern of agricultural development in Bosnia and Herzegovina is quite different comparing with previous period. In particular, consumption of pastures, the most significant trend in previous period, ended up. On the other hand, other flows occur which were not observed before, represented by formation of vineyards and fruit and berry plantations. The main reason for this decrease of pasture consumption intensity is the significant slowdown of urban residential sprawl and of internal agricultural conversion from pasture to arable land and permanent crops, as these flows were the main consumers of pasture land in the previous period. In general, agriculture internal conversions almost disappeared from the land cover development in the country.
21110%
2120.1% 221
0.1%
2220.3%
23119%
24241%
24330%
4.12. Agricultural areas 2012 [% of total area]
-0.1
9%
-2.1
8%
-0.1
6%
-0.1
2%
-0.2
8%
0.39
%
18.1
2%
24.6
8%
0.16
%
0.00
%
0.03
%
-1500
-1000
-500
0
500
1000
Non
-irr
igat
ed a
rabl
e la
nd
Per
man
ently
irriga
ted
land
Ric
e fie
lds
Vin
eyar
ds
Fru
it t
rees
and
ber
ry p
lant
atio
ns
Oliv
e gr
oves
Pas
ture
s
Ann
ual/
pe
rman
ent
crop
s
Com
plex
cul
t. p
atte
rns
Agr
icul
ture
with
nat
. ve
g.
Agr
o-fo
rest
ry a
reas
4.13. Development of agricultural areas 2006-2012– detailed balance [ha]
Consumption of initial land cover
Formation of new land cover 211 Non-irrigated arable land
212 Permanently irrigated land
213 Rice fields
221 Vineyards
222 Fruit trees and berry plantations
223 Olive groves
231 Pastures
241 Annual crops associated with permanent crops242 Complex cultivation patterns
243 Agriculture land with significant areas of natural vegetation244 Agro-forestry areas
-600
-300
0
300
Non
-irr
igat
ed a
rabl
e la
nd
Per
man
ently
irriga
ted
land
Ric
e fie
lds
Vin
eyar
ds
Fru
it t
rees
and
ber
ry p
lant
atio
ns
Oliv
e gr
oves
Pas
ture
s
Ann
ual/
per
man
ent
crop
s
Com
plex
cul
t. p
atte
rns
Agr
icul
ture
with
nat
. ve
g.
Agr
o-fo
rest
ry a
reas
4.14. Mean annual agricultural change by class [ha/year]
2000-2006
2006-2012

Bosnia & Herzegovina
5
Forest & nature (2006-2012)
84%
13%
2%
0.2%Wetl.
1%
5.15. Forest & nature areas 2012
[% of total area]
Forest
Semi-natural vegetation
Open spaces/ bare soils
Wetlands
Water bodies
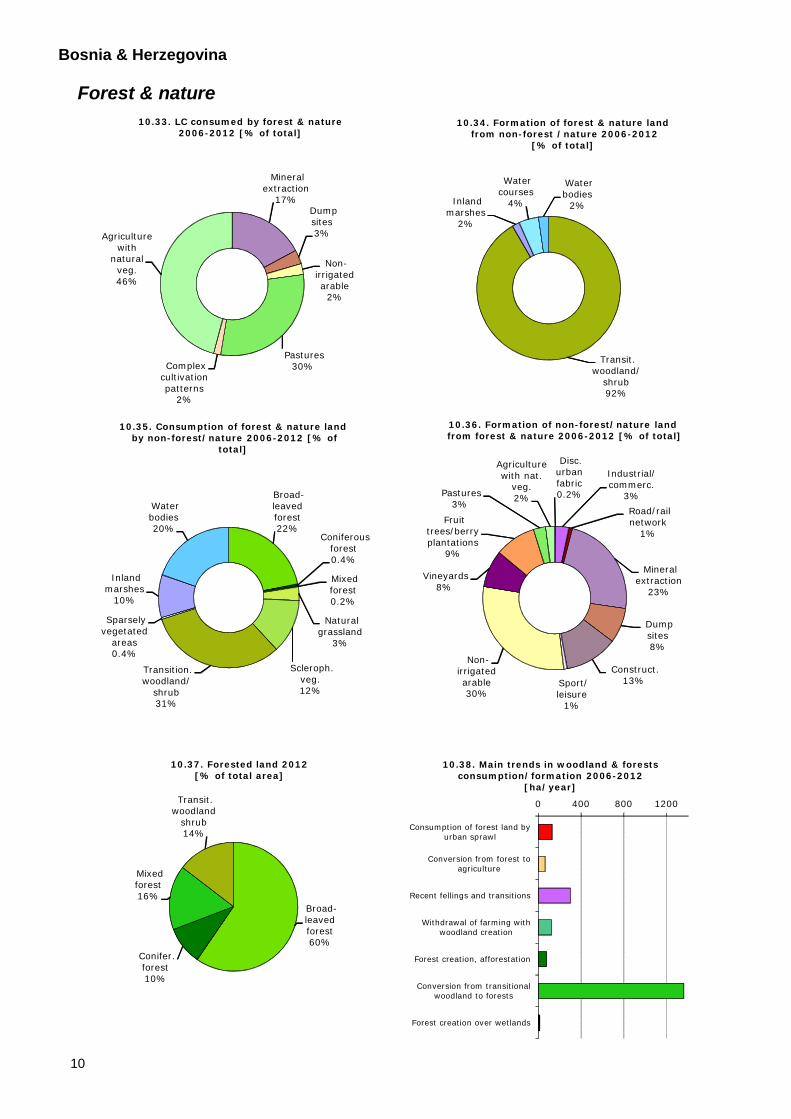
Slowdown of recent felling and transition
Despite significant decrease of its intensity, compared to previous period, forest creation and management remains the most powerful driver of land cover change in the country. As usual in Europe, this flow is represented mostly by forest internal conversions. Their prevailing direction is the conversion from transitional woodland to forest, in 2006-2012. On the other hand, the intensity of opposite recent felling and transition decreased significantly, compared to previous period. Except these forest internal flows, also forests and shrubs fires or conversion from wetlands to agriculture have been observed in the country, in the frame of natural land cover change.
-0.1
8%
-0.2
7%
-0.2
1%
-0.0
9%
-0.6
4%
-2.3
0%
-0.0
3%
-2.2
4%
-5.2
7%
-0.4
3%
-2.1
9%
0.44
%
0.22
%
0.18
%
0.76
%
0.19
%
214.
70%
0.35
%
0.62
%
0.20
%
-10000
-5000
0
5000
Bro
ad-l
eave
d fo
rest
Con
ifero
us for
est
Mix
ed for
est
Nat
ural
gra
ssla
nd
Moo
rs a
nd h
eath
land
Scl
erop
hyllo
us v
eget
atio
n
Tra
nsitio
nal w
oodl
and
shr
ub
Bea
ches
, du
nes,
san
d
Bar
e ro
ck
Spa
rsel
y ve
geta
ted
area
s
Bur
nt a
reas
Gla
cier
s/pe
rp.
snow
Inl
and
mar
shes
Pea
tbog
s
Sal
t m
arsh
es
Sal
ines
Int
ertida
l fla
ts
Wat
er c
ours
es
Wat
er b
odie
s
Coa
stal
lago
ons
Est
uaries
Sea
and
oce
an
5.16. Development of forest & nature areas 2006-2012 – detailed balance [ha]
Consumption of initial land cover
Formation of new land cover
-1500
-1000
-500
0
500
1000
Bro
ad-l
eave
d fo
rest
Con
ifero
us for
est
Mix
ed for
est
Nat
ural
gra
ssla
nd
Moo
rs a
nd h
eath
land
Scl
erop
hyllo
us v
eget
atio
n
Tra
nsitio
nal w
oodl
and
shr
ub
Bea
ches
, du
nes,
san
d
Bar
e ro
ck
Spa
rsel
y ve
geta
ted
are
as
Bur
nt a
reas
Gla
cier
s an
d pe
rpet
ual s
now
Inl
and
mar
shes
Pea
tbog
s
Sal
t m
arsh
es
Sal
ines
Int
ertida
l fla
ts
Wat
er c
ours
es
Wat
er b
odie
s
Coa
stal
lago
ons
Est
uaries
Sea
and
oce
an
5.17. Mean annual forest & nature change by class [ha/year]
2000-2006
2006-2012

Bosnia & Herzegovina
6
Annex: Land cover flows and trends Land cover flows 2006-2012
4%2%
15%
71%
5%
0.2%1% 2%
6.18. Consumption of land cover2006-2012 [% of total change
area]
12%
11%
3%
60%
14%
0.1%Wetl.
0.5%Water b.
6.19. Formation of land cover 2006-2012 [% of total change
area]
A rtific ial areas A rable land & permanent c rops Pas tures & mosaics Fores ted land
Semi-natural vegetation O pen spaces/ bare soils Wetlands Water bodies
lcf10.3%
lcf21% lcf3
11%lcf42%
lcf512%
lcf64%
lcf756%
lcf80.2%
lcf914%
6.20. Drivers of change (LC FLOWS)2006-2012 [% of total change area]
lc f1 U rban land management
lc f2 U rban res idential sprawl
lc f3 Sprawl of economic s ites and infras truc tures
lc f4 A griculture internal convers ions
lc f5 C onvers ion from fores ted & natural land to agriculture
lc f6 Withdrawal of farming
lc f7 Fores ts c reation and management
lc f8 Water bodies c reation and management
lc f9 C hanges due to natural and multiple causes
Bosnia & Herzegovina
7
Artificial areas
Arable land &
permanent crops9%
Pastures & mosaics
45%
Forested land35%
Semi-natural
vegetation11%
Open spaces / bare soils
0.4%
7.21. Consumption by artificial land take2006-2012 [% of total]
Disc. urban fabric4%
Industrial/commerc.
8%
Road/rail network
7%
Mineral extraction
55%
Dump sites7%
Construct.19%
Sport/leisure
1%
7.22. Formation by artificial land take2006-2012 [% of total]
1.34%
0.33%
0 300 600 900
2000-2006
2006-2012
7.23. Net formation of artificial area [ha/year, % of initial year]
-100 200 500 800
lcf11Urban development/ infilling(cons.)
lcf11Urban development/ infilling(form.)
lcf12 Recycling of developed urbanland (cons.)
lcf12 Recycling of developed urbanland (form.)
lcf13 Development of green urbanareas (cons.)
lcf13 Development of green urbanareas (form.)
lcf21 Urban dense residential sprawl
lcf22 Urban diffuse residential sprawl
lcf31 Sprawl of industrial &commercial sites
lcf32 Sprawl of transport networks
lcf33 Sprawl of harbours
lcf34 Sprawl of airports
lcf35 Sprawl of mines and quarryingareas
lcf36 Sprawl of dumpsites
lcf37 Construction
lcf38 Sprawl of sport and leisurefacilities (cons.)
lcf38 Sprawl of sport and leisurefacilities (form.)
lcf54 Conversion from developedareas to agriculture
lcf72 Forest creation, afforestation
lcf81 Water bodies creation
lcf911 Semi-natural creation
lcf913 Extension of water courses
lcf92 Forests and shrubs fires
lcf93 Coastal erosion
lcf99 Other changes and unknown(cons.)
lcf99 Other changes and unknown(form.)
7.24. Artificial development by change drivers(LC FLOWS) [ha/year]
2000-2006
2006-2012
Bosnia & Herzegovina
8
Agriculture
Mineral extraction
14%
Dump sites15%
Broad-leaved forest8%
Scleroph. veg.7%
Transit. woodland/
shrub16%
Inland marshes
13%
Water bodies27%
8.25. LC consumed by agriculture 2006-2012 [% of total]
Non-irrigated arable40%
Vineyards11%
Fruit trees/berry plantations
13%
Pastures33%
Agriculture with
natural veg.3%
8.26. Formation of agricultural land from non-agriculture 2006-2012 [% of total]
Non-irrigated arable
8%Perm.
irrigated land3%
Pastures24%
Complex cultivation patterns
28%
Agriculture with
natural veg.37%
8.27. Consumption of agricultural landby non-agriculture 2006-2012 [% of total]
Disc. urban fabric4%
Industrial/commercial
6%
Road/rail network
7%
Mineral extraction
36%
Construct.7%
Sport/leisure
1%
Transit. woodland/
shrub37%
Inland marshes
1%
Water courses
2%
8.28. Formation of non-agricultural landfrom agriculture 2006-2012 [% of total]
-150 -100 -50 0 50 100 150
Conversion from forest toagriculture
Conversion from dry semi-natural& natural land to agriculture
Conversion from wetlands toagriculture
Withdrawal of farming withwoodland creation
Withdrawal of farming withoutsignificant woodland creation
8.29. Main annual conversions between agriculture and forests & semi-natural land
2006-2012 [ha/year]
-500 -300 -100 100
Extension of pasture, set asideand fallow land
Conversion from pasture toarable and permanent crops
8.30. Mean annual conversion between arable land and pasture [ha/year]
2000-2006
2006-2012

Bosnia & Herzegovina
9
0 100 200 300 400
lcf411 Uniform extension ofset aside fallow land and
pasture
lcf412 Diffuse extension of setaside fallow land and pasture
lcf421 Conversion from arableland to permanent irrigation
perimeters
lcf422 Other internalconversions of arable land
lcf431 Conversion from olivesgroves to vineyards and
orchards
lcf432 Conversion fromvineyards and orchards to
olive groves
lcf433 Other conversionsbetween vineyards and
orchards
lcf441 Conversion frompermanent crops topermanent irrigation
perimeters
lcf442 Conversion fromvineyards and orchards tonon-irrigated arable land
lcf443 Conversion from olivegroves to non-irrigated arable
land
lcf444 Diffuse conversion frompermanent crops to arable
land
lcf451 Conversion from arableland to vineyards and orchards
lcf452 Conversion from arableland to olive groves
lcf453 Diffuse conversion fromarable land to permanent
crops
lcf461 Conversion frompasture to permanentirrigation perimeters
lcf462 Intensive conversionfrom pasture to non-irrigatedarable land and permanent
crops
lcf463 Diffuse conversion frompasture to arable and
permanent crops
lcf47 Extension of agro-forestry
9.31. Mean annual agriculture internalconversions [ha/year]
2000-2006
2006-2012
-800 -600 -400 -200 0 200
lcf13 Development of green urbanareas
lcf2 Urban residential sprawl
lcf3 Sprawl of economic sites andinfrastructures
lcf511 Intensive conversion from forestto agriculture
lcf512 Diffuse conversion from forest toagriculture
lcf521 Intensive conversion from semi-natural land to agriculture
lcf522 Diffuse conversion from semi-natural land to agriculture
lcf523 Conversions from agriculture-nature mosaics to continuousagriculture (cont. agri. cons.)
lcf523 Conversions from agriculture-nature mosaics to continuousagriculture (cont. agri. form.)
lcf53 Conversion from wetlands toagriculture
lcf54 Conversion from developed areasto agriculture
lcf61 Withdrawal of farming withwoodland creation
lcf62 Withdrawal of farming withoutsignificant woodland creation
lcf81 Water bodies creation
lcf913 Extension of water courses
lcf92 Forests and shrubs fires
lcf93 Coastal erosion
lcf99 Other changes and unknown(agri. cons.)
lcf99 Other changes and unknown(agri. form.)
9.32. Mean annual conversions between agricultureand other LC types [ha/year]
2000-2006
2006-2012
Bosnia & Herzegovina
10
Forest & nature
Mineral extraction
17%Dump sites3%
Non-irrigated arable
2%
Pastures30%Complex
cultivation patterns
2%
Agriculture with
natural veg.46%
10.33. LC consumed by forest & nature2006-2012 [% of total]
Transit. woodland/
shrub92%
Inland marshes
2%
Water courses
4%
Water bodies
2%
10.34. Formation of forest & nature land from non-forest /nature 2006-2012
[% of total]
Broad-leaved forest22%
Coniferous forest0.4%
Mixed forest0.2%
Natural grassland
3%
Scleroph. veg.12%
Transition. woodland/
shrub31%
Sparsely vegetated
areas0.4%
Inland marshes
10%
Water bodies20%
10.35. Consumption of forest & nature landby non-forest/nature 2006-2012 [% of
total]
Disc. urban fabric0.2%
Industrial/commerc.
3%Road/rail network
1%
Mineral extraction
23%
Dump sites8%
Construct.13%Sport/
leisure1%
Non-irrigated arable30%
Vineyards8%
Fruit trees/berry plantations
9%
Pastures3%
Agriculture with nat.
veg.2%
10.36. Formation of non-forest/nature landfrom forest & nature 2006-2012 [% of total]
Broad-leaved forest60%
Conifer. forest10%
Mixed forest16%
Transit. woodland
shrub14%
10.37. Forested land 2012 [% of total area]
0 400 800 1200
Consumption of forest land byurban sprawl
Conversion from forest toagriculture
Recent fellings and transitions
Withdrawal of farming withwoodland creation
Forest creation, afforestation
Conversion from transitionalwoodland to forests
Forest creation over wetlands
10.38. Main trends in woodland & forests consumption/formation 2006-2012
[ha/year]

Bosnia & Herzegovina
11
Natural grassland
61%
Moors and
heathl.4%
Scleroph. veg.19%
Beaches, dunes
and sand plains0.01%
Bare rock1%
Sparsely veget.areas14%
Burnt areas1%
Glaciers and
perpetual snow
0.01%
11.39. Dry semi-natural areas 2012 [% of total area]
0 20 40
Consumption of dry semi-naturalland cover by urban sprawl
Conversion of semi-natural landcover to agriculture
Forest creation, afforestation overdry semi-natural land
Withdrawal of farming withoutwoodland creation
Decrease of permanent snow andglaciers
11.40. Main trends in dry semi-natural land consumption/formation 2006-2012
[ha/year]
Inland marshes
14%
Peatbogs2%
Water courses
26%
Water bodies58%
11.41. Wetlands & water 2012[% of total area]
-80 -40 0 40
Consumption of wetlands byurban sprawl
Conversion of wetlands toagriculture
Forest creation and afforestationover wetlands
Withdrawal of farming withoutwoodland creation
Net water bodies creation
Net wetlands creation
11.42. Main trends in wetlands & water consumption/formation 2006-2012
[ha/year]
-3000 -1000 1000 3000
lcf13 Development of green urban areas
lcf2 Urban residential sprawl
lcf3 Sprawl of economic sites and infrastructures
lcf511 Intensive conversion from forest to agriculture
lcf512 Diffuse conversion from forest to agriculture
lcf61 Withdrawal of farming with woodland creation
lcf71 Conversion from transitional woodland to forest (cons.)
lcf71 Conversion from transitional woodland to forest (form.)
lcf72 Forest creation, afforestation
lcf73 Forests internal conversions (cons.)
lcf73 Forests internal conversions (form.)
lcf74 Recent felling and transition (cons.)
lcf74 Recent felling and transition (form.)
lcf8 Water bodies creation and management
lcf9 Changes of land cover due to natural and multiple causes (cons.)
lcf9 Changes of land cover due to natural and multiple causes (form.)
11.43. Mean annual conversions of forest & other woodland[ha/year]
2000-2006
2006-2012
Bosnia & Herzegovina
12
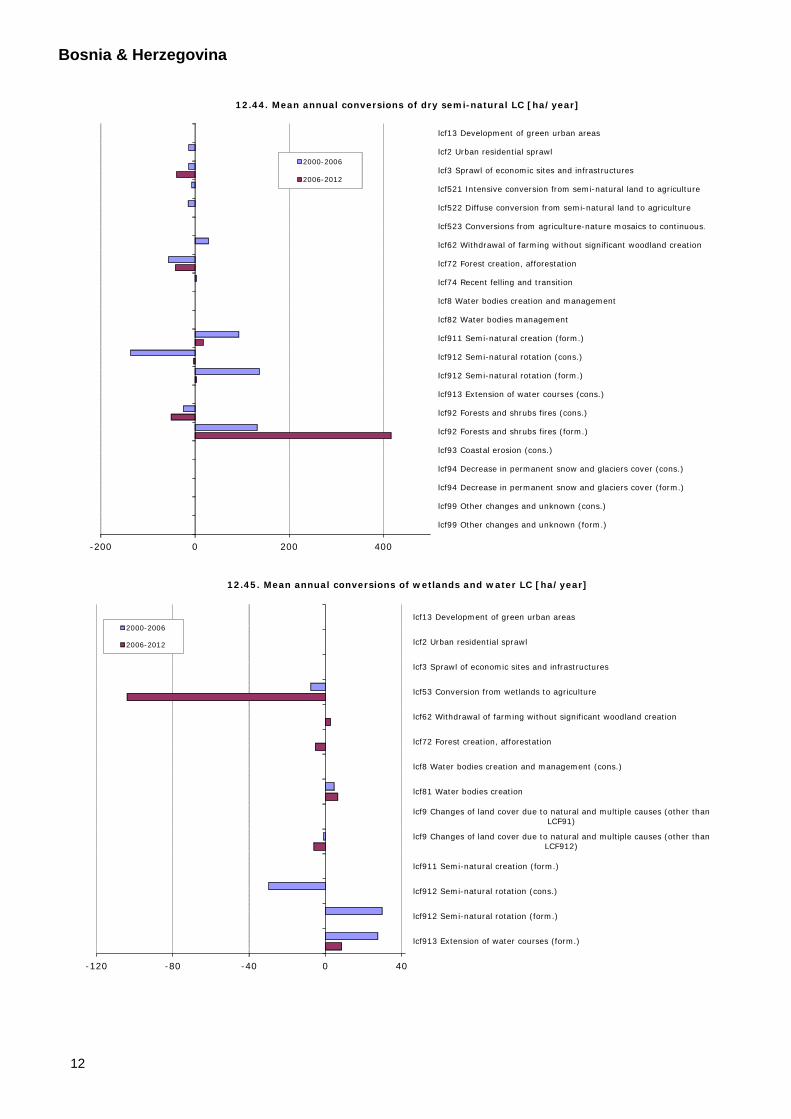
-200 0 200 400
lcf13 Development of green urban areas
lcf2 Urban residential sprawl
lcf3 Sprawl of economic sites and infrastructures
lcf521 Intensive conversion from semi-natural land to agriculture
lcf522 Diffuse conversion from semi-natural land to agriculture
lcf523 Conversions from agriculture-nature mosaics to continuous…
lcf62 Withdrawal of farming without significant woodland creation
lcf72 Forest creation, afforestation
lcf74 Recent felling and transition
lcf8 Water bodies creation and management
lcf82 Water bodies management
lcf911 Semi-natural creation (form.)
lcf912 Semi-natural rotation (cons.)
lcf912 Semi-natural rotation (form.)
lcf913 Extension of water courses (cons.)
lcf92 Forests and shrubs fires (cons.)
lcf92 Forests and shrubs fires (form.)
lcf93 Coastal erosion (cons.)
lcf94 Decrease in permanent snow and glaciers cover (cons.)
lcf94 Decrease in permanent snow and glaciers cover (form.)
lcf99 Other changes and unknown (cons.)
lcf99 Other changes and unknown (form.)
12.44. Mean annual conversions of dry semi-natural LC [ha/year]
2000-2006
2006-2012
-120 -80 -40 0 40
lcf13 Development of green urban areas
lcf2 Urban residential sprawl
lcf3 Sprawl of economic sites and infrastructures
lcf53 Conversion from wetlands to agriculture
lcf62 Withdrawal of farming without significant woodland creation
lcf72 Forest creation, afforestation
lcf8 Water bodies creation and management (cons.)
lcf81 Water bodies creation
lcf9 Changes of land cover due to natural and multiple causes (other thanLCF91)
lcf9 Changes of land cover due to natural and multiple causes (other thanLCF912)
lcf911 Semi-natural creation (form.)
lcf912 Semi-natural rotation (cons.)
lcf912 Semi-natural rotation (form.)
lcf913 Extension of water courses (form.)
12.45. Mean annual conversions of wetlands and water LC [ha/year]
2000-2006
2006-2012

Bosnia & Herzegovina
13
CLC Changes 2006-2012
CLC Changes 2000-2006

Bosnia & Herzegovina
14
Drivers of change 2006-2012
Drivers of change 2000-2006

Bosnia & Herzegovina
15
Artificial sprawl 2006-2012
Artificial sprawl 2000-2006

Bosnia & Herzegovina
16
Agriculture 2006-2012
Agriculture 2000-2006
Bosnia & Herzegovina
17
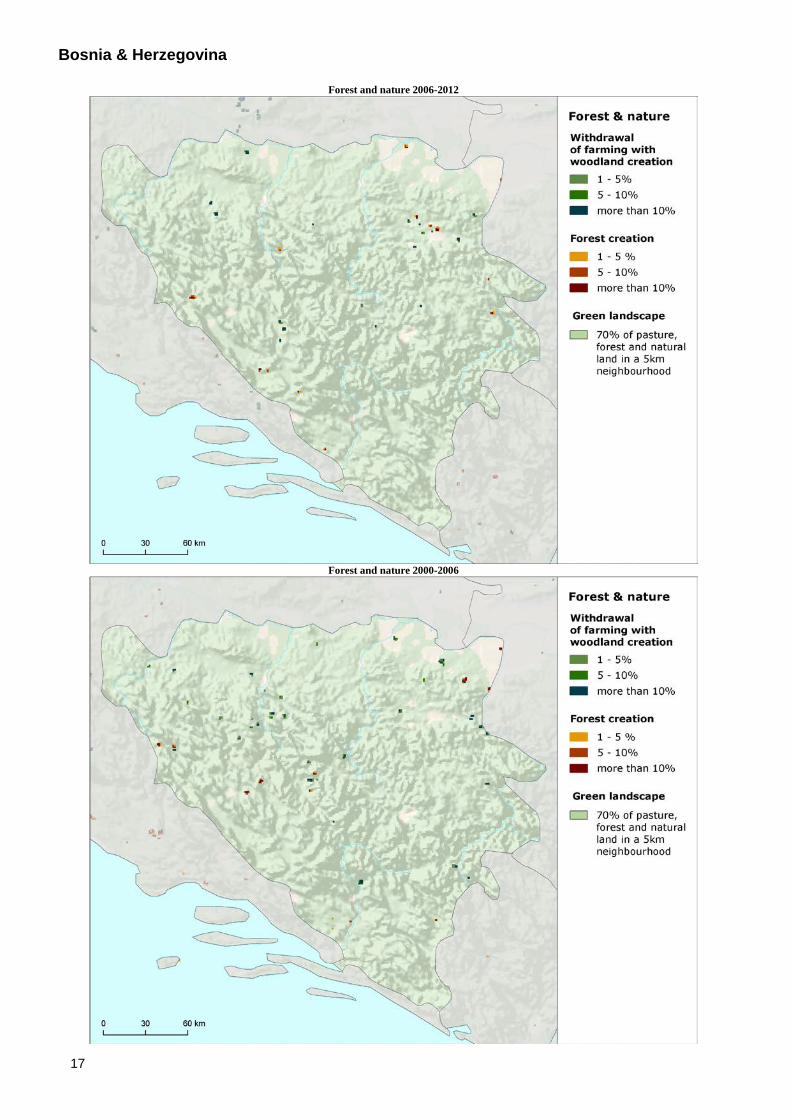
Forest and nature 2006-2012
Forest and nature 2000-2006