Embed Size (px)
Citation preview
BORDER MONITORING SITREP│ IOM HAITI TRACKING RETURNEES FROM THE DOMINICAN REPUBLIC
AUGUST 31, 2017
Graph 2: Monthly figures for official deportations from August 2015 to August 2017
724
3244
50424392
2461
4615
3893
44833776
2117
38503567
2575
3874
2321
16881918
34952584
2368
36304652
4600
6969
5488
0
1000
2000
3000
4000
5000
6000
7000
8000
Au
gust
-15
Au
gust
-15
Sep
tem
ber
-15
Oct
ob
er-1
5
Oct
ob
er-1
5
No
vem
ber
-15
Dec
emb
er-1
5
Dec
emb
er-1
5
Jan
uar
y-1
6
Feb
ruar
y-1
6
Feb
ruar
y-1
6
Mar
ch-1
6
Ap
ril-
16
Ap
ril-
16
May
-16
Jun
e-16
July
-16
July
-16
Au
gust
-16
Sep
tem
ber
-16
Sep
tem
ber
-16
Oct
ob
er-1
6
No
vem
ber
-16
No
vem
ber
-16
Dec
emb
er-1
6
Jan
uar
y-1
7
Jan
uar
y-1
7
Feb
ruar
y-1
7
Mar
ch-1
7
Ap
ril-
17
Ap
ril-
17
May
-17
Jun
e-17
Jun
e-17
July
-17
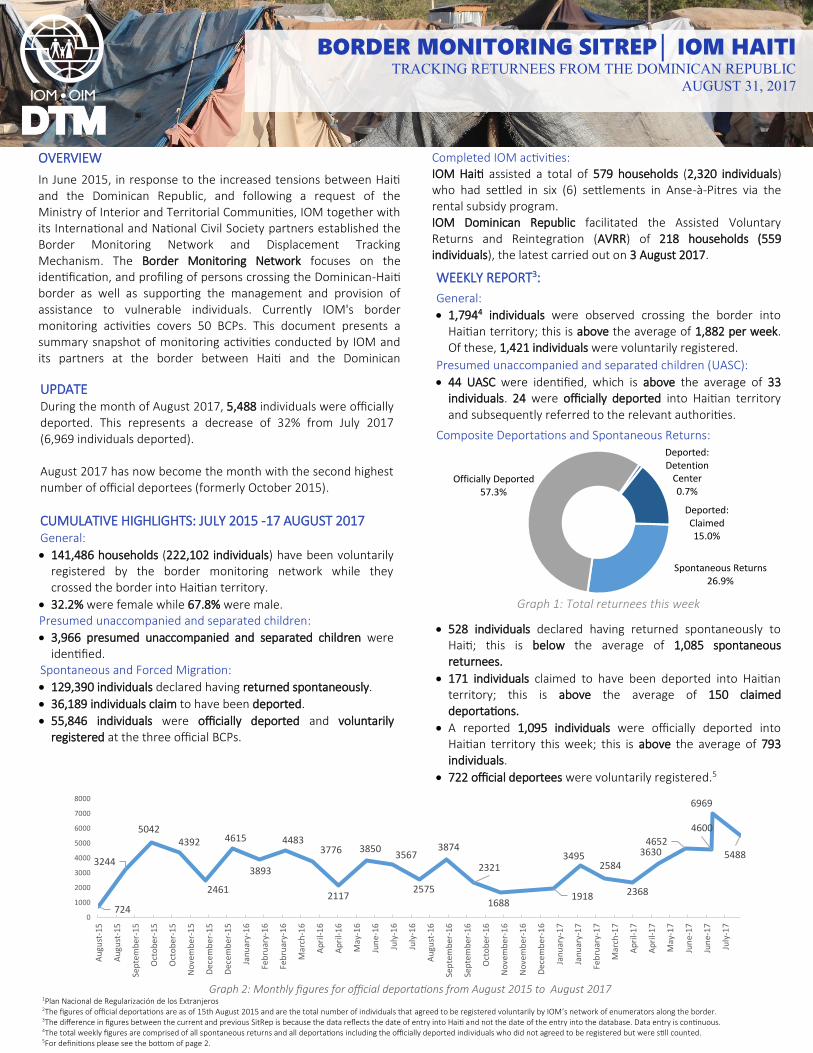
WEEKLY REPORT3:
General:
• 1,7944 individuals were observed crossing the border into Haitian territory; this is above the average of 1,882 per week. Of these, 1,421 individuals were voluntarily registered.
Presumed unaccompanied and separated children (UASC):
• 44 UASC were identified, which is above the average of 33 individuals. 24 were officially deported into Haitian territory and subsequently referred to the relevant authorities.
Composite Deportations and Spontaneous Returns:
Graph 1: Total returnees this week
• 528 individuals declared having returned spontaneously to Haiti; this is below the average of 1,085 spontaneous returnees.
• 171 individuals claimed to have been deported into Haitian territory; this is above the average of 150 claimed deportations.
• A reported 1,095 individuals were officially deported into Haitian territory this week; this is above the average of 793 individuals.
• 722 official deportees were voluntarily registered.5
Spontaneous Returns26.9%
Officially Deported57.3%
Deported: Detention
Center0.7%
Deported: Claimed15.0%
OVERVIEW
In June 2015, in response to the increased tensions between Haiti and the Dominican Republic, and following a request of the Ministry of Interior and Territorial Communities, IOM together with its International and National Civil Society partners established the Border Monitoring Network and Displacement Tracking Mechanism. The Border Monitoring Network focuses on the identification, and profiling of persons crossing the Dominican-Haiti border as well as supporting the management and provision of assistance to vulnerable individuals. Currently IOM's border monitoring activities covers 50 BCPs. This document presents a summary snapshot of monitoring activities conducted by IOM and its partners at the border between Haiti and the Dominican Republic (DR).
UPDATE During the month of August 2017, 5,488 individuals were officially deported. This represents a decrease of 32% from July 2017 (6,969 individuals deported). August 2017 has now become the month with the second highest number of official deportees (formerly October 2015).
CUMULATIVE HIGHLIGHTS: JULY 2015 -17 AUGUST 2017 General:
• 141,486 households (222,102 individuals) have been voluntarily registered by the border monitoring network while they crossed the border into Haitian territory.
• 32.2% were female while 67.8% were male. Presumed unaccompanied and separated children:
• 3,966 presumed unaccompanied and separated children were identified.
Spontaneous and Forced Migration:
• 129,390 individuals declared having returned spontaneously.
• 36,189 individuals claim to have been deported.
• 55,846 individuals were officially deported and voluntarily registered at the three official BCPs.
1Plan Nacional de Regularización de los Extranjeros 2The figures of official deportations are as of 15th August 2015 and are the total number of individuals that agreed to be registered voluntarily by IOM’s network of enumerators along the border. 3The difference in figures between the current and previous SitRep is because the data reflects the date of entry into Haiti and not the date of the entry into the database. Data entry is continuous.
4The total weekly figures are comprised of all spontaneous returns and all deportations including the officially deported individuals who did not agreed to be registered but were still counted. 5For definitions please see the bottom of page 2.
Completed IOM activities: IOM Haiti assisted a total of 579 households (2,320 individuals) who had settled in six (6) settlements in Anse-à-Pitres via the rental subsidy program. IOM Dominican Republic facilitated the Assisted Voluntary Returns and Reintegration (AVRR) of 218 households (559 individuals), the latest carried out on 3 August 2017.
2
BORDER MONITORING SITREP│ IOM HAITI TRACKING RETURNEES FROM THE DOMINICAN REPUBLIC
AUGUST 31, 2017
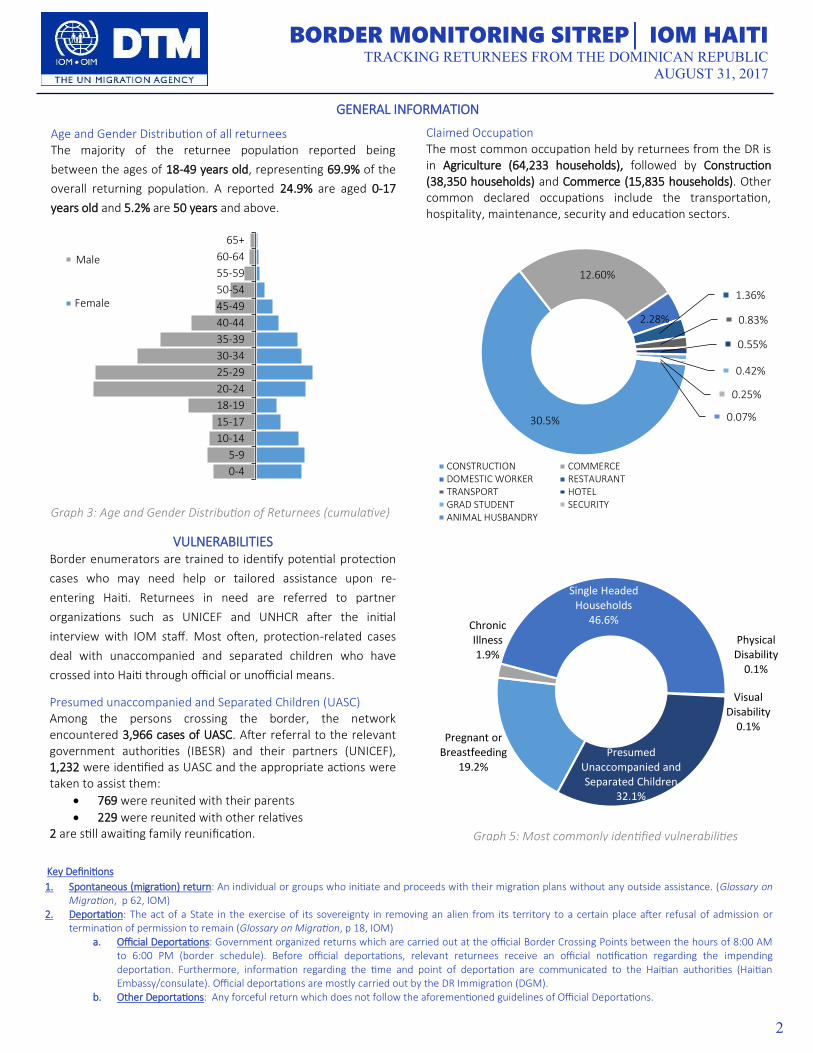
Age and Gender Distribution of all returnees The majority of the returnee population reported being
between the ages of 18-49 years old, representing 69.9% of the
overall returning population. A reported 24.9% are aged 0-17
years old and 5.2% are 50 years and above.
Graph 3: Age and Gender Distribution of Returnees (cumulative)
0-4
5-9
10-14
15-17
18-19
20-24
25-29
30-34
35-39
40-44
45-49
50-54
55-59
60-64
65+
Male2
Female
Claimed Occupation The most common occupation held by returnees from the DR is in Agriculture (64,233 households), followed by Construction (38,350 households) and Commerce (15,835 households). Other common declared occupations include the transportation, hospitality, maintenance, security and education sectors.
Graph 4: Claimed Occupations of Returnees
30.5%
12.60%
2.28%
1.36%
0.83%
0.55%
0.42%
0.25%
0.07%
CONSTRUCTION COMMERCEDOMESTIC WORKER RESTAURANTTRANSPORT HOTELGRAD STUDENT SECURITYANIMAL HUSBANDRY
GENERAL INFORMATION
VULNERABILITIES Border enumerators are trained to identify potential protection
cases who may need help or tailored assistance upon re-
entering Haiti. Returnees in need are referred to partner
organizations such as UNICEF and UNHCR after the initial
interview with IOM staff. Most often, protection-related cases
deal with unaccompanied and separated children who have
crossed into Haiti through official or unofficial means.
Presumed unaccompanied and Separated Children (UASC) Among the persons crossing the border, the network encountered 3,966 cases of UASC. After referral to the relevant government authorities (IBESR) and their partners (UNICEF), 1,232 were identified as UASC and the appropriate actions were taken to assist them:
• 769 were reunited with their parents
• 229 were reunited with other relatives 2 are still awaiting family reunification.
Graph 5: Most commonly identified vulnerabilities
Pregnant or Breastfeeding
19.2%
Chronic Illness1.9%
Single Headed Households
46.6%
Visual Disability
0.1%
Physical Disability
0.1%
Presumed Unaccompanied and Separated Children
32.1%
Key Definitions
1. Spontaneous (migration) return: An individual or groups who initiate and proceeds with their migration plans without any outside assistance. (Glossary on Migration, p 62, IOM)
2. Deportation: The act of a State in the exercise of its sovereignty in removing an alien from its territory to a certain place after refusal of admission or termination of permission to remain (Glossary on Migration, p 18, IOM)
a. Official Deportations: Government organized returns which are carried out at the official Border Crossing Points between the hours of 8:00 AM to 6:00 PM (border schedule). Before official deportations, relevant returnees receive an official notification regarding the impending deportation. Furthermore, information regarding the time and point of deportation are communicated to the Haitian authorities (Haitian Embassy/consulate). Official deportations are mostly carried out by the DR Immigration (DGM).
b. Other Deportations: Any forceful return which does not follow the aforementioned guidelines of Official Deportations.
Male
3
BORDER MONITORING SITREP│ IOM HAITI TRACKING RETURNEES FROM THE DOMINICAN REPUBLIC
AUGUST 31, 2017
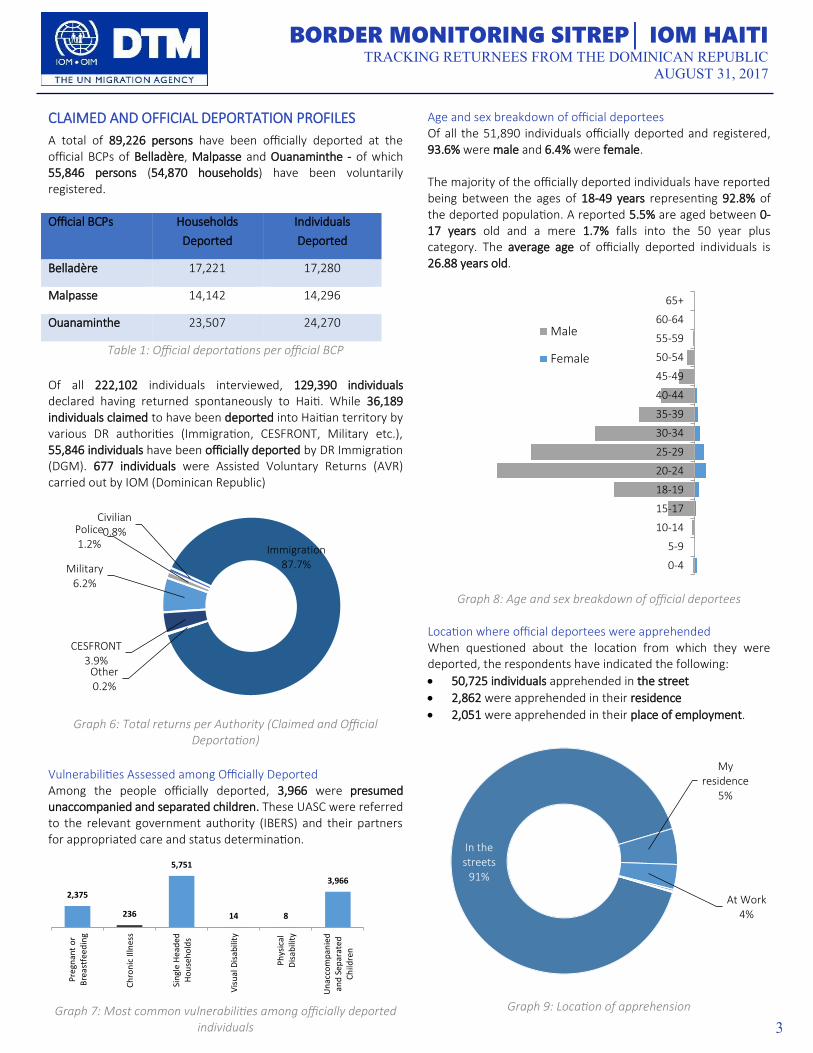
Age and sex breakdown of official deportees Of all the 51,890 individuals officially deported and registered, 93.6% were male and 6.4% were female. The majority of the officially deported individuals have reported being between the ages of 18-49 years representing 92.8% of the deported population. A reported 5.5% are aged between 0-17 years old and a mere 1.7% falls into the 50 year plus category. The average age of officially deported individuals is 26.88 years old.
Graph 8: Age and sex breakdown of official deportees
Location where official deportees were apprehended When questioned about the location from which they were deported, the respondents have indicated the following:
• 50,725 individuals apprehended in the street
• 2,862 were apprehended in their residence
• 2,051 were apprehended in their place of employment.
Graph 9: Location of apprehension
0-4
5-9
10-14
15-17
18-19
20-24
25-29
30-34
35-39
40-44
45-49
50-54
55-59
60-64
65+
Male
Female
In the streets
91%
My residence
5%
At Work4%
CLAIMED AND OFFICIAL DEPORTATION PROFILES
A total of 89,226 persons have been officially deported at the official BCPs of Belladère, Malpasse and Ouanaminthe - of which 55,846 persons (54,870 households) have been voluntarily registered. Official BCPs Households
Deported
Individuals
Deported
Belladère 17,221 17,280
Malpasse 14,142 14,296
Ouanaminthe 23,507 24,270
Table 1: Official deportations per official BCP
Of all 222,102 individuals interviewed, 129,390 individuals declared having returned spontaneously to Haiti. While 36,189 individuals claimed to have been deported into Haitian territory by various DR authorities (Immigration, CESFRONT, Military etc.), 55,846 individuals have been officially deported by DR Immigration (DGM). 677 individuals were Assisted Voluntary Returns (AVR) carried out by IOM (Dominican Republic)
Graph 6: Total returns per Authority (Claimed and Official Deportation)
Vulnerabilities Assessed among Officially Deported Among the people officially deported, 3,966 were presumed unaccompanied and separated children. These UASC were referred to the relevant government authority (IBERS) and their partners for appropriated care and status determination.
Graph 7: Most common vulnerabilities among officially deported individuals
Military 6.2%
Police 1.2%
Civilian 0.8%
Immigration 87.7%
Other 0.2%
CESFRONT 3.9%
2,375
236
5,751
14 8
3,966
Pre
gnan
t o
rB
reas
tfee
din
g
Ch
ron
ic Il
lnes
s
Sin
gle
Hea
ded
Ho
use
ho
lds
Vis
ual
Dis
abili
ty
Ph
ysic
alD
isab
ility
Un
acco
mp
anie
dan
d S
epar
ated
Ch
ildre
n

4
BORDER MONITORING SITREP│ IOM HAITI TRACKING RETURNEES FROM THE DOMINICAN REPUBLIC
AUGUST 31, 2017
Family in the DR:
Graph 12: Status of official deportees’ family in the DR
DOCUMENTATION
The majority 65.0% (144,396 individuals) did not possess any type of documentation. Of those in possession of some sort of document, 33.3% (73,959 individuals) reported having Haitian Documentation and 1.7% (3,747 individuals) reported having Dominican documentation.
Graph 13: Returnee Documentation Status
Types of documentation: The most common ID document returnees claim to possess continues to be the Haitian Birth Certificate, corresponding to 74.7% of the individuals with documentation. The second most common document is the Haitian ID (CIN or NIF) which represents 19.1%.
Graph 14: Types of documents
None49%
Children(s)5%
Spouse4%
Relatives41%
Parents1%
18.8%
7.1%
74.0%
0.1%
15.5%
34.8%
49.9%
0.4%
Deported: Other
Deported:Official
SpontaneousReturns
AssistedVoluntary Return
With ID With No ID
Haitian Passport
1.4%
Haitian ID19.1%
DR ID1.5%
Haitian Birth Certificate
74.7%
DR Passport0.4%
DR Birth Certificate
2.9%
INDIVIDUALS BORN IN THE DOMINICAN REPUBLIC
12,570 households (47,413 individuals) have at least one member who claims to have been born in the DR. Of these, 25,764 individuals claimed to have been born in the DR, and 15,029 were born before January 26th 2010, which means they fall under UNHCR's mandate. Of the 1,961 cases (5,807 individuals) verified by UNHCR, 2,710 individuals were placed within UNHCR’s care.
Graph 10: Age and sex breakdown of individuals born in the DR
FAMILY REMAINING IN THE DOMINICAN REPUBLIC 134,457 individuals indicated they still have family members remaining in the DR. Further questioning revealed of that 76% are Haitians without visa, 14.2% are Haitians with visa and 5.7 % are Dominican citizens or have a Resident status
Graph 11: Status of returnee’s family remaining in the DR
29,270 officially deported individuals registered indicated they
still have family members living in the DR. They have indicated
the following:
• 23,921 have relatives remaining
• 2,624 have children (daughter/son) remaining in DR
• 2,136 have their spouse (husband/wife) still in DR
0-4
5-9
10-14
15-17
18-19
20-24
25-29
30-34
35-39
40-44
45-49
50-54
55-59
60-64
65+
Males Female
Unknown4.0%
With Visa14.2%
Resident/ Citizen5.7%
Without Visa
76.0%
5
BORDER MONITORING SITREP│ IOM HAITI TRACKING RETURNEES FROM THE DOMINICAN REPUBLIC
AUGUST 31, 2017
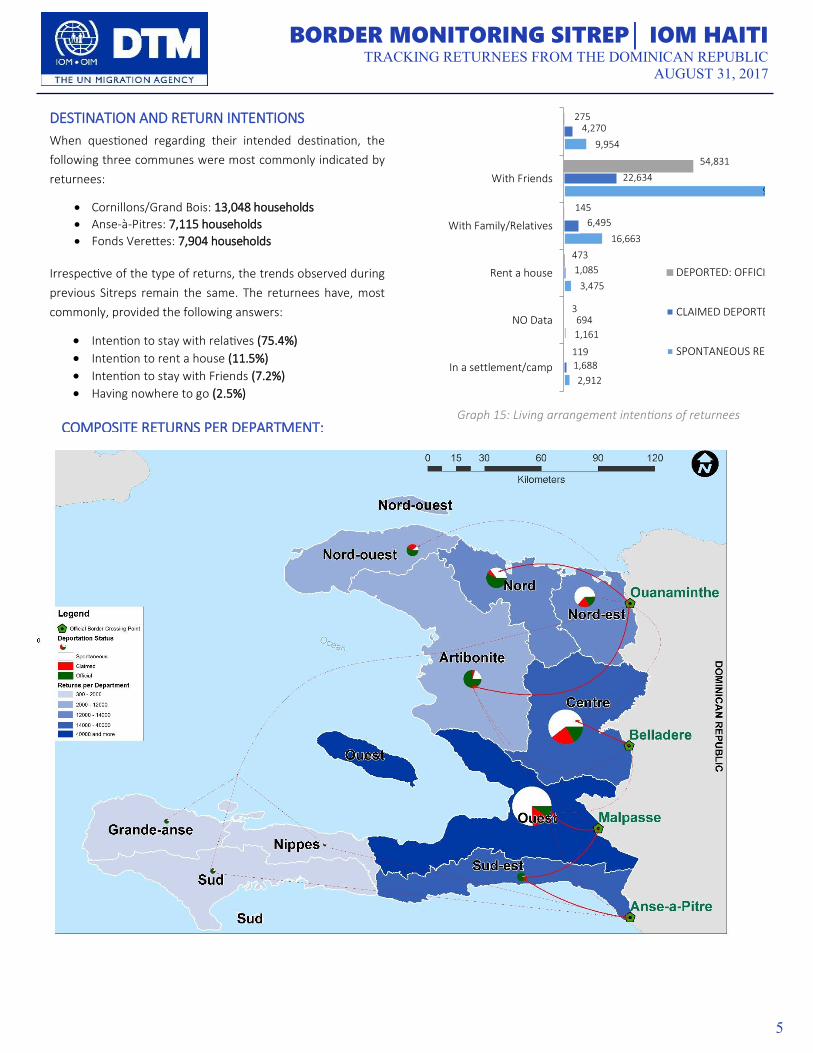
DESTINATION AND RETURN INTENTIONS
When questioned regarding their intended destination, the
following three communes were most commonly indicated by
returnees:
• Cornillons/Grand Bois: 13,048 households
• Anse-à-Pitres: 7,115 households
• Fonds Verettes: 7,904 households
Irrespective of the type of returns, the trends observed during
previous Sitreps remain the same. The returnees have, most
commonly, provided the following answers:
• Intention to stay with relatives (75.4%)
• Intention to rent a house (11.5%)
• Intention to stay with Friends (7.2%)
• Having nowhere to go (2.5%)
COMPOSITE RETURNS PER DEPARTMENT:
Graph 15: Living arrangement intentions of returnees
2,912
1,161
3,475
16,663
95,225
9,954
1,688
694
1,085
6,495
22,634
4,270
119
3
473
145
54,831
275
In a settlement/camp
NO Data
Rent a house
With Family/Relatives
With Friends
DEPORTED: OFFICIAL
CLAIMED DEPORTED
SPONTANEOUS RETURNS
6
BORDER MONITORING SITREP│ IOM HAITI TRACKING RETURNEES FROM THE DOMINICAN REPUBLIC
AUGUST 31, 2017
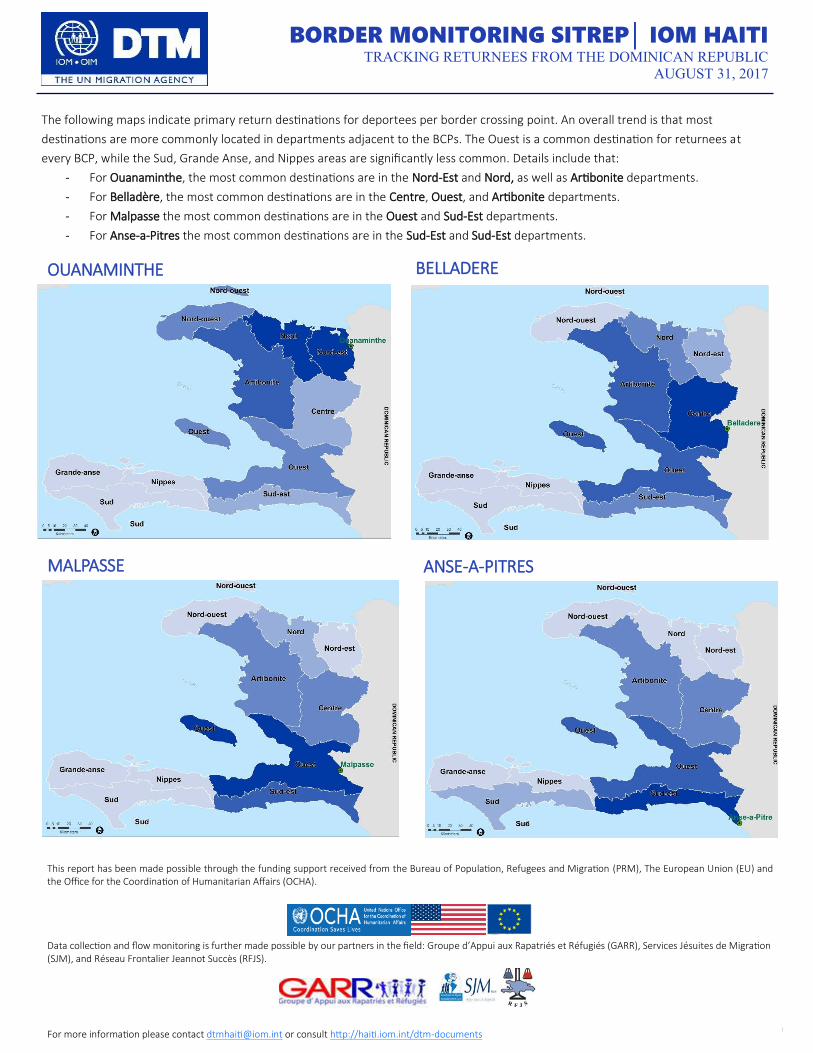
The following maps indicate primary return destinations for deportees per border crossing point. An overall trend is that most
destinations are more commonly located in departments adjacent to the BCPs. The Ouest is a common destination for returnees at
every BCP, while the Sud, Grande Anse, and Nippes areas are significantly less common. Details include that:
- For Ouanaminthe, the most common destinations are in the Nord-Est and Nord, as well as Artibonite departments.
- For Belladère, the most common destinations are in the Centre, Ouest, and Artibonite departments.
- For Malpasse the most common destinations are in the Ouest and Sud-Est departments.
- For Anse-a-Pitres the most common destinations are in the Sud-Est and Sud-Est departments.
This report has been made possible through the funding support received from the Bureau of Population, Refugees and Migration (PRM), The European Union (EU) and the Office for the Coordination of Humanitarian Affairs (OCHA).
Data collection and flow monitoring is further made possible by our partners in the field: Groupe d’Appui aux Rapatriés et Réfugiés (GARR), Services Jésuites de Migration (SJM), and Réseau Frontalier Jeannot Succès (RFJS).
For more information please contact [email protected] or consult http://haiti.iom.int/dtm-documents
OUANAMINTHE BELLADERE
MALPASSE ANSE-A-PITRES