Embed Size (px)
Citation preview
Leslie Van Alstine
May 21, 2019
Bootstrap approach for dissolution similarity testing, performance and limitations
Introduction
Outline:
• Use of the f2 for dissolution profile similarity testing and the issue with large within batch (unit-to-unit) variability
• Introduction to bootstrapping as a statistical technique
• Applications of bootstrapping for dissolution profile similarity testing
• Summary of Pros/Cons of using bootstrapping
Dissolution Profile Similarity Comparison
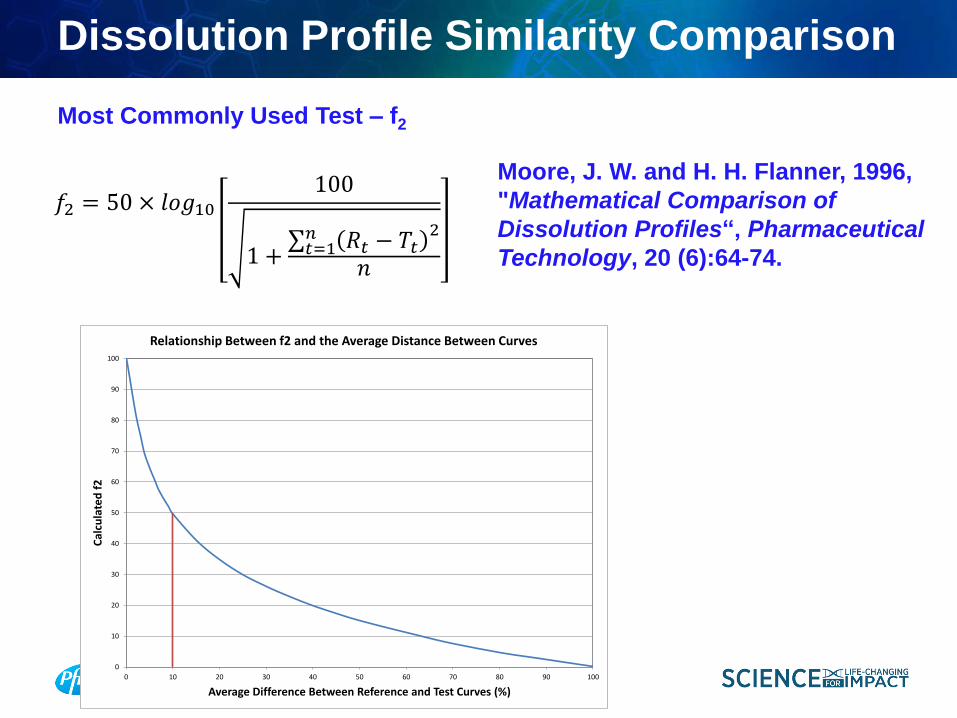
Moore, J. W. and H. H. Flanner, 1996,
"Mathematical Comparison of
Dissolution Profiles“, Pharmaceutical
Technology, 20 (6):64-74.
𝑓2 = 50 × 𝑙𝑜𝑔10100
1 +σ𝑡=1𝑛 𝑅𝑡 − 𝑇𝑡
2
𝑛
0
10
20
30
40
50
60
70
80
90
100
0 10 20 30 40 50 60 70 80 90 100
Cal
cula
ted
f2
Average Difference Between Reference and Test Curves (%)
Relationship Between f2 and the Average Distance Between Curves
Most Commonly Used Test – f2

Dissolution Profile Similarity Comparison
Shortly after Moore and Flanner published their
article, it was suggested that the f2 statistic
might be problematic when the within batch
variability was high due to there being too
much uncertainty in the estimates of the
means.
𝑓2 = 50 × 𝑙𝑜𝑔10100
1 +σ𝑡=1𝑛 𝑅𝑡 − 𝑇𝑡
2
𝑛
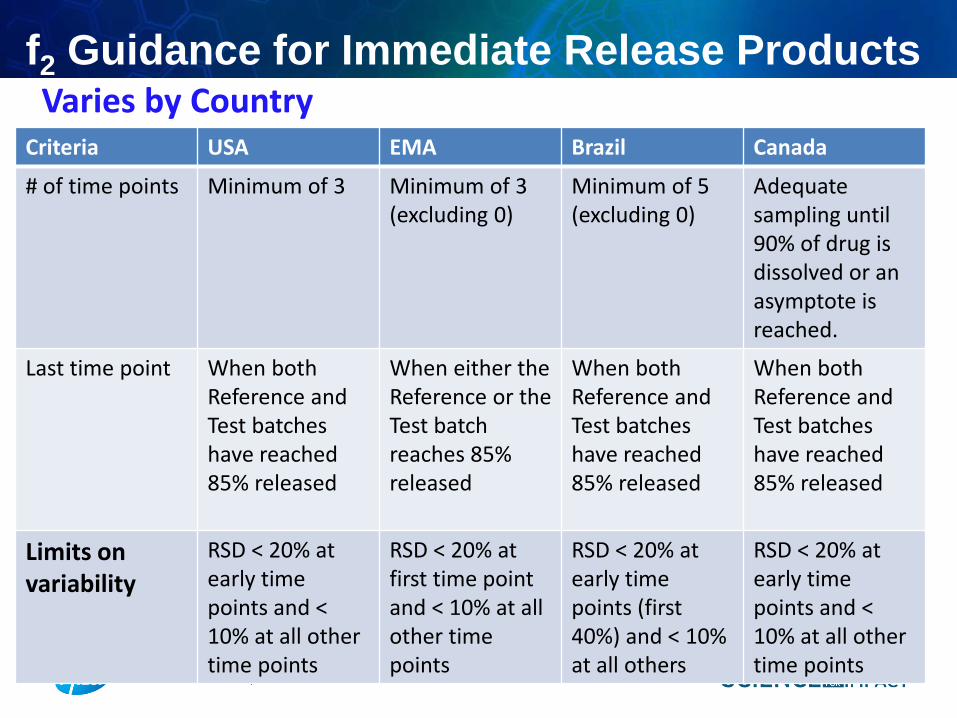
Criteria USA EMA Brazil Canada
# of time points Minimum of 3 Minimum of 3 (excluding 0)
Minimum of 5 (excluding 0)
Adequate sampling until 90% of drug is dissolved or an asymptote is reached.
Last time point When both Reference and Test batches have reached 85% released
When either the Reference or the Test batch reaches 85% released
When both Reference and Test batches have reached 85% released
When both Reference and Test batches have reached 85% released
Limits on variability
RSD < 20% at early time points and < 10% at all other time points
RSD < 20% at first time point and < 10% at all other time points
RSD < 20% at early time points (first 40%) and < 10% at all others
RSD < 20% at early time points and < 10% at all other time points
f2 Guidance for Immediate Release ProductsVaries by Country
Alternatives to f2 when variability criteria not met
Bootstrapping as an alternative does not appear in any of the regulatory guidances.
Shah, V.P., Y. Tsong, P. Sathe and J.P. Liu, 1998, “In Vitro Dissolution Profile Comparison – Statistics and Analysis of the Similarity Factor, f2”, Pharmaceutical Research, Vol. 15, No. 6, pp 889-896.
• Bootstrapping is a statistical technique for generating an
estimate of the sampling distribution of a statistic that was
introduced by Bradley Efron in 1979 (“Bootstrap
Methods: Another Look at the Jacknife”; The Annals of
Statistics, Vol. 7, No. 1, pp 1-26.)
• Technique based on using available data to resample
from the data with replacement to generate the sampling
distribution of a statistic where the theoretical distribution
is complex or unknown
Bootstrapped f2 – generate distribution of f2 values based
on observed data; if lower 5th percentile is greater than 50 –
declare similarity
Bootstrapping

Bootstrap Example – Confidence Interval for Sample Mean
1050-5
Median
Mean
3210-1-2
1st Quartile -3.30635
Median 0.05173
3rd Quartile 2.42906
Maximum 9.52552
-1.79365 2.21047
-2.14477 2.32930
3.68498 6.65087
A-Squared 0.27
P-Value 0.645
Mean 0.20841
StDev 4.74127
Variance 22.47965
Skewness 0.125455
Kurtosis -0.404760
N 24
Minimum -7.88222
Anderson-Darling Normality Test
95% Confidence Interval for Mean
95% Confidence Interval for Median
95% Confidence Interval for StDev95% Confidence Intervals
Original n=24 Generated From Normal (0,5)
A random sample of 24
observations are taken from
a Normal distribution with
mean 0 and a standard
deviation of 5.
Want to construct a 95%
confidence interval about
the mean
To construct a bootstrapped
confidence interval for the
mean. • Sample 24 observations
with replacement from the
original data set.
• Calculate the average for
each random sample
• Do many times
BS10BS9BS8BS7BS6BS5BS4BS3BS2BS1Orig
15
10
5
0
-5
-10
-15
Sample Set
Da
ta V
alu
es
Individual Value Plot of Original Data and 10 Subsamples Done With Replacement
-0.63 1.58 -1.44 -0.01 -0.50 0.94 -0.54 -1.05 -2.38 -0.24
3210-1-2-3
Mean
Distribution of Averages From First 10 Bootstrap Samples
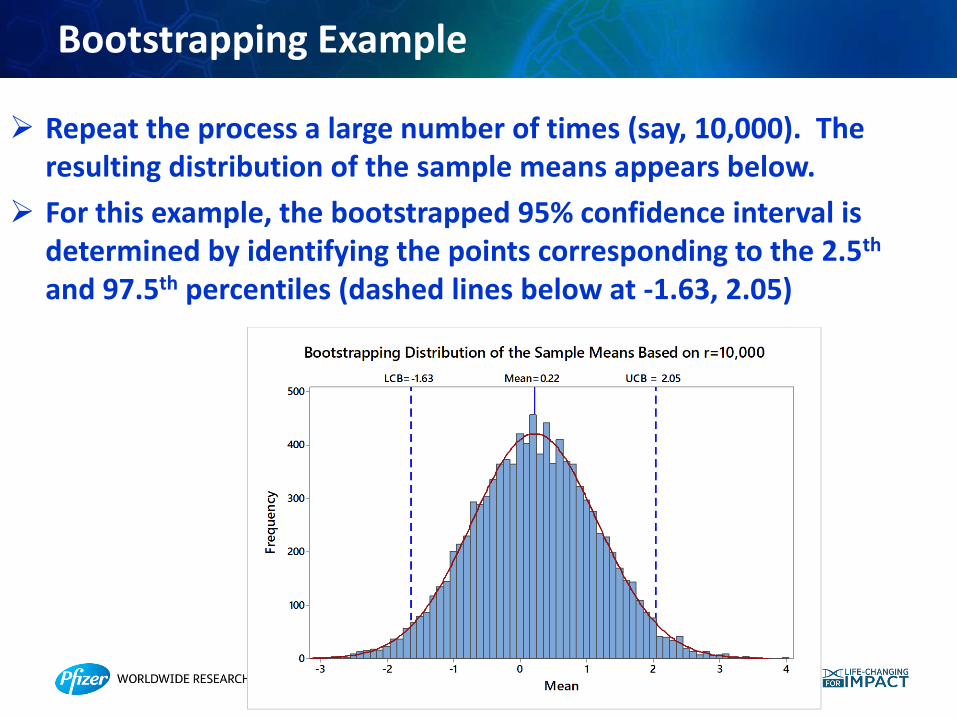
Bootstrapping Example
Repeat the process a large number of times (say, 10,000). The resulting distribution of the sample means appears below.
For this example, the bootstrapped 95% confidence interval is determined by identifying the points corresponding to the 2.5th
and 97.5th percentiles (dashed lines below at -1.63, 2.05)
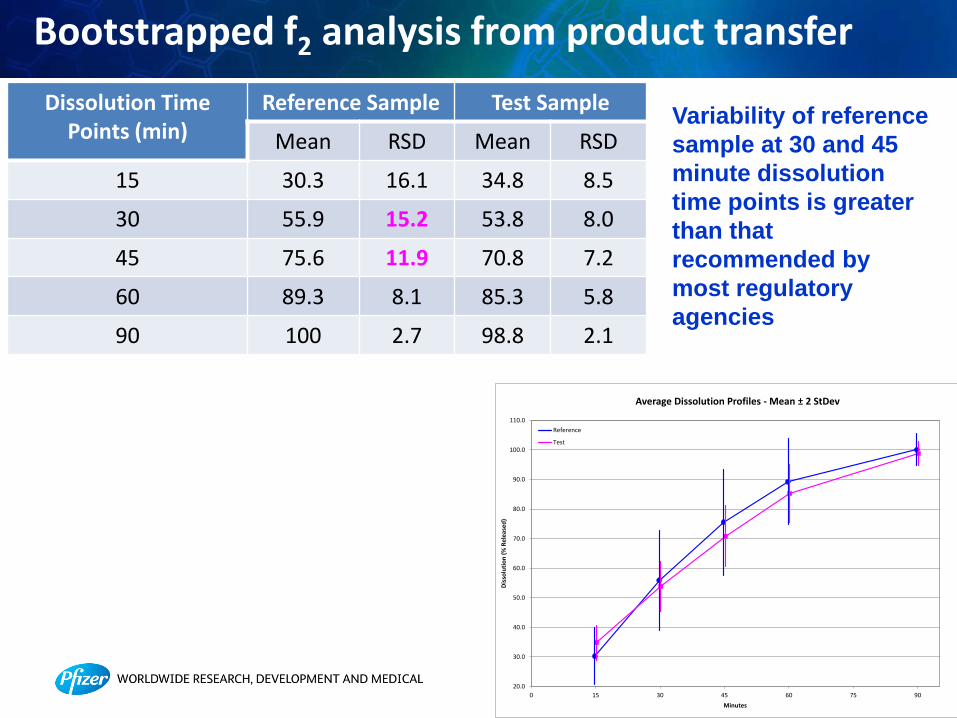
Bootstrapped f2 analysis from product transfer
Dissolution Time Points (min)
Reference Sample Test Sample
Mean RSD Mean RSD
15 30.3 16.1 34.8 8.5
30 55.9 15.2 53.8 8.0
45 75.6 11.9 70.8 7.2
60 89.3 8.1 85.3 5.8
90 100 2.7 98.8 2.1
Variability of reference
sample at 30 and 45
minute dissolution
time points is greater
than that
recommended by
most regulatory
agencies
20.0
30.0
40.0
50.0
60.0
70.0
80.0
90.0
100.0
110.0
0 15 30 45 60 75 90
Dis
solu
tio
n (
% R
ele
ase
d)
Minutes
Average Dissolution Profiles - Mean ± 2 StDev
Reference
Test
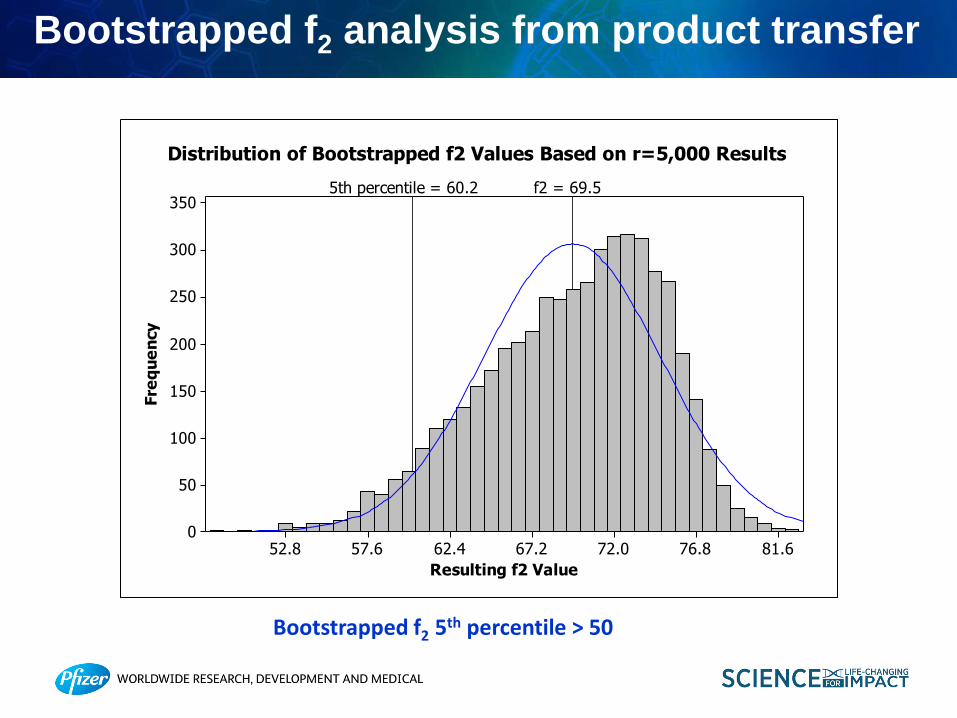
Bootstrapped f2 analysis from product transfer
81.676.872.067.262.457.652.8
350
300
250
200
150
100
50
0
Resulting f2 Value
Fre
qu
en
cy
f2 = 69.55th percentile = 60.2
Distribution of Bootstrapped f2 Values Based on r=5,000 Results
Bootstrapped f2 5th percentile > 50
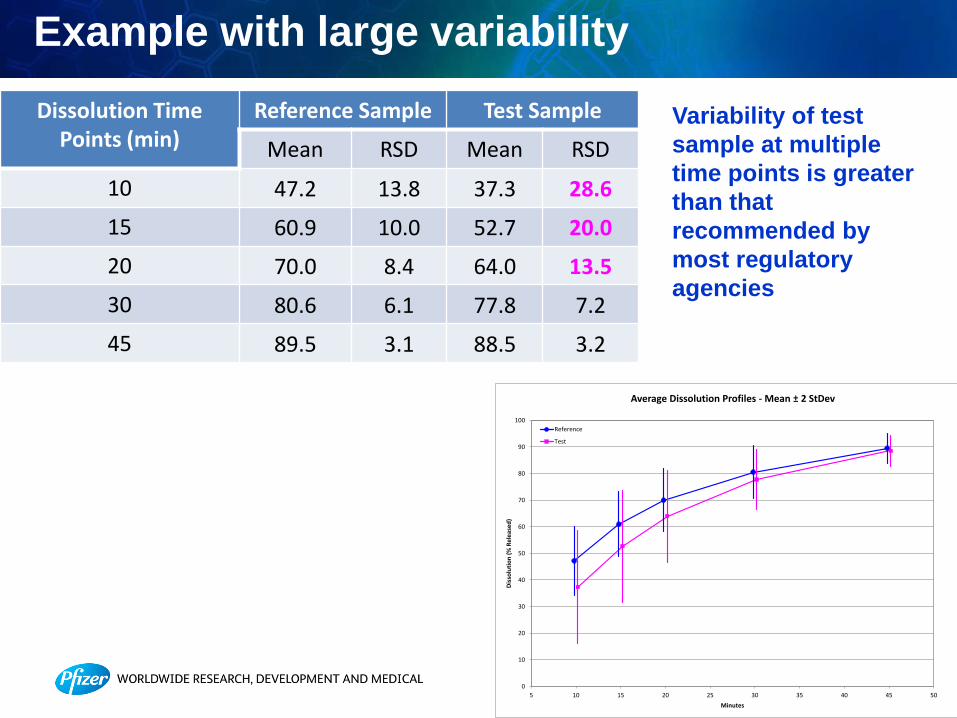
Example with large variability
Variability of test
sample at multiple
time points is greater
than that
recommended by
most regulatory
agencies
Dissolution Time Points (min)
Reference Sample Test Sample
Mean RSD Mean RSD
10 47.2 13.8 37.3 28.6
15 60.9 10.0 52.7 20.0
20 70.0 8.4 64.0 13.5
30 80.6 6.1 77.8 7.2
45 89.5 3.1 88.5 3.2
0
10
20
30
40
50
60
70
80
90
100
5 10 15 20 25 30 35 40 45 50
Dis
solu
tio
n (
% R
ele
ase
d)
Minutes
Average Dissolution Profiles - Mean ± 2 StDev
Reference
Test
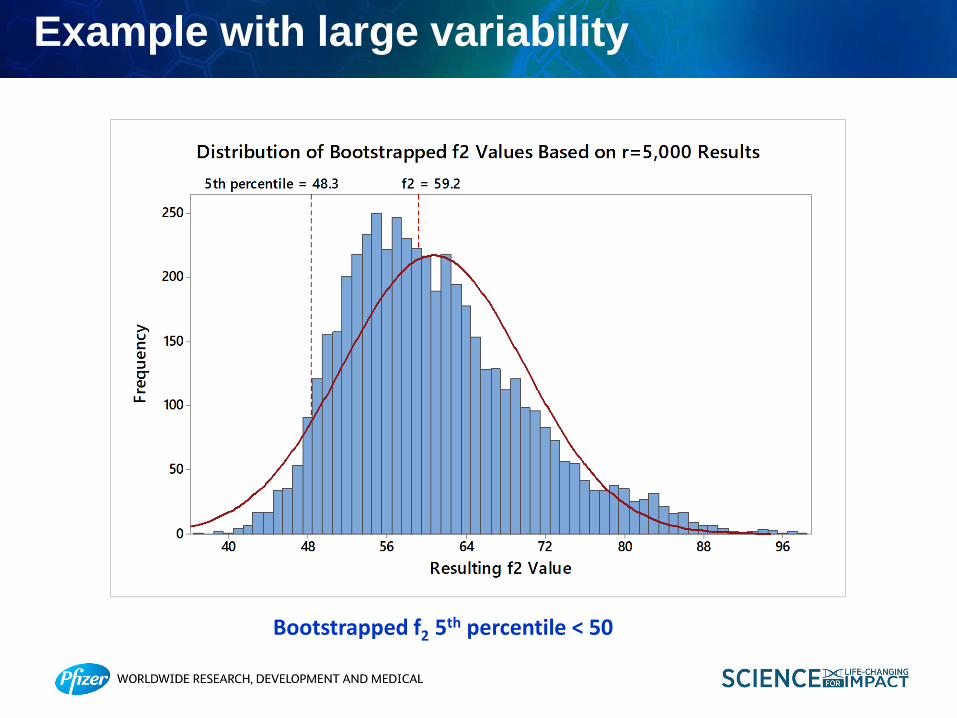
Example with large variability
Bootstrapped f2 5th percentile < 50

Summary – Bootstrapped f2 analysis
Bootstrapped f2 – is a statistically acceptable and valuable approach for comparing dissolution profiles
Pros:
– well understood technique which has been around for a long time
– provides a simple answer which most people can conceptualize
– does not require any distributional assumptions
– software is available for doing the simulations (DDSolver)
Summary – Bootstrapped f2 analysis
Bootstrapped f2 – is a statistically acceptable and valuable approach for comparing dissolution profiles
Cons:
– does not address issues of biorelevance that apply to the f2
– not clear what rules should apply to time point selection
– while software is available, some can be complex for non-statisticians
– may be conservative???
Conclusion
Thank you!
Any Questions?


![User profile correlation-based similarity (UPCSim) algorithm ......collaborative ltering similarity [29], the Triangle Multiplying Jaccard (TMJ) similarity [30], and the similarity](https://img.dokumen.tips/doc/110x75/6147013af4263007b1358a2c/user-profile-correlation-based-similarity-upcsim-algorithm-collaborative.jpg)