Embed Size (px)
DESCRIPTION
Detecting what other traders thinking & doing!
Citation preview

Investor Education Book Series by TraderPlanet.com
How to Read
Detecting What Other Traders Are Thinking and Doing
THE TRADING CROWD
by Jim Wyckoff
AS A MEMBER, YOU'LL ENJOY:
Daily Market Commentaries
Educational Articles
Charts and Market Quotes
Headline News
Trading Contests
eBook Library
Blogs and Forums
Live Chat
Videos and Audio Podcasts
and much, much more
THE TRADERS’COMMUNIT Y YOU’VE BEEN WAITING FORH A S F I N A L LY A R R I V E D
THE TRADERS’COMMUNIT Y YOU’VE BEEN WAITING FORH A S F I N A L LY A R R I V E D
For Free Collection of Trading E-books, register at www.TraderPlanet.com/freebooks
TraderPlanet.com is the world's coolest social network built exclusively for traders.
We're building a community where people who have common interests in trading worldwide markets can come together and share resources, embrace new friendships, and make charitable
Be adventurous and explore TraderPlanet for yourself!
send you a FREE collection of trading e-books immediately upon registration. (Limited time only)
NEW

How to Read THE TRADING CROWD Detecting What Other Traders Are Thinking and Doing Intro Most books that deal with trading psychology tend to be about the individual trader’s mental approach to markets and how the trader can work on developing skills to cope with emotions like fear, greed and hope. There is certainly plenty of material to consider, and all of it is important in helping traders master themselves before they try to master the markets. But what about the market as a whole? We know markets reflect thousands of individual opinions and that the current price is the collective result of all those opinions. We know how difficult it often is to gauge our own emotional reactions to price action, but if we have a trading plan and the discipline to follow it, we have some control over what we do. But what will everyone else do? How can we look at the mass psychology of the whole trading crowd and decipher where human behavior might take the market next? The answer, of course, is that no one ever knows exactly what the crowd will do or where prices will go in the future. But there are some ways to gain some insights into what the crowd may be thinking and how they might respond to developments based on how human beings have acted in similar situations in the past. The price chart itself is probably the biggest source of clues as prices leave their tracks in patterns that technical analysts try to interpret to get a view of potential future price action. But a chart is not the only tool traders can consult to analyze the crowd’s reactions and market directions. This e-book looks at various means that analysts use to get a reading on what the trading crowd is thinking and where it may take prices. Summary This e-book looks at various means that analysts use to get a reading on what the trading crowd is thinking and where it may take prices. This includes chapters on:
• ‘Behavioral finance’ and technical analysis
• Making ‘contrary opinion’ work for you
• Measuring market ‘noise’
1
Most books that deal with trading psychology tend to be about the individual trader’s mental approach to markets and how the trader can work on developing skills to cope with emotions like fear, greed and hope. There is certainly plenty of material to consider, and all of it is important in helping traders master themselves before they try to master the markets. But what about the market as a whole? We know markets reflect thousands of individual opinions and that the current price is the collective result of all those opinions. We know how difficult it often is to gauge our own emotional reactions to price action, but if we have a trading plan and the discipline to follow it, we have some control over what we do. But what will everyone else do? How can we look at the mass psychology of the whole trading crowd and decipher where human behavior might take the market next? The answer, of course, is that no one ever knows exactly what the crowd will do or where prices will go in the future. But there are some ways to gain some insights into what the crowd may be thinking and how they might respond to developments based on how human beings have acted in similar situations in the past. The price chart itself is probably the biggest source of clues as prices leave their tracks in patterns that technical analysts try to interpret to get a view of potential future price action. But a chart is not the only tool traders can consult to analyze the crowd’s reactions and market directions. This e-book looks at various means that analysts use to get a reading on what the trading crowd is thinking and where it may take prices. Bio Jim Wyckoff, a senior market analyst at www.TraderPlanet.com and the proprietor of an analytical, educational, and trading advisory service, "Jim Wyckoff on the Markets," is into his third decade of involvement with the stock, financial and commodity futures markets. As a financial journalist with Futures World News for many years, he spent day after day reporting from the futures trading floors in Chicago, New York and abroad. At one time or another, Jim has covered every futures market traded in the United States and several overseas. Born, raised, and still residing in Iowa, Jim loves adventures, from driving a Jeep across the highest mountain pass in the continental U.S. to extreme winter camping in the Boundary Waters Wilderness in Minnesota to hiking the jungles of South America.
2

‘Behavioral finance’ and technical analysis Hank Pruden, a professor in the School of Business at Golden Gate University in San Francisco, has a theory of “behavioral finance” that proposes that human flaws are consistent, measurable and predictable and that being aware of and utilizing this phenomenon can benefit a trader. According to Pruden, behavioral finance is “the use of psychology, sociology and other behavioral theories to explain and predict financial markets. Behavioral finance describes the behavior of investors and money managers and their interaction in companies and securities markets. It recognizes the roles of varying attitudes toward risk-framing of information, cognitive errors, lack of self-control, regret in financial decision-making and the influence of mass or herd psychology.” Traders often hear about “tulip mania,” the “South Sea bubble” and other similar events where traders have followed the crowd to send prices to extreme levels. You might add the technology dot.com bubble of the late 1990s or the more recent housing bubble to the list of those events where traders got carried away with higher and higher prices. Everyone wanted to be part of the action – the “crowd psychology” or “bandwagon” theory. The same type of crowd response applies to price action on a smaller scale, too. For example, when a market is coming up from a basing area on the charts, “smart money” is responsible for the majority of the initial buying. “As people jump on board, we see the bandwagon effect, and that bandwagon pushes prices up,” Pruden explains. “Volume tends to surge at its peak, certainly on the buy side, during the mark-up phase in the middle. Later, toward the end of the trend, smart money is not doing the buying; somebody else is. The smart money is doing the selling. The market tops by rolling over or sometimes with a spike top. We can see the crowd impact expressed in price and in volume.” Just think about what happens among professional traders when the stock market goes up even when the fundamentals don’t provide much support for such a move. Prices often rise because institutional money managers feel pressured to follow the crowd and chase performance. How can they explain why their results are below the industry benchmarks if they don’t go with the crowd and buy the stocks everyone else has in their portfolios? That rationale alone can drive markets higher than they “should” go. Putting time, price and sentiment together can provide a composite look at a market that will help in any trading decision.
3
What volume, open interest suggest Volume and open interest reported by the exchanges are significant factors to monitor when trading futures for several reasons. First, let's define the two terms. Volume is the number of transactions in a futures or options on futures contract made during a specified period of time. One buy and one sell equal two decisions but one trade or transaction and a volume of one. Volume is usually recorded for one trading session. Open interest is the total number of futures or options on futures contracts that have not yet been offset or fulfilled by delivery. It is an indicator of the depth or liquidity of a futures market, which influences the ability to buy or sell at or near a given price. Open interest can be a tricky concept, especially for beginners. In a nutshell, here's how open interest is calculated: If a new buyer (a long) and new seller (a short) enter a trade, open interest increases by one. However, if a trader already holding a long position sells to a new trader wanting to initiate a long position, open interest remains the same. And if a trader holding a long position sells to a trader wanting to get rid of his existing short position, open interest decreases by one. You will want to exercise extra caution when attempting to trade a market with very low volume and open interest – in other words, an illiquid market. Good and timely fills (order execution) may be hard to obtain. Also, markets with lots of liquidity are less likely to be manipulated by traders. Reinforcing indicators Most veteran futures traders agree that volume and open interest are "secondary" technical indicators that help confirm other technical signals on the charts. That means traders won't base their trading decisions solely on volume or open interest figures but will instead use them in conjunction with other technical signals or to help confirm signals. For example, if there is a big upside price breakout that is accompanied by heavy volume, then that only makes the upside move a stronger trading signal. Also, a big upside move or a move to a new high that is accompanied by light volume makes the move suspect. Big price moves (up or down) accompanied by heavy volume are powerful trading signals. If prices score a new high or new low on lighter volume, then that is an indication a top or bottom may be near or in place. Also, if volume increases on price moves against the existing trend, then that trend may be nearing an end. This is called divergence. As a general rule, volume should increase as a trend develops. In an uptrend, volume should be heavier on up days and lighter on down days within the trend. In a downtrend, volume should be heavier on down days and lighter on up days to reinforce the direction of the trend. The VantagePoint sugar futures chart below shows examples of volume hitting new highs as the market stages a breakout (left red circle) and then increases sharply as prices take off in an
4

accelerated uptrend (right circles).
www.tradertech.com Open interest insights Changes in open interest also can be used to help confirm other technical signals. Open interest can help the trader gauge how much new money is flowing into a market or if money is flowing out of a market. This is helpful when looking at a trending market. Another general trading rule is that if volume and open interest are increasing, then the trend will probably continue in its present direction, either up or down. If volume and open interest are declining, this can be interpreted as a signal that the current trend may be about to end. Open interest has seasonal tendencies in many markets – higher at some times of the year and lower at other times. The seasonal average of the open interest is important in analyzing open interest figures. If prices are rising in an uptrend and total open interest is increasing more than a five-year seasonal average, new money is considered to be flowing into the market, indicating aggressive new buying, which is bullish.
5

However, if prices are rising and open interest is falling by more than its seasonal average, the rally is being caused by the holders of losing short positions liquidating (short-covering) and money is leaving the market. This is usually bearish, as the rally will likely fizzle. The same holds true in a downtrend. Open interest increasing more than its seasonal average on the downmove means new aggressive sellers are entering the market, and this is bearish. But if open interest is declining more than the seasonal average on the downmove, then it's likely that holders of long positions are liquidating their losing trades (long liquidation), and the downtrend may be near an end. Here are two more rules for open interest: Very high open interest at market tops can cause a steep and quick price downturn, and open interest that is building up during a consolidation, or "basing" period, can strengthen the price breakout when it happens.
6
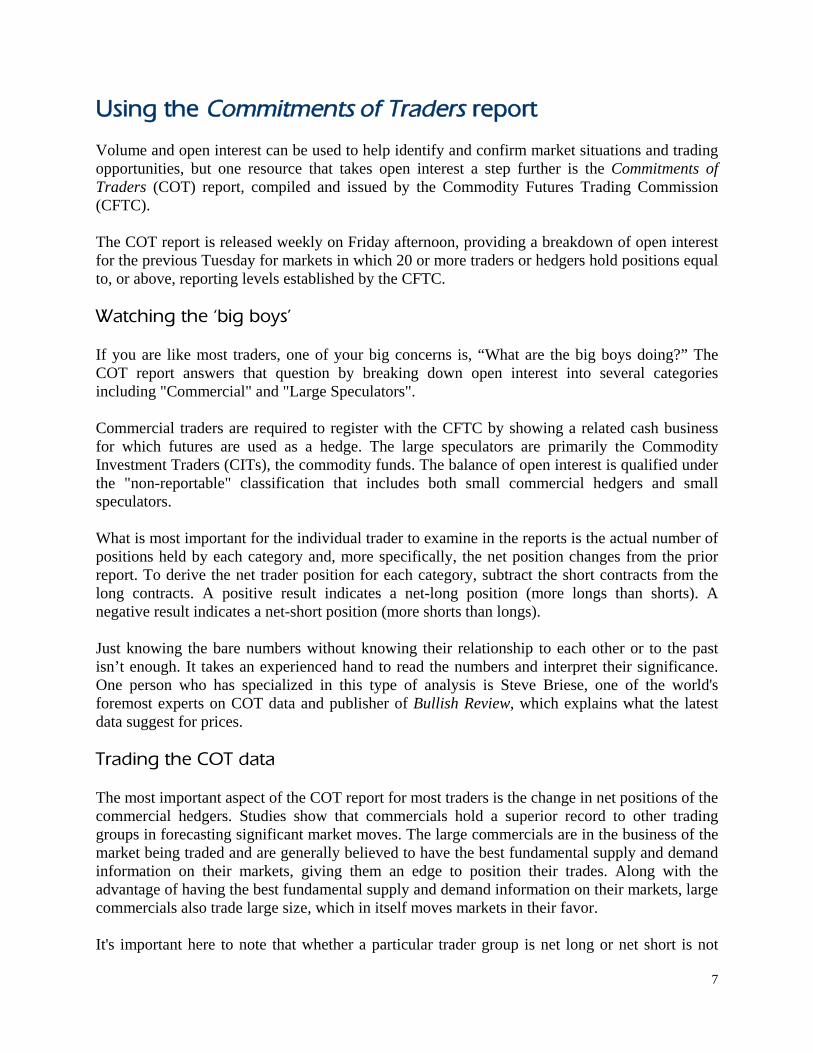
Using the Commitments of Traders report Volume and open interest can be used to help identify and confirm market situations and trading opportunities, but one resource that takes open interest a step further is the Commitments of Traders (COT) report, compiled and issued by the Commodity Futures Trading Commission (CFTC). The COT report is released weekly on Friday afternoon, providing a breakdown of open interest for the previous Tuesday for markets in which 20 or more traders or hedgers hold positions equal to, or above, reporting levels established by the CFTC. Watching the ‘big boys’ If you are like most traders, one of your big concerns is, “What are the big boys doing?” The COT report answers that question by breaking down open interest into several categories including "Commercial" and "Large Speculators". Commercial traders are required to register with the CFTC by showing a related cash business for which futures are used as a hedge. The large speculators are primarily the Commodity Investment Traders (CITs), the commodity funds. The balance of open interest is qualified under the "non-reportable" classification that includes both small commercial hedgers and small speculators. What is most important for the individual trader to examine in the reports is the actual number of positions held by each category and, more specifically, the net position changes from the prior report. To derive the net trader position for each category, subtract the short contracts from the long contracts. A positive result indicates a net-long position (more longs than shorts). A negative result indicates a net-short position (more shorts than longs). Just knowing the bare numbers without knowing their relationship to each other or to the past isn’t enough. It takes an experienced hand to read the numbers and interpret their significance. One person who has specialized in this type of analysis is Steve Briese, one of the world's foremost experts on COT data and publisher of Bullish Review, which explains what the latest data suggest for prices. Trading the COT data The most important aspect of the COT report for most traders is the change in net positions of the commercial hedgers. Studies show that commercials hold a superior record to other trading groups in forecasting significant market moves. The large commercials are in the business of the market being traded and are generally believed to have the best fundamental supply and demand information on their markets, giving them an edge to position their trades. Along with the advantage of having the best fundamental supply and demand information on their markets, large commercials also trade large size, which in itself moves markets in their favor. It's important here to note that whether a particular trader group is net long or net short is not
7

important in analyzing the COT report. For example, Briese points out that commercials in silver are the producers, and they have never been net long because they hedge their sales. In gold, however, the commercial mix is more heavily weighted toward fabricators who buy long contracts as a hedge against future inventory needs. Individual traders who are considering positioning themselves in a market should follow the “elephant tracks” and trade on the side of the large commercials when the large commercials are becoming more one-sided in their market view. Some traders also follow the coat-tails of the large speculators, assuming the large specs must be good traders or they would not be in the large trader category. Other traders just like to take the opposite side of the position that the COT report shows the small traders (non-reportable positions) are taking. This is because most small speculative traders of futures markets are usually under-capitalized and/or on the wrong side of the market. The ‘big, bad funds’ Commodity funds or just “the funds” have become more prominent in media reports in recent years because they have been blamed, rightly or wrongly, for pushing some markets to price extremes. They come across as big bullies who always seem to be on the opposite side of the market as the small speculator. To the less-experienced traders, the funds may seem like the CIA or the Mafia – a powerful and secretive force that has a reach far and wide. Funds can come in several forms but usually involve a large pool of investor money (funds) managed by a single entity, such as a Commodity Pool Operator (CPO) or Commodity Trading Advisor (CTA). The CPO or CTA then trades futures contracts with the goal of gaining the best annual return possible on that money, especially when returns on other investment alternatives are not very attractive. Most wealthy investors do not put a big portion of their investment portfolio into futures trading, but even a small percentage of the portfolios of the wealthier investors who are willing to take some risks in an effort to get better returns can add up to a lot of speculative cash pouring into the futures markets. Thus, the funds can and do have the weight to move markets. Generally speaking, the commodity fund operators are trend-following traders who use a shorter- term time frame to trade futures. Many tend to use moving averages as a major trading tool or some type of mechanical trading system. Either way, these traders rely on technical analysis for the vast majority of their trading decisions. The funds like to see a market start to lean one way and then pile on positions in favor of the way the market is leaning. This is why markets tend to become overbought and oversold on a technical basis when fund buying or selling sometimes causes markets to over-react or become over-extended.
8

Major market impacts Probably the commodity groups where the funds have gained the most notoriety are the energy and the grains complexes, particularly during the first half of 2008. These markets provide an excellent medium for the funds because of the high interest worldwide in these commodities and because of their liquidity (high volume and open interest). Given that the funds usually take big trading positions, it would be more difficult for them to dabble in futures markets where the liquidity is thin, such as lumber or platinum. The higher-liquidity markets allow the funds to get into and out of positions more discreetly. Even with the big pools of cash that the commodity funds possess, they generally can't stand up to the big boys of futures markets, the commercials (the hedgers). Major food processors such as Cargill or Pillsbury have a huge clout and very deep pockets to keep the funds honest and keep futures prices in line with physical cash prices at most times. Still, the funds have enough power to more than jiggle markets once in a while. The funds are like a fly and the commercials like a horse: A biting fly can still make a horse wince.
Briese says that, contrary to what some believe, divergences from seasonal open interest averages in COT report data are not reliable trading indicators. This is even true with agricultural markets, where one would suspect that hedging is a seasonal consideration. For more information on COT reports, check out www.cftc.gov or www.bullishreview.com.
9

Making ‘contrary opinion’ work for you The previous section emphasized trading in line with the commercials because, presumably, this smart money has more knowledge and more money and is most likely to be on the right side of the market, the side you would like to follow. Trading results over time would probably support that contention. However, there is another line of thought that suggests that when trader sentiment leans too heavily one way or another, the best strategy is to take positions in the opposite direction – in other words, contrary to what the prevailing popular opinion is. Contrary opinion thinking itself runs contrary to the way most people think and the traditional ways of trading. This notion of "going against the grain" of popular market opinion is a difficult approach to undertake, especially when there is a steady drumbeat of fundamental information that seems to corroborate the popular opinion. No one left to buy or sell To help you understand why contrarian thinking is used successfully by some traders, consider these questions: When is a market most bullish? When is a market most bearish? The answers are: A market is most bullish when the highest daily high on the chart is recorded. It’s all downhill for prices from there. A market is most bearish when the lowest low is reached on the chart and the market starts to turn up. Traders are most bullish at market tops and most bearish at market bottoms! But here is what is actually happening. As prices move up, everybody who wants to buy gets a position until all of the bulls are long. At that point, there aren’t any bulls left to buy, or at least not enough bulls, and prices start to drop of their own accord. Profit-taking and covering of long positions accelerate the move to the downside and the rally is over. The same thing happens on the downside in reverse. The best clue you could get as a trader is some sentiment of a market’s mass psychology that indicates there aren’t enough new buyers to continue a rally or not enough new sellers to continue a decline. Because nobody has discovered the Holy Grail of trading markets, the best traders can do is seek out clues to when these conditions may be developing by analyzing charts and fundamentals and then possibly doing some contrary thinking. When popular opinion is wrong Most books on trading will tell you to have a trading plan and to stick with it throughout the trade. A main reason for this trading tenet is to keep you from being swayed or influenced by the opinions of others while you are in the middle of a trade. Popular opinion many times is not the right opinion when it comes to market direction. For example, let’s say that grains are in a summer weather market, and the weather forecast is for hot, dry conditions to continue. Everyone who wants to be long has positioned themselves for the
10

rally that they anticipate will continue. Then comes a small moderation in an updated weather forecast or some other development that doesn’t really change the fundamental outlook that much but, more importantly, does spark a big change in trader psychology as traders realize that the effects of drought and poor yields have all been factored into the market already with the earlier price gains. Without new buyers and with panic selling, those markets are likely to tumble. If a trader sells the new highs in that market, you might call that top-picking and, technically, it is. But if you see a situation where sentiment is strong on one side, you might want to go with a contrary opinion tactic by using a low-risk trade such as purchasing options. There are several resources to learn the sentiment of traders. Some sources survey traders daily or weekly to find out if they are bullish or bearish, some look at the recommendations of newsletter advisory services based on the assumption these gurus have enough of a following to influence markets, some look at the Commitments of Traders report described in the previous section. The key to contrary opinion trading is getting an accurate reading on trader sentiment. Second-guessing your decisions There is one other aspect of contrary opinion trading that should probably be mentioned, and that involves doing something contrary not to what the market is thinking but what you yourself are thinking. Many traders have probably come to this conclusion at times: "Maybe I should just take the exact opposite trading position from what I had planned." When you think about it, many of the decisions you make have probably been influenced by decisions that others are making – the popular opinion. You hear about this development or this statistic or you read or hear what some expert is recommending. All of that input is in the background as you do your analysis and may taint your decision to stay in line with what other traders are thinking. You don’t want to look like the oddball, missing what seems like the obvious conclusion that others have made, so you flow with the popular opinion. It’s not easy being a contrary opinion trader. It is always a good idea to look at how someone on the other side of the contract you are trading views the market. If you buy, why would some trader want to sell the same contract? What do they know that you don’t? But for the contrarian, when nearly everyone agrees on the likely direction of a particular market trend, even the experts, it’s time to watch out and, quite often, to run in the opposite direction.
11
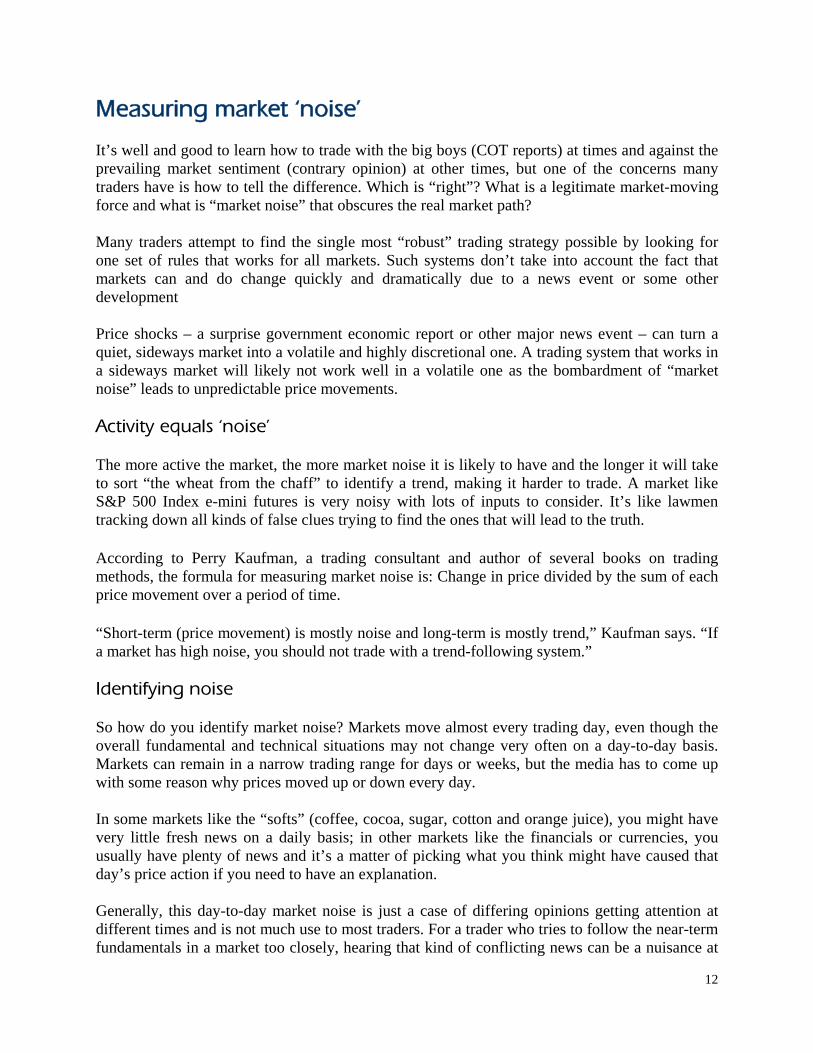
Measuring market ‘noise’ It’s well and good to learn how to trade with the big boys (COT reports) at times and against the prevailing market sentiment (contrary opinion) at other times, but one of the concerns many traders have is how to tell the difference. Which is “right”? What is a legitimate market-moving force and what is “market noise” that obscures the real market path? Many traders attempt to find the single most “robust” trading strategy possible by looking for one set of rules that works for all markets. Such systems don’t take into account the fact that markets can and do change quickly and dramatically due to a news event or some other development Price shocks – a surprise government economic report or other major news event – can turn a quiet, sideways market into a volatile and highly discretional one. A trading system that works in a sideways market will likely not work well in a volatile one as the bombardment of “market noise” leads to unpredictable price movements. Activity equals ‘noise’ The more active the market, the more market noise it is likely to have and the longer it will take to sort “the wheat from the chaff” to identify a trend, making it harder to trade. A market like S&P 500 Index e-mini futures is very noisy with lots of inputs to consider. It’s like lawmen tracking down all kinds of false clues trying to find the ones that will lead to the truth. According to Perry Kaufman, a trading consultant and author of several books on trading methods, the formula for measuring market noise is: Change in price divided by the sum of each price movement over a period of time. “Short-term (price movement) is mostly noise and long-term is mostly trend,” Kaufman says. “If a market has high noise, you should not trade with a trend-following system.” Identifying noise So how do you identify market noise? Markets move almost every trading day, even though the overall fundamental and technical situations may not change very often on a day-to-day basis. Markets can remain in a narrow trading range for days or weeks, but the media has to come up with some reason why prices moved up or down every day. In some markets like the “softs” (coffee, cocoa, sugar, cotton and orange juice), you might have very little fresh news on a daily basis; in other markets like the financials or currencies, you usually have plenty of news and it’s a matter of picking what you think might have caused that day’s price action if you need to have an explanation. Generally, this day-to-day market noise is just a case of differing opinions getting attention at different times and is not much use to most traders. For a trader who tries to follow the near-term fundamentals in a market too closely, hearing that kind of conflicting news can be a nuisance at
12

the least or a factor that prevents successful trading results at most. The opinions of the short-term trading crowd may sway back and forth with the latest rumors or other noise, but prudent long-term traders should not become overly sensitive or reactive to most of the day-to-day fundamental news events that are reported to be moving the market on any given day. What is important for the trader is recognizing and understanding the overall trend of the market and realizing that daily market noise is usually an insignificant part of the overall process of trading and of market behavior itself. When noise becomes reality There are times, of course, when market noise becomes market reality – a rumor does turn out to be true, the first hint of crop problems does become a statistic verifying real crop problems, anecdotal reports of demand do develop into real demand. You may be in the middle of a trade and see market noise moving prices against your position, or you may fail to initiate a position during a choppy market period and miss the start of a trend because you dismissed some news item as market noise. Here is where trading buzzwords like “patience” and “discipline” come into play. You may be sitting in a period of shorter-term choppy and non-trending conditions, trying to ignore day-to-day market noise, but the state of the market may gradually begin to change. One solution is to focus on the bigger-picture perspective of the market, using weekly or monthly charts if your trades are based on daily charts or using daily charts if you normally trade intraday. One simple, yet effective, way to help you filter out day-to-day noise is to set the major support and resistance benchmarks from the longer-term charts on the shorter-term chart (usually a daily chart for position traders). These major price benchmarks can be weekly or monthly highs or lows, spike highs and lows, or major psychological price levels such as $50 or $100 for crude oil. If prices do move above or below one of the benchmarks you have set, that is a solid clue the price move is NOT just market noise and a bigger price trend is likely developing. To a technical analyst, such a move is usually considered a breakout from a congestion area on the chart. Suddenly, the trading crowd becomes alert to a change in conditions, and the noise of a trading range becomes the sound of a trend.
13

Tracking cyclical human behavior Sometimes the fate of the individual trader and the whole trading crowd seem to be subject to conditions that may be out of their control. They are caught in a wave that washes over them – sometimes a victim and sometimes a big success. For example, take two equally brilliant trend-following traders. Place one in 2008 when markets like energy and grains turned in unprecedented bull runs followed by major bearish declines. Now place that same trader in 2001 or almost any other year when choppy trading conditions proved devastating to that style of trading. Or take two equally skilled stock index traders and place one in the late 1990s and the other in the early 1930s or even late 2008. Or take two excellent farmers and place one in the last 20 years and the other in the 1930s, when drought and the financial market crash destroyed many, or the 1980s, when the inflation and excesses of the 1970s caught up with many successful farmers and sent them into bankruptcy during the agricultural recession. Two equally capable people in each case but caught up in different times. Every stock picker looks like a genius in a bull market but what happens to that genius when the stock market turns down or sideways? Of course, successful traders know they have to adapt their strategies to changing market conditions, but timing – or fate or luck or whatever you want to call it – often plays a key role in trading as well as many other aspects of our lives. When you were born and when you started your career can make a big difference in how your life unfolds. Compare those men who were the “right age” to participate in World War II or the wars in Korea or Vietnam with those men who came of age when there was no major armed conflict that required many to serve in the military. Compare those who came out of college when jobs were plentiful and those who graduated when jobs were scarce. As they say, life isn’t always fair. Timing is everything, as experienced traders know. Knowing how this timing might develop and where we are in the time cycle can make a big difference in our trading outcome. History shows that human behavior doesn’t really change that much over time and that people and the trading crowd will react essentially the same way over and over. A number of economists and analysts have tackled the subject of human behavior and its effect on markets as reflected in recurring economic cycles. The following sections touch briefly on a few of the major studies and how they might help you read and interpret how and why the trading crowd is acting as it does. Kondratieff Cycle (‘K-Wave’) The long-term Kondratieff cycle (also called the "K-Wave") is based on the study of 19th
14

century price behavior that included wages, interest rates, raw material prices, foreign trade, bank deposits, wars, technological discoveries, public opinion, politics, weather and other available data. Nikolai Kondratieff (1892-1938) was a Russian economist who believed the interaction of current events produces a repetitive pattern over a long period of time. He believed public reaction is directly influential to the ebb and flow of economic prosperity and, therefore, vital to the economy. He viewed public response as waves of change, with its measurement and its effect on the future forming the basis of his theory. Kondratieff proposed that economic trends tend to repeat themselves approximately every 54 years. This alternating of a "long wave" from prosperity to depression, complemented by many "shorter cycles," creates a dynamic trend to the economy that becomes predictable. His work became known in the early 1930s, when he accurately predicted not only the Great Depression, but also the 1920s stock market boom that preceded it. Like Ralph Nelson Elliott of Elliott Wave Theory fame (see below), Kondratieff was convinced that his studies of economic, social and cultural life proved that a long-term order of economic behavior existed and could be used for the purpose of anticipating future economic developments. Kondratieff detailed the number of years the economy expanded and contracted during each part of the half-century-long cycle in which industries suffered the most during the down wave and technology played a role in leading the way out of the contraction into the next up wave. According to most who have thoroughly studied this long-term economic cycle, the most recent revolution of the Kondratieff Wave began after the global economy pulled out of a deflationary depression in the 1930s. Prices began to accelerate upward after World War II and reached the commodity price blow-off stage in 1980. Since that time, and then after the recession of 1990- 1991, the global economy has been experiencing a "secondary plateau." During this period, consumers and investors became aware that inflation is not accelerating and disinflation becomes visible. Paper assets such as stocks and bonds have done well the past few years because neither inflation nor deflation hurt the marketplace. But during the secondary plateau, the first signs of economic problems become evident. Isolated economies fall into deflationary contraction, and signs such as declining gold prices begin to take hold. During the 1990s, it was the Japanese economy that slid first into deflationary contraction. The recent stock market decline is another signal that the period of economic growth along the secondary plateau is ending. In the very informative book, Elliott Wave Principle, by A.J. Frost and Robert Prechter, the authors note: "Kondratieff noted that 'trough' wars – wars near the bottom of the cycle – usually occur at a time when the economy stands to benefit from the price stimulation generated by a war economy, resulting in economic recovery and an advance in prices."
15

This longer-term economic cycle theory has merit, just as do many other shorter-term cycles, but other than knowing the current position of the cycle, it may not be very practical or helpful for a trader. Longer-term cycles, while valuable in gaining a "bigger-picture" perspective of the marketplace, have wide enough parameters that they do not make for good short-term timing methods for trading. What the Kondratieff wave does is combine with and corroborate other studies and other cycles to show that periods of high or low inflation or weak or strong prices for commodities or stocks do not last forever and that the next stage of the cycle will probably change the environment of the marketplace as economic cycles roll on and on. Elliott Wave Theory After analyzing price movements and studying chart patterns over a number of years, an accountant named R.N. Elliott developed a wave theory that has been associated with his name since he unveiled it in the 1930s. Elliott Wave Theory can be a valuable trading tool for those who master the theory, but it can also be rather complicated for the uninitiated and tends to look better in hindsight on a chart than it does while the waves are developing. Elliott waves describe the basic movement of stock or futures market prices as being five waves in an impulse direction followed by three waves in the opposite direction – what is usually termed an A-B-C correction. In Wave One, the market makes its initial move upward. This is usually caused by a relatively small number of traders who all of a sudden believe the previous price of the market was cheap and, therefore, worth buying, causing the price to go up. This is where bottom-pickers come into the market. In Wave Two, the market is considered overvalued. At this point enough people who were in the original wave consider the market overvalued and take profits. This causes the market to go down. However, in general, the market will not make it to its previous lows before it is considered cheap again and buyers re-enter the market. Wave Three is usually the longest and strongest wave. More traders have found out about the market; more traders want to be long the market and buy at higher and higher prices. This wave usually exceeds the tops created at the end of Wave One. In Wave Four, traders again take profits because the market is again considered expensive. This wave tends to be a weak downleg because there are usually more traders that are still bullish the market than are willing to take some profits. Wave Five is the point where many traders get long the market, and the market is now mostly driven by emotion. Traders will come up with lots of reasons to buy and ignore reasons not to buy. At this point, contrarian thinkers will probably notice the market has very little negative news and will start shorting the market when it becomes the most overpriced.
16
17
After peaking, the market will move into one of two patterns, either an A-B-C correction or starting over with Wave One. In an A-B-C correction, the market goes down, makes a weak rally and then goes down again in preparing for another five-wave cycle. Elliott wave analysts identify these wave patterns on charts of all time frames and then use wave counts to project the direction of prices and the potential extent of a move. A number of these forecasts are based on Fibonacci numbers and ratios (see next section). There is much more to Elliott Wave Theory than can be explained here but, essentially, if analysts think the market is in Wave 3, they expect prices to form a Wave 4 and then a higher peak at the end of Wave 5. What is most important, the tenets of Elliott Wave Theory show traders how much human psychology plays a part in the way the trading crowd thinks and the way markets move. Fibonacci numbers and ratios Leonardo Fibonacci da Pisa was a famous 13th century mathematician who helped introduce European countries to the decimal system, including the positioning of zero as the first digit in the number scale. Fibonacci also discovered a number sequence called "the Fibonacci sequence," adding the two previous numbers in the sequence to come up with the next number: 1, 1 + 1 = 2, 1 + 2 = 3, 2 + 3 = 5, 3 + 5 = 8, 5 + 8 = 13, 8 + 13 = 21, 13 + 21 = 34 and so on to infinity. Importantly, after the first several numbers in the Fibonacci sequence, the ratio of any number to the next higher number is approximately 0.618, and the next lower number is 1.618. These two figures (0.618 and 1.618) are known as the Golden Ratio or Golden Mean. Its proportions are pleasing to the human eyes and ears and appear throughout nature and in biology, art, music and architecture. A few examples of shapes based on the Golden Ratio include playing cards, sunflowers, snail shells, the galaxies of outer space, hurricanes and even DNA molecules. Two Fibonacci technical percentage ratios that are particularly important to traders are 38.2% and 61.8%. Most market technicians will track a "retracement" of a price uptrend from its beginning to its most recent peak, and those retracements in price often stop at these Fibonacci ratios, indicating places where markets may turn or show signs of strength. Other important retracement percentages include 75%, 50% and 33%. For example, if a price trend starts at zero, peaks at 100, and then declines to 50, it would be a 50% retracement. The same levels can be applied to a market that is in a downtrend and then experiences an upside "correction." Perhaps it is a self-fulfilling prophecy, but traders know where these price retracement levels are, and the market frequently respects them. What is most fascinating about Fibonacci numbers, the Golden Ratio and the Elliott Wave Principle as they are applied to technical analysis of markets is that these principles are a reflection of human nature and human behavior. The longer you are in the trading business and study the behavior of markets, the more you will realize that human behavior patterns and market price movement patterns are deeply intertwined. If you want to figure out prices, you need to figure out the trading crowd.
Membership is FREE – Join Today at TraderPlanet.com
STUDYING MARKETS AND TRADING ...
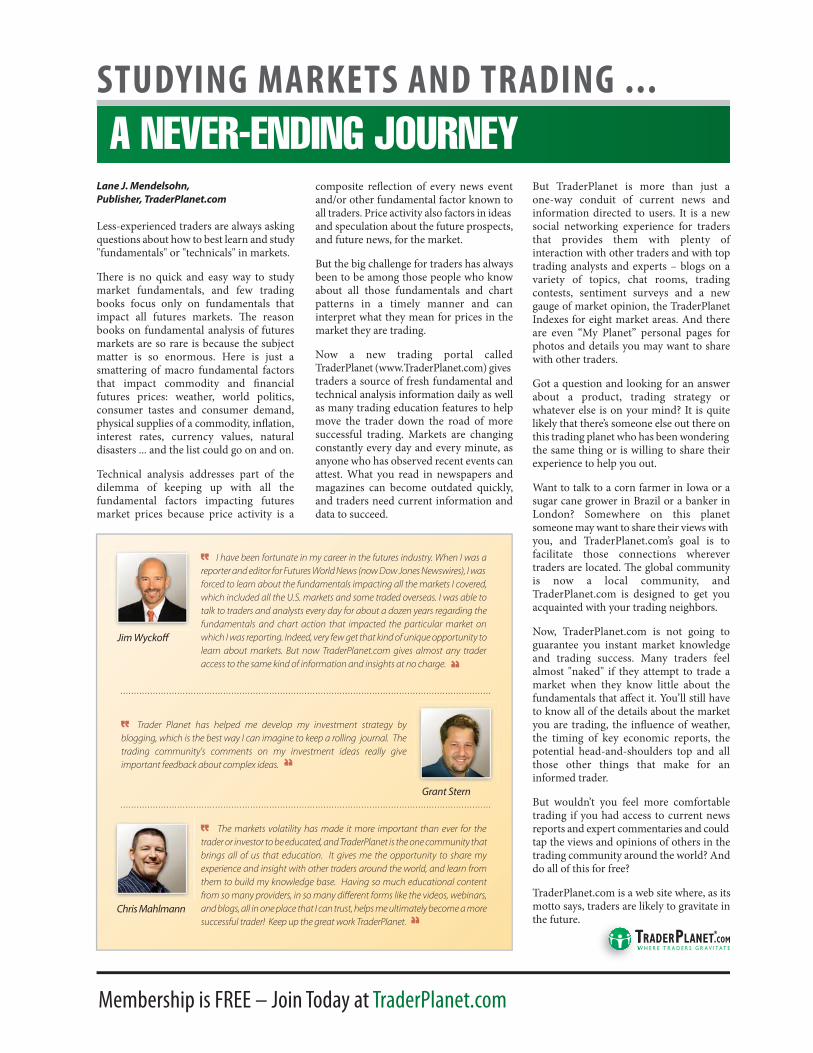
Lane J. Mendelsohn, Publisher, TraderPlanet.com
Less-experienced traders are always asking questions about how to best learn and study "fundamentals" or "technicals" in markets.
market fundamentals, and few trading books focus only on fundamentals that
books on fundamental analysis of futures markets are so rare is because the subject matter is so enormous. Here is just a smattering of macro fundamental factors
futures prices: weather, world politics, consumer tastes and consumer demand,
interest rates, currency values, natural disasters ... and the list could go on and on.
Technical analysis addresses part of the dilemma of keeping up with all the fundamental factors impacting futures market prices because price activity is a
and/or other fundamental factor known to all traders. Price activity also factors in ideas and speculation about the future prospects, and future news, for the market.
But the big challenge for traders has always been to be among those people who know about all those fundamentals and chart patterns in a timely manner and can interpret what they mean for prices in the market they are trading.
Now a new trading portal called TraderPlanet (www.TraderPlanet.com) gives traders a source of fresh fundamental and technical analysis information daily as well as many trading education features to help move the trader down the road of more successful trading. Markets are changing constantly every day and every minute, as anyone who has observed recent events can attest. What you read in newspapers and magazines can become outdated quickly, and traders need current information and data to succeed.
But TraderPlanet is more than just a one-way conduit of current news and information directed to users. It is a new social networking experience for traders that provides them with plenty of interaction with other traders and with top trading analysts and experts – blogs on a variety of topics, chat rooms, trading contests, sentiment surveys and a new gauge of market opinion, the TraderPlanet Indexes for eight market areas. And there are even “My Planet” personal pages for photos and details you may want to share with other traders.
Got a question and looking for an answer about a product, trading strategy or whatever else is on your mind? It is quite likely that there’s someone else out there on this trading planet who has been wondering the same thing or is willing to share their experience to help you out.
Want to talk to a corn farmer in Iowa or a sugar cane grower in Brazil or a banker in London? Somewhere on this planet someone may want to share their views with you, and TraderPlanet.com’s goal is to facilitate those connections wherever
is now a local community, and TraderPlanet.com is designed to get you acquainted with your trading neighbors.
Now, TraderPlanet.com is not going to guarantee you instant market knowledge and trading success. Many traders feel almost "naked" if they attempt to trade a market when they know little about the
to know all of the details about the market
the timing of key economic reports, the potential head-and-shoulders top and all those other things that make for an informed trader.
But wouldn’t you feel more comfortable trading if you had access to current news reports and expert commentaries and could tap the views and opinions of others in the trading community around the world? And do all of this for free?
TraderPlanet.com is a web site where, as its motto says, traders are likely to gravitate in the future.
I have been fortunate in my career in the futures industry. When I was a
reporter and editor for Futures World News (now Dow Jones Newswires), I was
forced to learn about the fundamentals impacting all the markets I covered,
which included all the U.S. markets and some traded overseas. I was able to
talk to traders and analysts every day for about a dozen years regarding the
fundamentals and chart action that impacted the particular market on
which I was reporting. Indeed, very few get that kind of unique opportunity to
learn about markets. But now TraderPlanet.com gives almost any trader
access to the same kind of information and insights at no charge.
The markets volatility has made it more important than ever for the
trader or investor to be educated, and TraderPlanet is the one community that
brings all of us that education. It gives me the opportunity to share my
experience and insight with other traders around the world, and learn from
them to build my knowledge base. Having so much educational content
from so many providers, in so many different forms like the videos, webinars,
and blogs, all in one place that I can trust, helps me ultimately become a more
successful trader! Keep up the great work TraderPlanet.
Grant Stern
Trader Planet has helped me develop my investment strategy by
blogging, which is the best way I can imagine to keep a rolling journal. The
trading community's comments on my investment ideas really give
important feedback about complex ideas.
Chris Mahlmann