Embed Size (px)
Citation preview

Book 9Teaching Number throughMeasurement, Geometry,Algebra and Statistics
Numeracy Professional Development Projects (Draft)

Numeracy Professional Development Projects 2006(Draft)Published by the Ministry of Education.PO Box 1666, Wellington, New Zealand.
Copyright © Crown 2006. All rights reserved.Enquiries should be made to the publisher.
ISBN 0 478 13212 3Dewey number 372.7Topic Dewey number 510Item number 13212
Note: Teachers may copy these notes for educationalpurposes.
This book is also available on the New Zealand Maths website,at www.nzmaths.co.nz/Numeracy/2006numPDFs/pdfs.htm
THE NUMBER FRAMEWORK AND MEASUREMENT, GEOMETRY, ALGEBRAAND STATISTICS
The Numeracy Professional Development Projects placea strong emphasis on students gaining anunderstanding of the number system. This is alignedwith trends in modern mathematics educationinternationally. At all levels of schooling, teachers shouldencourage students to explore, describe and generalisestructures and relationships through a range ofmathematical activities.
Research about quality teaching1 shows that studentslearn most quickly when they have opportunities toidentify and resolve discrepancies between their currentunderstandings and new information. The carefulselection of related problems or investigations and thecreation of a comfortable classroom climate in which allstudents can share their mathematical ideas arefundamental to improving achievement. The promotionof creative and efficient recording strategies can alsogreatly assist students in developing, generalising andcommunicating their ideas.
The Ministry of Education has adopted the followingdefinition of numeracy: �to be numerate is to have theability and inclination to use mathematics effectively inour lives � at home, at work, and in the community.�2
Numerate students are able to apply their numberunderstanding to a range of contexts, from the otherstrands in mathematics, from other essential learningareas and from situations in their daily life, both real andimaginary.
This book makes explicit links between students�number knowledge and strategies and their ability tosolve problems in measurement, geometry, algebra andstatistics. These strands require students to make
connections between their spatial visualisation and theirability to quantify (reason numerically). While strongnumber sense is not sufficient in itself for students tosolve problems effectively in measurement, geometryand statistics, it is fundamental to success.
For example, students� ability to use continuous scalesin measurement is critically dependent on theirunderstanding of the number system, particularly ofdecimals. Their capacity to generalise how tessellationswork involves understanding the angle concept. Thisrequires both spatial and numeric reasoning. Statisticalinquiry is becoming increasingly oriented towards findingrelationships within existing data sets. Computertechnology is providing powerful tools that allowstudents to explore these data sets, using a variety ofrepresentations. Critical use of these representationsalso requires both spatial and numeric reasoning.
This book aims to provide teachers with developmentallinks between the Number Framework and progressionsin the different strands of Mathematics in the NewZealand Curriculum. In measurement and algebra, theselinks are very clear. In statistics and geometry, they areless defined. The lesson examples demonstrate howteachers can develop students� ability to generalisemathematically using contexts from the strands ofMathematics in the New Zealand Curriculum.
1 Alton-Lee, A. (2003). Quality Teaching for DiverseStudents in Schooling: Best Evidence Synthesis.Wellington: Ministry of Education.
2 Quoted in Curriculum Update 45 (February 2001),page 1.

1
Teaching Number through Measurement, Geometry, Algebra and Statistics
Linking the Number Framework with the Strandsof the Mathematics Curriculum
This book is designed to provide links between students� development in the NumberFramework and their capacity to solve problems in the different strands of Mathematicsin the New Zealand Curriculum.
The teaching model shown below, which is taken from Book 3: Getting Started,emphasises imaging as an essential link between the students� manipulation ofmaterials and their generalisation of number properties. There is a growing consensusthat students� ability to hold and manipulate high quality images of objects is the mostimportant factor in spatial visualisation.
It is reasonable to expect that implementing this teaching model will assist students todevelop their spatial visualisation and that teaching with an emphasis on spatialvisualisation will greatly assist students to image actions on materials.
Spatial visualisation has a key role in reasoning within the different strands of themathematics curriculum. In the measurement of volume, for example, students need torecognise that cubes can fill up a space and that some of the cubes filling a box may behidden from their view.
In algebra, a geometric pattern may provide a sequence of numbers or a function andalso give strong clues as to how the relationships can be generalised.
In statistics, there is an increasing emphasis on interpreting graphic displays, especiallythose generated by computers, rather than on processing data in a numeric form.Attending to the spatial and measurement features of a display, for example, scale,points and lines, is critical to successful interpretation.
ExistingKnowledge &
Strategies
Using Materials
Using Imaging
Using Number Properties
NewKnowledge &
Strategies

Teaching Number through Measurement, Geometry, Algebra and Statistics
2
The diagram below depicts the relationship between students� number knowledge andstrategy and their proficiency in the different strands of the mathematics curriculum.
Number Framework Spatial, Logical ReasoningImpact Impact
informsand
impactson
Quantifying IdentifyingProperties
This diagram suggests that there is a dynamic way in which spatial visualisation andquantification inform and impact on each other. Students� number strategy impactsdirectly on their ability to quantify measurement units. For example, a student at theOne-to-one Counting stage is likely to count the number of squares in an array one at atime, whereas a student at the Advanced Counting stage may use skip-counting. Astudent at the Advanced Additive stage may use multiplication to quantify the numberof squares.
The exercise of quantifying units has an impact on how students perceive space. Forexample, much of the geometry of shapes and solids and of direction and movementdepends on students� understanding the nature of angles. To teach the angle conceptsuccessfully, it is crucial to first support and enhance the act of quantifying (measuring)angles in degrees by spatial exploration and debating what constitutes an angle.
The Ministry of Education has adopted the following definition of numeracy: �to benumerate is to have the ability and inclination to use mathematics effectively in ourlives � at home, at work, and in the community.�3 The definition of numeracy also statesthat the development of strong number sense is the key learning goal in mathematicsfor the early primary years but that, in the middle and upper stages of schooling,number increasingly becomes a tool to be applied across the other strands.
Book Nine: Teaching Number through Measurement, Geometry, Algebra and Statistics offersexamples of how knowledge of the Number Framework can influence teachers� workwith students on the different mathematics strands. The lessons provided are examplesof how these links can be made and are not intended to be a comprehensive sequenceor set. As with the other books in the numeracy series, a stage indicator has been usedto suggest which strategy stages a given lesson is suitable for.
Book 9 is organised into the following sections:
Measurement pages 3�15
Geometry pages 16�29
Algebra pages 30�40
Statistics pages 41�52
3 Quoted in Curriculum Update 45 (February 2001), page 1.

3
Teaching Number through Measurement, Geometry, Algebra and Statistics
Measurement Links to the Number Framework
In measurement, units are used to quantify the attributes of objects. These attributes aresometimes spatial, for example, length, area, volume; sometimes physical, for example,weight (mass) and temperature, and sometimes have no obvious physical connectionwith objects, for example, time. From these basic measures, rates are created, such as,speed, for example, km/h, and density, for example, g/cm3. At a simple level, numberconnects to measurement because numbers are used to quantify the measurements, forexample, 45 cm, 37.4°. However, the connections run much deeper than that.
Battista (2003)4 lists four spatial processes necessary for students to understand themeasurement of area and volume. These processes are imaging models, structuringmodels, locating units, and forming composites. The strong relationship between thesespatial processes and quantifying can be summarised in the following developmentalframework.
The framework provides conceptual stages in students� development in measuringlength that can be applied across most attributes we might want to measure. It isderived from work by Lehrer, Jaslow, and Curtis (2003)5 and Geary, Holton, Tagg, andThomas (2003)6.
Idea Description Example
Concept of Comparison Objects can be compared in A is longer than BAttribute relation to an attribute they A
all possess. B
Transitivity A third object can be used to A is longer than B,compare two other objects B is longer than C,without needing to compare so A is longer than Cthe objects directly. (without directly
comparing them)
Concept of Iteration A subdivision of an attributeUnit is translated to obtain a
measure.
Identical unit Each subdivision is identical. =
Tiling Units fill a space with nogaps or overlaps.
Relativity Units compare in size toother known objects(sense of size).
Partitioning Units can be partitioned.
Additivity Measures can be joined andseparated, 8 units into 5 35 units and 3 units
4 Battista, M. T. (2003). �Understanding students� thinking about area and volume measurement.� InClements, D. H. and Bright, G. B. (Eds.) Learning and Teaching Measurement: 2003 NCTM Yearbook, Reston,VA: NCTM.
5 Lehrer, R., Jaslow, L. and Curtis, C. L. (2003). �Developing an understanding of measurement in theelementary grades.� In Clements, D. H. and Bright, G. B. (Eds.) Learning and Teaching Measurement: 2003NCTM Yearbook, Reston, VA: NCTM.
6 Geary, M., Holton, D., Tagg A., and Thomas, G. (2003). Assessment Exemplars: Mathematics, Wellington:Learning Media.
......
......
......
.
......
......
......
.
Teaching Number through Measurement, Geometry, Algebra and Statistics
4
Idea Description Example
Concept of End points The marks on a scale are putScale at the end points of the units.
0 1 2 3
...
Zero point Any point can serve as theorigin (start) of a scale.
0 1 2 3 4 5 6 7 8 9 New Zero Point
Precision The choice of units in relationto the object determines therelative precision of themeasure. All measurementsare inherently approximate.
Piaget�s early work suggested that students learn to conserve measurement attributes atthe following ages: length, 6�7 years; area, 6�7 years; substance, 6�7 years; weight,9�10 years; volume and capacity, 11�12 years. Kamii and Long (2003)7 highlighted thatmost students begin to conserve speed (time) at ages 9�11 years.
While some researchers dispute the accuracy of these ages, it is clear that somemeasurement attributes are more difficult for students than others. For example, lengthand area appear to be easier than volume and capacity. These differences are due to thecomplexity of the spatial visualisation and/or quantifying involved.
The measurement framework shows that there are clear cognitive connections betweenstudents� development of number strategies and their development of measurementideas. Conception of a measurement unit parallels the development of both hierarchical(one more is the next number) and inclusive (the last count includes all of the others)counting. The unit concept is established when part-whole reasoning develops, forexample, recognising that a measure of eight can be split into a measure of five and ameasure of three.
The conception of scale marks the transition from discrete thinking, which is in units ofone, to continuous thinking, which underpins the metric measurement system.Continuous thinking involves seeing a length, area, period of time, etc, as divisible intoan infinite range of equal units. Smaller units are nested within bigger units, forexample, millimetres are tenths of centimetres, which are hundredths of metres. Thesmaller the subdivisions (or units) chosen, the more accurate the measurement.
In the same way that the discrete unit concept is linked to counting, continuous unitthinking is linked to multiplicative reasoning. Understanding the metric systemrequires an understanding of decimals that emerges alongside strong multiplicativestrategies for whole numbers. In some measures, particularly area and volume, theunits are composites of ones, for example, rows, columns and layers. This suggests thatstudents need multiplicative reasoning to understand some types of units and to be ableto partition them.
7 Kamii, C. K. and Long, K. (2003). �The measurement of time: Transitivity, unit iteration, andconservation of speed.� In Clements, D. H. and Bright, G. B. (Eds.) Learning and Teaching Measurement:2003 NCTM Yearbook, Reston, VA: NCTM.

5
Teaching Number through Measurement, Geometry, Algebra and Statistics
Connections to stages in the number framework are captured in the following diagram.
The key to the successful teaching of measurement lies in assisting students to apply themental strategies they bring with them from number to situations that require strongspatial visualisation.
E
CA
AC
EA
AA
AM
AP
AP+
Measurement AttributeNumberFramework
Stages Length AreaVolume/Capacity Weight Time
Temper-ature
Sca
le C
once
pt U
nit
Con
cept
Att
ribut
e Con
cept
Sca
le C
once
pt U
nit
Con
cept
Att
ribut
e Con
cept
Sca
le C
once
pt U
nit
Con
cept
Att
ribut
e Con
cept
Sca
le C
once
pt U
nit
Con
cept
Att
ribut
e Con
cept
Sca
le C
once
pt U
nit
Con
cept
Att
ribut
e Con
cept
Sca
le C
once
pt U
nit
Con
cept
Att
ribut
e Con
cept

Teaching Number through Measurement, Geometry, Algebra and Statistics
6
Learning Experiences to Develop Students’Reasoning in Measurement
Putting Numbers on the Number Line
I am learning to find numbers on a number line or measurement scale.
Links to Other Strands
Number: representing operations on number lines
Statistics: reading and creating scales (axes) for graphs
Required Knowledge
� Number sequences from 1 to 10 at least
Equipment: Number stick or a set of Unifix cubes, a set of numbers that can be fastened(Material Master 9�1). (A number stick is a length of wood or plastic that is marked into10 divisions using colour breaks.)
Using Materials
Show the students the number stick with 0 at the start and the other colour changesmarked as 1, 2, 3 ... (but missing 9), using numeral cards fastened along the stick.
Ask, �What is the missing number?�
Repeat, using other missing numbers. Keep the same scale but progress to onlyshowing the start numbers (0, 1, 2, 3). Ask what numbers will go on various othercolour changes. Maintaining the unit scale, put 2, 4, 6, ... on every second colour changeand ask what the missing numbers are.
Repeat with other sets of multiples, for example, fives, tens, threes.
Using Imaging
Show the students the number stick with 0, 1, 2, 3, ... labelling successive colourchanges. Get them to draw their own number stick in their books. As a class, comparedrawings and ask the students, �What is the simplest way to draw the number stick?�Discuss which features of the number stick are most important and how they can bedrawn. If necessary, show how to make the representation a line. Highlight that it isstraight and should be drawn with a ruler, that the numbers go at the marks and thatthe space between each of the numbers should be the same. Show the students thenumber stick with a variety of numbers along a unit scale and get them to draw what itwould look like as a number line. The students should compare their drawings andgive feedback to each other.
E
CA
AC
EA
AA
AM
AP
0 1 2 3 4 5 6 7 8 10
0 2 4 6

7
Teaching Number through Measurement, Geometry, Algebra and Statistics
Using Properties of Scales
Ask the students to draw a number line and show unpatterned sets of numbers like0, 2, 3, 6, 9, 11 or 4, 5, 8, 9 on it without any number stick model.
Extend this to scales with numbers beyond 10 and 20, and later to scales that do nothave 0 as their starting point, for example, 25, 30, 35, ... .
Learning to Measure Length
I am learning to measure how long things are.
Links to Other Strands
Number: fractional numbers, addition and subtraction strategies
Geometry: reflective and translational symmetry
Required Knowledge
� Counting and FNWS
� Bigger or smaller
� Students need to have had prior experiences of comparing different but similarlengths, for example, straws, and need to be able to answer the questions, �Which islonger?�, �How can you tell?� and �Can you prove you are right?� This is aimed atgetting students to attend to the attribute of length and to understand that directcomparison requires the lengths to be laid side by side with a common baseline orstarting point.
Equipment: Pairs of straws cut to lengths of 13 and 15 centimetres, other straws cut tovarious lengths, paper strips made from adding machine tape, card or paper models ofrulers marked in centimetres (Material Master 9�2).
Using Materials
Show the students a 15-centimetre-long straw and then cover it, then show them a 13-centimetre-long straw and ask, �Which straw is longer?� After the students havesuggested answers, ask, �How can we tell which is longer if the two straws cannot beseen at the same time?� and discuss ways of doing this. If the idea of a unit of measureis not mentioned, suggest that the students can measure the straws with widths of theirthumb and see how many thumbs long each straw will be.
After the students have measured their pairs of straws, discuss the use of thumb widthas a unit of measure. Ask, �Why do some people get different numbers of thumbs toother people?� This will focus the students on the need for a standard unit of measure.Discuss the impact of leaving gaps between the thumbs, leading to the idea that theyshould be placed end on end with no gaps or overlaps.
Progress to measuring longer objects, such as the width of the room, with the studentssuggesting appropriate units of measure, such as arm spans, feet or paces. Record thestudents� measures on the board and discuss similarities and differences. Establish theneed for a standard unit of measure.
Using Imaging
Establish a class unit, using the hand length of one student, then have each student cutstraw copies of this unit to measure how long things are. The students can use this unitto measure a collection of objects and record their measurements. Discuss how to dealwith lengths that are �a bit longer� than a whole number of standard measures (forexample, 14 and a bit more hands). This leads to the idea that for increased accuracy, anew unit needs to be created that is a division of the standard unit.
E
CA
AC
EA
AA
AM
AP

Teaching Number through Measurement, Geometry, Algebra and Statistics
8
Compare the consistency of the measurements to those taken previously with non-standard units. Suggest that every pupil cut a strip of paper that is exactly 10 handslong. Compare the strips, which should be the same length, and discuss any differences.
Ask the students how they could use this paper strip to speed up the measurement ofobjects within the classroom. This will lead to the students suggesting they create a�hands� ruler. Let the students make their �ruler� and practise using it. Ask thestudents how to use this �ruler�, drawing out the need to line up the start of the rulerwith one end of the object and to count the next mark as 1. Discuss the idea ofnumbering the marks on the �ruler� (if this has not already happened) and where 0 islocated on a ruler.
Using Measurement Properties
Ask, �In the real world, how do we make sure that everyone in the world gets the samemeasurement?� Introduce the idea of the centimetre as a worldwide standardmeasurement. Give the students a single piece of straw that is 1 centimetre long and askthem how they are going to remember how long it is. Develop the students� mentalimage of a centimetre, then provide them with a paper ruler marked only in wholecentimetres (Material Master 9�2). The students can use this ruler to measure thelengths of objects.
Have a similar discussion and progression for measuring large objects, like the roomwidth, to establish the concept of the metre.
Get the students to cut an 8-centimetre-long straw and a 5-centimetre-long straw. Askquestions like, �How long will it be if I put these two straws end to end?�, �How longwill it be if I put six of these combined straws together end to end?�
Take another straw that is 16 centimetres long. Cut a 7-centimetre-long piece off thestraw and tell the students that you have done this. Ask questions like, �How long willthe leftover piece be?�, �How long will it be if I cut off another 7 centimetres?�
These problems are designed to help the students realise that units can be separatedand combined.
Related Activities
Introduce the millimetre as another standard unit of measure (for measuring smallthings) by focusing on the accuracy of measurements.
Get the students to measure their pencils in centimetres. This will raise issues ofrounding as �closest to�.
Choose pairs of students who have identical pencil measurements (such as, 14centimetres) and get the students to directly compare their pencils. The students willnote that centimetre measures were not accurate enough for comparing the lengths ofpencils. Discuss what unit could be used to do this. This will lead to the idea ofsubdividing centimetres, which in turns leads to the idea of millimetres (tenths ofcentimetres).
Measure the pencils again using millimetres and compare the degree of accuracy withthe centimetre measures.
Look at the relationships between metres, kilometres, centimetres and millimetres,noting the meaning of the prefixes, milli- (one thousandth), centi- (one hundredth), andkilo- (one thousand).

9
Teaching Number through Measurement, Geometry, Algebra and Statistics
E
CA
AC
EA
AA
AM
AP
Using Multiple Scales Like 0, 5, 10, 15, ...
I am learning to find numbers on scales that show multiples.
Links to Other Strands
Number: number word sequences
Statistics: reading and creating graph scales
Geometry: reflective and translational symmetry
Required Knowledge
� Skip-counting in a variety of bases, for example, threes, fours, ...
� Halving numbers to 10, finding a number halfway between other numbers
� Rounding numbers to the nearest 10, 100 (stage 5)
� The students need to have successfully completed the activity Putting Numbers onthe Number Line, page 6.
Equipment: A number stick and a set of numbers (Material Master 9�1).
Using Materials
Show the students the number stick with 0 at the start and 2, 4, 6 ... labelled onsubsequent colour changes (but with 16 missing).
Ask, �What is the missing number?� Repeat with other missing numbers and otherscales. Get the students to draw number lines to show what the number stick shows,then get them to give feedback on the quality of each others� number lines. Wherenecessary, revise the conventions discussed in Putting Numbers on the Number Line. Itis worth making explicit the conventions that the numbers get bigger as you move tothe right and that the intervals are consistent.
Using Imaging
Start again with just 0 and 2, 4, 6 on subsequent colour changes. Ask the students whatnumbers will go on various other colour changes. Repeat with other sets of multiples,for example, 0, 3, 6, 9, .... Get the students to draw number lines representing thenumber stick, along with a given missing number, for example, given the scale0, 2, 4, 6, ..., get the students to show where 12 should go. Be aware that some studentswill place 12 at the next mark as they have not recognised that the intervals on a scaleshould always be consistent. If they make this mistake, explicitly tell the students aboutthis convention. Use the number stick to confirm the placement is correct by either skip-counting or using multiplication if the students suggest it.
Using Properties of Scales
Have the students draw number lines with a given set of multiples as the scale and getthem to practise continuing a scale and locating missing numbers on a scale. Forexample:
0 6 12 24 30
0 2 4 6 8 10 12 14 18 20

Teaching Number through Measurement, Geometry, Algebra and Statistics
10
Related Activities
Develop the idea of subdividing intervals on a scale. For example, show the studentsthe number stick with 0 at the start and 2, 4, 6, ... on every second colour change. Ask,�Where does 1 go?� Establish the language that �1 is halfway between 0 and 2�. Repeatwith 0, 2, 4, 6 on subsequent colour changes. Establish that 1 is still halfway between 0and 2, even though there is no �mark� for it on the scale. Locate 3, 5, 7, ... as well. Repeatwith multiples of 4 as the scale, finding 2, 6, 10, then progress to locating 1, 3, 5, etc.
Use other multiple scales of increasing complexity and ask the students to locate �inbetween� numbers. Develop the students� ability to draw the scales as number lines.Discuss strategies for finding where certain numbers would be located with anemphasis on accuracy. For example, on a scale showing 0, 5, 10, 15, ..., 7 is located twointervals of one-fifth to the right of 5.
0 5 10 15
Once the students have a well developed control of zero-based scales, vary the startingnumber and intervals of the scales used. Have the students draw the scales and usearrows to locate numbers that are not shown. For example, �Find 26 or 35 on this scale.�
12 24 30
Also pose questions that require the students to work out to which number an arrow ispointing to.
0 8 16 24 32 40
Relate the work on scales to reading scales in measurement contexts such astemperature (thermometers), weight (scales), capacity (buckets, jugs), and speed (carspeedometers), etc.
Further Activities
Give the students a collection of numbers, such as, 6, 13, 26, 41. Tell them to come upwith a scale they can use to show where all these numbers are on a number line. Havethe students feed back their suggestions to the group and discuss which scales are themost appropriate and where the numbers would be found on the chosen scale.
Extend the range of scales progressively to other multiples like 12, 15, 20, 25, 50, 100,200, 250, 500, 1000.
Use a rope number line laid out along the front of the class, with 0 pegged at one endand 1000 at the other. Have the students estimate where they think 639 would lie andpeg a piece of paper with their name on it at that place on the line. Compare strategiesfor locating the number to reach a consensus on the number�s location and on what wasthe best way of locating that number.

11
Teaching Number through Measurement, Geometry, Algebra and Statistics
Investigating Area
I am learning to compare and measure areas.
Links to Other Strands
Number: addition and multiplication strategies
Geometry: tessellations of triangles, quadrilaterals, and other polygonsreflective, rotational, translation symmetry
Required Knowledge
� The student must have successfully developed an understanding of the concept oflength and how to measure it.
Equipment: Paper rectangles, scissors, sticking tape, a collection of potential area unitssuch as square tiles, beans, counters, pattern blocks.
Using Materials
Show the students three different-shaped rectangles that have the same area and thatcan be directly mapped onto one another by cutting and moving the parts,for example, 12 cm � 12 cm, 6 cm � 24 cm, 8 cm � 18 cm.
This is primarily to get the students to attend to the attribute of area.
Label the rectangles A, B and C. Ask, �Which of these is the biggest?� Once thestudents� responses have been recorded on the board, ask, �How can we check which isthe biggest?�
Have the students work in groups to develop strategies, then feedback to the class.Their suggestions might include direct comparison through visual �feel�, overlaying,cutting and moving, measuring with a smaller rectangle (unit). Have them use theirmethods to compare and trial other sets of rectangles, for example, 10 cm � 10 cm,3 cm � 33 cm, 22 cm � 5 cm. (Note that the rectangles suggested in the example abovehave slightly different areas. This is a good teaching point.)
All the students should be able to compare areas of rectangles. However, two aspects ofusing units of area need to be developed. Firstly, the students need experience inchoosing, locating and combining units of area into rows or columns in order to cover asurface. Secondly, the students need to develop strategies for quantifying how manysquare units fill a rectangle. Here their number strategy stage will have a significantimpact. This is summarised in the diagram below:
1 2 3 4 ... 9
9 � 5
5 10 15 ... 5
One to one counting Advanced counting Early multiplicative(Advanced Additive)
After a couple of experiences comparing the areas of rectangles, the students mayappear to see the significance of using a tessellating regular polygon as a unit ofmeasure. Research indicates that students tend to choose a unit that matches the shapeof the area they are finding, for example, they will measure a curvy shape with a curvyunit like beans. Get the students to trace around their feet and ask them to find out whohas the biggest footprint.
E
CA
AC
EA
AA
AM
AP
Teaching Number through Measurement, Geometry, Algebra and Statistics
12
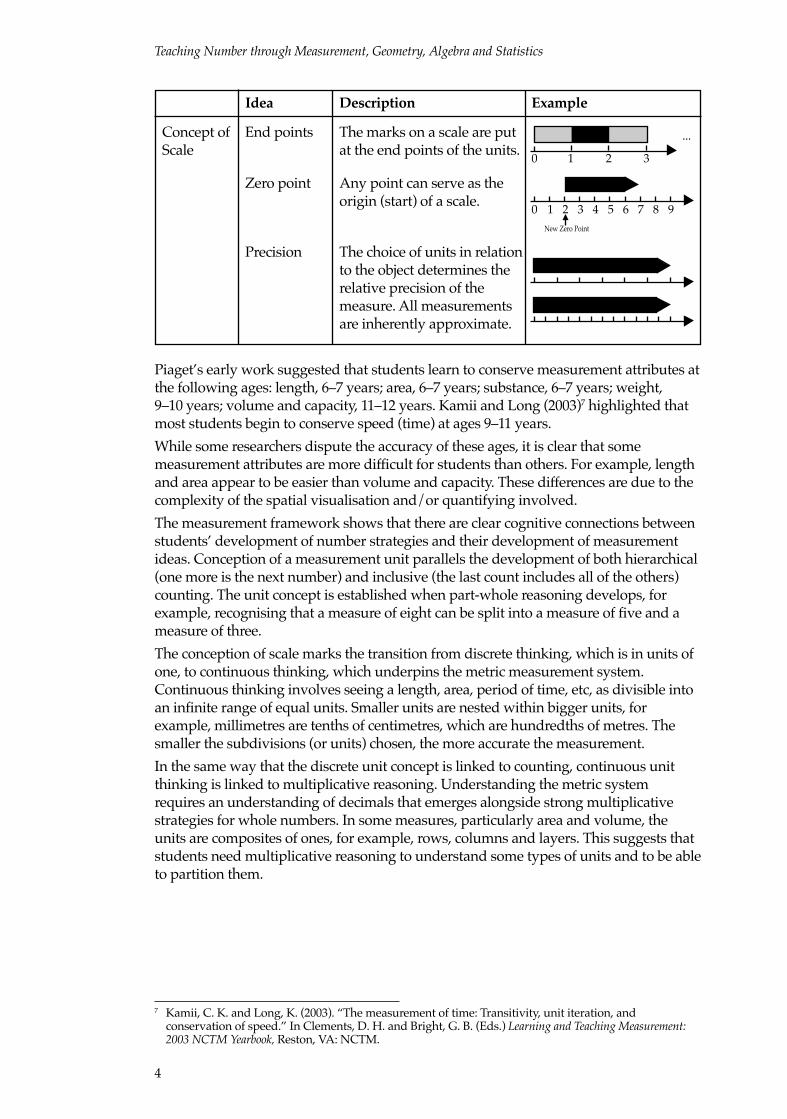
Let the students choose the units they wish to use to solve this problem. After exploringthe process of measuring with various units, discuss the implications for accuracy ofusing a unit that leads to gaps or overlaps (for example, counters). Discuss how to dealwith units that are part inside and part outside the shape.
Using non-tessellating units creates Using regular units creates accuracyinaccuracy through gaps and overlaps. issues through not fitting exactly.
Using Imaging
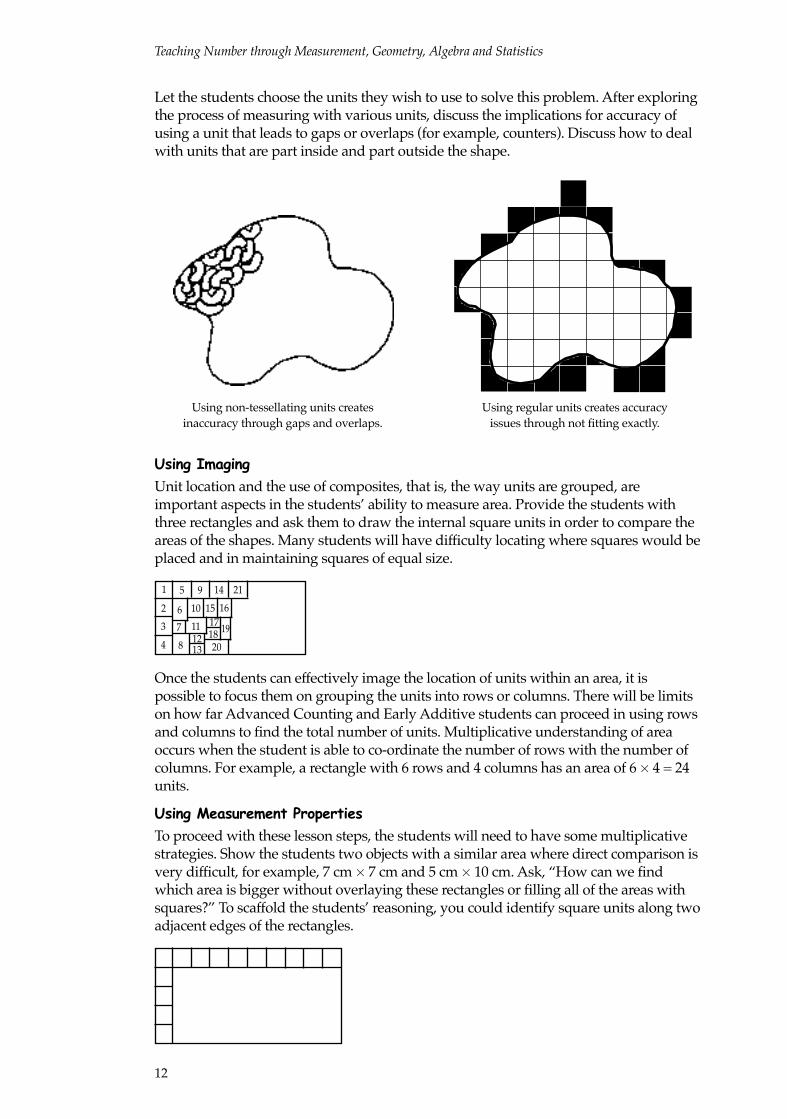
Unit location and the use of composites, that is, the way units are grouped, areimportant aspects in the students� ability to measure area. Provide the students withthree rectangles and ask them to draw the internal square units in order to compare theareas of the shapes. Many students will have difficulty locating where squares would beplaced and in maintaining squares of equal size.
Once the students can effectively image the location of units within an area, it ispossible to focus them on grouping the units into rows or columns. There will be limitson how far Advanced Counting and Early Additive students can proceed in using rowsand columns to find the total number of units. Multiplicative understanding of areaoccurs when the student is able to co-ordinate the number of rows with the number ofcolumns. For example, a rectangle with 6 rows and 4 columns has an area of 6 � 4 = 24units.
Using Measurement Properties
To proceed with these lesson steps, the students will need to have some multiplicativestrategies. Show the students two objects with a similar area where direct comparison isvery difficult, for example, 7 cm � 7 cm and 5 cm � 10 cm. Ask, �How can we findwhich area is bigger without overlaying these rectangles or filling all of the areas withsquares?� To scaffold the students� reasoning, you could identify square units along twoadjacent edges of the rectangles.
1
2
3
4
5
6
7
8 1213
9 14 21
10 15
11 171820
16
19

13
Teaching Number through Measurement, Geometry, Algebra and Statistics
The students who can locate units by imaging will apply their number strategies toquantify the units and express their strategies in additive or multiplicative statements,for example, 8 + 8 = 16, 16 + 16 = 32 (Early Additive stage).
Pose problems that require using standard measures of area, particularly square metres(m2) and square centimetres (cm2). It is worthwhile making paper templates of theseunits, which can then be laid out along the edges of different rectangles, for example,room floors or exercise book covers, if necessary.
Many students have difficulty taking the next step of using a ruler to determine howmany metres or centimetres are located along each side of a rectangle. This needsmodelling by actually showing the students how the square units are laid out along thesides of a rectangle and then measuring with a ruler.
Fitting In
I am learning to compare how much a box or container holds using a measurementunit.
Links to Other Strands
Geometry: tessellations, patterns of shapes that cover a surface with no gaps or overlaps(volume is a three-dimensional tessellation)forming nets of simple polyhedra, such as, cubes and rectangular prisms
Algebra: number sequences, for example, predicting, �A box has a base of 10 cubes,how high must it be to hold 200 cubes?�
Statistics: data handling, for example, �How much of a cereal box is cereal and howmuch of it is air?�
Required Knowledge
� The students will need some experience with measurement of area (twodimensions) before proceeding to volume. This should involve using arrays assuggested in Book 6: Teaching Multiplication and Division.
� Experience with using a unit in simpler measurement contexts such as length is alsoa useful prerequisite.
� The students will also need some experience with using unconventional units suchas cubes as well as conventional units, such as centimetres.
Equipment: A range of household boxes of similar volume but varying size, cubes(2 cm3).
Using Materials
Show the class three different-sized household boxes that have similar volumes (forexample, cereal boxes, cracker boxes). This helps develop the idea that spatialperceptions, for example, taller boxes hold more, can be misleading.
Tell the students that you want to find out which box holds the most cubes when theyare packed in �tight�. Ask, �Which box do you think holds the most cubes? Why?�Discuss ideas such as taller or shorter holds more and look at the more sophisticatedideas that volume involves length, width and height.
Divide the class into groups and, providing each group with a set of boxes and cubes,challenge them to find out which box holds the most cubes. Ask the students to record,using numbers, words and diagrams, how they solved the problem.
After a suitable period of investigation, bring the class back together to discuss theirideas. The students� methods will probably reflect their number strategies and spatialunderstanding, particularly their ability to image the location of cubic units.
E
CA
AC
EA
AA
AM
AP
E
CA
AC
EA
AA
AM
AP

Teaching Number through Measurement, Geometry, Algebra and Statistics
14
The different methods used could include the following:
The student puts cubes in the box randomly with noattempt to pack them or fill the entire space. This shows alack of realisation of the volume attribute or of a cube as aunit of measurement.
Count All
The student fills up the box with cubes one by oneand counts the cubes one by one.This shows recognition of the cubeas a measurement unit.
Advanced Counting/Early Additive
The student makes a column or row of cubesand finds out how many columns or rowsfit in the box.They are using skip-counting or addition factsto find the total number of cubes.
Advanced Additive and beyond
The student finds out how many cubesform a layer of the box.They use the number of layers in the box to quantifyhow many cubes are needed.
Advanced Additive and beyond
The student finds out the numberof cubes that fit along the length,width and depth of the box (threeedges), and multiplies these numbers.
Avoid making evaluative judgments about the strategies the students use but askquestions about the efficiency of their methods. For example, �Which way takes theleast work to do?� Be aware that the students may recognise the power of additive ormultiplicative based strategies but lack the number knowledge to make these viableways of quantifying the number of cubes.
Using Imaging
Show the students a different set of boxes. Tell them that they will need to decide whichbox holds the most cubes without filling the box up with cubes to check. Put thestudents into thinking groups of three or four to decide what information they would

15
Teaching Number through Measurement, Geometry, Algebra and Statistics
like to know that will help them work out which box holds the most cubes.
Invite the groups to share their ideas and record the information they want and, wherepossible, leave the physical model of the cubes in place. For example:
�How many cubes coverthe top/bottom of the box?�
�How many cubes fit upthe side of the box?�
�How many cubes fitalong the side of the box?�
Ask the students to go back into their groups to decide which box holds the most cubes.After an appropriate time, bring the groups together and record the strategies that wereused for each box. Use symbols and diagrams, for example:
Crunchie The student could solve thisCrackers by adding each layer:Box: 16 + 16 + 16 + 16 + 16 + 16 cubes = 96 cubes.
The student could use repeatedaddition to solve this:10 + 10 + 10 + 10 + 10 + 10 = 60;6 + 6 + 6 + 6 + 6 + 6 = 36;60 + 36 = 96 cubes.
Promote efficiency in the strategies the students are using. This will involve creatinglinks between counting, addition and multiplication.
Using Measurement Properties
Problems such as those below should be used with students who have sufficientaddition and/or multiplication strategies to cope.
Problem One�Rachel has 36 cubes. She wants to make a box to hold them all.How long could each edge of the box be?��Can she make many different-shaped boxes that will work?��Can she make a cube-shaped box to hold 36 cubes? Explain your answer.�
Problem Two�Here is a picture of Hemi�s box.How many cubes does Hemi�s box hold?��Hemi wants to make a new boxthat holds twice as many cubes.How long should he make the edgesof the new box?�
E
CA
AC
EA
AA
AM
AP
E
CA
AC
EA
AA
AM
AP

Teaching Number through Measurement, Geometry, Algebra and Statistics
16
Geometry Links to the Number Framework
Links between spatial reasoning and the Number Framework are less obvious than forthe other strands of the maths curriculum. This is partly because the progressions inspatial reasoning are less researched than those in number. Despite the lack ofresearched progressions, the importance of spatial reasoning is unquestionable. Highcorrelations have been found between students� spatial ability and their generalmathematical achievement.
Piaget and Inhelder (1967)8 argued that students did not learn geometry simply byreading their environment, rather they learnt it by acting on and manipulating theirenvironment. Clements and Battista (1992)9 suggested that geometric thinkingdeveloped through students using both measurement and transformation to act onobjects.
The quantifying measurement links to number have already been discussed in thisbook. Transformation means processes like reflection and rotation, partitioning andmoving, in which a shape is mapped onto itself or other shapes. These transformationsare an important way of establishing similarity and difference within and betweenshapes.
For example, folding an isosceles triangle in half will establish its line of symmetry andwhere interior angles are equal. Manipulating quadrilaterals through rotation, reflectionand translation so that they tessellate helps students to establish the conditions underwhich all quadrilaterals tessellate and to recognise the sum of interior angles as a fullturn (360°).
line ofsymmetry
angles are equal
a
a
a
cb
b
b
b
a c
c
c
d
d
d
d
8 Piaget, J. and Inhelder, B. (1967) The child�s conception of space. New York: W. W. Norton & Co.9 Clements, D. H. and Battista, M. T. (1992) �Geometry and Spatial Reasoning�. In D. A. Grouws (Ed.)
Handbook for Research on Mathematics Teaching and Learning. Reston, VA: National Council of Teachers ofMathematics, pages 420�464.

17
Teaching Number through Measurement, Geometry, Algebra and Statistics
One of the most accepted progressions in geometric reasoning was developed by Pierreand Dina van Hiele10. They described five increasingly sophisticated levels of thinkingabout shapes and space. In the framework below, an even more basic level has beenadded. This was not part of the van Hieles� original theory.
Level Title Description
0 Pre-Recognition The student is unable to identify and form imagesof many common shapes, and recognises only afew of a shape�s characteristics when classifyingit, e.g., he/she recognises curved or straight sidesbut cannot distinguish triangles from squares.
1 Visual The student recognises shapes by visualcomparison with other similar shapes rather thanby identifying the properties of the shapes.
2 Descriptive/Analytic The student classifies shapes by their properties,e.g., squares by four equal sides, four right angles,but does see relationships between groupings ofshapes, e.g., squares as kinds of rectangles.
3 Abstract/Relational The student classifies shapes hierarchically bytheir properties, i.e., accepts classes within classes,e.g., squares are special cases of rhombi. He/shededuces that one property implies another andreduces definitions to their simplest form, e.g., aquadrilateral with pairs of parallel sides musthave opposite sides of equal length.
4 Formal Deduction The student is able to operate logically onstatements about geometric shapes, solveproblems and prove new results from thesestatements.
5 Rigor/Mathematical The student is able to construct formalmathematical systems that elaborate on andcompare relationships without reference tomodels of the geometric shapes involved.
For students within the schooling system, levels 0�4 of the above framework of thinkingare the most relevant. In fact, most researchers agree that the goal of secondary schoolgeometry instruction should be to have students achieving level 2 and 3 reasoning(Clements and Battista, 1992). Early geometry instruction should be devoted toexploring and classifying shapes through measurement and transformation.
In applying the van Hiele levels, it is important to recognise generally that reasoningwith two-dimensional shapes, like squares and circles, is easier than reasoning withthree-dimensional shapes, like cubes and spheres.
10 Van Hiele, P. M. (1959/1985) �The child�s thought and geometry�. In D. Fuys, D. Geddes, and R.Tischler (Eds.) English Translations of Selected Writings of Dina van Hiele-Geldof and Pierre van Hiele.Brooklyn, NY: Brooklyn College, School of Education. (ERIC Document Reproduction ServiceNo. 289 697), pages 243�252.

Teaching Number through Measurement, Geometry, Algebra and Statistics
18
The introduction of this book suggests that a teaching model that emphasises highquality imaging of materials and actions on materials is likely to develop students�spatial reasoning. There is also an extent to which spatial reasoning helps informstudents� number thinking. Two examples are given below:
15
?
6
knife 10
In both cases, the spatial representation informs the numeric reasoning. The knifeproblem explicitly shows how one of the factors in a multiplication can be distributed.The proportional reasoning problem, involving two overlapping similar (in shape notsize) rectangles, gives reference to the scale factor that has been used to map onerectangle onto the other. Compare these images with the equivalent numericrepresentations: 6 � 3 = (4 � 3) + (2 � 3) and 10 : 15 = □ : 6?

19
Teaching Number through Measurement, Geometry, Algebra and Statistics
Learning Experiences to Develop Students’Reasoning in Geometry
This section develops lesson scenarios in which both measurement and transformationare used to help students develop geometric reasoning.
Constructing Shapes Using Triangles
I am learning to construct and name shapes made by joining triangles.
Links to Other Strands
Fractions (including equivalent fractions)
Using a systematic approach to count all possible outcomes (probability andmathematical processes)
Required Knowledge
� Read and model the fractions, , , , , , ...
� Name simple polygons, for example, �triangle�, �square�, �rectangle�
� Describe shapes using the language of geometry � �sides�, �corners�, etc
� Know vocabulary � �regular polygon�, �equilateral triangle�
Equipment: Geometric shapes, such as pattern blocks or attribute blocks.
Using Materials
Select the equilateral triangle from the set of shapes. Tell the students that they are goingto explore what polygons can be made using the triangle as a base.
�Using three equilateral triangles, how many different shapes can you make?� (Eachtriangle must share a side with another triangle, rather than a point.) �Name the shapeas you make it.� (For example, �trapezium�.) �Now using four triangles, see how manydifferent shapes you can make.�
Get the students to record their solutions in a table like the one shown below.
Number of Number of different Shapes made andtriangles used shapes made pictures of those shapes
3 1 trapezium
4 3 hexagon triangle
parallelogram
You will need to discuss with the students the meaning of �different� in this case.Shapes will be considered different if they do not map onto themselves by reflection orrotation. For example, the following shapes may appear different, but they are actuallyreflections and rotations of one another.
Once they have found all the possible shapes for four triangles, ask the students topredict how many shapes can be made using five and then six triangles. Ask the
E
CA
AC
EA
AA
AM
AP
12
14
13
15
16

Teaching Number through Measurement, Geometry, Algebra and Statistics
20
E
CA
AC
EA
AA
AM
AP
students if there is a pattern in the number of shapes that can be made. Encourage themto approach the problems systematically. For example, to find the different five triangleshapes they could consider all the four triangle shapes and where the extra trianglecould be put to form a new shape.
A
4 triangle shape Joining the extra triangleto any side gives this shape.
B C D
4 triangle shape Joining to sides 1 or 4 Joining to sides 2 or 5 Joining to sides 3 or 6gives this shape. gives this shape. gives this shape, which is
the same as A above
E F G
4 triangle shape Joining to sides 1 or 2 Joining to sides 3gives this shape. or 6 gives this
shape, which is the Joining to side 4 gives A,same as C above. to side 3 gives C.
Using Imaging
Using a set of pattern blocks, investigate the fractional relationships between theshapes. Give the students the shapes below and ask them to imagine whether eachshape can be cut into congruent (identical) halves, thirds, quarters, fifths or sixths. Askthe students to explain why or why not the partitioning will work. Their explanationsshould involve ideas of symmetry, particularly reflective symmetry.
It is good to repeat the fractioning task with other shapes, for example, pentagons andoctagons, including shapes that have more limited symmetry. This will help thestudents to generalise the process of finding whether a shape can be partitioned intogiven fractions.
For example, to divide a shape into sixths requires the shape to be halved, then eachhalf divided into thirds.
Reverse the problems to develop part-to-whole fractional reasoning. For example:�If this piece (below) is one-sixth of a shape, what was the shape?�
so or or
Be aware that these types of problems have multiple solutions.
16
4
12
3
5
6
41
2 3
56
4
12
35
6

21
Teaching Number through Measurement, Geometry, Algebra and Statistics
Using Number and Geometry Properties
Use the shapes to create fractions for fraction problems. For example:
�What fraction of the trapezium is the triangle?�
�What fraction of the hexagon is the trapezium?�
�If you know these two things, what fraction of the hexagon must a triangle be?�
is of and is of
so is ? of
Create other larger shapes that the students are less familiar with so that they have toapply number properties to solve the problems. For example:
�What fraction is the triangle of the trapezium?�
�What fraction is the trapezium of the parallelogram?�
�Therefore, what fraction is the triangle of the parallelogram?�
Note that this last can be written as � = since the triangle is one-third of thetrapezium, which is one-quarter of the parallelogram.
Related Activities
Take a shape, for example, a trapezium, and ask, �If this shape were 20% of anothershape that I have hidden, what could my hidden shape look like?� �What shape(s) canbe made? How many different solutions are there? How do you know that you havegot them all?�
Investigate the link between the lines of symmetry a shape has and what congruentfraction pieces it can be cut into. For example, �A regular hexagon has six lines ofsymmetry and can be cut into halves, thirds, quarters, sixths and twelfths but not intofifths, eighths or ninths. Why is this?� Note that six lines of symmetry divide thehexagon into 12 parts, so the possible fractions have denominators that are factors of 12.
13
12
13
14
112
E
CA
AC
EA
AA
AM
AP

Teaching Number through Measurement, Geometry, Algebra and Statistics
22
By the same reasoning, a regular pentagon has five lines of symmetry that divide thefigure up into 10 equal pieces. Therefore a regular pentagon can be divided into halves,fifths and tenths, since 2, 5, and 10 are the factors of 10.
Angle Detector
I am learning to understand angles by relating them to turns, and I can measureangles in degrees.
Links to Other Strands
Number: fractional numbersmultiplicative and proportional reasoning
Measurement: interpreting scales
Required Knowledge
� Identify fractions of shapes
� Clockwise, anticlockwise rotations
� Addition strategies with numbers to 1000
Equipment: �PacMan� Material Master 8�7, protractors, measuring tape, Multilinkcubes.
Using Materials
The angle estimator (or �PacMan�) is a useful piece of equipment to use to explorefractions. It is a regions model. The students can show you fractions like one-quarter.Remember to ask about the other colour on the �PacMan� and what fraction thatrepresents: �So if one fraction is one-quarter, the other part is what?�(three-quarters)Note that in a full turn the fractions add to 1.
Have the students work in small groups to discuss what an angle is. Get each group toshare their ideas. The students may have four different ways of viewing an angle:
� The area between two lines (or space between the lines)
� The corner of a two-dimensional figure or where the lines intersect
� The two lines
� An amount of turn (This view underpins the others as it leads to degrees andstandard units.)
E
CA
AC
EA
AA
AM
AP
4
12
3
5
6
4
1
2
3
5
6
9
12
11
10
8
7

23
Teaching Number through Measurement, Geometry, Algebra and Statistics
The concept of an angle needs to be introduced as an amount of a rotation (turn). Thefollowing activity will help the students realise that the area between the lines is not therelevant feature when comparing angles.
Ensure that a variety of �PacMan�s with different circle sizes are available.
Ask the students to show one-third on the �PacMan�. In groups, discuss what is thesame and what is different about what is shown on the �PacMan�s of different sizes.List the similarities and differences:
Same DifferentFraction AreaTwo lines meet Length of the linesTurn Size of circle
Repeat this for other fractions, such as three-quarters and two-fifths, to establish that thesimilarities and differences are independent of the fraction. It is through anticipating theaction that the students will recognise an angle is about the amount of turn.
Ask the students to form an angle on their �PacMan�. Ask, �What will you need to do tomake the smallest angle bigger?� (rotate one circle). Model this with two rulers to showthat turning increases the angle. After a few experiences with increasing and reducingthe angle, list the features of a �PacMan� that change and stay constant under turning:
Change Stay ConstantFraction Point where lines meetArea between lines Size of circleAngle Length of lines
Link �PacMan� turns with body turns. Have the students face a particular point in thedirection of North (either in the classroom or outside) as a reference direction. Askquestions like, �If you did a quarter turn this way (clockwise), what other turn couldyou do that would finish with you facing the same spot?�(that is, a three-quarter turnanticlockwise). Have the students replicate the turns using their �PacMan�. Try otherclockwise and anticlockwise turns, such as two-thirds and one-fifth. This activity alsofocuses on the idea that there are two angles (turns) that make up a full turn. The�PacMan� also demonstrates this with the two colours showing two fractions. Forexample:
We could be interestedin this angle ... or we could be
interested in this angle.
Move into looking at turns greater than one rotation if the students show a clearunderstanding of the first part of the activity. For example, make a 1 turn clockwise.
Get the students to create an angle tester by folding a circle into quarters and markingthe creases. Ask questions like, �If I am standing at the centre of the circle facing North,what turn would I need to make in order to face the next line on my circle?� (a quarterturn).
Say that the angle that has been made has a special name, a �right angle�. Fold the circleso that only one quarter is showing and you have a right angle.
E
CA
AC
EA
AA
AM
AP
12

Teaching Number through Measurement, Geometry, Algebra and Statistics
24
This quarter circle can then be used as an angle tester. It tests whether an angle isgreater than, less than or equal to a right angle. The students can go around the roomclassifying items into these three groups, using their angle tester. Discuss why rightangles are so common in buildings.
Using Imaging
Show the students an angle on the �PacMan� that can not bemeasured in an exact number of right angles, for example, 135°.Ask, �How many right angles would fit in each angle of the�PacMan�?�
The students may suggest that more divisions are required toaccurately determine the angle size, with answers like, �It�s oneand a half right angles.�
The students might then fold their angle tester in half again, creating eight divisions.
Invite them to name the new unit. It could simply be called �half a right angle�, orpreferably an �eighth turn� since eight turns like that form a full turn. The studentscould then try and find items in the room that have a one-eighth angle in them.
Ask the students to draw angles that could not be measured exactly using the one-eighth angle. Ask, �How small will the angle tester need to be to measure theseangles?� The key idea is that increasingly small partitions result in more accuracy butmay still not mean that the angle could be measured exactly.
Once the students have explored this idea, they are ready to be introduced to thestandard unit of the degree.
Using Geometric Properties
Give the students a protractor and ask them to work out how angles could be measuredusing the device. Discuss some benchmark angle measures such as the right angle,which measures 90°. Get the students to use this information to work out the measureof a half turn (180°), full turn (360°) and one-eighth turn (45°).
The students may use a variety of mental number strategies to solve such problems. Forexample:
To find a half turn and full turn, measure:
(90 + 10) + 80 = 180, 180 + 180 = 400 � 40 = 360 (Early Additive and Advanced Additivestages).
To find an eighth turn, measure: 90 ÷ 2 = 45 because 45 + 45 = 90.
The students may like to investigate the origin of this division of one turn into 360°from the history of ancient Babylonia.
Pose more challenging problems that require the use of multiplicative reasoning. Forexample, �What is the measure of a one-third turn, a one-sixth turn, a two-fifths turn?�Encourage the students to use their mental strategies, for example,360 ÷ 5 = (360 ÷ 10) � 2 = 72° (Advanced Multiplicative stage). The students can check
E
CA
AC
EA
AA
AM
AP

25
Teaching Number through Measurement, Geometry, Algebra and Statistics
their calculations by forming the angles on their �PacMan�, using a protractor, andvisually checking their accuracy. This will involve ideas of fractions and symmetry. Forexample, a one-sixth angle can be checked by realising that three one-sixth angles forma half turn.
Give the students a paper circle and tell them to create their own simple protractor withkey benchmark angles marked on it. Focus on discussing the mental calculationstrategies for working out the measure of each benchmark angle.
The students might use their knowledge The fifths measure is more difficult forof 180° to calculate the angle measure of the students to calculate as there is not aa one-sixth turn, that is, 180 ÷ 3. known angle that the students can use.Strategies to solve this could include: Strategies may include:
(a) (3 � 50) + (3 � 10) = 150 + 30, (a) (5 � 80) = 400, 400 � 40 = 360 so eachso the angle is 50 + 10 = 60° angle is 72°
(b) 3 � 6 = 18 so 3 � 60 = 180° (b) (5 � 60) = 300, 5 � 10 = 50, 5 � 2 = 10,so each angle is 60 + 10 + 2 = 72°
For the students who have a good number knowledge, extend this sequence ofquestions to angles past 360°. For example:
�Describe a 540° turn in a different way.�
�If an object is rotated 1080° by turning the object three times, what three turns couldhave been made?�
Related ActivitiesDiscuss the �straight angle� (180°). Link the angles between 0 and 180 to the angle sumof a straight line.
C 40°
�If one angle is 40°, how many degrees is angle C?�
E
CA
AC
EA
AA
AM
AP
180
360 0
90270
�How do youfind of 90?�1
2
�How could youfind this value?(a) Add 45 to 90?(b) Add 90 to 45?�(c) Subtract 45 from 180?�
Teaching Number through Measurement, Geometry, Algebra and Statistics
26
Investigating Polygons
I am learning to find the sum of the interior angles of a polygon and each interiorangle of a regular polygon.
Links to Other Strands
Algebra: recognising the rule for a pattern and generalising; interpreting formula
Number: using multiplicative strategies
Required Knowledge
� Recall multiplication facts to 10 � 10 and the corresponding division facts
� Vocabulary � �polygon�, �regular polygon�, �equiangular�, �equilateral�
Equipment: Polygon shapes, for example, pattern or attribute blocks, protractors.
Using Number Properties
The students would need to have completed the activity �Inside Out�, Figure It Out,Geometry, levels 3�4, page 5 before this lesson. This activity explores the angle sum oftriangles and rectangles through hands-on exercises, with the students ripping off thecorners of a triangle and rearranging the pieces to form a straight line. Students who donot have the concept of an angle as a turn will struggle to see the relationship betweenthe corners meeting and the angle sum of 180°, also known as a half turn.
The students might also tessellate with equilateral triangles and notice that threeinterior angles make a half turn. This generalisation is more difficult for other types oftriangle since rotation about the mid-points of sides is required for triangles to tessellatein general. The students might investigate this with cardboard copies of scalenetriangles. They may note that for the tessellation to work, each angle must be usedaround a point twice.
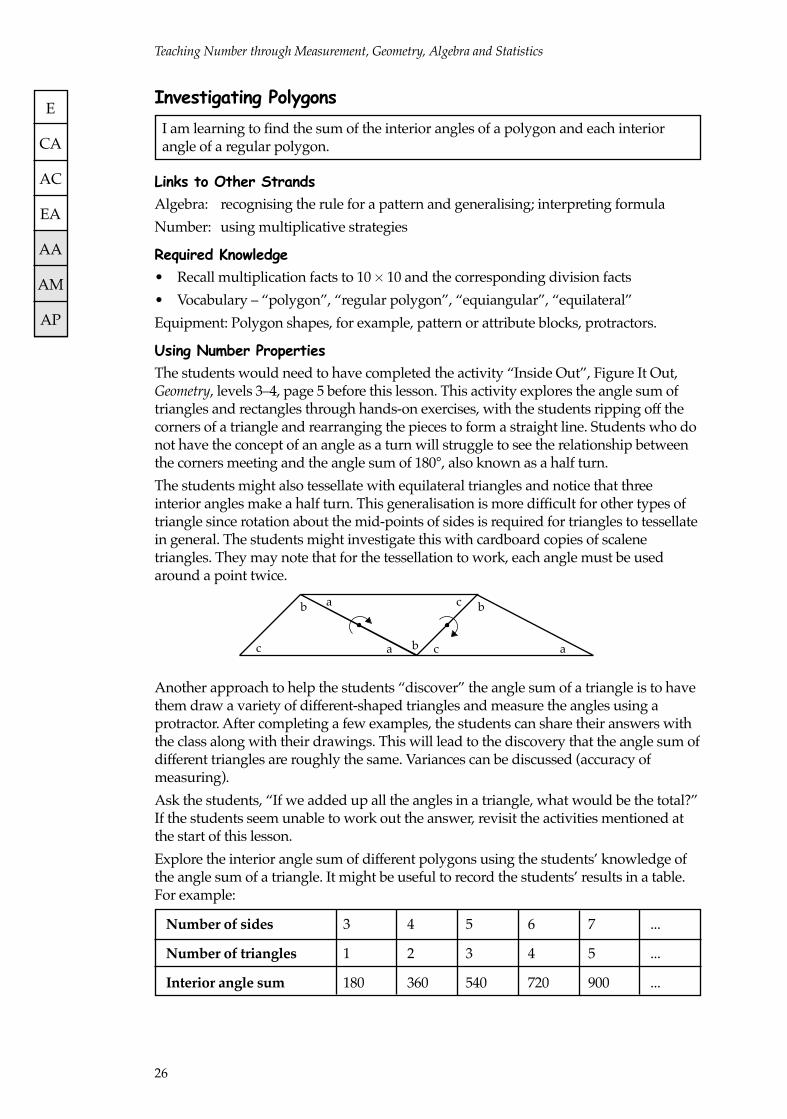
Another approach to help the students �discover� the angle sum of a triangle is to havethem draw a variety of different-shaped triangles and measure the angles using aprotractor. After completing a few examples, the students can share their answers withthe class along with their drawings. This will lead to the discovery that the angle sum ofdifferent triangles are roughly the same. Variances can be discussed (accuracy ofmeasuring).
Ask the students, �If we added up all the angles in a triangle, what would be the total?�If the students seem unable to work out the answer, revisit the activities mentioned atthe start of this lesson.
Explore the interior angle sum of different polygons using the students� knowledge ofthe angle sum of a triangle. It might be useful to record the students� results in a table.For example:
Number of sides 3 4 5 6 7 ...
Number of triangles 1 2 3 4 5 ...
Interior angle sum 180 360 540 720 900 ...
E
CA
AC
EA
AA
AM
AP
b
b
b
c
a
a ac
c

27
Teaching Number through Measurement, Geometry, Algebra and Statistics
Put two triangles together (as shown).�What shape do we have here?What is the sum of the interior angles of the quadrilateral?�
The students may use a variety of strategies to solvethe problem. Possible solutions may be:
(a) 6 � 60 = 360
(b) 180 + 180 as 200 + 200 = 400, 400 � 40 = 360
(c) 120 + 120 + 120 = 360
The final solution could be verified by marking the corners of any quadrilateral, tearingthem off and placing them together around a point.
�What happens if you use a different-shaped triangle asyour base? Does this affect the original answer?� (No)
�Make a pentagon using any shaped triangle as a base.
What is the sum of the interior angles of your pentagon?�
Encourage the students to use their mental numberstrategies to solve angle sum problems. Possible solutionsfor the pentagon might be:
(a) 360 + 180 or 400 + 140 = 540 (by taking 40 from 180 and adding it to 360 to make 400)
(b) 360 + 180 or 400 + 140 (by adding the hundreds together and then the tens)
(c) 360 + 180 = (4 � 90) + (2 � 90) = 6 � 90 = 540 (common factors of 90°)
�Is there a way to work out the interior angle sum for a dodecagon? (12-sided figure)Are you able to use the other results to help you do this?�
The students may notice that adding an extra side to the polygon is equivalent toadding another triangle. For example, this means that the sum of the interior angles of ahexagon is 180° more than that of a pentagon. The students could use this �adding on�idea to extend their table of interior angle sums for shapes until they find the angle sumfor a dodecagon.
Number of sides 3 4 5 6 7 8 9 10 11 12
Number of triangles 1 2 3 4 5 6 7 8 9 10
Interior angle sum 180 360 540 720 900 1080 1260 1440 1620 1800
The students with strong multiplicative strategies may look for a predictive rule thatlinks the number of sides with the angle sum. These students may express theirfindings in word rules, for example, �Take two off the number of sides and multiply by180 to get the sum of the angles.� This can be written algebraically as s = 180 (n � 2),where n is the number of sides and s is the angle sum in degrees.
Ask the students to use the information from the angle sum table to draw a trianglewhere all the angles are equal (an equilateral triangle). Encourage them to discuss ingroups how they solved this problem. Their solutions will involve division, that is,180 ÷ 3, to find the measure of each interior angle in degrees.
Then ask the students to draw a square and a regular hexagon. Have them share theirstrategies for solving how to draw these shapes, in particular their division strategies.Ask the students to think about what a regular pentagon looks like and to draw it ontheir desk with their finger. Ask them to estimate the size of each angle in degrees.
60°
60°
60°
60°
60°
60°
E
CA
AC
EA
AA
AM
AP

Teaching Number through Measurement, Geometry, Algebra and Statistics
28
�What do you notice about the angle size as you progress from the triangle to square topentagon?� Have the students extend their table to include a row headed �Interiorangle of regular polygon�.
Number of sides 3 4 5 6 7 8 9 10 11 12
Number of triangles 1 2 3 4 5 6 7 8 9 10
Interior angle sum 180 360 540 720 900 1080 1260 1440 1620 1800
Interior angle ofregular polygon 60° 90° 108° 120° 128 ° 135° 140° 144° 147 ° 150°
Pose problems like, �Draw a regular polygon with 20 sides of 5 centimetres,� and askquestions like, �Why can�t the interior angles of any regular polygon, no matter howmany sides it has, be greater than 180°?�
Related Activities
The following activities use regular polygons to explore tessellation and rotationalsymmetry. The shapes need to be available for the students to manipulate.
(a) �Choose one regular polygon. Does this polygon tessellate by itself? Which otherpolygons will tessellate by themselves? Such tessellations are called regulartessellations.� Refer the students to the activity �Tiling�, Figure It Out, Geometry,levels 3�4, page 6. Discuss why these tessellations work (side lengths are the sameand the angles meeting at each vertex total 360°).
(b) See also the Assessment Exemplar for Mathematics, Geometry (hard copies areavailable in school or through TKI).
(c) �Which different regular polygons will tessellate together?� For example, �Doequilateral triangles and squares tessellate with each other? How manycombinations are there using two different regular polygons each time?�
(d) �Can you tessellate using more than two different regular polygons? Why/Whynot?�
Explore rotational symmetry with the regular polygons. Classify shapes according totheir order of rotational symmetry and the number of lines of reflectional symmetry. Forexample, a regular hexagon has six lines of reflective symmetry and rotationalsymmetry of order 6. This means that it maps onto itself six times in a full turn.
(a) Tell the students to create shapes/patterns that have certain types of symmetry. Forexample, �Make a shape that has rotational symmetry of order 4.� Computersoftware can be used to create an element, copy it, and rotate the copies by quarterturns. For example:
311
47
1
2
3
2
1
3
5
4
6
1
6
2
4
3
5
4
5
660°
E
CA
AC
EA
AA
AM
AP

29
Teaching Number through Measurement, Geometry, Algebra and Statistics
(b) Provide shapes/patterns and ask the students to add to them to match a givenstatement. For example, �Add to this shape so that it has rotational symmetry oforder 3.�
�Add to this shape so that it has �Complete this grid so that itrotational symmetry of order 2.� has rotational symmetry of order 4.�
The students should be encouraged to create their own problems, which they can thenexchange with other students in their group.
(c) The students explore the link between the order of rotational symmetry and thenumber of degrees in a circle. This will involve proportional reasoning. To create afigure with rotational symmetry, an element is created then rotated of 360 = 60°.
Use the properties of the interior angles meeting at a point to see what happens if theangles do not total 360°. For example, try putting three squares together around a point.If you do this on a two-dimensional shape, it leaves a gap, but if you introduce a thirddimension and make a cube, the sides can meet.
gap
Putting three triangles together around each corner results in a tetrahedron, fourtriangles around each corner results in an octahedron and five triangles around eachcorner results in an icosahedron (20 faces). �What would be the recipe for adodecahedron (a solid with 12 pentagonal faces)?�
E
CA
AC
EA
AA
AM
AP
16
ab
a
b
60°

Teaching Number through Measurement, Geometry, Algebra and Statistics
30
Algebra Links to the Number Framework
There is on-going debate among mathematics educators as to what algebra is and atwhat point students start learning algebra. It is clear that when students aremanipulating expressions and equations that contain letters and operational symbols,such as, 7p2 � 6 = q, they are working in the realm of algebra. Of more interest from ateaching perspective is what learning experiences help students to make sense ofalgebra.
Modern approaches to teaching algebra use either geometric, numeric or measurementcontexts to generate relationships. For example, students might look at how the numberof pumps affects the circumference of a balloon as it inflates (measurement) or howmany square tiles are needed to make each successively larger square (geometry). Thecentral theme of both these approaches is the development of an idea of relative change.
Traditional algebraic tasks, such as evaluating 2x + 5 = 29, create the perception thatletters represent �numbers in disguise�. In this case, x is a specific unknown, 12.However, the real power of algebra lies in its ability to elegantly describe generalisedrelationships between variables and how these variables change relative to one another.For example, c = � d describes how the circumference of a circle (c) changes as itsdiameter (d) changes (� is a fixed number, 3.14...). This relationship applies to all circles.It is the all feature that makes algebra such a powerful thinking tool. Some letters havestandardised use as variables, for example, a for area, b for base, h for height in theformula for the area of a triangle: a = bh.
The number strategies that students bring to algebraic instruction affect the students�ability to recognise and describe relationships between variables. For example, considerthe situation where students have been provided with fraction circle pieces and askedto make three-quarters of a circle using identical pieces each time. The students producethese models:
The teacher asks the students to describe what patterns they notice in the symbols forthe equivalent fractions of . Some students note that the numerators of the fractions areincreasing by threes, 3, 6, 9, while the denominators are increasing by fours, 4, 8, 12.These students are applying additive thinking, which, while correct, is insufficient forthem to be able to generalise the relationship between the numerator and denominatorof all fractions equivalent to .
To extend the students� thinking, the teacher asks them to write another fraction that isequivalent to . The additive thinkers write fractions like and by extending theiradd three and add four rules for the numerator and denominator. Students who preferdoubling write fractions like and . By contrast, the students with multiplicativestrategies write fractions like and . Their explanations are multiplicative, forexample, �If you divide the numerator by 3, then multiply the answer by 4, you get thedenominator.� These students are providing a generalised statement about all fractionsthat are equivalent to .
12
34
912
68
1216
1520
75100
3040
1824
3648
34
34
34
34

31
Teaching Number through Measurement, Geometry, Algebra and Statistics
This teaching and learning activity is both number and algebra. It is the generalisationthat makes the activity algebra, that is, finding a general rule that applies to all fractionsthat are equivalent to .
The table below links strategy stages of the Number Framework with the generalisationof sequences and patterns. This is the teaching approach to algebra advocated inMathematics in the New Zealand Curriculum. Note that attention to spatial or physicalattributes can help students learn about the nature of the number relationships. Attimes, however, it can complicate the algebra teaching point by distracting the learnerwith too much information.
NumberStrategy Sequences andStages Patterns Example
Count Continue a simpleAll pattern of objects
and find the numberof objects, usingone-to-one counting
Advanced Continue simpleCounting patterns of objects
and find the numberof objects bysystematic countingin groups
Early Continue patternsAdditive of objects and
predict the numberof objects in anextension of thepattern, usingrepeated addition orsystematic counting
Advanced Anticipate theAdditive number of objects in
extensions ofpatterns, usingmultiplicativestrategies for linearpatterns andadditive strategiesfor more complexpatterns
Advanced ReverseMultiplicative multiplicative rules
to anticipate howmany elements of alinear pattern can be . . .built with a givennumber of objects
Advanced Use and manipulate Folding paper strips in half repeatedlyProportional multiplicative rules
for linear patternsand recognisepatterns indifferences and Folds 1 2 3common ratios Creases 1 3 7between members Sections 2 4 8of sequences Number of sections is 2 to the power of number of folds.
Note that the use of letters to express generalisations is neither recommended nordiscouraged. Some research indicates that young students are able to use letters withunderstanding given appropriate instruction. Teachers should feel free to use letters if
34
You have 102 sticks. 1 mountainuses 6 sticks. 102 � 6 = 96.Each additional mountain uses4 sticks. 96 ÷ 4 = 24. 24 + 1 = 25,so 25 mountains were made.
8
2219
10 12
1814
20
6
21
4
16
2
8
7
910
11
12
1314
5
6
3 4
1
2
22 +4 +4 +4 +4 +4
6 +4 +4 +410 mountains take6 + (9 � 4) sticksor (10 � 6) � (9 � 2) sticks

Teaching Number through Measurement, Geometry, Algebra and Statistics
32
they feel it will assist their students to communicate ideas. Algebraic thinking isembedded in part-whole number strategies, and the use of letters to describegeneralisations is entirely appropriate for students at the higher stages of theframework.
The following table provides descriptors of algebraic thinking derived from generalisedarithmetic for stages of the Number Framework.
NumberStrategyStages Generalised Arithmetic Examples
Advanced The student recognises that The student knows that the totalCounting counting the objects in a set number of objects is the same no
tells how many. matter which order the objects arecounted in and solves additionproblems by counting on from thelargest number,e.g., 4 + 9 as 10, 11, 12, 13.
Early Additive The student recognises that The student solves addition andtwo or more sets can be subtraction problems byredistributed without reorganising known facts,changing the total number e.g., 8 + 7 as 7 + 7 + 1 or 9 + 6 = 10 + 5.of objects. The student can write appropriate
problems where these strategiescould be used.
Advanced The student states The student can find multipleAdditive generalisations in words, solutions to equations with related
symbols and/or letters that unknowns, e.g., 567 + = 570 +apply to statements involving or � 48 = � 50, and can makeaddition and subtraction. generalised statements, using words
or letters about the numbers in theboxes, e.g., 567 + �number� = 570 +�3 less than number�,or, q � 48 = (q + 2) � 50.
Advanced The student states The student can find multipleMultiplicative generalisations in words, solutions to equations with related
symbols and/or letters that unknowns, e.g., 12 � = 4 � ,apply to statements involving or, ÷ 20 = ÷ 2 ÷ 5, and canmultiplication and division. make generalised statements, using
words or letters, about the numbersin the boxes, e.g., 12 � j = 4 � (3 � j),or, k ÷ 20 = k ÷ 2 ÷ 5.
Advanced The student states The student can find multipleProportional generalisations in words, solutions to equations with related
symbols and letters that apply unknowns, for example, = ,to statements involving or, � 12 = 12 ÷ , and canfractions, ratios and make generalised statements, usingproportions. words or letters about the numbers
in the boxes, e.g., a � b = 36, or, z =
12
4
9
1y

33
Teaching Number through Measurement, Geometry, Algebra and Statistics
Learning Experiences to DevelopStudents’ Reasoning in Algebra
The lessons that follow are examples of algebra teaching aimed at getting students touse generalised thinking. Both geometric and arithmetic patterns are illustrated asvehicles for teaching and learning algebra.
Thinking Ahead
I am learning to copy and extend a repeating pattern and use number strategies tothink ahead.
Links to Other Strands
Geometry: naming shapes and describing their features
Number: sequences of ordinal numbers, 1st, 2nd, 3rd, 4th, ...repeated sequences of numbers, like multiples, for example, 0, 5, 10, 15, 20,and odd numbers, that is, 1, 3, 5, 7, ...
Required Knowledge
� Vocabulary to describe objects, for example, �triangle�, �square�, �blue�, �large�
� One-to-one matching for copying the pattern
� Skip-counting for prediction
Equipment: Attribute blocks, pattern blocks, novelty counters (for example, teddies,fruit, dinosaurs), repeating pattern sheets, Material Master 9�3.
Using Materials
Provide the students with repeating patterns made with the equipment. For example:
. . .
Ask the students to copy the pattern and, if successful, extend it further. Discuss howthey decided which object came �next�. Reciting the sequence of shapes can help, forexample, �Circle, triangle, circle, triangle, circle, ...�
Vary the difficulty of the patterns by:
(i) increasing the number of objects in the repeating element, from two to three to four,etc. objects. For example:
. . .
(ii) increasing the number of variables in the pattern, from one to two to three variables,for example, shape and colour; shape, colour and size.
. . .
E
CA
AC
EA
AA
AM
AP

Teaching Number through Measurement, Geometry, Algebra and Statistics
34
Note that increasing the number of variables makes a marked difference to the difficultyof continuing the pattern. It is also important to ensure that enough members of thesequence are available initially so that the pattern is discernable (for patterns ofnumbers at least four numbers are needed). Reciting the word sequences can also help,but there will be separate sequences for each variable, for example, �Triangle, square,circle, hexagon, triangle, ...,� and, �Black, grey, white, black, ...�. Get the students tobuild patterns for other students to copy and continue.
Using Imaging
Use the repeating patterns sheets (Material Master 9�3) as a base to build the repeatingpatterns on. For example:
1 2 3 4 5 6 7 8
Ask the students to predict what shape will be in different terms of the sequence, forexample, �What will be the fifteenth shape? ... the twenty-third shape? ...�. Encouragethe Advanced Counting students to use skip-counting strategies to find the shaperather than resorting to building the pattern and using one-to-one counting. For thepattern above, the students may recognise that it repeats in blocks of three shapes. Soshapes 3, 6, 9, 12, 15, ... will all be circles. Get the students to create patterns for others topredict. The students could draw these patterns and add them to a collection of patternpuzzles for future use.
Using Algebraic Properties
Provide examples of sequential patterns without the support of the repeating patternsheets and ask the students to solve predictive problems involving ordinal numbers.For example:
. . .
�What will be the seventeenth shape?�
Sticky Moments
I am learning to use my number strategies to predict how many objects will beneeded to make a pattern.
Links to Other Strands
Number: multiplication as repeated addition (See Book 6: Teaching Multiplicationand Division, pages 2�11.)
Geometry: symmetric patterns that involve translation, for example:
E
CA
AC
EA
AA
AM
AP

35
Teaching Number through Measurement, Geometry, Algebra and Statistics
Required Knowledge
Students need to be able to:
� continue a repeating sequential pattern
� describe shapes using the vocabulary of geometry, for example, �triangle�,�rectangle�
� solve arithmetic problems using advanced counting at least.
Equipment: Nursery sticks, iceblock sticks, or matchsticks.
Using Materials
Show the students this geometric pattern of fish made with nursery sticks, iceblocksticks or matchsticks.
Ask the students to find out how many sticks were needed in total to build the 5 fish.Discuss the strategies they used to solve this problem. Strategies will range from one-to-one counting to using �chunks� of the pattern to simplify the counting, for example, theinterior diamonds take 4 sticks each, 5 � 4 = 20 sticks, and the fins and tails take6 � 2 = 12 sticks. Ask the students to work out how many sticks would be needed tomake 20 fish in this pattern. Provide them with sticks, should they be needed, but donot encourage the students to physically build the pattern.
After an appropriate time, ask the students to share their strategies in small groups. Thestrategies might include:
(i) Building and systematic counting(Students up to the Advanced Counting stage will tend to use these strategies.)
(ii) Recursive, Additive(Students at the Early Additive stage tend to use these strategies.)
. . .
8 + 6 + 6 + 6 + . . .
(iii)Ratio(This is a signal that the students are using multiplicative reasoning. However, it isan incorrect strategy.)
5 fish take 32 sticks, so the reasoning follows that 20 fish take 4 � 32 = 128 sticks(that is, 5 : 32 = 20 : 128).
Note that this method of multiplying 4 lots of 5 fish overlooks the fact that 3 �tails�are effectively lost when the groups are joined nose to tail. Consequently, there are 6too many sticks counted using this ratio strategy.
E
CA
AC
EA
AA
AM
AP

Teaching Number through Measurement, Geometry, Algebra and Statistics
36
+ + . . .
(iv)Direct, Multiplicative(Students from the Advanced Additive stage onwards use these types of strategies.)
8 + 6 + 6 . . .
8 + (19 � 6) = 122 (8 sticks for the first fish + 6 sticks each for the other 19 fish)
X X. . . X X
(20 � 8) � (19 � 2) = 122 (20 lots of 8 sticks for 20 complete fish less 19 lots of twosticks for the sticks that serve as both nose and tail when the fish are joined together)
6 6 6 . . . 6 2
(20 � 6) + 2 = 122 (6 sticks for each fish body plus 2 sticks for the final tail)
Using Imaging
Provide examples of other stick patterns and strategies that have been used by otherhypothetical students to find the number of sticks for a given pattern number. Forexample:
�Jody worked out how many sticks were needed to make 10 seats in this pattern.
She used this strategy; (10 � 4) + (11 � 3). Where did Jody get these numbers from?�
Ask the students to focus spatially on the pattern and to discuss which features of thepattern Jody may have got the lots of 4 and 3 sticks from. The students should noticethat in 10 seats there will be 11 groupings of
E
CA
AC
EA
AA
AM
AP

37
Teaching Number through Measurement, Geometry, Algebra and Statistics
and 10 groupings of
�For the seats pattern:
Henare wrote, (10 � 10) � (9 � 3). Where did he get these numbers from? (10 completeseats less 9 joins)
Zoe wrote, 10 + 7 + 7 + 7 + 7 + 7 + 7 + 7 + 7 + 7. Where did her numbers come from?�(10 sticks for the first seat plus 7 sticks for each new seat)
Using Algebraic Properties
Extend work on the stick patterns by getting the students to apply the rules they havecreated to the following problems:
(i) Find the number of sticks to make a given term in a pattern. For example, �Howmany sticks are needed to build 47 fish?� Note that extrapolating the pattern likethis will encourage multiplicative reasoning since repeated addition is verycumbersome.
(ii) Give the students the number of sticks used and ask them to find the number ofterms in the pattern. For example, �If 115 sticks were used, how many seats weremade?� This involves reversal of the multiplicative rules or trial and improvementstrategies and is most appropriate for Advanced Multiplicative students. For therule, �The number of seats multiplied by 7 add 3 gives the number of sticks used(s = 7c + 3; where s = sticks and c = seats)�, the students might try using a roundednumber of seats, for example, 10 seats need 73 sticks, 20 seats need 143 sticks. Fromthis, they may close in on the correct number of seats by trial and improvement.
Alternatively they might take 3 away from 115 to get 112, then divide 112 by 7 togive 16, the correct number of seats.
(iii) Use a computer spreadsheet to graph the number of seats and the number of sticksand/or extrapolate the relationship further using the �fill down�capability (seeFigure It Out, Algebra, levels 3�4, Answers and Teachers� Notes, pages 20 for moredetails on this process). Setting up the graph within the spreadsheet rather than as aseparate document allows the students to explore how the graph changes when thestarting number or the difference between the terms is altered.
Sticks Needed for Chairs Pattern Sticks Needed for Fish Pattern80 80
70 70
60 60
50 50
40 40
30 30
20 20
10 10
0 00 2 4 6 8 10 0 2 4 6 8 10
Number of Chairs Number of Fish
The constant difference between the terms of a pattern determines the slope of the lineof points while changes to the starting number raise or lower the line. This leads to theslope and intercept (y value when x is 0) of linear functions.

Teaching Number through Measurement, Geometry, Algebra and Statistics
38
Related Activities
Figure It Out, Algebra, levels 2�3, 3, 3�4 and year 7�8 (four books) contain manyexamples of spatial patterns that can be used to develop algebraic thinking in this way.The website nzmaths.co.nz also has a collection of algebra units that can bedownloaded for classroom use.
Numbers at Work
I am learning to describe how a number strategy works and to show which numbersit works for.
Links to Other Strands
Mathematical Processes: classification and making conjectures from the Logic andReasoning sub-strand
Required Knowledge
The students will need to be able to:
� use mathematical vocabulary that classifies sets of numbers, for example, �sum�,�factors� (The students� proficiency needs to develop as they progress through thestrategy stages.)
� model number strategies with appropriate equipment.
Equipment: Place value materials such as interlocking cubes, bundles of iceblock sticks,canisters of beans, place value blocks, etc, Slavonic abacus, cubes, counters, plastic cups,Material Master 9�4.
Using Materials
Begin the lesson by introducing a scenario of a student solving a number problem usinga particular strategy. The complexity of the strategy will vary depending on the stagesthat the students are at. For example:
Advanced Counting�Leeana has the problem 6 + 17. She starts on 17 and counts on 6 more to get 23.�
Early Additive�Jacques solves the problem 8 + 29 by moving one from 8 and putting it on 29 to make7 + 30. He knows this is 37.�
Advanced Additive�Ani solves the problem 83 � 37 by working out 83 � 40 = 43 then adding 3 to get ananswer of 46.�
Advanced Multiplicative�Callum solves the problem 6 � 33 by working out 3 � 33 = 99 then 2 � 99 = 198.�
Advanced Proportional�Trudi has to find three fractions between and . She thinks that 3 , 3 , and 3sevenths will work because she knows that 3 , 3 , and 3 all lie between 3 and 4. Sherenames the fractions as , , .�
In each case, the students should be asked to demonstrate with appropriate materialshow the student in each example is solving the problem. For example, Early Additivestudents might use place value materials while Advanced Proportional students mightuse regions like circles or squares.
E
CA
AC
EA
AA
AM
AP
37
12
47
34
14
12
34
14
714
1528
1328

39
Teaching Number through Measurement, Geometry, Algebra and Statistics
Using Imaging and Number Properties
Then take the students through the following sequence of problem steps. At each step, itmay be necessary to refer back to using materials. Below we use the AdvancedMultiplicative stage example to illustrate the steps. In this case, animal strips or placevalue materials could be used as the equipment to model the equations, shouldstudents need it.
Problem Type Example
Initial strategy example Callum solves the problem 6 � 33 byworking out 3 � 33 = 99then 2 � 99 = 198.
Related examples How would Callum use the same strategy towork out: 4 � 37? 8 � 46? 12 � 17?
Verifying trueness and falseness Callum knows which of these equations aretrue without working out the numbers.Which of these equations are true?4 � 93 = 2 � 93 � 216 � 12 = 16 � 2 � 3 � 35 � 2 � 46 � 3 = 30 � 46
One unknown Use Callum�s strategy to work out whatnumber goes in each box:9 � 756 = � 3 � 756
� 3.47 = 5 � 3 � 3.477 � 2 � � 87 = 87 � 28
Two or more unknowns What numbers could be entered in theshapes to make these equations correct?
� 75 = 75 � �� � � 6.03 = � 6.03
Variable relationships In this equation, what is always true aboutthe numbers that go in the different shapes?
� 13 = 13 � �
Letters to describe Callum has used letters to name thevariable relationship numbers that could go in some boxes.
What could he say about the numbers thatwould go in the empty boxes?2 � 13 � = 13 � q5 � � 6.4 = h � 6.4
� w � 91 = u � 91
Material Master 9�4 shows how these steps apply to strategies from the other stages.

Teaching Number through Measurement, Geometry, Algebra and Statistics
40
Related ActivitiesFor ideas about how to develop notation using letters, refer to the nzmaths.co.nzalgebra unit called �Cups and Cubes�.
Patterns of equations can be used in the same way as strategies to develop ideas aboutvariables. The equation set below is an example of this.
1 + 2 + 3 = 6
2 + 3 + 4 = 9
3 + 4 + 5 = 12
4 + 5 + 6 =
(i) Write the next equation in this pattern.
(ii) Write an equation in this pattern that is much further down the pattern.
(iii)The equation shown below fits the pattern. The letter �m� has been used to show oneof the numbers. What are the other numbers?
+ m + =
Answer:
m � 1 + m + m + 1 = 3m

41
Teaching Number through Measurement, Geometry, Algebra and Statistics
Statistics Links to the Number Framework
Modern thinking in statistics emphasises the need for students to undertake statisticalinvestigations. There are two main types of investigation. In the first type, students posequestions, gather data and use the data to answer the questions. In the second type,students look for patterns and trends in existing data sets and generate questions to beanswered. While traditional teaching of statistics favours the first type of investigation,the modern approach emphasises the second type. In both cases, there is aninvestigative cycle.
A Question-driven Investigative CycleA question-driven investigative cycle follows these stages:
� Formulate a question.
� Gather suitable data.
� Present the data in a sensible way.
� By discussing the trends/patterns in the data representations, answer the question.
� From the investigation, more questions may arise and the cycle recommences.
A Data-driven Investigative CycleA data-driven investigative cycle is quite different. Instead of formulating a questionfirst, existing data sets with many variables are located. The students display twovariables at a time on graphs. This assists them in formulating questions. Sometimes�eyeballing� the raw data without graphing can also generate questions.
Example: Data has been gathered about used cars for sale and entered into a spreadsheet:
Automatic Year of Odometer Power CostCar Model or Manual Manufacture (-000 km) (kw) Colour ($) ...
4-door sedan Automatic 1996 67 88 Red $13,500 ...
Hatchback Automatic 2001 49 87 Yellow $28,000 ...
Station wagon Manual 1999 78 68 Red $21,000 ...
2-door sedan Automatic 1998 152 98 Black $11,000 ...
4-wheel drive Manual 2003 134 122 White $34,000 ...
...
A student might then choose to:
� compare year of manufacture against odometer reading
� compare the cost against the car model
� order the data by distance travelled, using the spreadsheet Sort function, and lookfor patterns in the other variables.
A data-driven investigative cycle follows these stages:
� Find sources of interesting data with lots of variables.
� Eyeball the raw data for patterns and/or use suitable software or other methods topresent pairs of variables in the data in a meaningful way.
� Formulate a question.
� Answer the question.
� Recommence the cycle by investigating other relationships in the data.

Teaching Number through Measurement, Geometry, Algebra and Statistics
42
Statistical SkillsTraditional statistics teaching often focused on developing skills that were isolated froman investigative cycle. For example, students were asked to work out the average fromdata when finding the average did not supply any information that was needed. This isnot to denigrate the need for skills but merely to point out that these skills need to beused in a context of answering pertinent questions. Some such skills include:
� formulating questions� designing questionnaires� planning to collect data� collecting data� inputting the data into a computer� using relevant software to display data meaningfully� using means and medians (when this assists in answering the questions).
Choice of Data Presentation SoftwareThe most common software that allows data to be presented graphically is Excel forboth PCs and Macs. This software is normally supplied in a package on the purchase ofthe computers. There are many powerful statistical features available in Excel that areuseful for experienced users. However, other more student-friendly software isbecoming available for student use while they are learning how to undertake statisticalinvestigations.
References to such software can be found at:www.nzmaths.co.nz/statistics/Softwarelist.htm
Schools should consider the value of such software balanced against its cost.
Sources of Questions and Data
Figure It Out
The statistics booklets in the Figure It Out series are:
� Statistics, levels 2�3
� Statistics, level 3
� Statistics, levels 3�4
� Statistics, level 4, Book One
� Statistics, level 4+, Book Two.
These booklets contain an extensive range of activities and investigations. In somecases, data has already been collected and presented in graphical form ready forinterpretation. Some activities and most investigations will need to be adapted for usein a data-driven investigative cycle. A guide for teachers is offered in the Answers andTeachers� Notes booklet that accompanies each level of student book. These teacherguides are a valuable source of teaching ideas.
CensusAtSchool
CensusAtSchool NZ is part of a worldwide programme that produces sets of data aboutschool students. It is designed to:
� provide real datasets about students for students� raise awareness of what a national census is� use ICT to enhance learning and teaching of data handling.
Students can access the website: www.censusatschool.org.nz/survey.php to findsuggested questionnaires and advice on how to conduct question-driven investigations.
43
Teaching Number through Measurement, Geometry, Algebra and Statistics
Introduction to Probability IdeasInitially, concepts about probability appear to be simple. For example, the idea thatthere is a 50% chance that, on tossing a coin, heads will come up is readily accepted andapparently well understood. It is based on the simple idea that there are two equallylikely outcomes � a head and a tail. However, there are at least two complicating factors;the past in this case does not affect the future, and, when tossing a coin repeatedly, thereis no reason to expect to end up with a head exactly 50% of the time.
Many students and adults believe that what has gone before can affect the future whenit can not. For example, in one summer series of cricket test matches, the New Zealandcricket captain lost six tosses in a row. Some people believed that the chance of hiswinning the next (seventh) toss was better than 50%. This was untrue. Teachers maydiscuss this with their students, and model it with experiments, but they will notnecessarily convince the doubters.
A more profound difficulty is to understand what a 50% chance actually means. It doesnot mean that 50% of the tosses will result in heads. For example, in 13 tosses therecannot be 6 heads. What it does mean is that, as more and more tosses are made, theproportion of heads varies. The variation in the result gets less and less as the numberof tosses increases and the proportion of heads being the result of each toss gets closerand closer to 50%. Probability is unavoidably linked to the idea of long-term proportion(long-run relative frequency).
VariationWhy bother to get into the idea of variation with students? At some point, the idea ofprobability as long-term proportion (long-run relative frequency) needs to be addressedwith students. Then variation can no longer be avoided.
Exact probabilities are seldom available in the real world. They can only be estimatedby finding a proportion from a number of trials. For example, in an experiment abouttossing a drawing pin and finding the proportion of times the pin lands point up, thereis no correct simple theory to predict the probability of �point up�. Students oftenreason there are two possibilities, �point up� and �point down�, so the probability of�point up� must be 50%.
Unfortunately this reasoning fails on the grounds that the two outcomes are not equallylikely. The only reliable way of finding the probability is by repeatedly tossing the pinand processing the results. Suppose, in an experiment, the pin lands point up 67 timesin 100 tosses. The proportion of �point ups� so far is 67%. Does it mean the probabilityof �point up� is 67%? Unfortunately, no. Suppose after another 100 tosses there is a totalof 138 �point ups�. Now the estimate is = 69%.
So the estimate of the probability of �point up� changes as the number of trials changes.Therefore, it is important students plot a �moving� proportion on a graph and observethe trend. Students need to see that, as the number of tosses increases, the estimatemoves increasingly towards the actual probability of tossing a �point up� but the realprobability can never be known exactly.
138200
12
Teaching Number through Measurement, Geometry, Algebra and Statistics
44
Learning Experiences to Develop Students’Reasoning in Statistics
Investigative Cycle Activities
Question-driven Investigation
I am learning to use a question-driven statistical investigation cycle.
Equipment: Computers, website: www.censusatschool.org.nz/survey.php,Figure It Out statistics books (see page 42).
The students will undertake a question-driven investigative cycle as described below:
� Formulate a question.
� Gather suitable data.
� Present the data in a sensible way.
� Solve the answer to the question by discussing the trends/patterns in the datapresentations.
� Possibly generate more questions and recommence the cycle.
E
CA
AC
EA
AA
AM
AP

45
Teaching Number through Measurement, Geometry, Algebra and Statistics
Data-driven Activities
I am learning to use a data-driven statistical investigation cycle.
Equipment: Computers, website: www.censusatschool.org.nz, Figure It Out.
Sample InvestigationShow the students this spreadsheet data of medal counts from the 1996 Atlanta Olympics(available from www.nzmaths.co.nz/statistics/Investigations/Atlantamedals.htm).
Generating Questions
Eyeballing the Raw Data
The students should realise that graphs are the main tool available to generatequestions, but not the only one. Often just �eyeballing� the raw data can generatequestions. For example, �Consider how the data in the table (above) has beenarranged.�
�Is that fair?�
�Which country really did best in the total medals considering population?�
�How would you present the data to best show this?�
New Challenge
Have the students add a column in the spreadsheet to enable them to compare goldmedals per million people and country and ask them which country is top for goldmedals.
E
CA
AC
EA
AA
AM
AP

Teaching Number through Measurement, Geometry, Algebra and Statistics
46
New Simulation
Plotting the Data
Plotting graphs showing one variable against another is a powerful way to generatequestions. For example, have the students plot gold medals against silver medals andask them whether there is a relationship. Have the students plot gold medals againstbronze medals and ask them whether there is a relationship.
Recycling
Go back to asking further questions and answering them, revisiting the cycle.
Probability Linked ActivitiesThese activities are designed to help the students understand the idea that variation inproportion (long-term frequency) decreases as the number of experiments increases.The activities are quite subtle and require great care in teaching.
Coin Tossing on the Computer
This lesson uses a computer simulation of 10 000 tosses of a coin. It calculates andgraphs the proportion of heads continuously as the number of tosses increases. Thecentre line shows the proportion of heads. The outer lines show the �margins of error.�
I am learning how long-term proportion gets closer and closer to a knownprobability.
Equipment: Simulation software(available at: www.nzmaths.co.nz/statistics/Probability/simulation.htm).
Have the students open the simulation. Have the students discuss what the graphshows, then get them to click on the New Simulation button for a new set of 10 000tosses. They can use this function to do repeated simulations.
Discussion
�Why does the centre line vary up and down?� (Natural variation)
�Why is the pattern different for each simulation?� (Each simulation is unpredictable inhow the variation occurs.)
�Why does the centre line always point towards 50% as the number of tosses increasesin every simulation?� (In the long run, the proportion approaches 50%, which is thetheoretical probability of obtaining a head.)

47
Teaching Number through Measurement, Geometry, Algebra and Statistics
The Monty Hall Problem
Background
This is a famous problem based on an American quiz show. On the show, a contestanthas won a prize. The contestant is shown three doors. Behind the three doors, there isone car and two goats respectively. The idea is that the contestant picks the door thathas the car behind it. The contestant picks one door. Then the host opens one of theother doors; the one that he knows has a goat behind it. He then asks the contestant ifthey would like to change their choice to the third door or stay with their originalchoice. The question is, �Should the contestant change their mind?�
This problem has caused great controversy. For more details, read page 78 of TheCurious Incident of the Dog in the Night-time by Mark Haddon11. There are also manywebsites that have simulations of the problem. Type �Monty Hall� into a search engineto find sources.
Below is a more suitable representation of the problem for the students to work with.
I am learning how to decide an argument by gathering data and presenting itsensibly.
Equipment: Sets of three paper cups and objects that can be hidden under the cups (forexample, erasers, cubes).
Have the students play the roles of quizmaster and contestant. The quizmaster placesan object under one of three cup while the contestant is not watching. The contestantthen points at a cup that the object might lie under. The quizmaster now turns over oneof the other cups that they know doesn�t cover the object. The contestant decideswhether to change their choice. The quizmaster shows which cup is hiding the object.
Play the game two or three times with the whole class involved so that every studentunderstands how to play it.
Have the students work in groups of three. Give each group three cups and an object tohide underneath one of the cups. The group appoints a quizmaster, a contestant and adata recorder. The contestant announces whether they will change their mind or notbefore the game begins. Once this is announced, the contestant must continue to playthis way for 10 games. The recorder carefully notes whether the contestant decided tochange their mind or not and records each win and loss on paper. After 10 games, thestudents rotate roles and play a new series of games. Each time the roles are changed,the new contestant must make the opposite choice to the previous contestant. So, if thefirst contestant changed their mind, then the second does not, and vice versa.
Interpreting the Data – Early Additive Students
Additive students have considerable difficulty with proportions, so the activity will bedifficult for early additive thinkers.
Draw the table shown on the next page on the board.
Record the win/loss data, being careful to take account of the contestants� initialchoices. The example table below shows the data from Group 1 who found that thecontestants who changed their mind won a total of 12 games and lost 8 and thecontestant who kept their original choice won 6 games and lost 14.
When all the data has been displayed in the table, get each student to write factualstatements based on the information they see there. For example: �When the contestantdid not change their mind, they won 22 times and lost 58 times. When the contestantdid change their mind, they won 54 times and lost 26 times.�
11 Haddon, Mark (2003). The Curious Incident of the Dog in the Night-time. Jonathan Cape: London.
E
CA
AC
EA
AA
AM
AP

Teaching Number through Measurement, Geometry, Algebra and Statistics
48
Changes Mind Does Not Change Mind
Wins Loses Wins Loses
Group 1 12 8 6 14
Group 2
Group 3
Group 4
Group 5
Group 6
.... .... .... .... ....
Totals 54 26 22 58
Ask the students to discuss what the results indicate, �Should a contestant changetheir mind or not?� (The evidence will point overwhelmingly to the fact that thechance of a contestant winning is improved substantially by changing their mind.This is despite a very strong feeling among students and many adults that thecontestant changing their mind should not make a difference.) Encourage the studentsto write statements about what the experiment shows, such as, �I thought changingmy mind would make no difference, but the statistical evidence shows that changingmy mind is a good idea.�
Interpreting the Data – Advanced Multiplicative Additive Students andHigher
Repeat the data gathering and presentation process as for the stages above. Then usethe totals to estimate the probabilities involved as percentages. For example, supposefor six groups of students, the table rows looks like this:
Changes Mind Does Not Change Mind
Wins Loses Wins Loses
Group 1 6 4 3 7
Group 2 7 3 3 7
Group 3 6 4 4 6
Group 4 8 2 4 6
Group 5 6 4 2 8
Group 6 6 4 2 8
Totals 39 21 18 42

49
Teaching Number through Measurement, Geometry, Algebra and Statistics
The estimated probability of the contestant winning when they change their mind is = � 0.65 = 65%
The estimated probability of the contestant losing when they change their mind is100% � 65% = 35%
The estimated probability of the contestant winning when they do not change theirmind is = � 0.3 = 30%
The estimated probability of the contestant losing when they do not change their mindis 100% � 30% = 70%
Ask the students to write statements that involve fractions close to the experimentalstatistics. For example, �Contestants who change their minds win about two-thirds ofthe time.�
A Final Comment
Some students will enjoy arguing why it is a good idea (or not!) to change one�s mindon a purely logical basis. They may like to research the explanations offered on the web.The correct probabilities are definitely these:
The probability of winning when a contestant changes their mind is 66 %
The probability of losing when a contestant changes their mind is 33 %
The probability of winning when a contestant does not change their mind is 33 %
The probability of losing when a contestant does not change their mind is 66 %
Some people find it easier to understand the reasoning for this solution if the problem isextrapolated to 100 items to choose from with only one correct option. In such a case,the contestant would have a 1% (1 out of 100) probability of making the correct choice.Once the quizmaster has removed 98 known �wrong� options, the remaining otheroption must have a 99% probability of being the winning option � 99% versus 1%. Mostpeople would agree; the contestant should change their mind. So it is for the one inthree choice. The contestant has a one-third probability of making the correct choice;there is a two-thirds probability that the quizmaster will have left the correct choice; thecontestant should run with the two-thirds probability option and change their choice.
Varying As You GoIn this activity, the students know that the number of red coloured cubes is fixed eventhough they cannot see them. The task is to find out how many red cubes there are byrepeatedly drawing cubes from a box and using statistical reasoning. The studentsreturn the cubes to the box after each draw.
I am learning how the data shows a varying proportion as it is collected even thoughthe true proportion is always present.
Equipment: Six cubes of one colour (say red) and five similar cubes of another colour(say blue), a box to shake cubes in, calculators, Material Master 9�5.
Hand out photocopies of Material Master 9�5. Put six red and five blue cubes in a box.Tell the students there are 11 cubes in the box and that they are either red or blue. Thestudents must work out the number of red cubes in the box even though they cannotsee into the box. Draw out one cube from the box, then return it. Do this 100 times. Aftera set of five cubes has been pulled out and then returned, get the students to predict thenumber of red cubes in the box. Ask the students to fill in a table (as shown in theexample below) and graph the results of every five cubes pulled from the box. Thestudents may need help to do the percentage calculations on the calculator.
3939 + 21
3960
1818 + 42
1860
23
13
23
13
E
CA
AC
EA
AA
AM
AP

Teaching Number through Measurement, Geometry, Algebra and Statistics
50
After 100 cubes have been taken out, ask the students to decide how many red cubesthere are. The students will be interested to find out the actual number. Many will besurprised how their predictions can be so inaccurate after such a large number of trials.
Total Total Comment aboutReds Draws Reds Draws Percentage the Number of(Tally) (Tally) So Far So Far Reds So Far Reds So Far
||| |||| 3 5 3 ÷ 5 = 60% Some red, some blue
||| |||| 6 10 6 ÷ 10 = 60% Over a half red
| |||| 7 15 7 ÷ 15 = 47% Less than a half red
|||| |||| 11 20 11 ÷ 20 = 55% About 6 or 7 red
|| |||| 13 25 13 ÷ 25 = 52% About 6 red
| |||| 14 30 14 ÷ 30 = 47% Maybe 5 red
The key idea in this lesson is that sampling yields only approximate predictions of thetrue proportion. The only way to be certain is to actually count all the cubes. Largersamples provide more accurate predictions but they can also be misleading.
The Two Coin ProblemWhen probability theory was being developed in the eighteenth century, even famousmathematicians debated what was correct reasoning. This shows that the ideas inmathematical probability are not simple. A dispute broke out between mathematiciansabout the probability of getting two heads when tossing two coins together. One groupof mathematicians argued that there are three ways of the two coins landing: two heads,two tails, and a mix of a head and a tail, so the probability of two heads landing is .Another group of mathematicians argued that there are four ways of the coins landing:head and head, tail and tail, tail and head, and head and tail, making he probability oftwo heads landing .
How could a dispute like this be resolved in the classroom? If famous mathematiciansdisagree, students are also likely to do so, no matter what logical arguments arepresented.
I am learning how to decide an argument by gathering data and presenting itsensibly.
Equipment: Coins, Material Master 9�6.
Ask, �Is the probability of getting two heads when you toss two coins together or ?�Get the students to base their decisions on statistical investigation not logical argument.
Firstly, it is important that the students have the opportunity to see that the estimatedproportion varies as data is continually added and that this is a natural feature ofvariation. The graph is a vital tool for this. Secondly, the amount of variation reduces asthe sample size increases. Thirdly, this variation will never be exactly zero even thoughthe variation is reducing as the sample size increases. These are not easy ideas tounderstand, and they will need to be explained carefully to the students.
E
CA
AC
EA
AA
AM
AP
13
14
13
14
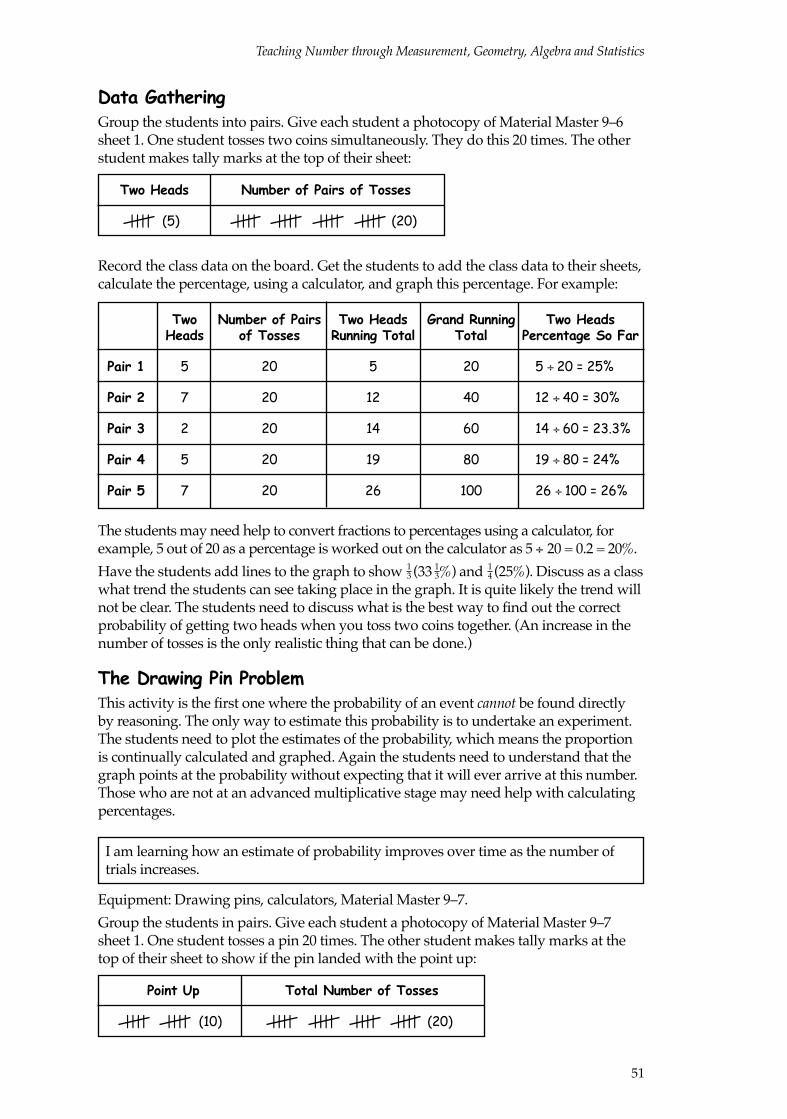
51
Teaching Number through Measurement, Geometry, Algebra and Statistics
Data GatheringGroup the students into pairs. Give each student a photocopy of Material Master 9�6sheet 1. One student tosses two coins simultaneously. They do this 20 times. The otherstudent makes tally marks at the top of their sheet:
Two Heads Number of Pairs of Tosses
|||| (5) |||| |||| |||| |||| (20)
Record the class data on the board. Get the students to add the class data to their sheets,calculate the percentage, using a calculator, and graph this percentage. For example:
Two Number of Pairs Two Heads Grand Running Two HeadsHeads of Tosses Running Total Total Percentage So Far
Pair 1 5 20 5 20 5 ÷ 20 = 25%
Pair 2 7 20 12 40 12 ÷ 40 = 30%
Pair 3 2 20 14 60 14 ÷ 60 = 23.3%
Pair 4 5 20 19 80 19 ÷ 80 = 24%
Pair 5 7 20 26 100 26 ÷ 100 = 26%
The students may need help to convert fractions to percentages using a calculator, forexample, 5 out of 20 as a percentage is worked out on the calculator as 5 ÷ 20 = 0.2 = 20%.
Have the students add lines to the graph to show (33 %) and (25%). Discuss as a classwhat trend the students can see taking place in the graph. It is quite likely the trend willnot be clear. The students need to discuss what is the best way to find out the correctprobability of getting two heads when you toss two coins together. (An increase in thenumber of tosses is the only realistic thing that can be done.)
The Drawing Pin ProblemThis activity is the first one where the probability of an event cannot be found directlyby reasoning. The only way to estimate this probability is to undertake an experiment.The students need to plot the estimates of the probability, which means the proportionis continually calculated and graphed. Again the students need to understand that thegraph points at the probability without expecting that it will ever arrive at this number.Those who are not at an advanced multiplicative stage may need help with calculatingpercentages.
I am learning how an estimate of probability improves over time as the number oftrials increases.
Equipment: Drawing pins, calculators, Material Master 9�7.
Group the students in pairs. Give each student a photocopy of Material Master 9�7sheet 1. One student tosses a pin 20 times. The other student makes tally marks at thetop of their sheet to show if the pin landed with the point up:
Point Up Total Number of Tosses
|||| |||| (10) |||| |||| |||| |||| (20)
13
14
13
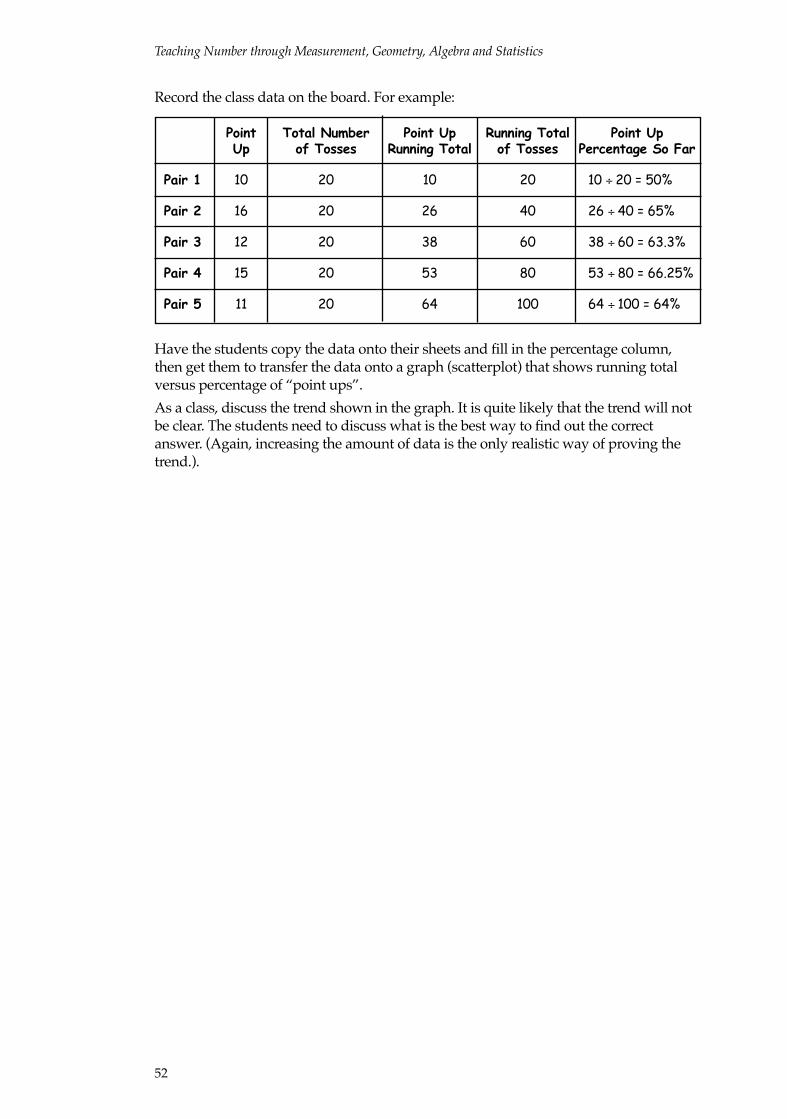
Teaching Number through Measurement, Geometry, Algebra and Statistics
52
Record the class data on the board. For example:
Point Total Number Point Up Running Total Point UpUp of Tosses Running Total of Tosses Percentage So Far
Pair 1 10 20 10 20 10 ÷ 20 = 50%
Pair 2 16 20 26 40 26 ÷ 40 = 65%
Pair 3 12 20 38 60 38 ÷ 60 = 63.3%
Pair 4 15 20 53 80 53 ÷ 80 = 66.25%
Pair 5 11 20 64 100 64 ÷ 100 = 64%
Have the students copy the data onto their sheets and fill in the percentage column,then get them to transfer the data onto a graph (scatterplot) that shows running totalversus percentage of �point ups�.
As a class, discuss the trend shown in the graph. It is quite likely that the trend will notbe clear. The students need to discuss what is the best way to find out the correctanswer. (Again, increasing the amount of data is the only realistic way of proving thetrend.).
ACKNOWLEDGMENTSThe Ministry of Education wishes to acknowledge thefollowing people and organisations for their contributiontowards the development of this draft handbook.
THE PARTICIPANTS:The New Zealand numeracy project personnel �facilitators and principals, teachers, and students frommore than eighteen hundred New Zealand schools whocontributed to this handbook through their participationin the numeracy projects from 2000�2005.
Professor Derek Holton, convenor (The University ofOtago), Professor Megan Clark (Victoria University ofWellington), Dr Joanna Higgins (Victoria University ofWellington College of Education), Dr Gill Thomas (MathsTechnology Limited), Associate Professor Jenny Young-Loveridge (The University of Waikato), AssociateProfessor Glenda Anthony (Massey University), TonyTrinick (The University of Auckland Faculty ofEducation), Garry Nathan (The University of Auckland),Paul Vincent (Education Review Office), Dr JoannaWood (New Zealand Association of MathematicsTeachers), Peter Hughes (The University of AucklandFaculty of Education), Vince Wright (The University ofWaikato School Support Services), Geoff Woolford(Parallel Services), Kevin Hannah (Christchurch Collegeof Education), Chris Haines (School Trustees�Association), Linda Woon (NZPF), Jo Jenks (VictoriaUniversity of Wellington College of Education, EarlyChildhood Division), Bill Noble (New ZealandAssociation of Intermediate and Middle Schools), DianeLeggatt of Karori Normal School (NZEI Te Riu Roa),Sului Mamea (Pacific Island Advisory Group, PalmerstonNorth), Dr Sally Peters (The University of WaikatoSchool of Education), Pauline McNeill of ColumbaCollege (PPTA), Dr Ian Christensen (He Kupenga Hao ite Reo), Liz Ely (Education Review Office), Ro Parsons(Ministry of Education), Malcolm Hyland (Ministry ofEducation).
THE WRITERS:Vince Wright (The University of Waikato School SupportServices), Michael Drake (Victoria University ofWellington College of Education), Deborah Gibbs(Massey University College of Education), Peter Hughes(The University of Auckland Faculty of Education).
THE REVIEWERS:Murray Britt (The University of Auckland Faculty ofEducation), Dr Kay Irwin (The University of Auckland),Kevin Hannah (Christchurch College of Education).
The cover design is by Dave Maunder (Learning MediaLimited) and Base Two Design Ltd.
All illustrations copyright © Crown 2006 except: theDigital imagery of the conch copyright © PhotoDisc, Inc.2000.
THE NUMERACY REFERENCE GROUP: