Embed Size (px)
Citation preview

This report was funded by the Bonneville Power Administration (BPA),U.S. Department of Energy, as part of BPA’s program to protect, mitigate,and enhance fish and wildlife affected by the development and operationof hydroelectric facilities on the Columbia River and its’ tributaries. Theviews in this report are the author’s and do not necessarily represent theviews of BPA
For copies of this report, write to:
BOMeville POWer -tI’atiOXlDivision of Fish and Wildlife - PJP.O. Box 3621Portland, OR 97203

EVALUATION OF JUVENILE FISH BYPASS AND ADULT FISH PASSAGEFACILITIES AT THREE MILE FALLS DAM, UMATILLA RIVER
Annual Progress Report
October 1989
Edited by
Anthony A. NigroOregon Department of Fish and Wildlife
Cooperators
Oregon Department of Fish and WildlifeConfederated Tribes of the Umatilla Indian Reservations
Funded by
Jerry Bauer, Project ManagerU.S. Department of Energy
Bonneville Power AdministrationDivision of Fish and Wildlife
P.O. Box 3621Portland, OR 97208
Project No. 89-024-01Contract No. DE-BI79-89BP01385
September 1990

CONTENTS
EXECUTIVE SUMMARY by Anthony A. Nigro . . . . . . . . . . . . . . . . . . . . . . . . . . . . 1
REPORT A. Operation and evaluation of the juvenile fish bypasssystem in the West Bxtension Irrigation District canalat Three Wile Falls Dam by Suzanne H. Knapp and DavidL. Ward . . . . . . . . . . . . . . . . . . . . . . . . . . . . . . . . . . . . . . . . . . . . . . . 4
REPORT B. Examine the passage of adult salmonids at ThreeWile Falls Dam by Keith Xutchine . . . . . . . . . . . . . . . . . . . . . . 33

EXECUTIVE SUWWARY
We report on our progress from October 1989 through September 1990on evaluating juvenile fish bypass and adult fish passage facilities atThree Mile Falls Dam on the Umatilla River. The study is a cooperativeeffort by the Oregon Department of Fish and Wildlife (ODFW) and theConfederated Tribes of the Umatilla Indian Reservation (CTUIR). Studyobjectives addressed by ODFW and CTUIR are
1. ODFW (Report A): Operate and evaluate the juvenile fish bypasssystem in the West Extension Irrigation District canal at Three MileFalls Dam.
2. CTUIR (Report 8): Examine the passage of adult salmonids at ThreeMile Falls Dam.
The study is part of a program to rehabilitate anadromous fish stocks inthe Umatilla River Basin that includes restorations of coho salmonOncorhynchus Wsutch and chinook salmon 0. tshawytscha and enhancementof summer steelhead 0. mytiss.
Highlights of results of our work with the juvenile fish bypassfacility at Three Mile Falls Dam are
1. We eaxnpled several species of fish from the juvenile fish bypassfacility in November 1989 and Spring 1990. In November 1989 we sampled10 northern sguawfish, 35 largescale suckers, 20 white crappie and 3fall chinook. In Spring 1990 we sampled.22,565 fish; 23.1 percent wereyearling chinook, 60.8 percent were subyearling chinook, 14.1 percentwere coho and 2.0 percent were summer steelhead,. Our estimates ofpassage by Three Mile Falls Dam in Spring 1990, based on sampling rates,were 92,857 yearling chinook, 67,189 subyearling chinook, 56,222 &ho'and 2,662 summer steelhead.
2. Peak numbers of juvenile salmonids bypassed generally corresponded topeak flows. Two exceptions were yearling chinook and coho, theirnumbers peaked as flows were approaching lowest levels of the season.Majority.of juvenile chinook migrated quickly out of the system.However, coho and. steelhead had protracted periods.
3. Mean descaling rates of juvenile salmon and steelhead ranged from 1.2percent for fall chinook subyeari&ngm to-7.7 ,percent for hatchery summersteelhead. These descaling rates were comparable to those observed atMcNary Dam. Other injuries included bird predation marks, fungalinfections, head bruises and body injuries. >.;-
. . t -I'., )4. Each group of hatchery and naturally produced juvenile safmonide hada distinct length frequency distribution. Hatchery coho and summersteelhead were generally smaller than their naturally producedcounterparts.
5. The bypass outfall sampler effectively sampled all marked fishcontained in the outfall. Five marked yearling chinook and two markedsteelhead were not recovered because they remained in the bypass.

6. Approach and sweeping velocity measurements taken at West ExtensionIrrigation District canal drum screens 1, 2 and 3 were lowest when canalflow was lowest. At drum screen 4 they did not vary with canal flow.
7. Some juvenile salmonids were found in the West Extension IrrigationDistrict canal downstream from the drum screens. How fish got past thescreens is unknown.
8. When flow was below 50 cfs and the head works elevation was less than403.4 ft, outmigrating juvenile salmonids could not be bypassed orsampled because water could not flow over the inclined screen.
9. Flow through the bypass was obstructed by debris that got past thetrash rack.
10. When sampling-trapping facilities were in place or river flow waslow, bypass flow was less than 10 cfs and fish did not readily exit thesystem. Under these conditions, fish may become stranded in the system.
11. Juvenile salmonids were observed to use the east bank adult salmonidladder to bypass Three Mile Falls Dam.
Highlights of results of our work with the adult fish passagefacility at Three Mile Falls Dam are
1. We counted 4,623 coho (4,102 adults and 521 jacks), 1,668 mussnetsteelhead, 602 fall chinook (279 adults, 247 jacks and 76 subjacks) and
- 2,188 spring chinook (2,156 adults and 32 jacks) at Three Mile Falls Damin Fall 1989 and Spring 1990.
2. Migration periods of coho and fall chinook extended from.earlyOctober through early January. Summer steelhead migrated from earlyOctober through early May. Spring chinook migrated from early Aprilthrough June.
3. Flows during coho and fall chinook migration mostly ranged from 150to 250 cfs; peak numbers parreed Three Mile Falls Dam after freshet8increased flows by 50 cfm increments and temperatures increasediby 1.5c. Most summer steelhead arrived at the dam in February and March;large numbers were counted after freshetm increased flows above 1000cfs. Spring chinook numbers consistently increased dramatically eachtime flows exceeded 1000 cfs.
4. We sampled approximately 30 percent of migration days using video-recording equipment installed in the right bank adult passage facilityviewing room of Three Mile Falls Dam. Video-tape images of adultsalmonids passing the viewing window were clear during most flow andturbidity conditions.
5. Based on video-tape images , we counted 509 summer steelhead and 1,286spring chinook past the viewing window in the right bank adult fishpassage facility at Three Mile Falls Dam. These counts were thedifferences between individuals moving upstream past the window and

those dropping back downstream past the window. For summer steelhead,2,435 individuals moved upstream and 1,926 dropped back downstream. Forspring chinook, 7,912 moved upstream and 6,626 dropped back downstream.Summer steelhead moved primarily during early morning and early evening(dusk), whereas spring chinook moved during all daylight hours.
6. Concurrent counts of summer steelhead based on video-tape images anddirect obs8rvatfons in the right bank trap were 375 and 392; video-tapecounts were 96 percent of trap counts. Concurrent counts of springchinook based on video-tape images and direct observations by observersat the viewing window were 1,124 and 9261 trap counts were 79 percent ofvideo-tape counts. Concurrent counts of all adult salmonids in thetrap, the ladder and pools just downstream from the ladder showedcomparable trends; when many fish were in the trap, many were alsoobserved in the ladder and in pools just downstream from the ladder.
7. Counting Video-tape images was labor intensive because freguentfallback of individuals required much examination and interpretation.We hypothesize that fallback may have been caused by fish holding in theviewing area while attempting to ascend the Denil steep pass to thetrap. Flows at the Denil steep pass entrance may be inadequate toattract adult fish into the pass.
8. Carcass surveys conducted downstrfjam from Three Mile Falls Damcounted 92 dead fall chinook (15 percent of the total trapped at thedam), 52 dead coho (1 percent of the total trapped at the dam) and 75redds. It is unclear whether these fish spawned downstream from ThreeMile Falls Dam because of passage problema at the dam.
3

REPORT A
1. Operation and evaluation of the juvenile fish bypass system in the WestExtension Irrigation District Canal at Three Mile Falls Dam.
Prepared By:Suzanne M. KnappDavid L. Ward
Oregon Department of Piah and Wildlife
4

ACKNOWLEDGMENTS .....................................................
ABSTRACT ............................................................
INTRODUCTION ........................................................
Background ....................................................
Study Site....................................................
METHODS .............................................................
Pre-Operation Activitiee ......................................
Bypass Facility .........................................
Bypass Outfall Sampler ..................................
System Operation..............................................
Bypass Facility .........................................
Bypass Outfall Sampler ..................................
Velocity Measurements ...................................
RESULTS .............................................................
Bypass Facility ...............................................
Bypass Outfall Sampler ........................................
Velocity Measurements .........................................
DISCUSSION ..........................................................
RECOMMENDATIONS .....................................................
REFERENCES ..........................................................
APPENDIX A. Operating Criteria, Three Mile Falls Dam ScreeningFacility ............................................................
Page
6
7
8
8
10
12
12
12
14
14
14
15
16
16
16
18
18
22
27
28
30
5

ACK?JOWLEDGMFNTS
We thank Steve Banghart of our staff for assisting with design andfabrication of sampLing apparatuses and with the initial field sampling. Weextend thanks to Tom Leonard, Tom Clover and Randy Wilsey of the U.S. Bureauof Reclamation for their commendable modification work at the bypass facilityand for assistance in system operation. We also thank Jerry Franke andRichard Berg of the West Extension Irrigation District for their assistanceand cooperation in system operation. We thank Jay Marcotte and Jerry Bauer ofthe Bonneville Power Administration for their assistance with contracting offunds.
We would like to thank Gerry Rowan of the Confederated Tribes of theUmatilla Indian Reservation for his assistance with field sampling and alsoKeith Kutchfns of the CTUIR for the use of equipment. We extend thanks toGreg Rupert of the U.S. Geological Survey and Steve Fanciullo of the U.S.Bureau of Reclamation for supplying daily flow information.
We thank Tony Nigro and Wayne Burck for their critical review of themanuscript.
4
6

ABSTRACT
We report on our effort from October 1989 through September 1990 tooperate and evaluate the juvenile salmonid bypass facility in the WestExtension Irrigation District Canal at Three Mile Falls Dam on the UmatillaRiver. After test operation of the facility during November 1989, numerousmodifications to improve passage and sampling of juvenile salmonids wereincorporated into the facility. During the juvenile salmonid outmigration ofspring 1990 we evaluated the efficiency of the bypass facility, and collecteddata on the condition of fish bypassed. We also designed and tested afloating net pen to capture juvenile salmonids below the bypass outfall andmeasured approach and sweeping velocities at the drum screens in the canal.The bypaes facility usually operated satisfactorily, except during periods ofextremely low flow. The floating net pen was efficient in capturing fish atthe bypass Outfall. Velocities at the drum screens were usually withincriteria for safe passage of juvenile salmonids. We Offer recomm8ndations forimproving the performance of the bypass facility, and also recommend that adetailed evaluation of the facilities, including evaluation of fish conditionand fish passage through or over the drum screens, be conducted.
7
INTRODUCTION
Background
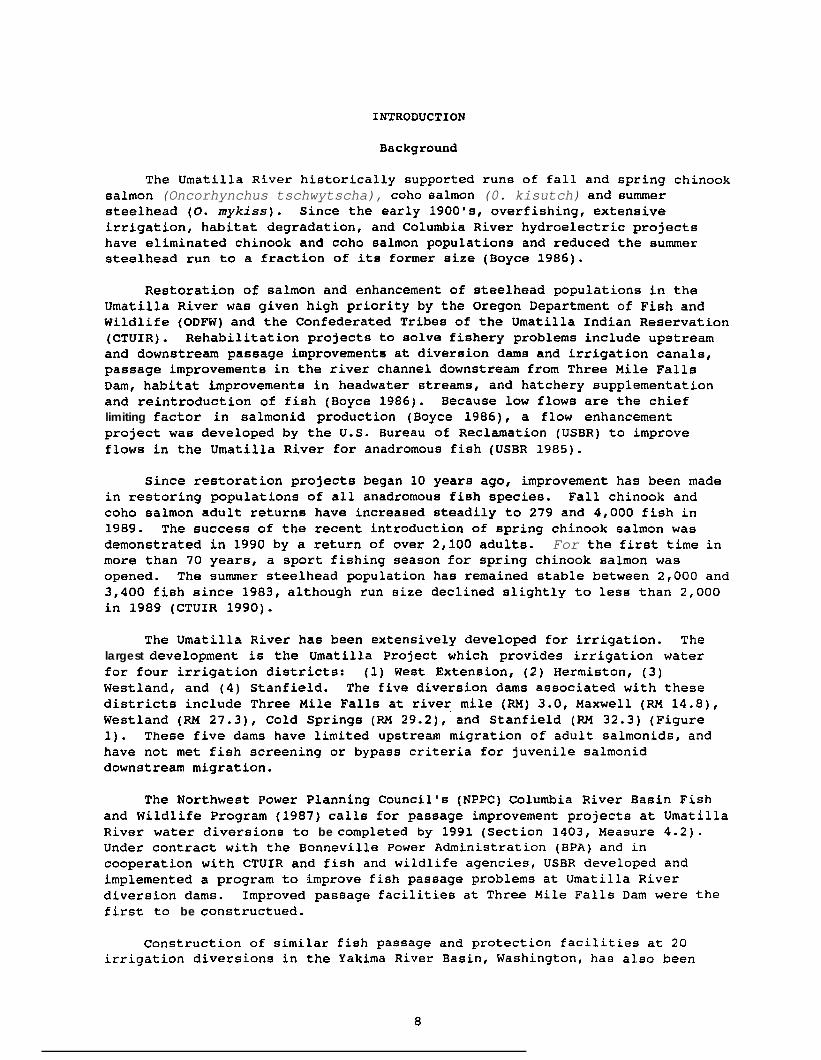
The Umatilla River hiEtorically supported runs of fall and spring chinooksalmon (Oncorhynchus tschwytscha), coho salmon (0. kisutch) and summersteelhead (0. mykiss). Since the early 1900's, overfishing, extensiveirrigation, habitat degradation, and Columbia River hydroelectric projectshave eliminated chinook and coho salmon populations and reduced the summersteelhead run to a fraction of its former size (Boyce 1986).
Restoration of salmon and enhancement of steelhead populations in theUmatilla River was given high priority by the Oregon Department of Fish andWildlife (ODFW) and the Confederated Tribes of the Umatilla Indian Reservation(CTUIR). Rehabilitation projects to solve fishery problems include upstreamand downstream passage improvements at diversion dams and irrigation canals,passage improvements in the river channel downstream from Three Mile FallsDam, habitat improvements in headwater streams, and hatchery supplementationand reintroduction of fish (Boyce 1986). Because low flows are the chieflimiting factor in salmonid production (Boyce 1986), a flow enhancementproject was developed by the U.S. Bureau of Reclamation (USBR) to improveflows in the Umatilla River for anadromous fish (USBR 1985).
Since restoration projects began 10 years ago, improvement has been madein restoring populations of all anadromous fish species. Fall chinook andcoho salmon adult returns have increased steadily to 279 and 4,000 fish in1989. The success of the recent introduction of spring chinook salmon wasdemonstrated in 1990 by a return of over 2,100 adults. For the first time inmore than 70 years, a sport fishing season for spring chinook salmon wasopened. The summer steelhead population has remained stable between 2,000 and3,400 fish since 1983, although run size declined slightly to less than 2,000in 1989 (CTUIR 1990).
The Umatilla River has been extensively developed for irrigation. Thelargest development is the Umatilla Project which provides irrigation waterfor four irrigation districts: (1) West Extension, (2) Hermiston, (3)Westland, and (4) Stanfield. The five diversion dams associated with thesedistricts include Three Mile Falls at river mile (RM) 3.0, Maxwell (RM 14.8),WeEtland (RM 27.3), Cold Springs (RN 29.2), and Stanfield (RM 32.3) (Figure1). These five dams have limited upstream migration of adult salmonids, andhave not met fish screening or bypass criteria for juvenile salmoniddownstream migration.
The Northwest Power Planning Council's (NPPC) Columbia River Basin Fishand Wildlife Program (1987) calls for passage improvement projects at UmatillaRiver water diversions to be completed by 1991 (Section 1403, Measure 4.2).Under contract with the Bonneville Power Administration (BPA) and incooperation with CTUIR and fish and wildlife agencies, USBR developed andimplemented a program to improve fish passage problems at Umatilla Riverdiversion dams. Improved passage facilities at Three Mile Falls Dam were thefirst to be constructued.
Construction of similar fish passage and protection facilities at 20irrigation diversions in the Yakima River Basin, Washington, has also been
8

Umatilla River
McNary Dam
Three Mile Falls Da
Maxwell Dam
tN
Cold Springs Dam
0t
5 10 .MilesI J
Figure 1. Locatione of diversion dams on the lower Umatilla River, Oregon.

funded by EPA and USBR under Section 803, Measure (b) of the Columbia RiverBasin Fish and Wildlife Program (NPPC 1987). Evaluations of the effectivenessof these fish screening facilities on the Yakima River have been carried outby Neitzel et al. (1985, 1987, 1988) and Hosey C Associates (1988, 1989,1990). We considered their experiences when designing evaluations of fishscreening facilities in the Umatilla River basin.
Evaluation of the passage improvement project at Three Mile Falls Dam waseuggested in A Comprehensive Plan for Rehabilitation of Anadromous Fish Stocksin the Umatilla River Basin developed by ODFW (Boyce 1986) in cooperation withCTUIR, and other fish and wildlife agencies. The first phase of theevaluation was conducted from October 1989 through September 1990 to becomefamiliar with the passage improvements and test operate the bypass facility.The study objective was to operate and evaluate the juvenile bypass system inthe West Extension Irrigation District (WEID) canal at Three Mile Falls Dam.This involved (1) ensuring the efficient operation of the bypass facility andthat it operated as designed, and (2) developing a system to collect juvenilesalmonids at the bypass outfall.
Study Site
Three Mile Falls Dam is the highest dam on the Umatilla River with acrest height of 24 ft and crest length of 915 ft. The dam waa constructed byUSBR.in 1914 as part of the.Umatilla Project. The water diversion wasformerly screened by a louver system consisting of a 30 ft by 10 ft grate witha series of fixed metal slats spaced 1-2 in apart. An a-in vertical bypassslot led to an la-in bypass pipe that dropped fish 18 ft into the tailracepool. Juvenile salmonids also passed over the crest of the dam. The drop offish over the dam or through the bypass may have resulted in significantinjury and mortality. Problems with approach and bypass slot velocities, andnonlaminar flows limited passage efficiency (Boyce 1986).
Construction of new fish passage facilities at Three Mile Falls Dam wascompleted in 1988 and included reconstruction of the east and west bank fishladders to improve adult upstream migration, construction of adult fishtrapping and viewing facilities, and installation of drum screens, a juvenilefish bypass and a juvenile fish trapping and passage evaluation facility inthe WRID canal. The new screen and bypass facility in the canal wasconstructed to replace the louvre system and designed to comply with screeningcriteria necessary for safe passage of juvenile salmonids at all flows(Washington Department of Fisheries 1989).
The purpose of the canal screening system is to prevent juvenile fishfrom entering the WEID canal. All fish that attempt to enter the canal arescreened and either diverted into the juvenile fish passage evaluationfacilities, returned directly to the river, or trapped for transport. Thecanal screening system includes the canal trashrack structure, the headgates,the three-cell box culvert and flume section with guide walls, the drum screenstructure, the juvenile fish trapping and passage evaluation facility, the 24-in diameter fish return pipe, the bypass outfall, the check structure, and thedrainage system (Figure 2).
10

Guide Walls
Traveling Screen
000-lead Gate!
t
Trash Rack
Holding Tanks
ransfer Flume
Inclined Screen J
Fish Separater J
Bypass Outfall
Bypass Pipe
Figure 2. Schematic of the juvenile bypass facility at Three Mile Falls Dam.

The purpose of the trashrack is to prevent debris that could damage thedrumscreens from entering the canal. The concrete guide walls downstream fromthe three-cell box culvert were designed to provide uniform flow across theflume section coming into the drum screens. The four rotary drum screensprevent juvenile fish from entering the WRID canal and direct these fish tothe bypass channel. The check structure with steel slide gates is used tomaintain the operating water surface at the drum screen structure, and tocontrol the flow in the WEID canal. The drainage system drains off excesswater left in the flume after canal dewatering (USBR 1989).
The juvenile fish trapping and passage evaluation facility operates in avariety of modes to handle the bypass flow and juvenile fish in accordancewith the mode of operation specified (APPENDIX A). The facility includes twoprimary pumpback pumps which return 20 cubic feet per second (cfs) of bypasswater to the canal, a traveling water screen which prevent5 juveniles fromentering the pumpback flow and associated spray water pump that cleans thescreen of debris, a fish bypass channel and downwell, an inclined screen andfish separator, and a transfer flume that carries fish to holding tanks. Theinclined screen and fish separator are installed in the bypass channel duringsampling or trapping operations to route fish into the sampling-trapping area.The transfer flume includes an adjustable gate designed to direct fish intothe holding tanks and a timer that adjusts the gate position at desiredintervals. The sampling-trapping work area houses two holding tanks and awork table, a secondary pumpback pump (5 cfs) that pumps tank overflow waterinto the canal, and the secondary pump sump and wasteway. The fish returnpipe begins at the lower end of the bypass channel and terminates at thebypass outfall (Figure 2).
A gantry crane shared with the drum screen structure is used to removethe traveling water screen, fish separator and inclined screen, and to raiseand lower the holding tanks. A 5 cfs restrictive orifice plate is placed inthe bypass channel immediately downstream from the traveling water screenduring low flows or when sampling or trapping fish (USBR 1989).
METHODS
Pre-Operation Activities
Bypass Facility
In November 1989, drum screens were put in place, stop logs were removed,and the juvenile ealmonid bypass facility was operated for one week to collectlate outmigrating juvenile salmonids. All fish were collected in one of twoholding tanks provided for trapping and hauling of downstream migratingsalmonids.
Observation of the trapping operation and inspection of the bypassfacility revealed the need for improvement to and further testing of thebypaes facility. Majc;r modifications to the facility were made by USBR. Wedesigned and fabricated minor modifications. Modifications to the bypassfacility were designed to: (1) concurrently trap and hold and bypass fish,( 2 ) a c c e s s , r e t r i e v e , anesthetize and examine fish we sample, (3) provide
12

auxiliary inflow water (or aeration system) for supplemental oxygen supply toboth tanks, (4) recover and release fish, and (5) regulate tank water levels.
Modifications were completed during February and March 1990. USBRmaintenance personnel refined the original modificatione and designed aneffective sampling system that one person can operate; we anticipate littleneed of future revamping. Specific modification5 were:
(1) A fish crowder, lift basket and perforated divider were installed in thesouth (sampling) tank to ease holding and retrieval of fish. Fish could thenbe crowded into one-half of the tank, and the divider lowered to isolate themfrom new fish entering the tank. The lift basket raised the isolated fish towhere they were easily accessed. Hinged and stationary mylar mesh cover8 wereinstalled over the sampling tank to prevent escape of fish.
(2) Release and removal of fish from the north (recovery) tank were improvedby removing the elbowed drain pipe and flanging the remaining drain stem ontoan elongated 6-in plastic pipe. Also, one end of the steel wire tank coverwas cut out and an aluminum slide gate was inserted to allow access into thetank.
(3) Similar modifications made to the recovery and sampling tanks included theinstallation of slide gates over the overflow slots to regulate water level inthe tanks. In addition, overflow water was contained and routed into theprimary drain line. Extended handles were placed on the drain slide gates tofacilitate operation.
(4) To examine fish, a 6-in (depth) by 8-in (width) by 3-ft (length)anesthetic trough was fabricated. A transport trough, constructed of 6-inplastic pipe with the top half cut out, was positioned directly above theexamining table and anesthetic trough. Auxiliary water was supplied to thetrough to carry fish to the recovery tank.
(5) To supply auxiliary water, a 4-in metal pipe was tapped and flanged intothe facility east wall in an area below the inclined screen. This locationprovided sufficient head pressure during normal water levels for good inflowof water. From the main pipe, 2-in lines were plumbed into the terminal endsof the fish transfer flumes for constant inflow into the tanks. A l-in linesupplied auxiliary water to the transport trough.
(6) Fish not sampled were bypassed. To accomplish this, a 5-in by 18-inbottom section was removed from the transfer flume leading to the north tank.A collection hopper with attached 6-in plastic pipe routed fish passingthrough the opening into the bypass downwell. A levered cover plate permitedclosure of the slotted opening to pass fish into the recovery tank, if needed.Deflectors were welded into the side of the transfer flume upstream of theopening to better channel fish and water into the hopper. Three surfacesections of the pipe were removed and the openings were outfitted with handledcovers to allow access into the pipe for inspection and removal of debris.
(7) To provide necessary oxygen to fish in the event inflow water was notsufficient, an aeration system to each tank was recommended. The initial steptaken toward this modification was the relocation of the compressed airsolenoid to allow for a dual air line supply (one to the tanks and one to the
13

sampling gate). Further work was discontinued until the need for an aerationsystem to the tanks was demonstrated.
(8) To facilitate operation of the sampling gate, remote control capabilitieswere provided in the sampling-trapping area.
The canal headworks area and juvenile fish passage evaluation-pumpbackfacility was watered-up from 7 March to 12 March 1990 to check theeffectiveness of the modifications on the sampling and bypass operation. Thiswas done with the restrictive orifice, inclined screen, and fish separator inplace. The modifications proved effective and we noted only minor additionalneeds. We observed approximately 50 dead juvenile salmonids flushed out fromthe bypass which apparently had become stranded.
Bypass Outfall Sampler
The second major component of our pre-operation activities was the designand fabrication of a bypass outfall sampler. Requirements of the sampler wereto: 1) capture the majority of fish bypassed at 5 and 25 cfs, 2) providesanctuary for captured fish, 3) withstand turbulent river conditions and up to25 cfs bypass discharge, 4) be easily deployed and retrieved, and (5) alloweasy retrieval of fish.
We used a floating net pen design for the sampler. The net was attachedto a top frame of 2.5-in plastic pipe measuring 6 ft by 6 ft 8 in andconsisted of an inner 3/16-in mesh reinforced by an outer 5/16-in mesh ofknotless nylon. The net was 11-ft deep and flared to a width of 10 ft on allsides at the weighted bottom. Steel rings to attach rope for positioning andsecuring the net were installed at each of the bottom four corners and on thetop frame. A bottom net frame was originally included but subsequentlyremoved because it proved cumbersome when deploying and retrieving thesampler.
System Operation
Bypass Facility
We started sampling the juvenile fish outmigration at Three Mile FallsDam on 22 March 1990, one day after the WRID canal was watered up. The systemwas continually adjusted by repositioning the weir gate, inclined screen, andfish separator as wate.c levels fluctuated in the headworks area. However, twomajor problems soon arose: (1) water was not sufficiently eliminated throughthe bypass pipe and subsequently backed up into the juvenile fish sampling-trapping area; this neceeeitated using alternative river return pipes toeliminate the water, and (2) juveniles were observed holding up in theheadworks area of the canal in large numbers and not moving through thebypass.
To correct the latter problem, we increased the flow into the bypass byoperating both pumpback pumps and the traveling screen and removing therestrictive orifice. Although this strategy increased fish movement slightly,the removal of the restrictive orifice created additional flow regulation
14

problems in the juvenile fish sampling-trapping area. Therefore, therestrictive orifice was reinserted. By 2 April, large numbers of fish weremoving out of the headworks area and entering the bypass on their own.
We suspected water was not adequately eliminated through the bypassbecause of a blockage somewhere in the 24-in fish return pipe. Consequently,on 30 March the bypass system was dewatered for pipe inspection. A largedebris plug was located at the lower end of the pipe. An inside gap betweentwo adjoining pipes, connected by an outside coupler, caused debris to wedgeand accumulate. Approximately 1,000 live and dead juvenile salmonids weretrapped behind the blockage and subsequently removed. Once the pipe wascleared of debris, water passage through the system returned to normal.
We sampled outmigrating juveniles until 15 June when low river flowprecluded operation of the fish bypass and sampling-trapping facility.occasional low flows briefly halted sampling operations. The sampling ratewas usually set at 5% to 20%, but we occasionally sampled at rates as low as3.5% or as high as 100%. The sampling gate timer was periodically checked foraccuracy. We usually sampled for 24 hours, 4 days per week.
When possible, we collected data daily on fish bypass numbers, speciescomposition, and fork length (mm) and condition of each fish sampied. Wecalculated daily bypass numbers as
whereN = n/(r.(h/24))
N = Estimated number of fish bypassed,n = Number of fish sampled,r = Sampling rate (percentage of time sampled divided by loo), andh = Number of hours sampled.
Fieh condition was determined using descaling criteria developed by theU.S. Army Corps of Engineers (USACE) (Neitzel et al. 1985). Condition wasbased on the percentage of scale loss.in each of five designated sections perside of fish and ranged from "good" (scale loss I 3% per section) to"descaled" (cumulative scale loss Z 40% in any two sections). A fish waspartially descaled if scale loss was > 3% but < 40% per section (Neitzel etal. 1985). For comparative purposes, summer steelhead were separated intohatchery and native stocks.
We obtained provisional flow data for the Umatilla River at RM 2.1 fromthe U.S. Geological Survey and USBR. Flow was estimated from the amount ofspill over the dam on days when flow data was not available.
Bypass Outfall Sampler
The outfall sampler was tested twice. We deployed the sampler by placingit in the water and positioning it under the outfall, with ropes attached to 3top frame side bridles and bottom net rings angled and anchored in differentdirections. During the first teet on 25 April 1990, deployment and retrievalwere difficult due to the cumbersome bottom frame. We then removed the bottomframe from the net bag and deployed the sampler again. Without the bottom
15

frame, the river and outfall current billowed out the bag, providingsanctuary, and the sampler was less Cumbersome to handle.
We conducted a second test of the sampler on 10 May. After positioningthe net under the outfall, we released 37 marked juvenile salmonids in thebypass 2 ft upstream of the outfall. The net was left in place for 5 minutesfollowing release of the fish. We then retrieved the net and examined fishfor condition and to determine net efficiency. Both tests were conducted withbypass discharge less than 10 cfs.
Velocity Measurements
We measured approach and sweep velocities at the drum screens on 26April, 9 May, and 10 May 1990. We used a Marsh McBirney electromagneticflowmeter and recorded velocities (feet per second) at 0.2, 0.5, and 0.8percent of water depth. Measurements were taken close to the drum screens andusually at the centerline perimeter of the screen. The probe was positionedparallel to the screen pointing upstream for recording sweeping velocitieo andpointed perpendicularly away from the screen for approach velocities. Currentvelocities were also measured at similar water depths at the bypass channelentrance. Headworks elevation, canal flow and operating conditions, waterdepth, and screen submerged depth were noted.
RESULTS
Bypass Facility
Specie6 and number6 of juvenile fish collected during the one weekoperation of the bypass facility in November 1989 were: northern squawfishPtychocheilus oregonensis (lo), largescale sucker Catostomus macrocheilus(351, white crappie Pomoxis annularis (20), and fall chinook salmon (3).
Salmonids collected during the spring outmigration included spring(yearling) and fall (subyearling and yearling) chinook salmon, coho salmon,and summer steelhead. The number of fish bypassed, date when peak numbersbypassed, and outmigration period varied among species and stocks (Figure 3).We sampled 22,565 salmonid juveniles comprised of 23.1% yearling chinooksalmon, 60.8% subyearling chinook salmon, 14.1% coho salmon, and 2.0% summersteelhead. In early June, naturally produced coho salmon fry and fingerling6were identified in the sample. Estimated numbers of each species bypassedduring sampling operation6 were: yearling chinook salmon 92,857, subyearlingchinook salmon 67,189, coho salmon 56,222, and summer steelhead 2,662.
Peak6 in numbers of fish bypassed did not always correspond with peakflows (Figure 3). The largest peak in yearling chinook and coho salmonnumber6 occurred when flow6 were dropping to the lowest level of the Season(mid-April). A shut down in bypass operations when flows dropped to less than40 cfs from 19 April to 22 April stranded large num@ers of fish in theheadworks area. As flow6 increased and reached a peak on 3 May, fish numbers,especially coho salmon, remained relatively high. The peak6 in numbers ofsubyearling fall chinook salmon and juvenile summer steelhead occurred whenflows were unusually high during late May (> 1000 cfe) and early June.
16

0 Sp r k y ohlnook l dmo n
m Fall ohlnook l almon
m Coho ralmoa
m St&head
Date
Figure 3. Weekly totals of the mean numbers of juvenile salmonids migratingthrough the bypass facility at Three Mile Falls Dam for each day sampled, andweekly summary of mean daily flow in the Umatilla River near Umatilla, Oregon.
17

The outmigration period also varied among species and stocks (Figure 3).The majority of fish releases were made above RM 60. The majority of yearlingand subyearling chinook salmon migrated through the system relatively quicklyafter release, given no low flow periods. Coho salmon exhibited a protractedoutmigration from late March to early June, although the bulk of the releaseswere made in late March to early April. Native summer steelhead also had anextended outmigration from late March to mid-June. Peak numbers of hatcherysummer steelhead arrived almost 3 weeks after their release.
Fish condition varied temporally and among species (Figure 4). Conditionof coho salmon, native summer steelhead and subyearling fall chinook wasbetter at the beginning of their outmigration than at the end. F i r s t arrivalsof hatchery summer steelhead were more descaled and in poorer condition thanlater arrivals. Mean descaling rate of hatchery steelhead was highest (7.7%),followed by coho salmon (5.9%), spring chinook salmon (3.8%), native summersteelhead (3.8%) and subyearling fall chinook salmon (1.2%). Juveniles alsoexhibited bird predation marks, fungal infections, head bruises, and bodyinjuries.
Size range of fish varied among species and stocks (Figure 5). Nativesummer steelhead and naturally produced coho salmon were smaller than theirhatchery counterparts.
Bypass Outfall Sampler
During the second test of the outfall sampler, we recovered all markedsubyearling chinook (18) and coho (9) salmon, but only 2 of 7 marked yearlingchinook salmon and 1 of 3 marked steelhead. Because no fish were observed toescape the sampler, we assumed the uncollected fish swam back up into thebypass channel. One coho and one yearling chinook salmon were descaled. Allother fish were in good condition.
Velocity Measurements
Approach and sweeping velocity measurements taken at the WEID canal drumscreens varied with canal flow and operating conditions (Table 1). Approachand sweeping velocities at drum screens 1 through 3 were lowest on 26 Aprilwhen canal flow was low and the pumpback pumps were operating. We also tookthe readings closer to the downsteam end of the screens on this date.Velocities differed little between 9 and 10 May, as did operating conditionsand canal flow. Sweeping velocities usually at least doubled approachvelocities. Pockets of extremely low approach velocities were recorded on allthree dates. Water velocity through the bypass channel entrance averaged 0.51feet per second.
18

m Good
m Partfally dwualedm Deamled
loo Spring chinook salmnn
80
0
100 Fdl &nook ralmon
50
Figure 4. Condition of juvenile salmonids collected in the bypass at ThreeMile Falls Dam, summarized by week.
19

Chfnook salmon N= 1,967
20
10
0140
30
20
10
0
. Coho salmon NJ799m9
.
30
20
10
0
30
20
10
0
7 N=l61Hatchery steelhead
-
1 Native steelbad N=l62
40 60 80 100120140160160200220240260
Fork Length (mm)
Figure 5. Length-frequency distributions of juvenile salmonids collected inthe bypass at Three Mile Falls Dam.
20

Table 1. Approach and sweep velocity measurements (cfs) at the West ExtensionIrrigation District Canal drum screens. Canal flow was 50 cfs on April 26,and 128 cfs on May 9 and May 10. Pumpback pumps were operating on April 26only. Surface water elevation was 404.1 ft each day.
Velocity by dateDrum screen, April 26 May 9 May 10percent depth Approach Sweep Approach Sweep Approach Sweep
Number 1:20 0.09 0.25 0.05 0.96 0.06 0.8850 -- -- 0.04 0.85 0.32 0.9980 0.12 0.35 0.48 -- 0.53 0.98
Number 2:20 0.05 0.35 0.35 0.86 0.52 1.0050 -- -- 0.24 0.97 0.33 1.0280 0.07 0.33. 0.55 -- 0.52 0.96
Number 3:20 0.12 0.45 0.30 0.88 0.20 0.8850 -- -- 0.13 0.80 0.22 0.9780 0.22 0.50 0.50 -- 0.52 1.12
Number 4:20 0.66 0.96 0.13 0.93 0.08 0.7450 -- -- 0.30 0.86 0.46 1.0080 0.28 0.85 0.22 -- 0.35 0.95
21

DISCUSSION
The first major peak in subyearling chinook salmon and summer steelheadnumbers occurred the day following termination of CTUIR juvenile salmonid trapand haul operations at Westland Dam (29 May). Fish numbers were very low atThree Mile Falls Dam during late May because most fish were intercepted atWestland Dam. Upriver juvenile salmonid trap and haul operations may also bethe reason why fish numbers were low at Three Mile Dam in late April, althoughmany fish remained in the lower river and came through in good numbers whenriver flows increased.
Differences in length of the outmigration among species may be caused bydifferences in behavior. Fish behavior is an important consideration whenevaluating effectiveness of bypass facility operation. The short travel timefor chinook salmon and delayed arrival of summer steelhead may be reflected intravel time through the bypass facility. Travel time through the facilitywill be verified by conducting future controlled experiments.
Descaling rates of hatchery steelhead, coho salmon and subyearlingchinook salmon were comparable to rates at nearby McNary Dam on the ColumbiaRiver (USACE 1988, 1989). The descaling rate for yearling chinook salmon inthe Umatilla River was lower than that reported at McNary Dam (USACE 1988,1989). Supplementing the small data set for hatchery and native summersteelhead with future sampling will validate the descaling results for thesespecies. River conditions, length of travel, and release location may haveaffected fish condition.
The delay in fish movement in the headworks area during initial operationremains an enigma. It is possible the fish were holding up because ofinsufficient flows and water draw in this particular area because canal flowwas low (49 cfs) and headgates were minimally opened. Another reason for thedelay may have been that few fish had completed smoltification; the behavioralurge to migrate may not have been strong enough to pass these fish through arelatively calm system. An increased migrational urge with advancedsmoltification and increased canal flow may have been the stimuli for activemovement through the system.
Throughout the early part of the sampling season some juvenile salmonidswere not diverted into the fish sampling-trapping area because they escapedoff the end of the 3-ft separator (l-in bar gap) into the bypass downwell.Fish coming in too fask or at a perpendicular orientation to the bars weremost prone to avoiding diversion into the sampling-trapping area. We observedapproximately 10% of the fish exiting off the separator into the downwell. Wedid not use a separator bar assembly with a larger gap (1 and l/2 in) becauseof the need to exclude larger fish and debris. In late April, USBR installeda 2-in neoprene barrier at the downstream end of the separator whichconsiderably reduced escape of juvenile salmonids yet allowed the escape ofnonseparated fish.
The bypass outfall sampler captured the majority of fish bypassed at lowflows (< 10 cfs), provided sanctuary for captured fish, and allowed relativelyeasy and unstressful retrieval of fish. Sampler deployment and retrieval weremoderately difficult, requiring at least 4 people. Because we were unable totest the sampler when bypass water was 25 cfs or river conditions were
22

turbulent, it is unknown whether the sampler can withstand high bypass andriver flows and also capture the majority of fish. Minor modifications willbe made to fasten the net bag more securely onto the top frame.
Results from velocity measurements indicate that approach and sweepingvelocities at the drum screens met criteria for juvenile salmonids (WashingtonDepartment of Fisheries 1989). However, when water depth was low and canalflow was high, most approach velocities slightly exceeded criteria for salmonfry (0.4 fpe). Sweeping velocitiee met criteria, exceeding approachvelocities in all instances. Water velocity at the bypass channel entrancewae lees than the 2 fpe velocity recommended in the Designer's OperationalCriteria for this ecreening facility (USBR 1989). The reduced velocity wasprobably due to the fact that the pumpback pumps and traveling water ecreenwere not operating. Operation of the pumps would have created an additionalcurrent in the bypass channel when the restrictive orifice is in place.
On 12 April, we observed seagulls flying over the canal downstream of thecheckgates. This was at a time when river flow and fish numbers had suddenlyincreased and the pumpback pumps and traveling screen were operating. Uponcloser inspection, we observed one mutilated juvenile ealmonid in the waterexiting from the checkgate structure. One week after this obeervation, sixjuvenile salmonids were found tangled in tumbleweede removed from a lateralcanal culvert approximately 3 miles downstream from the canal headworks(Richard Berg, West Extension Irrigation District , personal communication).
The discovery of juvenile fish in the canal downstream of the checkgatestructure is a major concern. This indicates that the screening facility isnot excluding fish from the water diversion. Additional evaluation will needto be performed to determine the cause and extent of this screening failure.
Sampling and bypassing outmigrating juvenile salmonids is impossible whenriver flow is less than 50 cfs and the headworks water elevation level dropsbelow 403.4 ft above sea level. Water level below that mark precludes flowover the top of the inclined screen. Low river flow (< 35 cfs) resulted in noflow through the juvenile sampling-trapping facility from 19-22 April. On 18April, river flow decreased overnight from approximately 46 cfs to 25 cfs andthe headworks water elevation dropped to 401.5 ft. No auxiliary water wasavailable due to critically low water levels, and sample tank oxygen wasdepleted. Approximately 500 dead or stressed juveniles were removed from thesample tank and flume. From 17-22 May, a similar but less severe situationoccurred. Headworks water level was again too low (< 403.3 ft) to bypass fishand river flow wae less than 50 cfs. During critical passage situationa, anumber of adjustments were made at the facility to pass water and fish throughthe system. These included lowering the inclined screen and fish separator totheir lowest position, covering the perforated plate at the fish separator toprevent loss of water, and closing the bypass weir gate and transfer flumeperforated plate completely.
These critically poor passage situations point to the need to betterregulate the water level in the headworks, if possible, and perform otheroperations in a timely manner to facilitate trapping of fish for sampling orhauling. A juvenile salmonid trap and haul operation during low flows is notpossible if an adequate headworks water level cannot be maintained. Operationof the pumpback pumps and traveling water screen, opening (or closing) the
23

headgates sufficiently, and closure of the eastbank fish ladder attractionwater all improve bypass conditions and should be immediately implemented whennecessary.
All operating criteria of the WEID canal are based on a normal watersurface elevation of 404.1 ft above sea level in the headworks area (USBR1989). The 404.1 ft elevation is based on the normal operating water eurfacebeing 0.2 times the drum screen diameter below the top of the drum ecreens.To maintain a 404.1 ft water eurface elevation in normal operation, theheadgates should be fully opened and the downstream check structure used toregulate flow into the canal.
On numeroue occasions we observed the constant regulation of headgateopenings, at times to as low as a 1-ft opening on all gates. Although nocorrelation between headgate opening and fish condition has been made, it ispossible that a decreased headgate opening could cause injury to fish. Debrisaccumulations or obstructions at the headgates cannot be observed because theforebay area in front of the headgates is never dewatered. If obstructionsare present, limiting the gate opening may force fish into trash piles,causing injury.
Debris paseing through the trashracks enters the bypass system and cancause problems. When flows are low, large pieces of debris are morefrequently found in the system (Richard Berg, WEID, personal communication).During low flow periods this year, large debris accumulated on the fishseparator. On occasion, debris became wedged in the slotted orifice andtended to accumulate in the surface water on the upstream side of the orificeplate. The critical area for a debris blockage is the 24-in diameter fishreturn pipe. With the large pieces of debris observed coming into the bypassfacility (but intercepted at the separator), the potential for debrisobstructions in the bypass pipe exists. This problem is compounded by thepipe length (> 100 ft) and limited pipe access and can be exacerbated in highflow years when the debris load in the river is greater. The discovery of adebrjs blockage in the bypass pipe where a gap exists between two adjoiningpipes illustrates the potential for debris problems.
Sampling activities were more efficient after modifications were made tothe juvenile salmonid sampling-trapping facility. We were able toconcurrently sample the juvenile salmonids and bypass nonsampled fish duringthe majority of the spring outmigration. The ability to efficiently samplefish will prove valuable for future research and monitoring endeavors. Thefacility modifications were designed to reconvert from a sampling mode to atrap and haul mode with only minor adjustments.
Placement of the inclined screen, fish separator, and restrictive orificein the bypase channel for the entire season partially affected prescribedoperation of the bypass. Operating criteria developed by the National MarineFisheries Service states that when river flow exceeds 150 cfs, all pumps areto be off, all sample facilities removed, and the terminal bypass gate fullyopened. A full bypass mode was not possible with the sampling facilities inplace during times of high flows, as bypass flow was restricted by the orificeplate. Thus, bypass discharge was always much less than the 25 cfs expectedin a full bypass mode with river flow > 150 cfs. Fish bypassed at all flowsand during peak passage periods were necessarily routed through the sampling
24

facility. For a full bypass mode to occur, the inclined screen, fishseparator and restrictive orifice would need to be removed along with the 6-indischarge pipes routed into the downwell at gate 2 (Figure 2). In addition,continual uee of the restrictive orifice without concurrent operation of thepumpback pumps and traveling water screen reduced velocities through thebypass channel entrance to less than the 2 fps velocity required to preventfish from returning to the screening area.
We did not determine bypaee discharge during operations, but assumed thatit was between 5 and 10 cfs. If a constant 0.50 ft differential acroes theorifice plate had occurred, then bypass discharge would have been a constant 5cfe. However, this differential varied with water surface elevation and weirgate position. In addition, we observed water leakage past the inclinedscreen that continually flowed into the bypass channel. The origin of thisleakage remained unknown. Although an obvious "lose" of water was occurring,the leakage provided continuous inflow for juvenile salmonids remaining in thebypass channel when river flows were extremely low and bypass opprationsceased. During a severe water shortage, this lost water could not be retainedfor irrigation purposes.
After the bypass pipe was unplugged on 30 March, we continued to observefew fieh exiting from the bypass outfall structure even when large numbers offish were entering into the bypass system. This became particularly obviousin mid-April when numbers of fish entering the juvenile evaluation area werevery high, yet relatively few fish were returning to the river. A closeinspection of the terminal end of the bypass channel revealed a highconcentration of fish in the area between the lower bypass gate and outfall.Fish were apparently holding up in this slack water area. However, fisheventually exited the bypass and returned to the river since fishconcentration became less obvious with time.
The observation of dead juveniles flushed from the bypass during thepreliminary watering-up of the canal headworks indicates that fish remain inthe bypass system after operation ceases. Apparently, there is no means toeneure that all fish are returned to the river.
The terminal bypass channel is designed for a reduction in flow of 25 cfsor greater before reaching the outfall. However, the design does not appearto be effective in bypassing fish at low flows (< 10 cfs). Water velocityduring low bypass flows did not appear strong enough to forcibly pass fish outinto the river. A low bypass flow will occur when sampling facilities are inplace or river flow is low.
During the entire juvenile salmonid outmigration, we observed passagethrough the eastbank ladder from the east viewing room. Passage of juvenilesthrough the ladder appeared to be similar to passage through the weetbankfacility. When the bypass was shut down in late January, we observed fishjumping in the forebay of the dam. These fish evidently were released from a 1beaver dam blockage at Minthorn (RM 64.5). After several days, we no longerobserved activity in the forebay but observed juvenile fish in the pooldirectly below the eastbank ladder. The observation of juveniles in the adultladder indicates that smolts use the ladder as a means to bypass the dam evenwhen the bypass is in operation. It is also possible that water passing overthe attraction water weir eerves as a bypaes vehicle for juveniles. These
25

observations raise the question as to whether the ladder is designed to bypassjuveniles in an effective and noninjurous manner.
26

RECOMMENDATIONS
(1) The headgates and checkgates to the WEID canal should be automated toensure proper water level elevations in the forebay 'and headworks area at allt i m e s . A normal operating water surface elevation of 404.1 ft at the drumscreens should be maintained whenever possible.
(2) Headgates should be opened greater than one foot at all times to preventinjuries to incoming juvenile salmonids. Overall regulation of water level inthe headworks area should be accomplished through use of the check structure.
(3) Staff gauges need to be installed upstream and downstream of the orificeplate so that head differential may be determined.
(4) A secondary trashrack structure needs to be installed at the bypassentrance to prevent large debris from entering the bypass.
(5) A supplementary aeration system to the holding tanks should be madeavailable to supply oxygen to sample fish in times of critically low waterflow.
(6) Juvenile salmonid trap and haul operations should be performed at ThreeMile Falls Dam when flows decrease to < 50 cfs to prevent bypassing fish intodeteriorating river conditions. During critically low flow, smelts bypassedinto the river are vulnerable to predatory birds. We recommend that CTUIRbecome familiar with the trap and haul facilities and the operation ofequipment and ensure that the system is ready for operation when necessary.
(7) The terminal end of the bypass pipe, where a gap exists between twoadjoining pipe sections, should be modified to prevent debris hangup andobstructions. We recommend an epoxy filler to eliminate the gap.
(8) Construction of a secondary bypass system should be considered for useduring low flows or when bypass discharge is < 10'cfs to efficiently returnfish to the river.
(9) A slide gate under the fish separator perforated plate is needed tocontrol the amount of water elimination during low flow periods. We usedplastic sheeting as a temporary measure to prevent water loss in 1990.
(10) We recommend thaz the Three Mile Falls fish screening facility beoperated according to operating criteria developed by the National MarineFisheries Service and criteria outlined in USBR (1989).
(11) A full scale evaluation should be performed at Three Mile Falls Dambypass system in the WEID canal to determine specific deficiencies indesign, construction and operation and to ensure that the system functions asintended. The study objective should be to evaluate the passage ofjuvenile salmonids through the bypass system including the evaluation atdesign flow of injury and mortality rates, and passage of juvenile salmonidsthrough and over the screens.
27

REFERENCES
Boyce, R.R. 1986. A comprehensive plan for rehabilitation of anadromous fishstocks in the Umatilla River basin. Final report to Bonneville PowerAdministration by Oregon Department of Fish and Wildlife. Contract No.DE-A179-84BP18008. Portland, OR, USA.
Confederated Tribes of the Umatilla Indian Reservation. 1990. Trap and hauldata files. Fisheries Department, Confederated Tribes of the UmatillaIndian Reservation. Mission, OR.
HO6ey & Associates. 1988. Evaluation of the effectiveness of fish protectionfacilites. Chandler facility evaluation. Report by Hosey andAssociate6 Engineering Company for the U.S. Bureau of Reclamation.
Hosey & A66OCiate6. 1989. Evaluation of the effectiveness of fish protectionfacilites. Chandler facility evaluation. Report by Hosey andAssociates Engineering Company for the U.S. Bureau of Reclamation.
Hosey & Associates. 1990. Evaluation of the effectiveness of fi6h protectionfacilites. Chandler facility evaluation. Report by HO6ey andAssociates Engineering Company for the U.S. Bureau of Reclamation.
Neitzel, D.A., C.S. Abernethy, E.W. Lusty, and L.A. Prohammer. 1985. Afisheries evaluation of the Sunnyside Canal fish screening facilities.Spring 1985. Prepared by the Pacific Northwest Laboratory, Richland,Washington, for the Division of Fish and Wildlife, Bonneville PowerAdministration, Portland, OR.
Neitzel, D.A., C.S. Abernethy, E.W. Lusty, and L.A. Prohammer. 1987. Afisheries evaluation of the Sunnyside Canal fish screening facilities.Spring 1985.Prepared by the Pacific Northwest Laboratory, Richland,Washington, for the Division of Fish and Wildlife, Bonneville Power
Neitzel, D.A., C.S. Abernethy, E.W. Lusty, and S.J. Wampler. 1988. Afisheries evaluation of the Richland and Wapato Canal fish screeningfacilities. Spring 1987. Prepared by the Pacific Northwest Laboratory,Richland, Washington, for the Division of Fioh and Wildlife, BonnevillePower Administration, Portland, OR.
Northwest Power Planning Council. 1987. Columbia Basin Fish and WildlifeProgram (as amended). Northwest Power Planning Council. Portland, OR,USA.
U.S. Army Corps of Engineers. 1988. Fingerling collection and transportsummary, McNary Project. U.S. Army Corps of Engineers and WashingtonDepartment of Fisheries cooperative agreement DACW68-82-C-0077. NorthPacific Division, Walla Walla District.
U.S. Army Corps of Engineers. 1989. Fingerling collection and transportsummary, McNary Project. U.S. Army Corps of Engineers and WashingtonDepartment of Fisheries cooperative agreement DACW68-82-C-0077. NorthPacific Division, Walla Walla District.
28

U.S. Bureau of Reclamation. 1985. Umatilla Basin project, prOpO6ed planningreport and advanced draft environmental statement. Pacific NorthwestRegion. Boise, ID.
U.S. Bureau of Reclamation. 1989. Preliminary designer's operating criteria.Three Mile Falls Diversion Dam left bank fish facilities, Umatillaproject, Oregon. Denver, CO.
Washington Department of Fisheries. 1989. Juvenile salmon ecreening criteria(revised). State of Washington Department of Fisheries, HabitatManagement Division, Olympia, WA.
29

APPENDIX A
Operating Criteria, Three Mile Falls Dam Fioli Screening Facility(Revised 2-15-90)
Canal water surface elevation should not be lower than 403.5 ft.Depending on the amount of streamflow past the dam, one of three bypassoperational mode6 can be employed:
1. Operation when streamflow past dam exceeds 150 cfs (according to theUmatilla gauge):
(During this period, all pumps are off, all eampling facilities are removedand the bypass gate is fully open.)
A. Traveling water screen will not operate.
B. Gate G-l is closed.
C. Pumps P-l and P-2 are off.
D. The 5 cfs orifice insert plate is removed from Slot
E. Remove inclined screen and fish separator from bypass channel.
F. Close Gate G-2.
G. Leave Gate G-3 open.
H. Place stoplogs in Slot B (to full height)
I. Lower Gate G-4 so that weir crest is at elevation 401 ft. (Mark onthe gate stem 60 gate is not lowered too far.) The gate crestshould be 2.5 ft. below the canal water surface.
J. closure Gate G-5 should be in the raised and fully open position.
K. Lower Gate G-6 to full-open position.
2. Operation when streamflow past the dam is less than 150 cfs, and screenbypass flow is to be 5 cfs, directed to tailwater:
(This will occur when streamflows are diminishing in the spring, andespecially during interim pumping operations in the lower river.) Initiationof this operating mode should be determined by ODFW and WEID.
A. Operate traveling water screen.
B. Close Gate G-l.
C. Operate Pump6 P-l and P-2.
D. Insert 5 cfs orifice plate into Slot A.
30

E. Remove inclined screen and fish separator from bypass channel.
F. ClOSe Gate G-2
G. Leave Gate G-3 open.
H. Place stoplogs in Slot B.
I. Raise Gate G-4 weir crest to elevation 402.6 ft.(distance from canal water surface to weir crest of 0.9 ft.)
J. Closure Gate G-5 fully open.
K. Set Gate G-6 at elevation 394.5 ft (mark on gate stem).
3. Operation when streamflow past the dam is zero:
(This will occur after river flows have dropped off, but there are stilloutmigrating fish to be collected and transported. Or, this may occur duringsampling and passage evaluation activities.) This operation will also beinitiated at the discretion of ODFW and WEID.
A. Traveling water screen operates.
B. Pumps P-l and P-2 operate.
C. Insert orifice plate into Slot A.
D. Install inclined screen in bypass channel.
E. Remove stoplogs in Slot B.
F. Install fish separator in bypass channel.
G. Position holding tanks to receive flume flows fromfish separator.
H. Gate G-l closed.
I. Open Gate G-2.
J. Open Gate G-3.
K. Pump P-3 operates.
L. Adjust Gate G-4 to provide a differential of 0.50 ft across theinsert orifice plate.
M. Close Gate G-S.
(Gate G-l may be used to sluice sediment accumulating behind the travelingscreens prior to operation of P-l and P-2.)
31

Notes:
1. One partial bulkhead, several feet high, should be installed in the slotsimmediately downstream of each drum screen. The insert elevation of eachpartial bulkhead ehould be 8-10 in. above the concrete slab elevation. Thiswill greatly reduce sediment build-up in each screen bay.
2. The USBR should be notified several days in advance of when the juveniletrap is to be installed.
32
I

REPORT B
1. Examine the passage of adult salmonids at Three Mile FallsDam.
Prepared By:
Keith Kutchins
Confederated Tribes of the Umatilla Indian ReservationDepartment of Natural Resources, Office of Fisheries
P.O. Box 638Pendleton, Oregon 97801
33
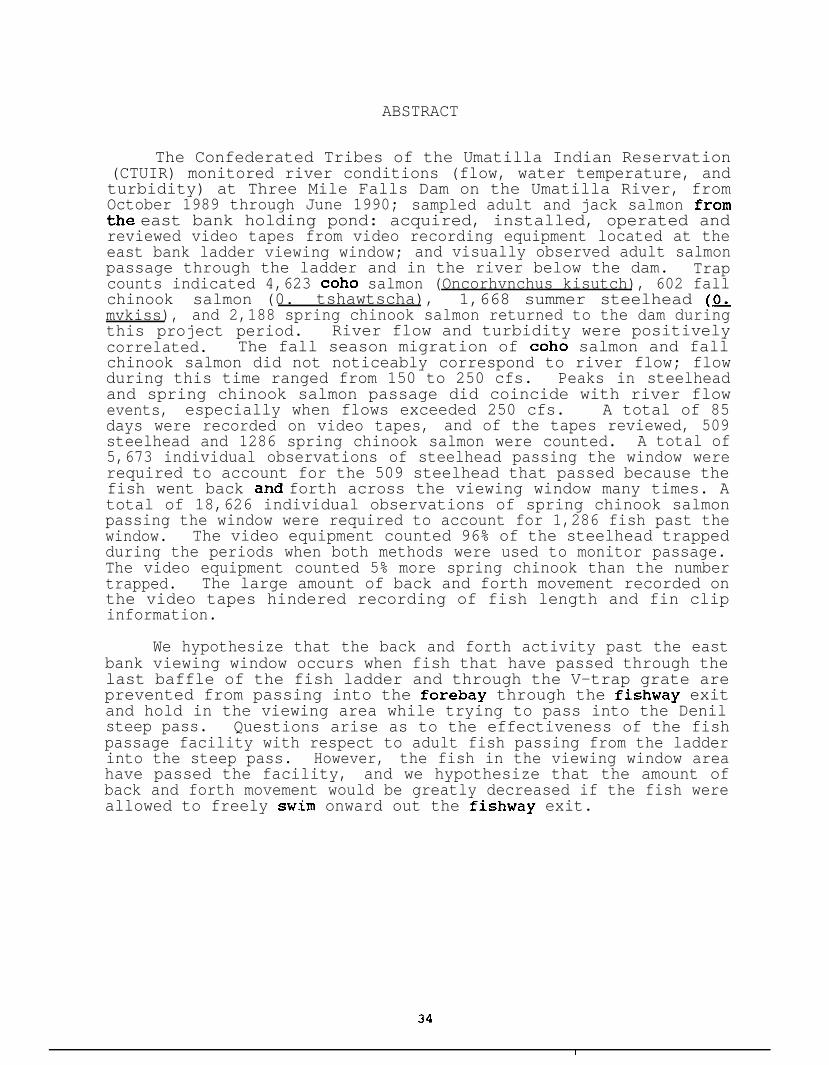
ABSTRACT
The Confederated Tribes of the Umatilla Indian Reservation(CTUIR) monitored river conditions (flow, water temperature, andturbidity) at Three Mile Falls Dam on the Umatilla River, fromOctober 1989 through June 1990; sampled adult and jack salmon fromthe east bank holding pond: acquired, installed, operated andreviewed video tapes from video recording equipment located at theeast bank ladder viewing window; and visually observed adult salmonpassage through the ladder and in the river below the dam. Trapcounts indicated 4,623 coho salmon (Oncorhvnchus kisutch), 602 fallchinook salmon (0. tshawtscha), 1,668 summer steelhead (0.mvkiss), and 2,188 spring chinook salmon returned to the dam duringthis project period. River flow and turbidity were positivelycorrelated. The fall season migration of coho salmon and fallchinook salmon did not noticeably correspond to river flow; flowduring this time ranged from 150 to 250 cfs. Peaks in steelheadand spring chinook salmon passage did coincide with river flowevents, especially when flows exceeded 250 cfs. A total of 85days were recorded on video tapes, and of the tapes reviewed, 509steelhead and 1286 spring chinook salmon were counted. A total of5,673 individual observations of steelhead passing the window wererequired to account for the 509 steelhead that passed because thefish went back and forth across the viewing window many times. Atotal of 18,626 individual observations of spring chinook salmonpassing the window were required to account for 1,286 fish past thewindow. The video equipment counted 96% of the steelhead trappedduring the periods when both methods were used to monitor passage.The video equipment counted 5% more spring chinook than the numbertrapped. The large amount of back and forth movement recorded onthe video tapes hindered recording of fish length and fin clipinformation.
We hypothesize that the back and forth activity past the eastbank viewing window occurs when fish that have passed through thelast baffle of the fish ladder and through the V-trap grate areprevented from passing into the forebay through the fishway exitand hold in the viewing area while trying to pass into the Denilsteep pass. Questions arise as to the effectiveness of the fishpassage facility with respect to adult fish passing from the ladderinto the steep pass. However, the fish in the viewing window areahave passed the facility, and we hypothesize that the amount ofback and forth movement would be greatly decreased if the fish wereallowed to freely swim onward out the fishway exit.
34
1

ACKNOWLEDGMENTS
Thanks go to the"following people for their help with thisstudy. Jay Marcotte and Jerry Bauer (Bonneville PowerAdministration) and to Anthony Nigro and Dave Ward (0DJ-J,Clackamas) for their assistance with this project. Tom Leonard,Spenser Day, and the rest of the Bureau of Reclamation maintenancestaff for completion of modifications that assisted this project.Sue Knapp and Steve Banghart (ODFW, Hermiston) for their fieldassistance and advice. Ron Foss (Columbia River Inter-TribalFisheries Commission) assisted with the purchase and installationof the video equipment.
Special thanks to the following Confederated Tribes of theUmatilla IndianReservation (CTUIR) employees for their assistance.Douglas Olson, Larry Cowapoo, and Melvin Farrow for collectingfield data and reviewing the video tapes. Celeste Reeves and JulieBurke for assistance with preparation of this report. Joe Richardsfor administrative assistance and Gary James for contractmanagement, assistance, and critical review.
35

INTRODUCTION
Three Mile Falls Dam, its headworks, and east bank fish ladderwere constructed in 1914 by the Bureau of Reclamation to divertwater for irrigation. The original pool-and-weir ladder was notoperational from 1964 until 1984. This ladder was plagued withproblems, such as false attraction flows, channel obstructions, andsedimentation blocking the upstream exit. Modifications to theladder to improve fish passage conditions were completed by 1987,and included modified entrances and increased attraction flows,changes to ladder steps to prevent stranding and adult delays inthe ladder, and modified exit structures. The study reported herewas designed to evaluate passage of adult salmon at Three MileFalls Dam to ensure that adult passage facilities are operating asdesigned and any mortality that results from injury or delay due tothe facilities is documented and corrective actions recommended.In this report, we summarize the methods developed in 1989 and 1990to evaluate improvements at Three Mile Falls Dam with respect toupstream migration passage. Methods included recording riverconditions, visually observing passage through the dam, videotaping passage past the ladder viewing window, and enumeratingsalmon trapped after passing the dam.
METHODS
We monitored river conditions (flow, water temperature, andturbidity) at Three Mile Falls Dam from October 1989 through June1990; sampled adult and jack salmon from the east bank holdingpond: acquired, installed, operated and reviewed tapes from videorecording equipment located at the east bank ladder viewing window;and visually observed adult salmon passage through the ladder andin the river below the dam. The west bank adult facility was notwatered up during the 1989-1990 salmon migration. Therefore, nosalmon were trapped or video taped in the west bank facility.River temperature was recorded in the east bank ladder near theviewing window at hourly intervals from October 4, 1989 throughJune 19, 1990 with a digital recording thermometer. The data wasthen downloaded into a computer and daily average temperatures werecalculated and graphed. Turbidity was measured with a secchi diskin the forebay to the nearest tenth of a meter. Average dailydischarge data from October 1, 1989 through May 18, 1990 wasobtained from the U. S. Geological Service as recorded at theUmatilla gage approximately 1.5 km below the dam. The flow datareported for May 19 through June 19 was provided from visualobservations in conjunction with incomplete gage data. Simplelinear correlations of river conditions and fish passage wereanalyzed by calulating the product-moment correlation coefficient(r) and the probability of a zero correlation (P).
Carcass surveys were performed below Three Mile Falls Dam tothe river mouth backwater (partly conducted as a tribal and stategeneral fisheries management activity).
36

Species composition and enumeration of adult and jack salmonin the east bank holding pond was determined by sampling the fishin conjunction with the Umatilla Trap and Haul project. We definedjack coho salmon as less than 508 mm (20 in); jack chinook salmonas less than 610 mm (24 in): and subjack fall chinook salmon asless than 457 mm (18 in). These counts were used to record thosefish that completed passage through the east bank facility, and toverify the counts obtained with video recording equipment throughthe ladder viewing window.
We acquired and installed video recording equipment in theeast bank viewing room on February 23, 1990 and operated itintermittently until June 19, 1990 (Table B-l). The equipmentconsisted of a PanasonicR D5000 camera with a 6mm fixed focus lensmounted on a monopod with the lens four feet from the center of thewindow; a PanasonicR AG-6720 time lapse video cassette recorder(TLVCR), and a PanasonicR WV-3203B power supply (Figure B-l). TheTLVCR and camera were connected to the power supply (the camera wasconnected with a PanasonicR WV-CA-10 cable), and the power supplyand TLVCR were plugged into a SL Wabe# EP7S surge protector whichwas plugged into the wall outlets. A monitor was attached to thesystem during installation to view what the camera was recording.The camera was mounted sideways to completely encompass the entirewindow without overlapping the wall surrounding the window (VCRcameras record a greater width than height, yet the window ishigher than wide). During installation, the lens iris was adjustedall the way open (f-stop 1.8), the SES/NORMAL selection was set tonormal, and the Automatic Gain Control (AGC) set on high to providehigh sensitivity at low illumination. The White Balance SelectionSwitch (AWC/ATW) was set on automatic white balance (AWC) and thecamera aimed at a white piece of paper and the White Balance Setswitch depressed while the white balance automatically adjusted foroptimum recording of two different light sources (eg., indoor andoutdoor lighting). Then, the lens iris (f-stop) was adjusted alongwith the background focal control (flangeback adjustment gear) tofind the optimum balance between the amount of light allowed in andthe focal point (the light and focal point work inversely to eachother). Therefore, illumination was maximized along with depth offield so that the recordings were both well lit and focusedthroughout the one foot distance between the backlighting chamberand the viewing window.
When the system was powered up, the camera sent its picture tothe TLVCR, which was loaded with a standard VHS video cassette andallowed recording of extended periods of time. A total of 85 dayswere video taped, approximately 30% of the total number of daysthat salmon passed Three Mile Falls Dam. We recorded in the 72-hour mode, enabling us to record three days of passage on eachtape. In the 72-hour recording mode, the tape recorded a fieldevery 0.6 second, yet recorded the real time of day on each fieldof tape. The date and time label was positioned on the uppercorner of the tape to minimize overlap with recorded fish. Thetapes were fast-forwarded and rewound in a fast-forward/rewindmachine before recording in order to fluff the tapes. The TLVCR
37

Table B-l. Video recording and tape change dates - Threemile FallsDam, Umatilla River, east bank, 1990.
Tape#
Video Tape InDate Hour
Video Tape OutDate Hour
1 2/23 1500 2/262 2/26 1015 2/283 2/28 0700 3124 3/2 1255 3/55 3/5 1008 3/76 3/7 0915 3/g7 3/g 1135 3/118 3/11 0800 3/129 3/12 1425 3/15
10 3/15 0737 3/18
11 3/22 1510 3/2512 3/25 1255 3/2713 3/27 1306 3/28
14 412 0935 4/5
15 5/l 1400 51216 512 1215 5/417 5/4 1200 5/718 5/7 1053 5/1019 5/10 1105 5/1120 5/11 1010 5/1421 5/14 1200 5/1722 5/17 1225 5/1923 5/19 1746 5/2224 5/22 1257 5/2925 5/29 1045 6/l26 6/l 1038 6/427 6/4 1007 6/728 6/7 0945 6/1229 6/12 0915 6/1530 6/15 1001 6/1931 6/19 1302 6/21
Comments
1015 Camera Installed070012541008 3/3-5 Malfunction091711350800142507331315
Equipment Stolen125513061430
Door &ck Improved1400
VCR Malfunction12151200105311051010120012251745125210451036100709470915093013001200
(CTUIR filename C:\KEITH\UP\UPTABl.WP5)
38

FLOW
--- .-__. ..-. ,..... _. . . . ..-...--
DAH CRESTAUX. WATER TllASlillACI(, T-2-7 ? .
FISHUAY EXIT
-NTRANCE POOL%JSERS, O-2
t
STEEPPASS .JRACKLIGHT1NG CHAMBER
FLmESCENT SHOP LAWS
MODIFIED BY C.T.U.I.R. JULY 1990rNATIONAL tlARINE FISHERIES SERVICl
' 3 - MILE D'AMFigure B-l. Three Mile Falls Dam Right Bank Fishway, RIGHT FXSHWAYand Video Equipment, Umatilla River DESI6NED 8)‘: S.R DATE: l-S-B9 PAGE:
DRAIN BY: -6.A.H. SCALE: NONE OF:

was locked in the record position each time the tape was changed,to prevent accidental adjustments or disruptions. If power to thesystem was interrupted, the system would automatically come back onwhen power was restored, leaving a message on the tape indicatingwhen power was lost. When tapes were changed, the date, start timeand end time was recorded on the tape label and in a log book,along with secchi disk data and general comments. The TLVCR headsand the camera lens were cleaned approximately once a month. Theviewing window and backlighting chamber were well cleaned beforethe ladder was watered up, and approximately once a week thereafterto prevent algae build up. The backlighting chamber was adjustedto provide a one foot clearance between the chamber and the viewingwindow. The backlight was operated only during periods of extremeturbidity (less than approximately 0.25 M), and not operated inclearer water in order to prevent the lights from silhouetting thefish. Fluorescent shop lamps were installed along the sides infront of the window to allow recording of passage at night, and toenhance recording during periods of high turbidity.
The video tapes were reviewed using a high resolution IkegamiRCMU1450 monitor and a special PanasonicR AG-1960 VCR playbackmachine that allowed ready forward, rewind, and freeze-framecapabilities. Data recorded included date and time, tape number,date the tape was reviewed, the tape reader, backlight on or off,and general comments (eg., non-salmonid species, smolt passage).Species were identified, and fish movements upstream past thewindow, downstream past the window, upstream into the viewing areaand then back downstream, and downstream into the viewing area andthen back upstream were enumerated. These enumerations wereassisted by use of multiple unit tally meters and the totals foreach hour recorded.
Visual observations of coho salmon and fall chinook salmonpast the viewing window and in the pools directly below the ladderentrance were recorded. These observations included generalobservations of numbers of fish passing into the base pools belowthe ladder entrance and were compared to numbers of fish in theholding pond. Also, on May 3 and May 10 the tape reader recordedfish passage through the viewing window from 1100 to 1200 hours.Visual and tape counts were compared to further verify the videorecordings.
RESULTS
River Conditions, Trapping, and Visual Observations
Average daily temperatures ranged from 1.6 C (34.9 F) inFebruary to 24.7 C (76.5 F) in July (Figure B-2, Appendix B-l).Turbidity ranged from the clearest water in mid-December and April(1.8 M) to the most turbid water (0.2 to 0.3 M) in mid-March andJune (Figure B-3, Appendix B-l). The turbidity of the river wassignificantly negatively correlated (r=-0.710, P<O.OOl) with the
40
I

1 Nova9 6Dec89 9 Jan90 13Feb90 20Mar-90 24Apt-90 28May90
DATE
Figure B-2. Mean daily water temperature at Three MileFalls Dam, Umatilla River, October 4, 1989 throughJune 19, 1990.
I I I I I t I (,FLOW=solid SECCHI=dotted)I I I I I I 1 I I I I I I I t I I- .d., . .. - .. -, - .. * .. - .* - .
. - .- . L “.T
1 * .
. . . -. . .
1 Nova9 6Dec89 9Jan90 13Feb90 20Mar-90 24Apr-90 28May90
DATE
Figure B-3. Mean daily discharge as measured at the Umatillagage (USGS provisional data): and secchi disk depths asrecorded at Three Mile Falls Dam, October 1989 throughJune 1990.
41

river flows (Figure B-3, Appendix B-l). Average daily flows, asrecorded at the Umatilla gage, peaked in early May and early June(greater than 1900 cfs). The lowest flows were seen during the endof December (less than 100 cfs) and in mid-April (less than 50cfs). Flow was not correlated with temperature (r=-0.086,P=O.433), and temperature and turbidity were not correlated(r=0.109, P=O.332).
Carcass surveys between Three Mile Falls Dam and the rivermouth backwater were conducted on November 22 and December 15. Atotal of 92 dead fall chinook salmon (15% of the fall chinook thatwere trapped at the dam) and 52 dead coho salmon (1% of the cohothat were trapped), along with 75 redds were observed (Table B-2).
Trap counts indicated 4,623 coho salmon (4,102 adults and 521jacks), 1,668 steelhead (0. mvkiss), 602 fall chinook salmon (279adults, 247 jacks, and 76 subjacks), and 2,188 spring chinooksalmon (2,156 adults and 32 jacks) returned to Three Mile Falls Damfrom September 1989 through June 1990 (Figure B-4 and Appendix B-1 ) l
The coho salmon and fall chinook salmon passed over the damfrom early October through early January, the steelhead migratedfrom early October through early May, and the spring chinook salmonfrom early April through the end of June.
The majority of the coho salmon and fall chinook salmon passedthe dam when flows were between 150 and 250 cfs, and flows did notexceed 258 cfs during this period. There was no correlation(P>O.289) between river conditions (temperature, turbidity, orflow) and upstream migration of these two species (Figure B-5,Figure B-6). However, minor flow increases (approximately 200 to250 cfs from October 20 to 27; and from 150 to 200 cfs fromNovember 8 to 18) along with an approximately 1.5 degree increasein temperature during the same time periods appear to roughlycoincide with coho salmon and fall chinook salmon peak migrationperiods. During these two periods, 3,144 coho salmon (72% of thetotal run) and 342 fall chinook salmon (55% of the total run) weretrapped at the dam.
The majority of steelhead passed Three Mile Falls Dam frommid-February through March. There was no correlation (P>O.O21)between river flow or turbidity and steelhead passage (Figure B-7).There was a significant negative correlation (r=-0.449, P<O.OOl)between river temperature and steelhead passage. In early January,flows increased from 100 cfs to over 600 cfs, and over 400steelhead (24% of the total run) were trapped shortly thereafter.From mid February through the end of March, four major peaks inflows occurred (from 100 to 1000 cfs, 450 to 1100 cfs, 850 to 1300cfs, and 750 to 1430 cfs) and 750 steelhead were trapped (45% ofthe total run). The lag between flow increases and steelheadtrapped displayed in Figure B-7 may partly be due to theperiodicity of when the trap was checked, and may also be partiallydue to the steelhead migrating on the downward edge of the flowevents.
42
I

Table B-2. Results of spawning ground surveys conducted in the Umatilla Riverfrom 700 feet below Three Mile Falls Dam to the river mouth backwater at the Cityof Umatilla.
Redds Live Fish Dead Fish
pilesDate occ. Unocc. CHF COH Unid. Total CHF COfl Unid. Total
11/22 2.5 19 23 a 4 15 27 37M 188/ 6 61
12/15 2.5 0 56 0 1 1 2 55C' 34v 11 100
Total 2.5 19 56 8 5 16 29 92 52 17 161
b' M:F=1:2.7 (n=34); 31 spawned out, 0 prespawn morts; 3 jacks; 8 CWT, 6 snouts
B' M:F=1:3.0 (n-12); 6 spawned out, 3 prespawn morts; 3 jacks: 2 CWT., 1 snouts
2' M:F=1:1.9 (n=49); 39 spawned out, 2 prespawn morts; 0 jacks; 21 CWT,l5 snouts
0' M:F=l:l (n=26); 11 spawned out, 4 prespawn 5morts; jacks; 4 CWT, 2 snouts
(CTUIR filename C:\KEITH\UP\UPTAB2.WP5)
43

8
z0
0
(COHO=solid CHF=dotted STS=dashed CHS=solid)~““‘I”““““““““““““““‘~
lNov89 6Dec89 9Jan90 13Feb90 20Mat-90 24Apr-90 28May90
DATE
Figure B-4. Salmon returns to Three Mile Falls Dam, UmatillaRiver, October 1989 through June 1990.
44
I
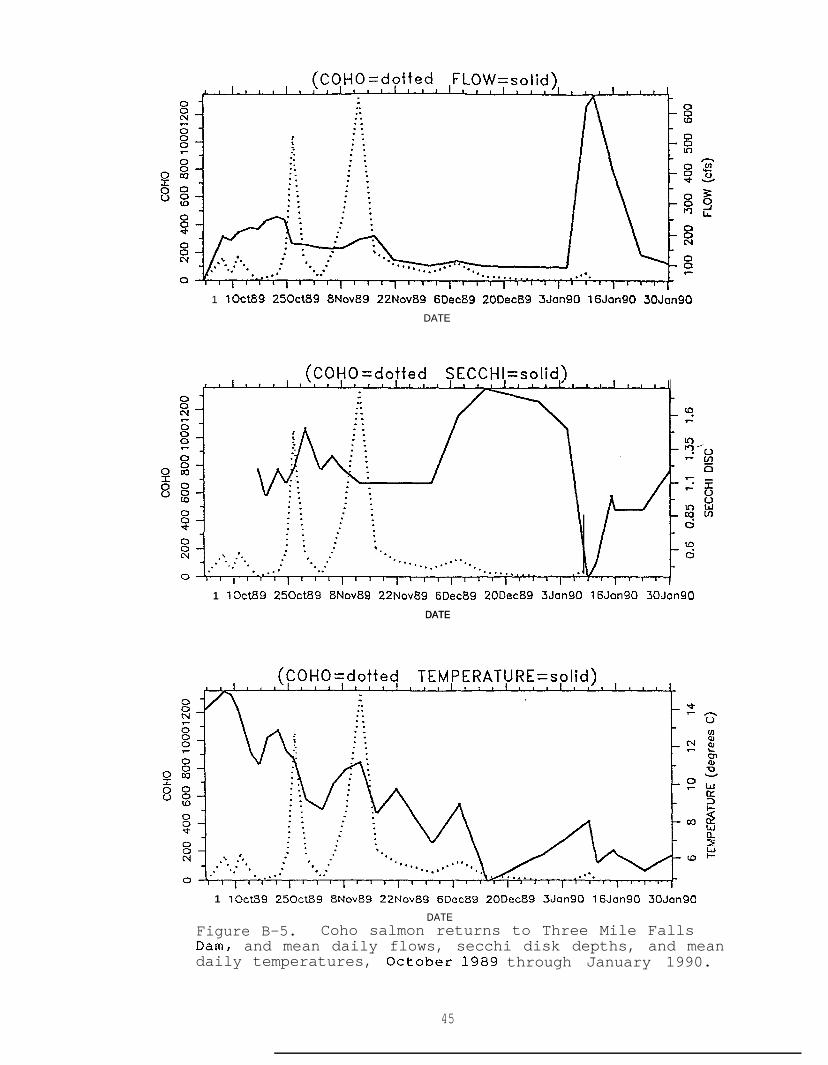
1 lOct89 25Oct89 8Nov89 22Nov89 6Dec89 20Dec89 3Jan90 16Jan90 30Jan90
DATE
1 lOct89 250ct89 8Nov89 22Nov89 6Dec89 20Dec89 3Jan90 16Jan90 30Jan901 lOct89 250ct89 8Nov89 22Nov89 6Dec89 20Dec89 3Jan90 16Jan90 30Jan90
DATEDATE
1 lOct89 25Oct89 SNov89 22Nov89 6Dec89 20Dec89 3Jon90 16Jon90 30Jan90
DATEFigure B-5. Coho salmon returns to Three Mile FallsDam, and mean daily flows, secchi disk depths, and meandaily temperatures, October 1989 through January 1990.
45

0
1 lOct89 250ct89 8Nov89 22Nov89 6Dec89 20Dec89 3Jan90 16Jan90 30Jan90
DATE
(FALL CHINOOK=dotted SECCHI=solid)I”“““““i”“““~l”“““‘Ii
1 a.I 1 I, 1, I I I, I I I I I ,‘I
1 lOct89 250ct89 8Nov89 22Nov89 6Dec89 20Dec89 3Jan90 16Jan90 30Jan90
DATE
FALL CHINOOK=dotted TEMPERATURE=solid)““““~““““““““1”“’i:. :*-. ::. .
1 lOct89 250ct89 8Nov89 22Nov89 6Dec89 20Dec89 3Jan90 16Jan90 30Jan90
DATE
Figure B-6. Fall chinook salmon returns to Three MileFalls Dam, and mean daily flows, secchi disk depths, andmean daily temperatures, October 1989 through January 1990.
46

(STEELHEAD=dotted, FLOW=solid)I I * I I * I II 11 1 ’ 1 ’ “1 1”) ‘1 ’ 11 11 I@ 11 I3.-5:- . . c .r . .. .. . 4
. .3 . . . - - .
I
3- 8- 0 ?A 2 0-0 -F
“-gb-l ii
52- -8. In
1 Nov89 6Dec89 9Jan90 13Feb90 ‘LOMarS 24Apr90 28May90
DATE
1 Nov891 Nov89 6Dec896Dec89
. .. .
9Jan909Jan90 13Feb9013Feb90 20Mat-9020Mat-90 24Apr-9024Apr-90 28May9028May90
DATEDATE
1 Nov89 6Dec89 9Jan90 13Feb90 20Maf-90 24Apt-90 28May90
DATEFigure B-7. Steelhead returns to Three Mile Falls Dam,and mean daily flows, secchi disk depths, and mean dailytemperatures, October 1989 through May 1990.
47

Flows had decreased to 20 cfs by April 20.April through the
During the end offirst week of May, several large freshets
produced flows averaging approximately 1,800 cfs and flows remainedabove 150 cfs for the remainder of the season. Another series offreshets occurred during the end of May and early June. Springchinook salmon migration past Three Mile Falls Dam wassignificantly correlated (r=0.585, PXO.001) to these flows; and toturbidity (r=-0.706, P~O.001) (Figure B-8). From April 30 throughMay 14, flows averaged about 1,100 cfs, and 1,550 spring chinooksalmon (71% of the total run) passed the dam. When flows decreasedto 150 to 300 cfs, spring chinook salmon migration also decreased.From May 29 through June 4 flows averaged 1,400 cfs, and 340additional chinook salmon (16% of the run) passed the dam.
Video Data and Visual Observations
During 33 days of taping steelhead migration, 509 steelheadwere counted by reviewing the video tapes (Table B-3). A total of5,673 individual observations of steelhead passing the window wererequired in order to account for the 509 steelhead that passedbecause the fish went back and forth across the viewing window manytimes. Steelhead went past the window in an upstream direction2,435 times, and back down past the window 1,926 times; thedifference being 509 fish. Steelhead went up into the viewingarea, stopped at the window, and passed back down without passingthe window 968 times, and 344 times they were observed coming downinto the viewing area from above, stopping, then proceeding backup* On several occasions the fish stayed in the window for up toseveral hours at a time. Most of the steelhead movement appearedto be in the early morning hours, and in the early evening untildark. The vast majority of the fish passed the viewing area alongthe floor of the ladder.
We reviewed 21 days of video tape during the spring chinooksalmon migration (Table B-3). A total of 18,626 individualobservations of spring chinook salmon passing the window wererequired to count 1,286 fish past the window. During the 21 dayperiod, spring chinook salmon went past the window in an upstreamdirection 7,912 times, and back down past the window 6,626 times:the difference being 1,286 fish. Spring chinook salmon went upinto the viewing area, stopped at the window, and passed back downwithout passing the window 3,724 times, and 364 times they wereobserved coming down into the viewing area from above, stopping,then proceeding back up. Individual fish also stayed in the windowfor up to several hours at a time. The spring chinook salmonappear to move during hours of light, and very little movement wasobserved during hours of darkness.
During periods when we concurrently operated the videoequipment and checked the trap, a total of 375 steelhead werecounted on the video tapes and 392 steelhead were trapped (FigureB-9, Table B-4). The video equipment accounted for 96% of the fishtrapped. During periods of the spring chinook salmon migration
48

1 OApr-90 24Apl-90 8Moy90 21Moy90 4Jun90 lBJun90
DATE
lOApr90 24Apr-90 SMoy90 21 May90 4Jun90 18Jun90
DATE
5:-l-
g00z o-
3
i262a o-VI*
, , ( , , a , , , ( ( , , , ,
1 OApr90 24Apr-90 8May90 21May90 4Jun90 18Jun90
DATE
Figure B-8. Spring chinook salmon returns to Three MileFalls Dam, and mean daily flows, secchi disk depths, andmean daily temperatures, April through June 1990.
4 9

Table E-3. Sunnary of video tape data for Three Mile Falls Dam, east bank, 1990.
Date
SPE;$’
2/242/2521262/272/283/l3/2
3/3;;;4y
3/63/73/83/93/103/113/123/133/143/153/163/173/18
3,1;;;;22g
3/2331243/253/263/273/28
3/2f;:/2"
4134/44/5
4/5-S/#SPECIES
5125/35145/55/6
"6;;;;'"
5/135/14s/155/16s/175/185/195/2051215122
5/23-5/3&5/316/l6/26/3614
6/4-6/21!’
Startm
1330
1000
1500
0 9 0 0
1 2 0 0
: End # # # UP # Doun # Up minusHour& Dovn then Down then Up #-Down
S T S S T S S T S S T S S T S41 3 5 1 6 3 6
115 8 7 3 2 18 2826 20 15 2 663 48 27
1:15
65 58 21 7
:t1521
2 4 0 0 131 105595 471
105169666 54 38 915
3
5 5
i!6 5
90
EY2 5
5!66
52
11
::1 4
7812
18
::152463
8 7 6 0 3 3 10 2 7145 114 7 2 9 31127 96 49 1 0 31130 113 4 8 17 17126 104 45 11 2 2
1300 23 18 9 0 51193 956 518 128 237
5 4 2 04 5 16 :: :4
108 87 29 12 2151 44 13 17
105 81 21 22 24763 50 18 19 13
1400 34 2 7 6 10 74 9 9 3 8 8 123 104 111
51:
4 0 317 8 1 5
41 :z 6 151300 41 2
129 96 96 9
2 4 0 0
0 9 0 0
CHS STS CHS STS CHS STS S T SCHS S T SCHS611 1 516 0 2 9 9 0 01044 17 872 15 433 9 :5 0 1; :
1050 0 917 0 4 4 1 0 0 133938 0 748 0 587 0 2 0 190 8272 0 222 0 220 0 4 0 50 0
3915 18 3275 15 1980 9 129 0 640 3
253 0 189 0 2 5 0 0 9 0 64 0175 0 131 0 104 0 1 0 44 0
107135 :, 1: 8 z i : i :: :,
154 0 132 0 85 : 1 6 i 2 2151 0 138 0 72 8 13 x76 0 73 0 51 0 0 0
255 0 192 0 79 0 22 0 6: 0
510 0 410 0 141 1002 7 6 0 2 4 1 0 64 i :8 ii 35 0"354 0 354 0 143 0 36 0 0 0
2446 1 2058 0 1182 0 178 0 388 1
645 0 556 0 233 0 19 0 89 0
387 0 352 0 150332 0 256 0 94 i 1: 0" 3576 :
155 0 108 17 4732 0 21 : 7411 ; 1 i 11 81551 0 1293 0 562 0 57 0 258 0
A' STSIi/
= steelhead CHS = spring chinook salmonTime-Lapse VCR malfunction.
i: Video Recording equipment stolen.
z/Video equipment removed while block plate instaIled on viewing room door.Time-lapse VCR malfunction - sent in for re
v Tapes not reviewed yet. UIR filename C:\KEITH\UP\UPTAB3.UP5)

VIDEO DATA (Total=375) - blank TRAP DATA (Total=392) - solld
-I l-
2/23-28 2/28-28 3/12-14 3/14-16 3/23-26 3/26-28 3/5-7 3/7-Q 3/Q-12 412-4
DATE - 1990
Figure B-9. Enumeration data of steelhead as measured withvideo tape recordings compared to trap counts, Three MileFalls Dam, east bank, February through April 1990.
51

Table B-4. Sumnary of steelhead video tape and trap data during periods ofsimultaneous operations, Threemile Falls Dam, east bank, 1990.
VIDEO TAPES TRAP DATA
DATE
2/232/242/252/26
2/262/272/28
3/53i63i7
3i73i83i9
3i93ilO3 i l l3i12
3i123i133il4
3il43il53i16
3i233/243i253i26
3i263i273i28
4/24i34/4
m
1200
0900
1000
0900
1200
0 9 0 0
1000
0900
1000
0 9 0 0
1 0 0 0
0 9 0 0
1000
0 9 0 0
1200
0 9 0 0
1000
0 9 0 0
1200
0900
# #up @!!!A41
115 i:26 209
75-iA!152
54 38 1665 58 715 10 5134 106 28
# UPMINUS
#DOWN
286
239
DATE m#
a23 1200to
2/26 120052
2/26 to 1200
2/28 120029
921694 3304
f :
s
ii:150137
83772162
IE6 5265
2513
240
917
228
10246040
3i5 to 1200
3i7 1200
3i7 to 1200
3i9 1200
3/9 1200to
3ilt 1200
3i12 to 1200
3il4 1200
3i14 to 1200
3il6 1200
58
25
40
32
63
1: 23 87 :; 3i23 120051 44 7 t o
-gi &J 2 3i26 1200245 194 51 40
41 12 3/2650 13 to 1200
34 27 7 3/28 1200150 118 32 3 7
4 2 2 412 to 120017 12 5
4/4 120016
(CTUIR filename C:\KEITHWP\UPTAB4.UPPS)
52

when the video equipment and trap were operated simultaneously, atotal of total of 1,124 spring chinook salmon were counted on thevideo tapes and 926 were trapped (Figure B-10, Table B-5). Thevideo equipment counted 21% more fish than we trapped. If theperiod of extreme disparity between video counts and trap counts(May 18 through 21) is eliminated, the video counts total 959spring chinook salmon, and the trap counts were 926 fish. Thus,the video equipment counted 5% more fish than were trapped.
Comparisons of visual and video count data showed somedifferences. On May 3, the window watch resulted in 55 springchinook passing upstream and 47 passing downstream, versus 54 upand 49 down observed on the tape. Therefore, the net number offish recorded was eight during the window watch and five reviewingthe tape. On May 10 and both the window watch and the video tapereview ended up with seven spring chinook passing upstream andeight passing downstream for a net "~oss@~ of one fish.
Visual observations of fish abundances below Three Mile FallsDam were noted and were compared to the trap counts. Duringperiods of high fish numbers in the trap, relatively large numbersof fish were observed in the ladder and pools below the ladderentrance. During periods of low fish numbers in the trap, few fishwere observed in the ladder and lower pools (Appendix B-2).
DISCUSSION
As observed in 1987 and 1988, significant numbers of redds andspawning and dead fall chinook salmon and coho salmon were observedbelow the dam in 1989. These observations raise concerns aboutpossible passage impediments in the lower Umatilla River, but theseconcerns were not evaluated as part of this project. Prespawnmortality of these fish did not appear to be a serious problem(9%) l
It is unclear whether these fish experienced passageobstructions at Three Mile Falls Dam, in the passage channels belowthe dam, or were spawning in the lower river for other reasons(%I- I where they had been released). If any of these fish hadmigrated up through the east bank fish ladder at Three Mile FallsDam, and through the V-trap located at the last ladder baffle, thenit is unlikely that they would have fallen back through the dam'spassage facility. We recommend that a continued evaluation ofpassage through the river below the dam.be implemented in order todetermine if the notable numbers of salmon spawning below the damis a product of passage problems.
The video recording techniques used at Three Mile Falls Dam in1989 and 1990 recorded passage of adult salmon through the viewingarea of the dam, and elucidated some aspects of the passage ofthese fish that may lead to further improvement of the facility.The equipment recorded clear pictures of fish during the majorityof flows and turbidities. However, when turbidity became severe(secchi disk depths less than approximately 0.25 m), some fish that
53

VIDEO DATA (Total=1 124 [959]) - blank TRAP DATA (Total=926 [916]) - solld( [ ] volueo for folols mlnua 5/18-21)
, 1
-is?62ao-090
0
t-
6/12-14 5/14-15 5/l&17 5,'17-16 5/16-21 512-3 513-4 5/31-6/l 514-5 S/5-6 6/l-4
DATE - 1990
Figure B-10. Enumeration data of spring chinook salmon asmeasured with video tape recordings compared to trap counts,Three Mile Falls Dam, east bank, May through June 1990.

Table B-5. sunnary of spring chinook salmon video tape and trap data duringperiods of simultaneous operetions, Threemile Falls Dam, east bank, 1990.
VIDEO TAPES# UP
TRAP DATA
DATE
5/zs/3
513514
s/4s/5
s/55/6
S/l2s/13s/14
5/14s/15
s/155/16s/17
5075/18
S/18s/19S/205/21
5/316/l
6/l614
HWR12001200
12001200
12001200
12001200
1200
1200
12001200
1200
1200
12001200
1200
1200
12001200
12001000
# # MINUSup E!!!!! #DOWN p&g M#
965 816 149 5/3 1200 166
1051 895 1% 5/4 1200 106
1094 923 wl 5/s 1200 131
805 641 164 5/b 1200 157
223+z$
65
201154355
86
126463396985
5/12168 55 to 1200
m * s/14 1200291
46 19 505 1200
s/15179 22 to 1200
130309 * s/17 1200
78 8 S/18 1200
5/18 1200122348 11: to350 4 4 s/21 1200820 165
84
14
33
12
10
5/31531 474 ST 6/l to :::8 73
6/l to 1200689 540 149 6/4 1200 140
(CTUIR filename C:\KEITH\UP\UPTABS.UP5)
55

passed the viewing window towards the backlight chamber would notreceive any illumination from the fluorescent shop lamps and becamefaintly silhouetted blurs. Large gaps in the data are present(only 30% of the total fish passage period is on tape) because ofa TLVCR malfunction that required shipping and bench time of onemonth, and security breaches that resulted in a stolen system anddown time while improvements to door locks were performed. Severalsecurity improvements were implemented and others are planned forthe near future.
Reviewing the tapes proved much more time consuming thananticipated, primarily due to the amount of back and forth movementdisplayed by the fish. Of the tapes reviewed to date, 24,299observations of salmon movement through the viewing area have beenmade for a total of 1,795 fish past the window. Therefore, only 7%of the fish movement recorded actually resulted in fish passing theviewing area. This problem, and the additional amount of timerequired to review tapes, has prevented recording jack-to-adultratios, fin clip information, and sex ratios. We recorded fourdifferent variables for each species of salmon (upstream past thewindow, downstream past the window, up into the window then backdown, and down into the window then back up). In order toaccurately record the other biological information, from eight to20 permutations of the biological parameters could potentially berecorded for each salmon that completely passed the window (notincluding the fish that exit the viewing area from the samedirection they entered). For fall chinook salmon, there are 20possible permutations (ad-clip/no ad-clip, upstream/downstream,male/female, jack/adult/subjack - the jacks and subjacks would notbe sexed). For spring chinook salmon, there would probably only beeight permutations because sex ratios are extremely difficult tomeasure. Through the use of large multiple unit tally meters,combined with experienced gained through time, this information maybe achievable in the future.
We hypothesize that the back and forth activity occurs whenfish that have passed through the last baffle of the fish ladderand through the V-trap grate are prevented from passing into theforebay through the fishway exit and hold in the viewing area whiletrying to pass into the Denil steep pass. Velocities at the windowon April 6, 1990 were one f/s on the bottom, 3.25 f/s on thesurface, and from 1.5 to 2.5 f/s throughout the rest of theprofile. At the mouth of the steep pass, there is an eddy at thebottom of the channel, flows are consistently about 0.5 to 0.75 f/sthroughout the rest of the profile, and at the surface are 1.5 f/s.Therefore, only the surface flows at the entrance to the steep passare comparable to those flows at the viewing window. The flows atthe bottdm of the channel, where the majority of salmon whereobserved with the video tapes, are backwards at the mouth of thesteep pass. Questions arise as to the effectiveness of the fishpassage facility with respect to adult salmon passing from theladder into the steep pass. The salmon at this point have passedthe facility though, and we hypothesize that the amount of back andforth movement would be greatly decreased if the fish were allowed
56

to freely swim onward out the fishway exit. We have proposed totest this hypothesis next year.
The east bank trap data does not reflect daily arrivals intothe trap (except when the trap was emptied daily). Therefore, thetrap data may slightly lag behind when the fish actually passed thedam because the fish may have been in the trap for' several daysbefore the trap was emptied.
During the periods when the video recording equipment and theholding trap were operated simultaneously, the video counts werewithin plus or minus 5% of the trap counts. This comparison issomewhat subjective. Individual periods when the trap was emptiedwere compared to enumerations based on the video recordings. Ifthe trap was cleared on day one at 1200 hours, then cleared againon day three at 1200 hours, then the video enumerations from 1200hours on day one through 0900 hours on day three were used in thecomparison. The "cutoff time" of the video enumerations wasselected to be slightly earlier than when the trap was checkedbecause of the back and forth movement displayed by the fish. Overseveral consecutive days of these tallies, most of the errorassociated with the start and end times of tape enumerations isprobably canceled. The considerable deviation between the trap andvideo counts observed with spring chinook salmon on May 18-21 isperplexing (165 video, 10 trapped). Subsequent reviews of threedifferent one-hour periods (May 20, 0200 to 0300 and 1200 to 1300hours; and May 21, 100 to 1100 hours) resulted in similar counts(11 versus 12 fish). The tapes display moderate video quality(clear water and good lighting). On these dates the fish weretrapped in the ladder between the V-trap grate and the fishway leadgate by dropping the ladder water to approximately 1.5 feet andhand netting the fish. Perhaps some fish escaped through the V-trap grate as the water was lowered, but it is very difficult tocomprehend 155 fish doing so. Several individual videoobservations of the spring chinook salmon displayed only one fieldof a fish (versus the typical three to five fields). Perhaps manyfish were not recorded passing down past the window because thefish passed during the 0.6 second that the tape was not recording.We propose to compare taping at 24 and 72-hour modes simultaneouslyin 1990-91 to determine if the 72-hour mode that was used for thisreport is adequate for all species.
Several one hour segments of recorded tape were reviewed threetimes by the same reader, and the error rate within those readingsoccasionally reached 5%. We propose to further test tape readingprecision in future years. After several seasons of verifying theaccuracy of the tape information as compared to the trap data, andquantifying the variability of tape counts between and withinreviewers, a coefficient may be developed to adjust differencesbetween the counts.
The number of salmon counted during an hour of sitting in theviewing room versus the video recording was identical when few fishwere present (May 10 - a net Ufilossll of one fish). However during
57

a period of peak migration Way 3L eight fish were recordedpassing the window from the viewing room versus five in the videotape (55 18window-watchV8 and 54 "video* passing upstream, and 47@lwindow-watchV* and 49 q%ideoB' passing downstream). The window-watch process was awkward due to tallying multiple fish with pencilon paper and could have resulted in missing some fish. We did nothave the multiple unit tally meters during these periods, and usingthe meters will greatly enhance the window-watch process in thefuture.
We plan to continue the passage evaluation of adult salmon atThree Mile Falls Dam during the 1990-91 migration. The evaluationwill continue to use the methods developed this year, and will alsofurther investigate the quantity of back-and-forth movement, andattempt to determine if the back-and-forth movement results indelays or injuries that may be improved.
58

Appendix B-l. Threemile Falls Dam Trap Data - Right Bank, 1989-1990.
DATE
DAILYFLOW(cfs1
DAILYTEMPERATURE(Deqrees Cl
40ct89 49 14.090ct89 195 15.0
llOct89 181 14.8130ct89 208 13.9160ct89 222 11.7180ct89 218 11.1200ct89 245 12.5230ct89 258 12.9250ct89 248 11.8270ct89 170 11.4300ct89 166 9.23Nov89 157 8.76Nov89 153 10.19Nov89 157 10.8
13Nov89 184 11.217Nov89 197 8.522Nov89 118 9.8lDec89 100 6.98Dec89 114 9.0
15Dec89 98 4.929Dec89 95 6.25Jan90 92 7.3lOJan 622 8.112Jan90 662 5.816Jan90 451 6.517Jan90 400 6.224Jan90 134 5.431Jan90 107 6.25Feb90 93 6.3
13Feb90 991 3.220Feb90 311 2.323Feb90 460 7.826Feb90 1090 6.728Feb90 860 5.75Mar90 616 8.17Mar90 686 8.09Mar90 852 8.7
12Mar90 1310 7.714Mar90 894 7.516Mar90 636 8.819Mar90 742 12.421Mar90 1430 10.223Mar90 1230 8.626Mar90 696 8.428Mar90 434 10.330Mar90 269 11.5
MEANM MEANSECCHIDISK0
1.21.01.21.11.21.51.21.31.21.11.11.11.11.61.81.71.50.40.51.00.90.91.21.20.41.00.80.50.50.90.70.70.30.50.50.70.50.50.90.80.8
59
COH@'FALti' SUMMER SPRING'
CHINOOK STEELHEAD CHINOOK
9 1 0 0163 52 21 052 28 4 0
178 36 5 062 25 7 08 3 1 0
24 6 6 047 78 8 0
198 16 4 01046 100 40 0147 51 22 030 14 4 0
196 39 8 0481 36 9 0
1357 101 19 0211 5 9 0121 9 11 065 0 5 0
130 0 4 035 1 0 06 0 2 02 0 0 0
53 1 62 00 0 70 01 0 131 01 0 181 00 0 27 00 0 13 00 0 7 00 0 29 00 0 25 00 0 79 00 0 52 00 0 29 00 0 62 00 0 58 00 0 25 00 0 40 00 0 32 00 0 63 00 0 53 00 0 40 00 0 54 00 0 40 00 0 37 00 0 39 0
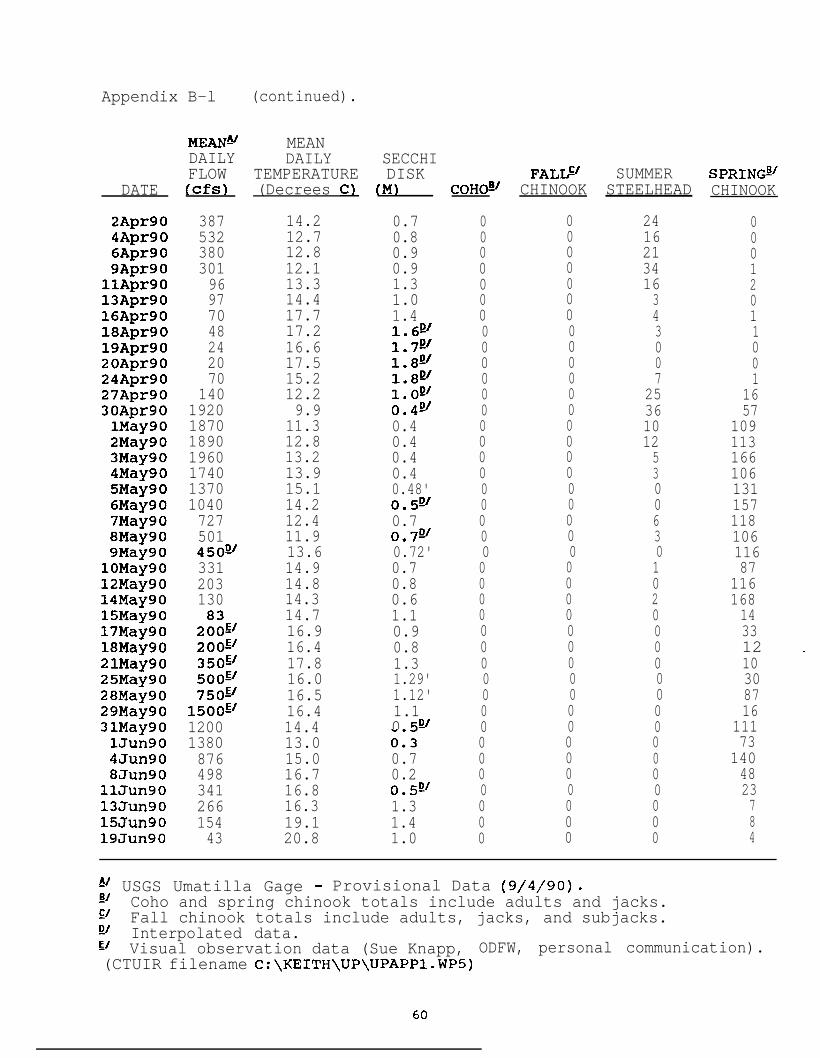
Appendix B-l (continued).
DATE
2Apr904Apr906Apr909Apr90llApr9013Apr9016Apr9018Apr9019Apr9020Apr9024Apr9027Apr9030Apr90lMay902May903May904May905May906May907May908May909May90lOMay12May9014May9015May9017May9018May9021May9025May9028May9029May9031May90lJun904Jun908Jun90
llJun9013Jun9015Jun9019Jun90
MEAN% MEANDAILY DAILY SECCHIFLOW TEMPERATURE DISK(cfs) (Decrees Cl (M)
38753238030196977048242070
140192018701890196017401370104072750145ov331203130
23
g",;5ooQ75ou
1500E'1200138087649834126615443
14.212.712.812.113.314.417.717.216.617.515.212.29.9
11.312.813.213.915.114.212.411.913.614.914.814.314.716.916.417.816.016.516.414.413.015.016.716.816.319.120.8
0.70.80.90.91.31.01.41.6w1.7w
i*%1:02/0.4v0.40.40.40.40.48'0.5q0.70.7v0.72'0.70.80.61.10.90.81.31.29'1.12'1.10 50'0:30.70.20.52'1.31.41.0
COH@FALti' SUMMER SPRING'
CHINOOK STEELHEAD CHINOOK
0 0 24 00 0 16 00 0 21 00 0 34 10 0 16 20 0 3 00 0 4 10 0 3 10 0 0 00 0 0 00 0 7 10 0 25 160 0 36 570 0 10 1090 0 12 1130 0 5 1660 0 3 1060 0 0 1310 0 0 1570 0 6 1180 0 3 1060 0 0 1160 0 1 870 0 0 1160 0 2 1680 0 0 140 0 0 330 0 0 12 I0 0 0 100 0 0 300 0 0 870 0 0 160 0 0 1110 0 0 730 0 0 1400 0 0 480 0 0 230 0 0 70 0 0 80 0 0 4
E USGS Umatilla Gage - Provisional Data (g/4/90).
E'Coho and spring chinook totals include adults and jacks.Fall chinook totals include adults, jacks, and subjacks.
wE'
Interpolated data.Visual observation data (Sue Knapp, ODFW, personal communication).
(CTUIR filename C:\KEITH\UP\UPAPPl.WP5)
60

Appendix B-2. Visual observation notes for Three Mile Falls DamAdult Passage Evaluation - October through December 15, 1989.
October 19 - Snorkeled and walked the pools directly below thedam and saw no fish. From October 18 to 20, atotal of 50 salmon were captured in the east banktrap.
October 23 -
October 24 -
November 6 -
No fish seen in the pool below the east bankladder, yet approximately 300 salmon were capturedin the trap.
Saw six salmon jump into the pool directly belowthe east bank ladder in five minutes, and saw eightpass the viewing window in five minutes. OnOctober 25, approximately 600 salmon were capturedin the trap.
Saw six salmon in the pool directly below the westbank ladder, and another below the east bankladder. From November 3 to November 11, fourangler surveys were conducted below Three MileFalls Dam (funded by the general fisheriesmanagement program). Live salmon were reportedseen by anglers and were also observed by thesurveyors during this time period. For example, onNovember 10, an angler reported seeing 50 to 100salmon move through the head of the dynamitedchannel 900 feet below the dam in five hours. Thesurveyor saw eight salmon move through the samearea in 15 minutes. These observations preceededthe most active trapping period from November 9through 13, when approximately 2,000 salmon werecaptured in the east bank trap.
(CTUIR filename C:\KEITH\UP\UPAPP2.WP5)
61