Embed Size (px)
Citation preview

AER 2018 Directive 54 Annual Presentation
BOLD IDEAS
FOR ENERGY
Panny LEAD PilotExperimental Scheme Approval No. 12283C
Dec 10, 2018 CONFIDENTIAL

Agenda
2
Subsurface
1. Background
2. Geoscience
3. Drilling & Completions
4. Artificial Lift
5. Instrumentation
6. 4-D Seismic
7. Scheme Performance
8. Future Plans
Surface
1. Facilities
2. Measurement & Reporting
3. Water
4. Environmental
5. Compliance
6. Future Plans

3
Subsurface

4
Background

Background
5
The Panny LEAD (Low-Pressure Electro-Thermally Assisted Drive) Pilot project was
conducted in the W½-34-094-07W5 Panny area within the Peace River Oil Sands Area. The
pilot surface location was at 13-34-94-7W5. This pilot project evaluated the potential of a
low-pressure process that utilizes downhole electric heaters combined with water and/or
solvent injection to recover bitumen from the Bluesky formation. This Bluesky formation has
an overlying gas cap that had been produced, and so exhibits depleted pressure. This
technology has the potential to be commercialized in both the Panny area as well as many
other bitumen/heavy oil reservoirs in Alberta.

Location
6
• Panny CHS Test project site is 77 km north of Red Earth Creek, AB
• Off of Highway 88 (fully paved), 7 km of high grade gravel road to site
• In the Peace River Oil Sands Area
Panny LEAD Pilot
Fort McMurray
Slave Lake
Red Earth Creek
Red Earth Creek
High Prairie

Panny Map
7

Panny Map
8

LEAD Pilot Stage 1 CHS – Objectives / Scope
9
– Primary Objective:
• Collect significant pressure, temperature, and oil production data in response to
conductive heating to tune simulator assumptions and geological understanding
– Secondary Objective:
• Obtain experience operating electrical resistance heaters
– Scope:
• Install heater in existing 4-34 Hz well
• Drill 2 observation wells and install pressure & temperature instrumentations
• Install onsite electrical generator
• Use all existing production equipment currently on-site
• Conduct minimum 3 heating & production cycles as required to obtain necessary
data
• Reduce bitumen viscosity using electric cables and possibly injection of water/solvent
• Have concurrent production of bitumen and associated gas cap
• Understand lateral and vertical heat conduction and convection
• Demonstrate commercial production and ultimate recovery factor
• Gather data for accurate numerical simulation to optimize commercial process

Regulatory Work
10
• Experimental Recovery Scheme Approval
– July 24, 2014: Obtained Experimental Scheme Approval No. 12283• Full LEAD Pilot design
– November 13, 2014: Experimental Scheme Amendment Submitted for LEAD Pilot Stage 1• Updated to included Stage 1 and Stage 2 LEAD Pilot designs
– September 28, 2016: Experimental Scheme Approval 12283B• Approval to inject C5+ solvent
– May 26, 20117: Experimental Scheme Approval 12283C• Extended confidentiality and validity to July 24, 2019
• EPEA
– June 2, 2014: Obtained AER EPEA Approval No. 299681-00-00
– September 29, 2014: Received a ‘No Objection Letter’ from the AER for LEAD Pilot Stage 1 design
– February 2, 2015: Groundwater Monitoring Program Proposal approved by AER
• Facility Licence
– Facility considered a Single Well Bitumen Battery, and therefore required no facility licence
• Injection Well Approval
– August 5, 2015: Obtained D51 Class IV Injection Well Approval for 100/04-34-094-07W5 horizontal well (a condition of the Experimental Scheme Approval for heater operation) Approval No. 12283
– September 21, 2016: Obtained D51 Class III & IV Injection Well Approval for 100/04-34-094-07W5 horizontal well (a condition of the Experimental Scheme Approval for heater operation) Approval No. 12283B (as amended)

11
Geoscience

Panny Resource
12
8m Bitumen
10m Bitumen
12m Bitumen
14m Bitumen
16m Bitumen
Category /
Level of Certainty
Discovered Bitumen
Initially In- Place
(MMbbl)
Assigned
Recovery
Factor
Contingent
Resource
(MMbbl)
Low Estimate 509.2 10.0% 50.9
Best Estimate 755.0 17.5% 132.1
High Estimate 983.0 25.0% 245.8
⚫ McDaniel & Associates conducted an independent
resource assessment as of December 31, 2011
⚫ Resources assigned based on CSS recovery process
RoadsNatural Gas Pipeline Oil Well Effluent PipelinePerpetual Gas PlantPerpetual Oil Sands RightsOther Perpetual Lands

Net Bitumen Pay Map
13

Bitumen Structure Map
14

Base Bitumen Structure Map
15
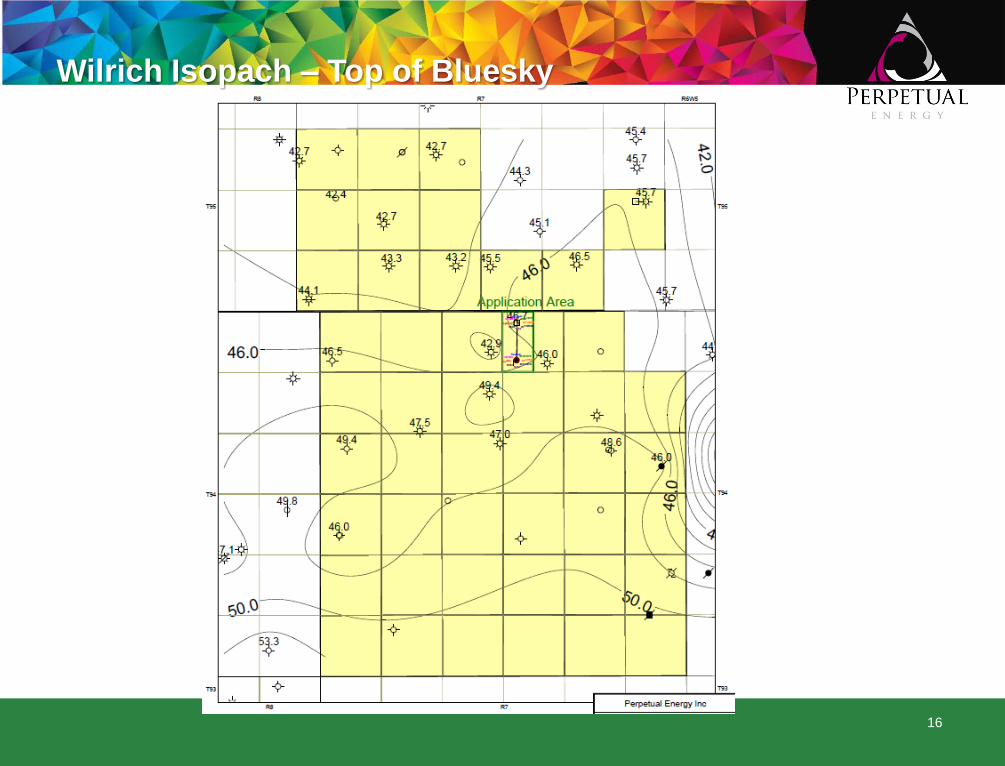
Wilrich Isopach – Top of Bluesky
16

Gas Cap
Bitumen Leg
Top Bluesky
Base Bluesky
Gething
Paleozoic
100/13-34-094-07W5/00 - Type Well
17

100/13-34-094-07W5/00 - Type Well/Core
18
309.38 – 313.82 m
Overall rare to moderate low angle, planar to wavy mud laminations.

Panny Bluesky Reservoir Overview
19
Depth = 315 mTVD
Porosity = 27%
Oil saturation = 67%
Temperature = 11°C
Density = 11° API
Viscosity = 50,000 cP at 11°C average
Horizontal permeability = 1,400 mD
Vertical permeability = 900 mD
Gas cap = Avg 3m, up to 6m
Bitumen pay = Avg 12m, up to 16m
Gas cap pressure = 500 kPaa
Bitumen pressure = ~1,200 kPaa (gradient exists)
Observation Well
6-34-94-7W5

Observation Wells
20Bitumen leg divided into 2 gross reservoir quality facies: F1 and F3 (F3U and F3L).

Core Analysis Summary – Reservoir Facies
21
• Bluesky oil F-3 facies (primary bitumen target) Averages:
– Porosity = 27%
– Horizontal permeability = 1,400 mD
– Vertical permeability = 900 mD
– Oil saturation = 67%
⚫ Bluesky facies based on petrographic and core data
⚫ Chert Arenite Lithology – excellent reservoir rock. Minor, localized, non
extensive shale partings and laminae seen near base of Bluesky sand.
Localized minor shale clast blebs.
⚫ Slight coarsening upward sequence observed. Grain size range:
V Fine - Fine at base ( facies F1 )
Fine- Lower Medium ( facies F3, targeted bitumen leg )
⚫ Best reservoir permeability / porosity relationship in facies F3.

Core Analysis Summary – Porosity vs Permeability
22

23
Rock Classification

24
Porosity Relationships

Mineralogy
25

26
Reservoir Sensitivity
▪High sensitivity and incompatibility with HCL, HF acid systems.
▪ Slight to moderate sensitivity to water based fluids – clay sloughing and fines migration.
▪ Slight to moderate potential for permeability reduction related to fines migration.
▪Moderate potential for scale formation with water production.
▪Moderate potential for clay expansion.
▪ Potential for sand migration and production.
Reservoir Sensitivity

Viscosity
27Viscosity gradation observed.

28
Drilling and Completions

Stage 1 CHS Test Layout
29
13-34-94-7W5 CHS Test Facility(surface lease)
Obs#1: 12-34
Obs#2: 6-34
Hz Well100/04-34-094-07W5/00Gas Pipeline
8-33 to 13-34
⚫ CHS Test:
◼ Used existing Hz 4-34
◼ Drilled 2 Obs wells
– Drilled, cored, logged,
cased with
instrumentation
~7 pressure sensors
~19 temp sensors
Top Gas
Oil
4-34 Hz
Pressure SensorsTemp Sensors every ~2m
OBS1 /
OBS2
3-4m

Horizontal Well Completion
30
Heater 729m
Electrical Heaters
◼ 2 x MI (Mineral Insulated) Electric
Downhole Heater Systems
◼ A/C 3 phase (3 cables each), wye-
spliced at ends
◼ ~600 W/m total nominal output (~300
W/m each x 2)
◼ Configuration:
– ESP cables, spliced to
– Cold Lead MI cables, spliced to
– Hot Lead MI cables
– Splices offset from each other
◼ Control: Temperature or kW set points

Observation Well Drilling – 12-34-94-7W5
31
PEOC Panny 12-34-94-7W5
– Spudded Feb 18, 2015; Rig released Feb 24, 2015.
– Drilled surface, ran 219.1mm (9 5/8”) J-55 ST&C surface
casing set at 118m.
– Drilled out with directional tools, KOP at 213m, build hole
angle to 7° to core point at 301.4m
– Cored from 301.4m to 342m and had 99.6% core
recovery :• Cut core #1 and then RIH with survey tools to take ranging shot
• Cut core #2 and then RIH with survey tools to take ranging shot
• Cut cores #3-6, RIH with directional drilling BHA and Range to 4-34
– Drilled to 348.5m (0.5m from TD) when well lost mud
circulation, cured losses:
• Bit was 8.5m into the Paleozoic, 0.5m away from planned TD
– Open hole logged.
– Ran 114.3mm (4.5”) L-80 SLHT casing with sensors,
cemented with Thermal-40 cement with 4.0 m3 returns.
– Final ranging shows 3.58m separation.4-34 Hz Well Ranged at 3.58m separation
Cored Section

Observation Well Drilling – 6-34-94-7W5
32
PEOC Panny 6-34-94-7W5
– Originally licenced as 5-34-94-7W5.
– Spudded Feb 25, 2015; rig released Mar 3, 2015.
– Drilled surface hole and kicked-off directional at
100mMD; landed surface casing at 165mMD.
– Drilled out with directional tools and build hole angle to
9° by core point at 299.7m
– Cored from 299.7m to 341.2m and had 99.4% core
recovery:• Cut core #1 and then RIH with survey tools to take ranging shot
• Cut core #2 and then RIH with survey tools to take ranging shot
• Cut cores #3-6, RIH with directional drilling BHA and Range to 4-34
– Lost mud circulation in Paleozoic, cured losses.
– Open hole logged.
– Ran 114.3mm (4.5”) L-80 SLHT casing with sensors,
cemented with Thermal-40 cement.
– Cement briefly lost circulation, top filled cement ~50m
– Ran cement bond long – good cement.
– TD crossed into LSD 6-34; well license amended.
– Final ranging shows 3.01m separation.
4-34 Hz Well Ranged at 3.01m separation
Cored Section

33
Artificial Lift

Horizontal Well Completion
34
Artificial Lift
◼ Pump Seating Nipple for
Insert Rod Pump
– 30-250-RWAFR-20-3
– Sucker rods w/ sinker bars
– Landed at 60° inclination in
intermediate casing tangent
section
– Wellhead mounted
hydraulic stroking unit
Heater 729m

Artificial Lift
35
Reciprocating pump utilized.
No issues experienced with artificial lift system.
38 m3/d peak rates @ 350 kPaa sandface pressure.

36
Instrumentation
Horizontal Well Completion
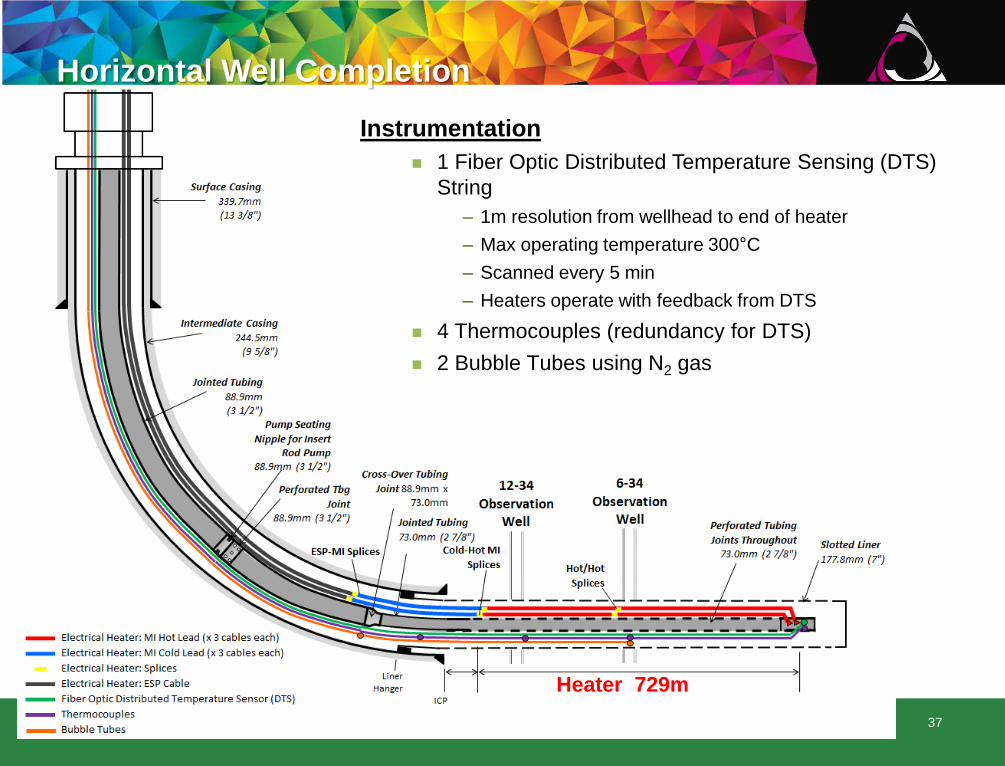
37
Instrumentation
◼ 1 Fiber Optic Distributed Temperature Sensing (DTS)
String
– 1m resolution from wellhead to end of heater
– Max operating temperature 300°C
– Scanned every 5 min
– Heaters operate with feedback from DTS
◼ 4 Thermocouples (redundancy for DTS)
◼ 2 Bubble Tubes using N2 gas
Heater 729m

Observation Wells
38
• 9 5/8” surface, 4 1/2” production casing
• Ranged wells to land close to horizontal well
– Obs 6-34: 3.01m separation
– Obs 12-34: 3.58m separation
• Cored entire Bluesky/Gething formation
– Avg 100 core sample points per well
– Petrology lab work
• Log with typical log suite plus CMI log on one
well
• All instrumentation clamped to outside of
production casing and cemented-in-place
• 7 pressure and 19 temperature points per
well
• Solar powered RTU for data recording,
download with USB stick weekly

39
4-D Seismic

No 4-D Seismic
40
No seismic / microseismic utilized directly for this project.

41
Scheme Performance

CHS Pilot Summary
42
• LEAD Pilot Stage 1: Cyclic Heating Stimulation (CHS) Test -
– First heat on Oct 14, 2015
– First production on Mar 1, 2016
– Cycle 1 - Produced for 6 weeks , followed by 2 week temperature falloff
– Cycle 2 - Heated for 6 weeks, then produced
– Cycle 2 - Produced while heating.
– Cycle 3 - Solvent injection; aborted due to asphaltene deposition.
– Toluene soak and clean out
– Cycle 4- Produced while heating
– Heater off May 06, 2017
– Excellent data collected during heating phase, production phase and shut-in
– Positive production results
– Incorporate data into refined reservoir model to evaluate additional pilot work and
commercial designs

Operations Overview – Observation Wells
43
• Observation wells
– Drilled March 2015
– 100% of sensors are working (52 total)
– Measurements recorded hourly
– Thermocouples have allowed accurate reservoir thermal conductivity tuning in the
model
– Reservoir thermal conductivity higher than previously assumed
– Pressure gauges have provided important insight into vertical and horizontal
permeabilities
– Reservoir pressures took ~3 months post-drilling to equalize

Lessons Learned
44
⚫ Reservoir
◼ Seven pressure sensors per observation well have provided necessary insight into the non-
linear bitumen pressure gradient
◼ Pressure response during heating has been less than expected, and pressure depletion
during production has also been less than expected
– significant upside which has contributed to production outperforming expectations
◼ Observation well thermocouples have allowed improved thermal conductivity estimates
◼ Heater operation during production (“flow assurance”) appears to increase production rates
significantly, and enables continued heating of the reservoir during production cycle
– shortens heating cycle since continue to heat the reservoir during production

Future Plans
45
Pilot was terminated May 06, 2017 after failure of the second heater. Perpetual continuing to
gather pressure and temperature data at the observation wells. No further production is
anticipated.
This is the final presentation for this pilot.

46
Surface

47
Facility13-34-094-07W5

Facility Process Flow Diagram
48⚫ Emulsion goes directly to 750 bbl production and sales tanks
⚫ Treating of oil to pipeline spec (<0.5% BS&W) is achieved through demulsifier injection near the wellhead and tank heating to
temperatures of 60-80°C

Facility Site Plan
49
5

Facility Photos
50
Communications Tower
with Cell Booster Antenna
MCC with 2 x Heater
Transformers &
Controllers, and Data
Capture Computers
4-34-94-7W5 Horizontal
Wellhead
1 MW Generator Package
(5 x 200kW Turbines)
Piping Utilidor
95 HP Booster
Compressor
Hydraulic
Pumping Skid
Tank Farm including
Production and Sales
Tanks
13-34-94-7W5 Vertical
Wellhead
Nitrogen Packs for
Bubble Tubes
65kW Backup
Generator

Facility – MCC Building
51
Thyristor #1
Thyristor #2
Thyristor PLC and HMI (Control Panel)
Thyristor HMI Screens
Perpetual PLC Cabinet
Computer ServerCabinet
UPS

52
Measurement and Reporting

Measurements
53
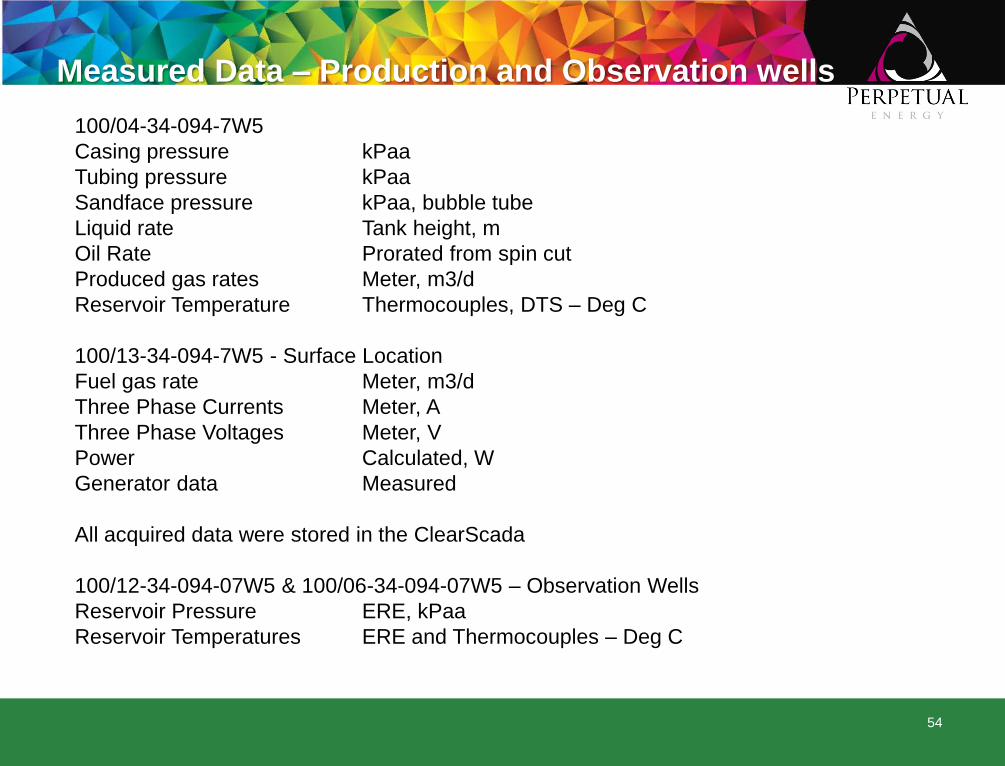
Measured Data – Production and Observation wells
54
100/04-34-094-7W5
Casing pressure kPaa
Tubing pressure kPaa
Sandface pressure kPaa, bubble tube
Liquid rate Tank height, m
Oil Rate Prorated from spin cut
Produced gas rates Meter, m3/d
Reservoir Temperature Thermocouples, DTS – Deg C
100/13-34-094-7W5 - Surface Location
Fuel gas rate Meter, m3/d
Three Phase Currents Meter, A
Three Phase Voltages Meter, V
Power Calculated, W
Generator data Measured
All acquired data were stored in the ClearScada
100/12-34-094-07W5 & 100/06-34-094-07W5 – Observation Wells
Reservoir Pressure ERE, kPaa
Reservoir Temperatures ERE and Thermocouples – Deg C

4-34 Hz Response – Heater Section Temperatures
55
• The primary operating constraint was the fiber optic DTS temperature limitation – 300°C maximum
• Secondary operating constraint was intermediate casing temperature - 140°C maximum during production
• Even with active hot spots, average temperatures increased slowly over time
• The DTS measured heater temperature with heaters on, and sandface temperature with heaters off. Simulation assumes sandface
temp; difference between the two is primarily the fluid in the wellbore acting as an insulator
First ProductionMar 1
First HeatOct 14

Production Summary
56
• Water cuts obtained from spin cut averaged ~5% BS&W with only trace sand
• Running the heaters at maximum power within constraints during production contributed to increased performance
• The majority of the trucked-out oil met pipeline specifications without the need for diluent

Obs Well Pressure Response – Since First Heat
57
⚫ P4 sensors horizontally across from the 4-34 Hz well showed good response to heating and production but higher than modelled pressures after the first cycle of heating.
⚫ Sensors above and below showed pressure responses that suggest baffling or compartmentalization⚫ Slow pressure decline deemed related to stronger production performance than originally expected

58
Bitumen Treatment
Successfully produced sales spec oil with existing facility process
Water Treatment
No water injection or water treatment required for CHS test Phase 1
Gas Conservation
Power generation utilized natural gas from the Panny gas field

Measurement and Reporting
59
Production Volume:Fluid rate measured daily based on tank levels.
Oil and Water prorated from spin cut of well sample.
Injected volume:Volume of injected fluid measured using supply tank meter.

60
Environmental

Proximity to Peace River
61Obtained and complied with EPEA approvals.

62
Compliance

Regulatory Update
63
• Experimental Recovery Scheme Approval
– July 24, 2014: Obtained Experimental Scheme Approval No. 12283• Full LEAD Pilot design
– November 13, 2014: Experimental Scheme Amendment Submitted for LEAD Pilot Stage 1• Updated to included Stage 1 and Stage 2 LEAD Pilot designs
– September 28, 2016: Experimental Scheme Approval 12283B• Approval to inject C5+ solvent
– May 26, 20117: Experimental Scheme Approval 12283C• Extended confidentiality and validity to July 24, 2019
• EPEA
– June 2, 2014: Obtained AER EPEA Approval No. 299681-00-00
– September 29, 2014: Received a ‘No Objection Letter’ from the AER for LEAD Pilot Stage 1 design
– February 2, 2015: Groundwater Monitoring Program Proposal approved by AER
• Facility Licence
– Facility considered a Single Well Bitumen Battery, and therefore required no facility licence
• Injection Well Approval
– August 5, 2015: Obtained D51 Class IV Injection Well Approval for 100/04-34-094-07W5 horizontal well (a condition of the Experimental Scheme Approval for heater operation) Approval No. 12283
– September 21, 2016: Obtained D51 Class III & IV Injection Well Approval for 100/04-34-094-07W5 horizontal well (a condition of the Experimental Scheme Approval for heater operation) Approval No. 12283B (as amended)

Compliance
64
• The Panny CHS Pilot Project was conducted in compliance with all conditions of
approvals and associated regulatory requirements.

65
Future Plans

Future Plans
66
Pilot was terminated May 06, 2017 after failure of the second heater. Perpetual continuing to
gather pressure and temperature data at the observation wells. No further production is
anticipated.
This is the final presentation for this pilot.