Embed Size (px)
Citation preview


iii
PREFACE
The Delta State University Factbook is an annual publication that provides a ready
source of information to answer questions frequently asked about the University. This
edition contains a statistical overview of operations for the 2003-04 academic year. Included
is information, both past and present, concerning enrollment, student characteristics, faculty
characteristics, revenue, and expenditures. Its primary purpose is to promote understanding
for those seeking information about Delta State University.
Most of the information in this edition was obtained from statistical reports published
by the Board of Trustees of State Institutions of Higher Learning, State of Mississippi. The
data submitted to the Board of Trustees for this report represents not only the work of the
Office of Institutional Research & Planning but also of various administrative offices such
as Registrar, Admissions, Human Resources, Academic Affairs, Financial Assistance,
Student Affairs, Information and Technology Services, Athletics, University Relations,
Alumni Affairs, and the Library. Without their continued assistance and cooperation, this
publication would not be possible. We extend to them our sincere appreciation.
The Office of Institutional Research and Planning, in its on-going effort to provide
timely management information, encourages your comments and suggestions for
improvement. We hope you find this edition of the Factbook both informative and useful.
Office of Institutional Research and PlanningKent Wyatt Hall 247 Mary HankinsDelta State University Factbook EditorCleveland, MS 38733

iv
TABLE OF CONTENTS
Preface . . . . . . . . . . . . . . . . . . . . . . . . . . . . . . . . . . . . . . . . . . . . . . . . . . . . . . . . . . . . . . . iii
I. GENERAL INFORMATION
Administrative Cabinet & Board of Trustees . . . . . . . . . . . . . . . . . . . . . . . . . . . . . . . 2Organizational Chart . . . . . . . . . . . . . . . . . . . . . . . . . . . . . . . . . . . . . . . . . . . . . . . . . 3University History . . . . . . . . . . . . . . . . . . . . . . . . . . . . . . . . . . . . . . . . . . . . . . . . . . . 4Institutional Mission . . . . . . . . . . . . . . . . . . . . . . . . . . . . . . . . . . . . . . . . . . . . . . . . . . 5University Goals . . . . . . . . . . . . . . . . . . . . . . . . . . . . . . . . . . . . . . . . . . . . . . . . . . . . . 6University Characteristics . . . . . . . . . . . . . . . . . . . . . . . . . . . . . . . . . . . . . . . . . . . . . 8
II. STUDENTS
New Students
Applications, Admissions, and Enrollments: Fall 2003 . . . . . . . . . . . . . . . . . . . . . . 2ACT Data for Entering Freshmen: 2003-04 . . . . . . . . . . . . . . . . . . . . . . . . . . . . . . . 3ACT Scores of First-Time Entering Freshmen: Fall 2003 . . . . . . . . . . . . . . . . . . . 4Major Feeder High Schools For ACT Tested Freshmen: 2003-04 . . . . . . . . . . . . . 5
Enrollment
Enrollment Summary by Semester: 2003-04 . . . . . . . . . . . . . . . . . . . . . . . . . . . . . . . 2Enrollment Summary by Race . . . . . . . . . . . . . . . . . . . . . . . . . . . . . . . . . . . . . . . . . 3Age Distribution of Students . . . . . . . . . . . . . . . . . . . . . . . . . . . . . . . . . . . . . . . . . . 4Enrollment of MS Institutions by Level . . . . . . . . . . . . . . . . . . . . . . . . . . . . . . . . . . 5Enrollment of MS Institutions by Headcount and FTE . . . . . . . . . . . . . . . . . . . . . . . 6Enrollment Overview: 2-Year Comparison . . . . . . . . . . . . . . . . . . . . . . . . . . . . . . . . 7College of Arts and Sciences: 3-Year Profile . . . . . . . . . . . . . . . . . . . . . . . . . . . . . . 8College of Business: 3-Year Profile . . . . . . . . . . . . . . . . . . . . . . . . . . . . . . . . . . . . 9College of Education: 3-Year Profile . . . . . . . . . . . . . . . . . . . . . . . . . . . . . . . . . . . 10School of Nursing: 3-Year Profile . . . . . . . . . . . . . . . . . . . . . . . . . . . . . . . . . . . . . . 11Unclassified Major: 3-Year Profile . . . . . . . . . . . . . . . . . . . . . . . . . . . . . . . . . . . . . 12Enrollment Profile: 5-Year Trend . . . . . . . . . . . . . . . . . . . . . . . . . . . . . . . . . . . . . . 13Enrollment by Headcount: 10-Year Trend (Graph) . . . . . . . . . . . . . . . . . . . . . . . . . 14Enrollment by Class . . . . . . . . . . . . . . . . . . . . . . . . . . . . . . . . . . . . . . . . . . . . . . . . . 15Enrollment by Gender . . . . . . . . . . . . . . . . . . . . . . . . . . . . . . . . . . . . . . . . . . . . . . . 16Enrollment by Race . . . . . . . . . . . . . . . . . . . . . . . . . . . . . . . . . . . . . . . . . . . . . . . . . 17Enrollment by Residency . . . . . . . . . . . . . . . . . . . . . . . . . . . . . . . . . . . . . . . . . . . . . 18Enrollment by Status . . . . . . . . . . . . . . . . . . . . . . . . . . . . . . . . . . . . . . . . . . . . . . . . 19Enrollment by Level . . . . . . . . . . . . . . . . . . . . . . . . . . . . . . . . . . . . . . . . . . . . . . . . . 20Enrollment by School . . . . . . . . . . . . . . . . . . . . . . . . . . . . . . . . . . . . . . . . . . . . . . . . 21Enrollment: Actual and Projected . . . . . . . . . . . . . . . . . . . . . . . . . . . . . . . . . . . . . . 22

v
Housing & Residency
Comparative Room Report: 5-Year Trend . . . . . . . . . . . . . . . . . . . . . . . . . . . . . . . . 2Enrollment of Students by Counties: 5-Year Trend . . . . . . . . . . . . . . . . . . . . . . . . . 3Enrollment of Students by Counties: Fall 2003 (Map) . . . . . . . . . . . . . . . . . . . . . . . 6Enrollment of Students by States and Countries: 5-Year Trend . . . . . . . . . . . . . . . . 7Enrollment of Students by States: Fall 2003 (Map) . . . . . . . . . . . . . . . . . . . . . . . . . 9
Majors
Undergraduate Majors by Gender and Minority Status . . . . . . . . . . . . . . . . . . . . . . . 2Graduate Majors by Gender and Minority Status . . . . . . . . . . . . . . . . . . . . . . . . . . . . 4
Retention
Retention of First-Time Entering Freshmen: by ACT Score Category . . . . . . . . . . . 2Retention of First-Time Entering Freshmen: All Students . . . . . . . . . . . . . . . . . . . . 3Retention of First-Time Entering Freshmen: White Students . . . . . . . . . . . . . . . . . . 4Retention of First-Time Entering Freshmen: Black Students . . . . . . . . . . . . . . . . . . 5
Credit Hours
On & Off-Campus Student Credit Hours Summary by Semester: 2003-04 . . . . . . . 2On-Campus Student Credit Hours Summary by Semester: 2003-04 . . . . . . . . . . . . 3Off-Campus Student Credit Hours Summary by Semester: 2003-04 . . . . . . . . . . . . 4On-Campus Student Credit Hours Summary by Level:Fall 2003 . . . . . . . . . . . . . . . 5On-Campus Student Credit Hours Summary by Discipline & Level: Fall 2003 . . . . 6On-Campus Student Credit Hours Summary by Level: 2-Year Comparison . . . . . . . 8On-Campus Student Credit Hours Summary by College/School
And Department: 5-Year Trend . . . . . . . . . . . . . . . . . . . . . . . . . . . . . . . . . . . . . . 9Grades
Average of Grades Awarded by Discipline . . . . . . . . . . . . . . . . . . . . . . . . . . . . . . . . 2Average of Grades Awarded by Course Type: Arts & Sciences . . . . . . . . . . . . . . . . 4Average of Grades Awarded by Course Type: Business . . . . . . . . . . . . . . . . . . . . . 5Average of Grades Awarded by Course Type: Education . . . . . . . . . . . . . . . . . . . . . 6
Miscellaneous
Intercollegiate Athletics: 2003-04 . . . . . . . . . . . . . . . . . . . . . . . . . . . . . . . . . . . . . . . 2Financial Aid Summary: 2003-04 . . . . . . . . . . . . . . . . . . . . . . . . . . . . . . . . . . . . . . . 3
III. DEGREES GRANTED
Degrees Offered: 2003-04 . . . . . . . . . . . . . . . . . . . . . . . . . . . . . . . . . . . . . . . . . . . . . 2Academic Program Inventory: 2003-04 . . . . . . . . . . . . . . . . . . . . . . . . . . . . . . . . . . 3Degrees Awarded by Type of Degree: 5-Year Trend . . . . . . . . . . . . . . . . . . . . . . . . 5Degrees Conferred by CIP Category: 5-Year Trend . . . . . . . . . . . . . . . . . . . . . . . . . 6Degrees Awarded by College/School and Department: 5-Year Trend . . . . . . . . . . . 7Degrees Awarded by Undergraduate Majors: 2003-04 . . . . . . . . . . . . . . . . . . . . . . 10Degrees Awarded by Undergraduate Majors: December 2003 . . . . . . . . . . . . . . . . 11

vi
Degrees Granted (continued)
Degrees Awarded by Undergraduate Majors : May 2004 . . . . . . . . . . . . . . . . . . . . 12Degrees Awarded by Graduate Majors: 2003-04 . . . . . . . . . . . . . . . . . . . . . . . . . . . 13Degrees Awarded by Graduate Majors: December 2003 . . . . . . . . . . . . . . . . . . . . . 14Degrees Awarded by Graduate Majors: May 2004 . . . . . . . . . . . . . . . . . . . . . . . . . 15Graduation with Honors: 5-Year Trend . . . . . . . . . . . . . . . . . . . . . . . . . . . . . . . . . . 16Graduation with Honors: December 2003 . . . . . . . . . . . . . . . . . . . . . . . . . . . . . . . . 17Graduation with Honors: May 2004. . . . . . . . . . . . . . . . . . . . . . . . . . . . . . . . . . . . 18
IV. FACULTY AND STAFF
Faculty Profile: University Totals - Fall 2003 . . . . . . . . . . . . . . . . . . . . . . . . . . . . . . 2College of Arts and Sciences . . . . . . . . . . . . . . . . . . . . . . . . . . . . . . . . . . . . . . . . . . . 3College of Business . . . . . . . . . . . . . . . . . . . . . . . . . . . . . . . . . . . . . . . . . . . . . . . . . . 4College of Education . . . . . . . . . . . . . . . . . . . . . . . . . . . . . . . . . . . . . . . . . . . . . . . . . 5School of Nursing . . . . . . . . . . . . . . . . . . . . . . . . . . . . . . . . . . . . . . . . . . . . . . . . . . . . 6Pupil-Teacher Ratio . . . . . . . . . . . . . . . . . . . . . . . . . . . . . . . . . . . . . . . . . . . . . . . . . . 7Faculty Characteristics: 10-Year Trend . . . . . . . . . . . . . . . . . . . . . . . . . . . . . . . . . . . 8Mean Salaries of Faculty by Rank . . . . . . . . . . . . . . . . . . . . . . . . . . . . . . . . . . . . . . . 9Distribution of Employees (Graph) . . . . . . . . . . . . . . . . . . . . . . . . . . . . . . . . . . . . . 10
V. RESOURCES
Tuition and Fees: 2003-04 . . . . . . . . . . . . . . . . . . . . . . . . . . . . . . . . . . . . . . . . . . . . . 2Tuition and Fees: 10-Year Trend (Graph) . . . . . . . . . . . . . . . . . . . . . . . . . . . . . . . . . 3Instruction vs. Total E&G: 5-Year Trend . . . . . . . . . . . . . . . . . . . . . . . . . . . . . . . . . 4Cost Per Student vs. Tuition and Appropriation: 5-Year Trend . . . . . . . . . . . . . . . . 5Current Funds Revenues by Source: 5-Year Profile . . . . . . . . . . . . . . . . . . . . . . . . . 6Current Funds Expenditures by Function: 5-Year Profile . . . . . . . . . . . . . . . . . . . . . 7W.B. Roberts Library Holdings and Circulation . . . . . . . . . . . . . . . . . . . . . . . . . . . . 8


I - General Information - 2
DELTA STATE UNIVERSITYAdministrative Cabinet
2003-04
Dr. John HilpertPresident
Dr. Wayne BlansettVice President for Student Affairs
Mr. Keith FulcherExecutive Director of Alumni Foundation
Dr. Myrtis TabbSenior Administrator-Special Projects
Dr. Brad TeagueAthletic Director
Dr. Beverly MoonFaculty Senate Chair
Mr. Billy MoreheadVice President for Finance
Dr. Michelle RobertsChief Information and PlanningOfficer
Dr. John ThornellProvost and Vice President forAcademic Affairs
INSTITUTIONS OF HIGHER LEARNINGBoard of Trustees
2003-04
Mr. Thomas ColbertPresident, Brandon
Mr. James Roy KlumbVice President, Gulfport
Mr. William S. CrawfordMeridian
Dr. L. Stacy Davidson, Jr.Cleveland
Ms. Ricki R. GarrettClinton
Mr. Bryce GirffisStarkville
Dr. D. E. Magee, Jr.Jackson
Dr. Bettye Henderson NeelyGrenada
Ms. Virginia Shanteau NewtonGulfport
Mr. Carl Nicholson, Jr.Hattiesburg
Mr. Scott RossWest Point
Ms. Amy WhittenOxford
Dr. Thomas D. Layzell, Commissioner of Higher Education3825 Ridgewood RoadJackson, MS 39211-6453(601) 432-6623 [phone](601) 432-6972 [fax]

DIRECTOR OF ATHLETICSVICE PRESIDENT FOR STUDENTAFFAIRS
VICE PRESIDENT FORUNIVERSITY ADVANCEMENT
DIRECTOR OF ALUMNIACTIVITIES
ASSOCIATE VICE PRESIDENTFOR DEVELOPMENT
EXECUTIVE DIRECTOR,FOUNDATION
DIRECTOR, UNIVERSITYRELATIONS
DIVISION OF TECHNOLOGY ANDINFORMATION
INSTITUTIONAL RESEARCH ANDPLANNING
TECHNOLOGY LEARNINGCENTER
TELECOMMUNICATIONS
INFORMATION & TECHNOLOGYSERVICES
ATHLETIC TRAINING
BASEBALL
BASKETBALL
CROSS COUNTRY
FOOTBALL
GOLF
SOFTBALL
SPORTS INFORMATION
SWIMMING
TENNIS
COUNSELING CENTER
ACCOUNTING
BURSAR
PURCHASING ANDPROPERTY CONTROL
BOOKSTORE
TRANSPORTATION
ADMISSIONS
DEAN OF ENROLLMENTSERVICES
REGISTRAR
SCHOOL RELATIONS ANDRECRUITMENT
STUDENT DEVELOPMENT
DELTA STATE UNIVERSITYADMINISTRATIVE AND ACADEMIC ORGANIZATION
JULY 2002
BOARD OF TRUSTEESInstritutions of Higher Learning
CUSTODIAL SERVICES
MAINTENANCE
ASSOCIATE VICE PRESIDENTFOR FINANCE
CAREER SERVICES
HOUSING AND RESIDENCE LIFE
INTRAMURAL SPORTS
MULTICULTRUAL AFFAIRS
POLICE
STUDENT ACTIVITIES
STUDENT HEALTH SERVICES
STUDENT UNION
STUDENT FINANCIALASSISTANCE
CUSTODIAL
PROVOST AND VICE PRESIDENT FOR ACADEMIC AFFAIRS
ACADEMIC SUPPORT LAB
CENTER FOR COMMUNITYDEVELOPMENT
CONTINUING EDUCATION
DEAN, COLLEGE OF ARTS ANDSCIENCES
DELTA CENTER FOR CULTUREAND LEARNING
GRANTS AND CONTRACTS
GREENVILLE HIGHEREDUCATION CENTER
LIBRARY SERVICES
AEROSPACE STUDIES
ART
AUDIO & SPEECH PATHOLOGY
BIOLOGICAL SCIENCES ANDENVIRONMENTAL EDUCATION
HISTORY
LANGUAGE & LITERATURE
MATHEMATICS
MUSIC
PHYSICAL SCIENCES
THE MADISON CENTER
SOCIAL SCIENCES
SOCIAL WORK
DEAN, COLLEGE OF BUSINESS
ACCOUNTING AND COMPUTERINFORMATION SYSTEMS
CENTER FOR BUSINESSRESEARCH
COMMERCIAL AVIATION
ECONOMICS & FINANCE
MANAGEMENT & MARKETING &OFFICE ADMINISTRATION
SMALL BUSINESSDEVELOPMENT CENTER
DEAN, COLLEGE OF EDUCATION
BEHAVIORAL SCIENCES
CURRICULUM & INSTRUCTION
FAMILY AND CONSUMERSCIENCES
FIELD EXPERIENCES ANDTEACHER EDUCATION
HEALTH, PHYSICAL EDUCATIONAND RECREATION
PSYCHOLOGY
INSTRUCTIONAL RESOURCECENTER
UNIVERSITY ARCHIVES
DEAN, SCHOOL OF NURSING
DIRECTOR, BOLOGNAPERFORMING ARTS CENTER
VICE PRESIDENT FORFINANCE
B.F. SMITH CHAIR FORREGIONAL ECONOMIC
DEVELOPMENT
PRESIDENTSPECIAL ASSISTANTTO THE PRESIDENT
PERFORMANCE AUDITOR
PHYSICAL PLANT
GOLF COURSE
LAUNDRY
POST OFFICE
FOOD SERVICES
HUMAN RESOURCES

I - General Information - 4
DELTA STATE UNIVERSITY
HISTORICAL SKETCH
Delta State University was created as Delta State Teachers College by Senate Bill Number263, Chapter 284, entitled An Act to Create and Establish the Delta State Teachers College.Governor Henry L. Whitfield signed the bill on April 9, 1924. Cleveland and Bolivar Countyprovided the College's first physical facilities in the form of three buildings that formerlyhoused the Bolivar County Agricultural High School. The institution opened for its firstregular session on September 15, 1925, with a faculty and staff of eleven and a student bodyof ninety-seven.
The College's first president, Mr. James Wesley Broom, died during Delta State's firstsession. He was succeeded by Dr. W. M. Kethley, who served as president from 1926 to1956. Dr. James M. Ewing became the third president on September 1, 1956, and serveduntil his retirement on July 31, 1971. Dr. Aubrey K. Lucas served as the institution's fourthpresident from August 1, 1971, until June 30, 1975. On July 1, 1975, Dr. Forest Kent Wyattbecame the fifth president, and he served until his retirement on June 30, 1999. He wassucceeded by Dr. David L. Potter on July 1, 1999.
The growth and expanding mission of the institution were evidenced by its name change in1955 to Delta State College. In 1969 Delta State was authorized to reorganize its academicstructure into four schools. The School of Arts and Sciences and the School of Businesswere activated in 1969 and the School of Education and School of Graduate Studies wereimplemented in 1970. A School of Nursing was authorized in 1977 and began operation in1978. On March 15, 1974, the institution was officially designated Delta State Universityto reflect its continued growth and expanded scope.
When created in 1925, Delta State was authorized to offer only the Bachelor of Sciencedegree in Education. The first such degrees were conferred in June 1928. Undergraduatedegrees are now offered in the arts, sciences, humanities, business, nursing, commercialaviation and education.
In 1965, the University initiated a graduate program and the first Master of Educationdegrees were conferred in May, 1966. Delta State University now offers Master's degreesin the areas of business, commercial aviation, education, natural and social sciences, andnursing, as well as the Educational Specialist degree and Doctor of Education in professionalstudies.
From a small teacher-training institution in the 1920's, Delta State has grown into a multi-purpose university which focuses strongly on quality classroom instruction. Enrollment hasincreased to more than 4,000 students, and corresponding growth has occurred in physicalfacilities. The growth and success of the University are tributes to the dedication of thefaculty and staff, the hard work of the students, and the strong support of the Deltacommunity and state legislature.

DELTA STATE UNIVERSITY
Institutional Mission
Delta State University, a regional university in Cleveland, Mississippi, serves as an educational and
cultural center of the Mississippi Delta. The University offers broad undergraduate, graduate, and
continuing education programs of study leading to degrees at the baccalaureate through doctoral
levels. Emphasis is placed on excellence in instruction, followed by service and research, in the
creation of a community of scholars. With special attention to small classes, a friendly environment,
and a broad liberal arts foundation, the University encourages significant student-faculty interactions.
Delta State provides programs and services which promote intellectual, cultural, ethical, physical,
and social development. Students from a broad range of cultural, socioeconomic, and ethnic
backgrounds have the opportunity to develop the ability to respect and evaluate the thoughts of
others; to develop, assess, and express their own thoughts effectively; and to use the techniques of
research and performance associated with their disciplines.
Approved by the Board of Trustees of State Institutions of Higher Learning, February 19, 1998.

I - General Information - 6
DELTA STATE UNIVERSITYUNIVERSITY GOALS
Delta State University strives to fulfill the following goals:
Instruction
1. Review and update undergraduate and graduate programs to address adequately basic skills,knowledge, and competencies necessary for students to be prepared properly in their chosen fields, tocomplete licensure requirements, enter the work force, and/or continue advanced study in graduate orprofessional school.
2. Attract and retain qualified and diverse students, faculty, and staff.
3. Promote faculty development through a comprehensive program designed to strengthen the faculty inteaching, service, and research.
4. Provide sufficient faculty in all disciplines to maintain a student-teacher ratio that ensures opportunitiesfor meaningful intellectual interaction between students and faculty.
5. Accommodate non-traditional students and the general public by offering a comprehensive program ofcontinuing education, including off-campus classes, independent study courses, non-credit courses,conferences, and workshops.
6. Optimize the effective use of technology in support of the education process.
Service
7. Strengthen the cooperative relationships with business, industry, community groups, government, andother educational institutions.
Research
8. Enhance educational experiences at all levels by encouraging student and faculty research and othercreative work.
Support Operations
9. Provide a rich campus life with a variety of cultural and extracurricular activities and otheropportunities for personal development.
10. Increase student retention and graduation rates by providing a support program which includes, but isnot limited to, the following attributes: a comprehensive support program of advising and otherservices to enhance student development; increased financial support to students through scholarships,assistantships, grants, and loans; a developmental studies program for under-prepared students; and,opportunities to meet or communicate with prospective employers or admission personnel fromgraduate or professional schools.

I - General Information - 8
UNIVERSITY CHARACTERISTICS
Location Delta State University is located in Cleveland,Mississippi, in the heart of the Mississippi Delta.The campus consists of 331.54 acres of landwithin or adjoining the western corporate limits.Cleveland is considered a rural city with apopulation of 13,841 and is situated in BolivarCounty, which has a population of 40,633. Thenearest urban city is 110 miles north inMemphis, TN. The nearest international airportis also located in Memphis. Regional airportfacilities are located in Greenville, MS which is40 miles southwest of Cleveland, and the nearestmunicipal airport is located within Cleveland'scity limits.
Academic Year The University operates on the semester systemwith the fall semester beginning in late Augustand ending before Christmas. The springsemester begins in January and ends in May.There are two five-week summer sessions.
Enrollment The total on-campus enrollment for Fall 2003was 3,785. The total off-campus enrollment forFall 2003 was 249: 113 in Greenville, 136 inother locations. Students came from 30 statesand 5 foreign countries.
Student Fees Tuition and fees for Mississippi residents are$1,700 and for non-residents $3,983 persemester. Dorm student's fees are $1,797 persemester.
Student CharacteristicsAverage age of Freshmen - 18Average age of Undergraduates - 26 FTE Student/Faculty ratio - 16 to 1
HousingThe University has 12 residence halls with acapacity of 1,509. There are eight nationalfraternities and six national sororities.Approximately 14% of the undergraduate menare members of a fraternity and 13% of thewomen are members of a sorority.
Athletics The University is a member of the NationalCollegiate Athletic Association (NCAA) at theDivision II level.
Accreditation Delta State University is accredited by theCommission on Colleges of the SouthernAssociation of Colleges and Schools to awardbachelors, masters, specialists and doctoraldegrees.
Degrees The University offers 12 Bachelor's degrees,eight Master's degrees, one Specialist degree andone Doctoral degree. In 2002-03, DSU awarded620 bachelor's degrees, 192 master's, 17specialist's, and 6 doctoral.
Faculty DSU employed 254 faculty in the Fall 2003 ofwhich 135 were full-time and 129 part-time.Fifty-nine percent held Doctoral degrees.
Library The W.B. Roberts Library collections consist of334,710 bound volumes and U.S. governmentdocuments combined, 809,103 microforms, and1,292 subscriptions.
Fine Arts The Fielding Wright Art Center houses the artdepartment and contains three galleries forhanging exhibitions. The Holcombe-Norwoodaddition to the art center was opened in Fall,1994 and the Bologna Performing Arts Centerwas completed in Spring, 1995.
Computer LabsUnion 16 microcomputersEwing Hall 22 microcomputersWalters Hall 46 microcomputersNursing 8 microcomputersBroom Hall 82 microcomputersLibrary 56 microcomputersMusic 12 microcomputersArt 51 microcomputers


DELTA STATE UNIVERSITYNEW STUDENT APPLICATIONS, ADMISSIONS, AND ENROLLMENTS
FALL 2003
Number EnrolledNumber AdmittedNumber of Completed Applications Number of Applications ReceivedSC-TransferCC-TransferFreshmanSC-TransferCC-TransferFreshmanSC-TransferCC-TransferFreshmanSC-TransferCC-TransferFreshman
%#%#%#%#%#%#%#%#%#%#%#%#77%8793%35380%26378%9394%33881%30480%10995%43977%75682%23395%73078%1010In-State
23%264%1720%6722%266%2219%7120%275%2423%22818%505%4222%279Out-of-State
42%4731%11841%13640%4832%11542%15639%5333%15335%34437%10634%26436%470Male
58%6669%26259%19460%7168%24558%21961%8367%31065%64063%17766%50863%817Female
52%5953%20261%20050%6055%19963%23540%5445%20844%43041%11749%37948%621White
45%5145%17035%11650%5943%15434%12657%7854%24953%52557%16049%37849%634Black
3%32%84%140%02%74%143%41%63%292%62%153%34Other
100.0%113100.0%380100.0%330100.0%119100.0%360100.0%375100.0%136100.0%463100.0%984100.0%283100.0%772100.0%1289TOTAL
SC-TRANSFERSCC-TRANSFERSFRESHMEN
* The number of applicants completing the process for admission considerationSource: Enrollment Services** The number of applicants admitted is reported as a % of the completed applications Office of Institutional Research and Planning*** The number of applicants enrolled is reported as a % of the number of applicants admittedDate : October 2003
0
50
100
150
200
250
300
Appl Rec'd Appl Cmpl* Admitted** Enrolled***
283
48% 96%87%
0
100
200
300
400
500
600
700
800
Appl Rec'd Appl Cmpl* Admitted** Enrolled***
772
60% 94%87%
0
200
400
600
800
1000
1200
1400
Appl Rec'd Appl Cmpl* Admitted** Enrolled***
1389
37%76%
84%

DELTA STATE UNIVERSITYACT DATA FOR ENTERING FRESHMEN
2003-04
ACT ScoresScience
CompositeReasoningReadingMathEnglishReference Score Values21.921.823.120.923.4Seventy-fifth percentile19.019.419.417.620.2Median17.317.515.915.917.3Twenty-fifth percentile19.919.819.918.620.6Overall mean3.43.45.03.64.4Standard deviation
Nat'l Avg.20032002200120001999College Freshmen TrendsACT Composite Score
21.520.620.420.721.221.0 English21.518.618.418.719.019.1 Mathematics22.319.920.220.620.820.4 Reading21.719.819.619.820.219.8 Science Reasoning21.919.919.820.120.420.2 Composite
High School Grades3.373.253.213.173.203.15 English3.193.092.973.053.012.99 Mathematics3.463.443.323.383.363.33 Social Studies3.303.223.143.213.213.14 Natural Sciences3.343.263.173.223.203.19 Average of grades
ACT Standard Score
Source: ACT Class Profile Service ReportDate : November 2003
II - New Students - 3
17.0
18.0
19.0
20.0
21.0
22.0
AC
T S
core
English Mathematics Reading Science Reasoning CompositeSubject Area
1999 2000 2001 2002 2003

DELTA STATE UNIVERSITYACT SCORES OF FIRST-TIME ENTERING FRESHMEN
FALL 2003
TotalSATOldCompositeScienceReadingMathEnglishScore
Conv.ACTReasoning000002003600000102350000230234000002003310011313322002050731200234053051041103295203412682882065108827
1100118178826184014921718251710161698192490092513181723
3420322527202522282026331415222122002245352549204311414334262719480048301833281846014528195322172301221825411916200279271115200259841410010104213000013101200000200110000010010--------9--------8--------7--------6--------5--------4--------3--------2--------1
327153309309309309309STUDENTS20.44024.53317.33320.27220.41721.04519.04921.252MEAN
Source: IHL Statistical ReportsDate : October 2003
II - New Students - 4

DELTA STATE UNIVERSITYMAJOR FEEDER HIGH SCHOOLS FOR ACT TESTED FRESHMEN
FRESHMAN CLASS: 2003-04
ENROLLEDLOCATIONHIGH SCHOOL AVG. ACTNUMBER
20.117Cleveland, MSCleveland High School16.49Indianola, MSGentry High School19.98Greenville, MSSaint Josephs High School20.37Clarksdale, MSLee Academy16.37Rosedale, MSWest Bolivar District High School19.47Cleveland, MSBayou Academy20.17Southaven, MSSouthaven High School21.76Canton, MSCanton Academy17.76Cleveland, MSEast Side High School20.06Madison, MSMadison Central High School19.45Indianola, MSIndianola Academy17.25Ruleville, MSRuleville Central High School19.34Avon, MSRiverside High School20.04Batesville, MSSouth Panola High School22.54Greenville, MSWashington School18.04Shelby, MSBroad Street High School—.-3West Memphis, ARWest Memphis High School—.-3Arcola, MSDeer Creek School—.-3Centreville, MSCentreville Academy—.-3Hollandale, MSSimmons High School—.-3Marks, MSDelta Academy—.-3Marks, MSMadison S. Palmer High School—.-3Senatobia, MSMagnolia Heights School—.-3Vicksburg, MSWarren Central High School—.-3Vicksburg, MSVicksburg Catholic School—.-2Oxford, ALOxford High School—.-2Crestview, FLCrestview Senior High School—.-2Amory, MSAmory High School—.-2Batesville, MSNorth Delta School—.-2Belzoni, MSHumphreys Academy
Source: ACT Class Profile ReportDate : November 2003
II - New Students - 5


DELTA STATE UNIVERSITYON-CAMPUS ENROLLMENT SUMMARY BY SEMESTER
2003-04
SPRING 2004FALL 2003SUMMER 2003%#%#%#
STATUS-HEADCOUNT73.6%2,57572.8%2,754** Full-time26.4%92427.2%1,031** Part-time
STATUS-FTE88.5%2,56788.7%2,746** Full-time11.5%33311.3%351** Part-time
RACE60.0%2,10063.1%2,38756.5%868 White38.5%1,34635.5%1,34242.4%651 Black1.5%521.5%561.0%16 Other
GENDER62.5%2,18863.0%2,38565.2%1,002 Female37.5%1,31137.0%1,40034.8%534 Male
LEVEL32.6%1,14234.4%1,30114.4%221 Lower48.4%1,69549.0%1,85553.0%814 Upper18.9%66216.6%62932.6%501 Graduate
RESIDENCY90.5%3,16690.7%3,43394.5%1,451 Resident of MS9.5%3339.3%3525.5%85 Non-resident of MS
SCHOOL24.0%84124.4%92425.2%387 Arts & Sciences25.3%88424.5%92926.8%411 Business33.4%1,16730.8%1,16631.1%478 Education4.2%1464.4%1662.3%36 Nursing13.2%46115.9%60014.6%224 Undeclared
100.0%3,499100.0%3,785100.0%1,536TOTAL-HEADCOUNT100.0%2,900100.0%3,097100.0%751TOTAL-FTE
* Full-time and part-time status isSource: Institutional Research and Planning not defined for the summer term.Date : March 2004
II - Enrollment - 2

DELTA STATE UNIVERSITYENROLLMENT SUMMARY OF STUDENTS BY RACE
FALL 2003
TOTAL Other Black White%#%#%#%#
37%1,4002%2525%35073%1,025Male
63%2,3851%3142%99257%1,362Female
20%7723%2233%25265%498Freshman*
14%5291.1%629%15370%370Sophomore*
21%7951.4%1133%26565%519Junior*
28%1,0600%435%36765%689Senior*
83%3,1561%4333%1,03766%2,076Total Undergraduate
15%5801%749%28350%290Master & Specialist
1%494%239%1957%28Doctoral
17%6291%948%30251%318Total Graduate
Graduates-2002-03
74%6200%328%17571%442Bachelor
23%1941%247%9152%101Master
2%170%059%1041%7Ed. Specialist
1%60%033%267%4Doctoral
100%8371%533%27866%554Total
73%2,7541%4135%97263%1,741Full-time
27%1,0311%1536%37063%646Part-time
91%3,4321%4637%1,27162%2,115In-State
9%3533%1020%7177%272Out-of- State
100%3,7851%5635%1,34263%2,387GRAND TOTAL
* Classification estimatedSource: IHL Statistical ReportDate : October 2003
II - Enrollment - 3
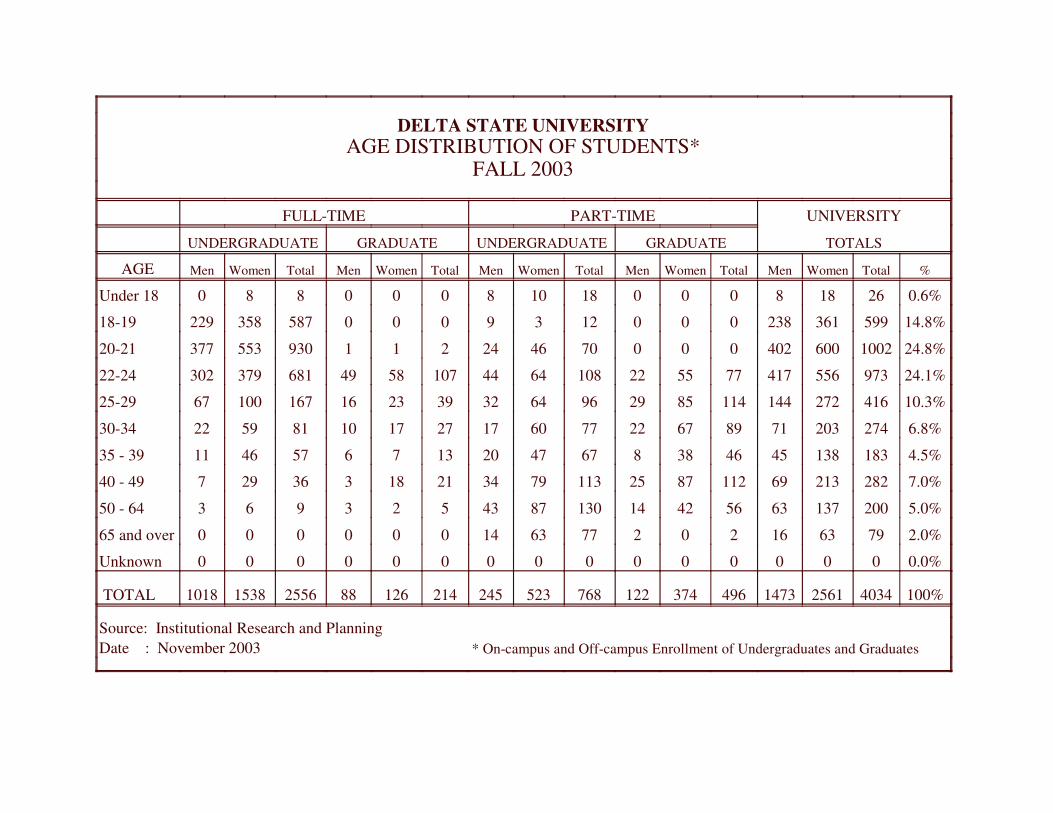
DELTA STATE UNIVERSITYAGE DISTRIBUTION OF STUDENTS*
FALL 2003
UNIVERSITYPART-TIMEFULL-TIME
TOTALSGRADUATEUNDERGRADUATEGRADUATEUNDERGRADUATE
%TotalWomenMenTotalWomenMenTotalWomenMenTotalWomenMenTotalWomenMenAGE
0.6%2618800018108000880Under 18
14.8%599361238000123900058735822918-19
24.8%100260040200070462421193055337720-21
24.1%9735564177755221086444107584968137930222-24
10.3%41627214411485299664323923161671006725-29
6.8%2742037189672277601727171081592230-34
4.5%1831384546388674720137657461135 - 39
7.0%2822136911287251137934211833629740 - 49
5.0%20013763564214130874352396350 - 64
2.0%79631620277631400000065 and over
0.0%000000000000000Unknown
100%40342561147349637412276852324521412688255615381018 TOTAL
Source: Institutional Research and Planning* On-campus and Off-campus Enrollment of Undergraduates and GraduatesDate : November 2003

DELTA STATE UNIVERSITYENROLLMENT OF MS INSTITUTIONS BY LEVEL
FALL 2003
TOTALGraduateTotalSeniorJuniorSophomoreFreshmanINSTITUTIONUndergrad.
3,3096472,662753470463976Alcorn State University
3,7856293,1561,060795529772Delta State University (estimated)
7,8151,5236,2921,8011,1761,2852,030Jackson State University
15,4163,10812,3084,8552,6882,2062,559MS State University*
2,0351321,903735420304444MS University for Women
3,3454052,9407254965591,160MS Valley State University
12,9982,26410,7343,0082,2732,1763,277University of Mississippi**
13,3452,28511,0604,3762,6111,8432,230University of Southern MS
62,04810,99351,05517,31310,9299,36513,448TOTAL
* Includes Veterinary studentsSource: IHL Fall 2003 Enrollment Factbook** Excludes Medical School located in Jackson.Date : November 2003 Includes Law School, fifth-year Pharmacy, and fifth-year Engineering enrollments.

DELTA STATE UNIVERSITYENROLLMENT OF MS INSTITUTIONS BY HEADCOUNT AND FULL-TIME EQUIVALENT
FALL 2003
Full-time Equivalent HeadcountF.T.E PercentTotalGraduateUpperLowerPercentTotalPartFullINSTITUTIONof HeadcountPart TimeTimeTime
85.7%2,8363331,1341,36923.7%3,3097832,526Alcorn State University
81.8%3,0973391,5321,22627.2%3,7851,0312,754Delta State University
86.1%6,7328902,7063,13622.6%7,8151,7706,045Jackson State University
85.4%13,1692,0516,7374,38118.8%15,4162,90312,513MS State University
86.0%1,751831,03063823.5%2,0354781,557MS University for Women
82.6%2,7631611,0971,50524.2%3,3458092,536MS Valley State University
92.9%12,0772,0564,8345,18710.6%12,9981,38311,615University of Mississippi
84.5%11,2721,8695,6983,70525.5%13,3453,4079,938University of Southern MS
86.5%53,6977,78224,76821,14720.2%62,04812,56449,484TOTAL
Source: IHL Fall 2003 Enrollment Fact BookDate : November 2003

DELTA STATE UNIVERSITYENROLLMENT OVERVIEW
TWO-YEAR FALL COMPARISON
FALL 2003FALL 2002%#%#
100.0%3,785100.0%3,825TOTAL UNIVERSITY72.8%2,75473.0%2,791 Full-time27.2%1,03127.0%1,034 Part-time
3,0973,088FTE83.4%3,15684.1%3,218Total Undergraduate16.6%62915.9%607Total Graduate20.4%77222.0%842Freshmen*14.0%52913.6%520Sophomores*21.0%79521.0%804Juniors*28.0%1,06027.5%1,052Seniors*14.4%54413.9%531Masters1.0%360.8%31Specialists1.3%491.2%45Doctoral8.7%3309.3%356First-time Freshmen55.7%2,10954.3%2,077Returning Students4.5%1704.1%157Readmitted Students11.4%43212.3%469Transfer Students12.8%48413.1%501Returning Graduate Students0.0%00.0%0Transient0.6%220.8%30High School Students1.1%411.2%44Non-Formula Students ("over 21")5.2%1975.0%191First-Time Graduate Students90.7%3,43391.2%3,490In-State9.3%3528.8%335Out-of-State37.0%1,40038.3%1,465Men 63.0%2,38561.7%2,360Women63.1%2,38764.1%2,453Caucasian0.5%200.3%13Asian 35.5%1,34234.9%1,336Black0.3%110.5%18American Indian0.7%250.1%5Hispanic
* Classification estimatedSource: Institutional Research and PlanningDate : October 2003
II - Enrollment - 7

DELTA STATE UNIVERSITY3-YEAR ENROLLMENT PROFILE
COLLEGE OF ARTS AND SCIENCES
3-YR CHANGE200320022001FALL SEMESTER
%#%#%#%#STATUS
1%487%80283%71591%798 Full-time56%4413%12217%1449%78 Part-time
GENDER10%5765%60567%57263%548 Female-3%-935%31933%28737%328 Male
RESIDENCY5%4191%84292%79491%801 In-State9%79%828%659%75 Out-of-State
CLASSIFICATON-11%-2421%19724%20525%221 Freshmen*17%2418%16317%14816%139 Sophomores*14%2824%22323%19822%195 Juniors*3%729%27129%25330%264 Seniors*23%138%706%557%57 Graduates5%4824%92422%85923%876School Total
2.1%79100%3825100%3825100%3746DSU TOTAL
* Classification estimatedSource: IHL Statistical ReportDate : October 2003
II - Enrollment - 8
0
500
1000
1500
2000
2500
3000
3500
4000
4500
# O
F ST
UD
EN
TS
2001 2002 2003YEAR
23% 22% 24%
3746 3825 3785
A&S DSU

DELTA STATE UNIVERSITY3-YEAR ENROLLMENT PROFILE
COLLEGE OF BUSINESS
3-YR CHANGE200320022001FALL SEMESTER
%#%#%#%#STATUS
-6%-5281%74978%81684%801 Full-time20%3019%18022%22516%150 Part-time
GENDER-21%-11144%40745%46454%518 Female21%8956%52255%57746%433 Male
RESIDENCY-7%-5887%81189%92591%869 In-State44%3613%11811%1169%82 Out-of-State
CLASSIFICATON-25%-5216%15219%19721%204 Freshmen*-10%-1615%14212%12717%158 Sophomores*1%226%24027%27625%238 Juniors*2%429%27027%28528%266 Seniors*47%4013%12515%1569%85 Graduates-2%-2225%92927%104125%951School Total 1.0%39100%3785100%3825100%3746DSU TOTAL
* Classification estimatedSource: IHL Statistical ReportDate : October 2003
II - Enrollment - 9
0
500
1000
1500
2000
2500
3000
3500
4000
4500
# O
F ST
UD
EN
TS
2001 2002 2003YEAR
25% 27%25%
3746 3825 3785
Business DSU
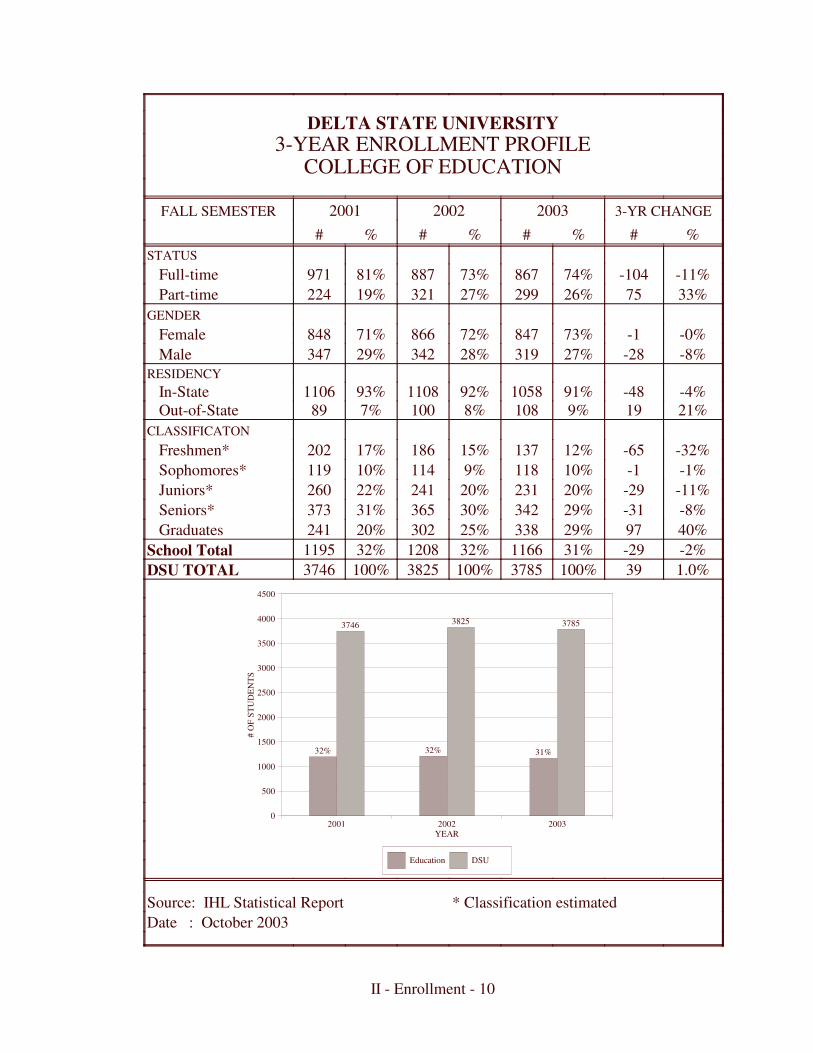
DELTA STATE UNIVERSITY3-YEAR ENROLLMENT PROFILE
COLLEGE OF EDUCATION
3-YR CHANGE200320022001FALL SEMESTER
%#%#%#%#STATUS
-11%-10474%86773%88781%971 Full-time33%7526%29927%32119%224 Part-time
GENDER-0%-173%84772%86671%848 Female-8%-2827%31928%34229%347 Male
RESIDENCY-4%-4891%105892%110893%1106 In-State21%199%1088%1007%89 Out-of-State
CLASSIFICATON-32%-6512%13715%18617%202 Freshmen*-1%-110%1189%11410%119 Sophomores*-11%-2920%23120%24122%260 Juniors*-8%-3129%34230%36531%373 Seniors*40%9729%33825%30220%241 Graduates-2%-2931%116632%120832%1195School Total 1.0%39100%3785100%3825100%3746DSU TOTAL
* Classification estimatedSource: IHL Statistical ReportDate : October 2003
II - Enrollment - 10
0
500
1000
1500
2000
2500
3000
3500
4000
4500
# O
F ST
UD
EN
TS
2001 2002 2003YEAR
32% 32% 31%
3746 3825 3785
Education DSU

DELTA STATE UNIVERSITY3-YEAR ENROLLMENT PROFILE
SCHOOL OF NURSING
3-YR CHANGE200320022001FALL SEMESTER
%#%#%#%#STATUS
-8%-1179%13180%10389%142 Full-time106%1821%3520%2511%17 Part-time
GENDER0%087%14588%11391%145 Female50%713%2112%159%14 Male
RESIDENCY-1%-292%15394%12097%155 In-State
225%98%136%83%4 Out-of-StateCLASSIFICATON
34%1331%5134%4424%38 Freshmen*6%111%189%1111%17 Sophomores*0%017%2814%1818%28 Juniors*-4%-230%4937%4732%51 Seniors*0%-512%206%816%25 Graduates4%74%1663%1284%159School Total
1.0%39100%3785100%3825100%3746DSU TOTAL
* Classification estimatedSource: IHL Statistical ReportDate : October 2003
II - Enrollment - 11
0
500
1000
1500
2000
2500
3000
3500
4000
4500
# O
F ST
UD
EN
TS
2001 2002 2003YEAR
4% 3% 4%
3746 3825 3785
Nursing DSU

DELTA STATE UNIVERSITY3-YEAR ENROLLMENT PROFILE
UNCLASSIFIED MAJOR
3-YR CHANGE200320022001FALL SEMESTER
%#%#%#%#STATUS
-32%-9634%20546%27053%301 Full-time50%13166%39554%31947%264 Part-time
GENDER14%4864%38159%34559%333 Female-6%-1337%21941%24441%232 Male
RESIDENCY11%5595%56992%54391%514 In-State-39%-205%318%469%51 Out-of-State
CLASSIFICATON-10%-2743%25536%21050%282 Freshmen*-4%-416%9520%12018%99 Sophomores*72%3614%8612%719%50 Juniors*4%315%8817%10215%85 Seniors*55%2713%7615%869%49 Graduates6%3516%60015%58915%565School Total
1.0%39100%3785100%3825100%3746DSU TOTAL
* Classification estimatedSource: IHL Statistical ReportDate : October 2003
II - Enrollment - 12
0
500
1000
1500
2000
2500
3000
3500
4000
4500
# O
F ST
UD
EN
TS
2001 2002 2003YEAR
15% 15% 16%
3746 3825 3785
Unclassified DSU
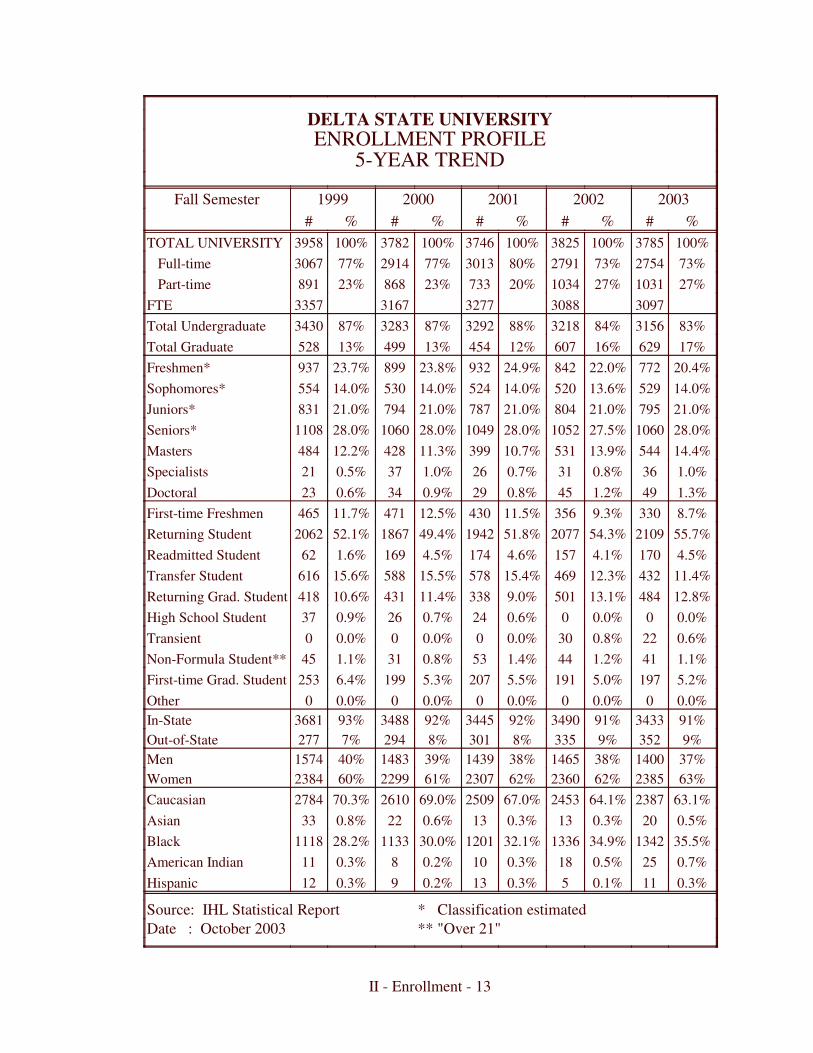
DELTA STATE UNIVERSITYENROLLMENT PROFILE
5-YEAR TREND
20032002200120001999Fall Semester%#%#%#%#%#
100%3785100%3825100%3746100%3782100%3958TOTAL UNIVERSITY73%275473%279180%301377%291477%3067 Full-time27%103127%103420%73323%86823%891 Part-time
30973088327731673357FTE83%315684%321888%329287%328387%3430Total Undergraduate17%62916%60712%45413%49913%528Total Graduate
20.4%77222.0%84224.9%93223.8%89923.7%937Freshmen*14.0%52913.6%52014.0%52414.0%53014.0%554Sophomores*21.0%79521.0%80421.0%78721.0%79421.0%831Juniors*28.0%106027.5%105228.0%104928.0%106028.0%1108Seniors*14.4%54413.9%53110.7%39911.3%42812.2%484Masters1.0%360.8%310.7%261.0%370.5%21Specialists1.3%491.2%450.8%290.9%340.6%23Doctoral8.7%3309.3%35611.5%43012.5%47111.7%465First-time Freshmen55.7%210954.3%207751.8%194249.4%186752.1%2062Returning Student4.5%1704.1%1574.6%1744.5%1691.6%62Readmitted Student11.4%43212.3%46915.4%57815.5%58815.6%616Transfer Student12.8%48413.1%5019.0%33811.4%43110.6%418Returning Grad. Student0.0%00.0%00.6%240.7%260.9%37High School Student0.6%220.8%300.0%00.0%00.0%0Transient1.1%411.2%441.4%530.8%311.1%45Non-Formula Student**5.2%1975.0%1915.5%2075.3%1996.4%253First-time Grad. Student0.0%00.0%00.0%00.0%00.0%0Other91%343391%349092%344592%348893%3681In-State9%3529%3358%3018%2947%277Out-of-State
37%140038%146538%143939%148340%1574Men63%238562%236062%230761%229960%2384Women
63.1%238764.1%245367.0%250969.0%261070.3%2784Caucasian0.5%200.3%130.3%130.6%220.8%33Asian35.5%134234.9%133632.1%120130.0%113328.2%1118Black0.7%250.5%180.3%100.2%80.3%11American Indian0.3%110.1%50.3%130.2%90.3%12Hispanic
* Classification estimatedSource: IHL Statistical Report** "Over 21"Date : October 2003
II - Enrollment - 13

DELTA STATE UNIVERSITYON-CAMPUS HEADCOUNT ENROLLMENT
FALL 1994-2003
Source: IHL Statistical ReportDate : October 2003
II - Enrollment - 14
0
500
1000
1500
2000
2500
3000
3500
4000
4500
NU
MB
ER
EN
RO
LL
ED
1994 1995 1996 1997 1998 1999 2000 2001 2002 2003
FALL SEMESTER
37753887 3860
3969 3931 39583782 3746 3825 3785

DELTA STATE UNIVERSITYON-CAMPUS ENROLLMENT OF STUDENTS BY CLASS
10-YEAR TREND
TOTAL GRADUATESENIOR*JUNIOR*SOPHOMORE*FRESHMAN*FALL
%#%#%#%#%#%#SEMESTER
100%377514%54428%106321%79814%53422%8361994100%388716%61127%103422%83614%54323%8631995100%386014%55529%111321%79514%55722%8401996100%396914%54728%112922%85614%57323%8641997100%393112%49129%113221%84315%57024%8951998100%395813%52828%110821%83114%55425%9371999100%378213%49928%106021%79414%53024%8992000100%374612%45428%104921%78714%52425%9322001100%382516%60728%105221%80414%52022%8422002100%378517%62928%106021%79514%52920%77220030%1016%85-0%-3-0%-3-1%-5-8%-6410-YEAR CHG.
* Classification estimated for years 1994-2003Source: IHL Statistical ReportDate : October 2003
II - Enrollment - 15
350
450
550
650
750
850
950
1050
1150
1250
# O
F ST
UD
EN
TS
1994 1995 1996 1997 1998 1999 2000 2001 2002 2003YEAR
FRESHMAN SOPHOMORE JUNIOR
SENIOR GRADUATE

DELTA STATE UNIVERSITYON-CAMPUS ENROLLMENT OF STUDENTS BY GENDER
10-YEAR TREND
TOTAL FEMALEMALE FALL SEMESTER%#%#%#
100%377558%220342%15721994100%388760%232640%15611995100%386060%233440%15261996100%396961%243439%15351997100%393161%239139%15401998100%395860%238440%15741999100%378261%229939%14832000100%374662%230738%14392001100%379962%236038%14392001100%378563%238537%140020030%108%182-11%-17210-YEAR CHANGE
Source: IHL Statistical ReportDate : October 2003
II - Enrollment - 16
1300
1500
1700
1900
2100
2300
2500
# O
F ST
UD
EN
TS
1994 1995 1996 1997 1998 1999 2000 2001 2001 2003
MALE FEMALE
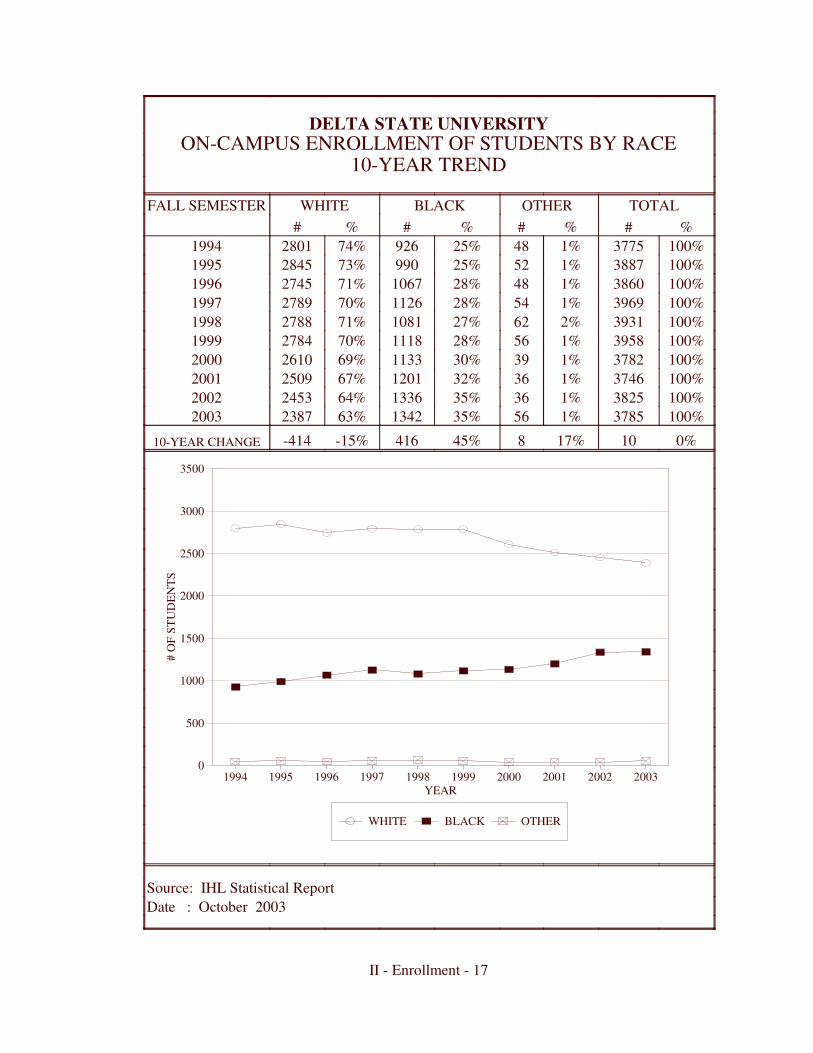
DELTA STATE UNIVERSITYON-CAMPUS ENROLLMENT OF STUDENTS BY RACE
10-YEAR TREND
TOTAL OTHER BLACKWHITEFALL SEMESTER%#%#%#%#
100%37751%4825%92674%28011994100%38871%5225%99073%28451995100%38601%4828%106771%27451996100%39691%5428%112670%27891997100%39312%6227%108171%27881998100%39581%5628%111870%27841999100%37821%3930%113369%26102000100%37461%3632%120167%25092001100%38251%3635%133664%24532002100%37851%5635%134263%23872003
0%1017%845%416-15%-41410-YEAR CHANGE
Source: IHL Statistical ReportDate : October 2003
II - Enrollment - 17
0
500
1000
1500
2000
2500
3000
3500
# O
F ST
UD
EN
TS
1994 1995 1996 1997 1998 1999 2000 2001 2002 2003YEAR
WHITE BLACK OTHER

DELTA STATE UNIVERSITYON-CAMPUS ENROLLMENT OF STUDENTS BY RESIDENCY
10-YEAR TREND
TOTAL OUT-OF-STATEIN-STATEFALL SEMESTER%#%#%#
100%37756%24394%35321994100%38876%22494%36631995100%38606%22194%36391996100%39696%23394%37361997100%39317%28293%36491998100%39587%27793%36811999100%37828%29492%34882000100%37468%30192%34452001100%38259%33591%34902002100%37859%35291%343320030%1045%109-3%-9910-YEAR CHANGE
Source: IHL Statistical ReportDate : October 2003
II - Enrollment - 18
0
500
1000
1500
2000
2500
3000
3500
4000
# O
F ST
UD
EN
TS
1994 1995 1996 1997 1998 1999 2000 2001 2002 2003
RESIDENT OF MS NON-RESIDENT OF MS

DELTA STATE UNIVERSITYON-CAMPUS ENROLLMENT OF STUDENTS BY STATUS
10-YEAR TREND
TOTAL PART-TIMEFULL-TIME FALL SEMESTER%#%#%#
100%377523%87377%29021994100%388724%93276%29551995100%386021%82079%30401996100%396923%91377%30561997100%393125%96475%29671998100%395823%89177%30671999100%378223%86877%29142000100%374620%73380%30132001100%382527%103473%27912002100%378527%103173%275420030%1018%158-5%-14810-YEAR CHANGE
Source: IHL Statistical ReportDate : October 2003
II - Enrollment - 19
700
1200
1700
2200
2700
3200
# O
F ST
UD
EN
TS
1994 1995 1996 1997 1998 1999 2000 2001 2002 2003YEAR
FULL-TIME PART-TIME

DELTA STATE UNIVERSITYON-CAMPUS ENROLLMENT OF STUDENTS BY LEVEL
10-YEAR TREND
TOTAL GRADUATE UPPER LEVELLOWER LEVELFALL SEMESTER
%#%#%#%#100%377514%54449%186136%13701994100%388716%61148%187036%14061995100%386014%55549%190836%13971996100%396914%54750%198536%14371997100%393112%49150%194838%14921998100%395813%52849%193938%14911999100%378213%49949%185438%14292000100%374612%45449%183639%14562001100%382516%60749%185636%13622002100%378517%62949%185534%13012003
0%1016%85-0%-6-5%-6910-YEAR CHANGE
Source: IHL Statistical ReportDate : October 2003
II - Enrollment - 20
400
600
800
1000
1200
1400
1600
1800
2000
2200
# O
F ST
UD
EN
TS
1994 1995 1996 1997 1998 1999 2000 2001 2002 2003YEAR
LOWER UPPER GRADUATE

DELTA STATE UNIVERSITYON-CAMPUS ENROLLMENT OF STUDENTS BY SCHOOL
10-YEAR TREND
TOTALNURSINGEDUCATIONBUSINESS A & SFALL
%#%#%#%#%#SEMESTER100%31277%23026%81930%93637%11421994100%32498%25533%106727%87133%10561995100%32597%21932%105928%90433%10771996100%34336%19834%117430%101530%10461997100%33546%19235%116530%99130%10061998100%33236%19635%116931%101528%9431999100%32365%16537%119232%104026%8392000100%31815%15938%119530%95128%8762001100%32364%12837%120832%104127%8592002100%31855%16637%116629%92929%9242003
2%58-28%-6442%347-1%-7-19%-21810-YEAR CHG.
Source: IHL Statistical ReportDate : October 2003
II - Enrollment - 21
0
200
400
600
800
1000
1200
1400
1600
1800
# O
F ST
UD
EN
TS
1994 1995 1996 1997 1998 1999 2000 2001 2002 2003YEAR
A & S BUSINESS EDUCATION NURSING

DELTA STATE UNIVERSITYENROLLMENT: ACTUAL AND PROJECTED
1995-2007
---->---->ProjectedActualActualActualActualActualActualActualActualActualCLASSIFICATION2007200620052004200320022001200019991998199719961995
871861841826772842932899937895864845897Freshmen*
509498489457529520524530554570573538546Sophomores*
741727680787795804787794831843856808782Juniors*
95589310331044106010521049106011081132112911141051Seniors*
3,0762,9793,0433,1143,1563,2183,2923,2833,4303,4403,4223,3053,276Total Undergraduates
589577566555544531399428484457512522573Masters
4039383736312637217785Specialists
56545250494529342327282533Doctors
685670656642629607454499528491547555611Total Graduates
37613,6493,6993,7563,7853,8253,7463,7823,9583,9313,9693,8603,887Headcount, on-campus280272264256249136129134128117116155120Extension, off-campus
403439613875391640864048408540154007Actual Headcount
4036402840204012393639073900409641584152395439933885Projected Headcount
* Classification estimatedSource: Institutional Research and PlanningDate : March 2004


DELTA STATE UNIVERSITYMEN'S & WOMEN'S RESIDENCE HALLS - COMPARATIVE ROOM RPT.
5-YEAR TREND
Capacity10/01/0310/01/0210/01/0110/01/200010/01/99RESIDENCE HALLS
MEN'S 124106102100108111Whittington-Williams140799197119113Bond-Carpenter
0034614958Stadium*76475004350Noel81523606366Brewer000453947Clark**000465146Longino**000243441Woolfolk*
18615314714600New Men's Hall607437460519506532 TOTALS
Classification Breakdown115119122141141Freshmen11110712210193Sophomores102117137124143Juniors88107120117127Seniors2110182328Graduates
437460519506532 TOTALS
WOMEN'S 196149160183176187Brumby-Castle894452788171Cleveland
11610811084102100Cain-Tatum1399792111129119Fugler-Hammett290180197250257262Lawler-Harkins724361286242Ward
902621672734807781 TOTALS
Classification Breakdown157186197225217Freshmen154162191174189Sophomores184172172235239Juniors116137160159123Seniors1015141413Graduates
621672734807781 TOTALS
OVERALL TOTALS272305319366358Freshmen265269313275282Sophomores286289309359382Juniors204244280276250Seniors3125323741Graduates
10581132125313131313 TOTALS
* No longer in useSource: Housing & Residence Life** Closed for renovationsDate : October 2003
II - Housing & Residency - 2

DELTA STATE UNIVERSITYON-CAMPUS ENROLLMENT OF STUDENTS BY COUNTIES
5-YEAR TREND
5-YEAR FALLFALLFALLFALLFALLCOUNTIESCHANGE20032002200120001999
-11016181411Adams035873Alcorn-134644Amite-14914231723Attala045424Benton511321074104810601127Bolivar
-11811181819Calhoun-73040333937Carroll-66771212Chickasaw145333Choctaw-523237Claiborne033123Clarke-147475Clay-42196223204196238Coahoma0851098Copiah-111132Covington-11105112102109116Desoto295457Forrest-200002Franklin-122223George-200122Greene-18107101114121125Grenada-100001Hancock22126272219Harrison116876726357Hinds-161815212334Holmes-15757566158Humphreys
Source: IHL Statistical ReportPage 1 of 3Date : October 2003
II - Housing & Residency - 3

DELTA STATE UNIVERSITYON-CAMPUS ENROLLMENT OF STUDENTS BY COUNTIES
5-YEAR TREND
5-YEAR FALLFALLFALLFALLFALLCOUNTIESCHANGE20032002200120001999
695643Issaquena366633Itawamba
-141210152326Jackson-232335Jasper356512Jefferson023422Jefferson Davis69171393Jones331100Kemper314158711Lafayette134672Lamar4109636Lauderdale342111Lawrence-4646910Leake43429272830Lee-2135131140135137Leflore065666Lincoln
-13715211820Lowndes65042393944Madison-511136Marion-51418182119Marshall42216171918Monroe-71721262424Montgomery-478101111Neshoba-610377Newton-201442Noxubee187877Oktibbeha116855615957Panola-428776Pearl River
Source: IHL Statistical ReportPage 2 of 3Date : October 2003
II - Housing & Residency - 4

DELTA STATE UNIVERSITYON-CAMPUS ENROLLMENT OF STUDENTS BY COUNTIES
5-YEAR TREND
5-YEAR FALLFALLFALLFALLFALLCOUNTIESCHANGE20032002200120001999
-111122Perry110913109Pike1101311139Pontotoc141343Prentiss64235333636Quitman
-105559626065Rankin-255867Scott-152934354144Sharkey-415355Simpson-335876Smith221230Stone
-10265288255276275Sunflower-116859637179Tallahatchie-102828353238Tate055885Tippah022222Tishomingo-61518121521Tunica0911989Union-210023Walthall-63842454044Warren-37499538494500536Washington-112112Wayne013411Webster441000Wilkinson
-1245101416Winston-32730343230Yalobusha03632373536Yazoo
-24834333490344534883681TOTALS
Source: IHL Statistical ReportPage 3 of 3Date : October 2003
II - Housing & Residency - 5


DELTA STATE UNIVERSITYENROLLMENT OF STUDENTS BY STATES AND COUNTRIES
5-YEAR TREND
5-YEARFALLFALLFALLFALLFALLSTATES ANDCHANGE20032002200120001999COUNTRIES
-19137493782371337513940TOTAL - STATES12018121019Alabama000000Alaska-200122Arizona195750504038Arkansas143023California554220Colorado-100011Connecticut000000Delaware000000District of Columbia82420171116Florida-135534Georgia000000Hawaii000000Idaho-341367Illinois132542Indiana000000Iowa011001Kansas132632Kentucky-43535364039Louisiana-100011Maine021242Maryland000000Massachusetts-112012Michigan112000Minnesota
-24834333490344534883681Mississippi475213Missouri111000Montana222100Nebraska000000Nevada000000New Hampshire-100011New Jersey110000New Mexico
Source: IHL Statistical ReportPage 1 of 2Date : October 2003
II - Housing & Residency - 7

DELTA STATE UNIVERSITYENROLLMENT OF STUDENTS BY STATES AND COUNTRIES
5-YEAR TREND
5-YEARFALLFALLFALLFALLFALLSTATES ANDCHANGE20032002200120001999COUNTRIES
STATES (CONT.)-300023New York232011North Carolina000000North Dakota-126443Ohio-210013Oklahoma-111102Oregon232211Pennsylvania000100Rhode Island010221South Carolina000000South Dakota
158793849272Tennessee93529252426Texas333210Utah000000Vermont-111222Virginia131312Washington220000West Virginia000000Wisconsin000000Wyoming
183643333118TOTAL - COUNTRIES344411Canada000000China000000Czechoslovakia447500France000000Germany000000Ghana001200India-100001Malaysia123201Nigeria-102211Poland-100011Slovakia445910South Africa000000Spain895311Turkey000000United Kingdom-101011Uzbekistan2131562511Undefined
-17337853825374637823958GRAND TOTAL
Source: IHL Statistical ReportPage 2 of 2Date : October 2003
II - Housing & Residency - 8


DELTA STATE UNIVERSITYUNDERGRADUATE MAJORS BY GENDER AND MINORITY STATUS
FALL 2003
MinoritiesTotalFemaleMaleUndergraduate Majors%##%#%#
16.8%9154162.8%34037.2%201Undeclared (Undergraduate)
20.0%2914564.8%9435.2%51Art
0.0%12240.0%70.0%17Athletic Training
42.0%296997.1%672.9%2Audiology/Speech Pathology
44.3%8519269.3%13330.7%59Biology
35.3%61770.6%1229.4%5Biology Education
0.0%0728.6%271.4%5Environmental Science
21.2%73333.3%1166.7%22History
26.2%114252.4%2247.6%20English
40.0%143577.1%2722.9%8English Education
20.0%15100.0%50.0%0Foreign Languages
66.7%81250.0%650.0%6Journalism
22.7%52231.8%768.2%15Mathematics
42.9%92157.1%1242.9%9Mathematics Education
14.3%32133.3%766.7%14Music
7.5%34047.5%1952.5%21Music Education
150.0%020.0%20.0%0Music Performance
38.2%215563.6%3536.4%20Chemistry
0.0%000.0%00.0%0Chemistry Education
0.0%10210.0%150.0%6Political Science
45.4%4910841.7%4558.3%63Criminal Justice
63.8%304755.3%2644.7%21Social Science
Source: Institutional Research & PlanningPage 1 of 2Date : January 2004
II - Majors - 2

DELTA STATE UNIVERSITYUNDERGRADUATE MAJORS BY GENDER AND MINORITY STATUS
FALL 2003
MinoritiesTotalFemaleMaleUndergraduate Majors%##%#%#
36.4%164438.6%1761.4%27Social Science Education
70.2%8011493.0%1067.0%8Social Work
27.0%3312263.9%7836.1%44Accounting
81.0%172190.5%199.5%2Office Administration
21.7%5234.3%195.7%22Aviation Management
10.3%9872.3%297.7%85Flight Operations
60.8%10116651.8%8648.2%80Computer Information Systems
30.6%113630.6%1169.4%25Finance
28.9%113839.5%1560.5%23Insurance & Real Estate
25.8%5420943.1%9056.9%119General Business
0.0%020.0%00.0%2Hospitality Services Management
39.0%307741.6%3258.4%45Management
15.1%117358.9%4341.1%30Marketing
50.0%122454.2%1345.8%11Business Education
41.6%327777.9%6022.1%17Psychology
42.1%81994.7%185.3%1Special Education
46.1%14130693.8%2876.2%19Elementary Education
38.8%5714725.2%3774.8%110Health, Phys. Ed. & Recreation
28.6%62195.2%204.8%1Fashion Merchandising
43.2%388896.6%853.4%3Family & Consumer Science
38.5%6717486.2%15013.8%24Nursing
34.9%1162332762%206438%1263TOTALS
Source: Institutional Research & PlanningPage 2 of 2Date : January 2004
II - Majors - 3
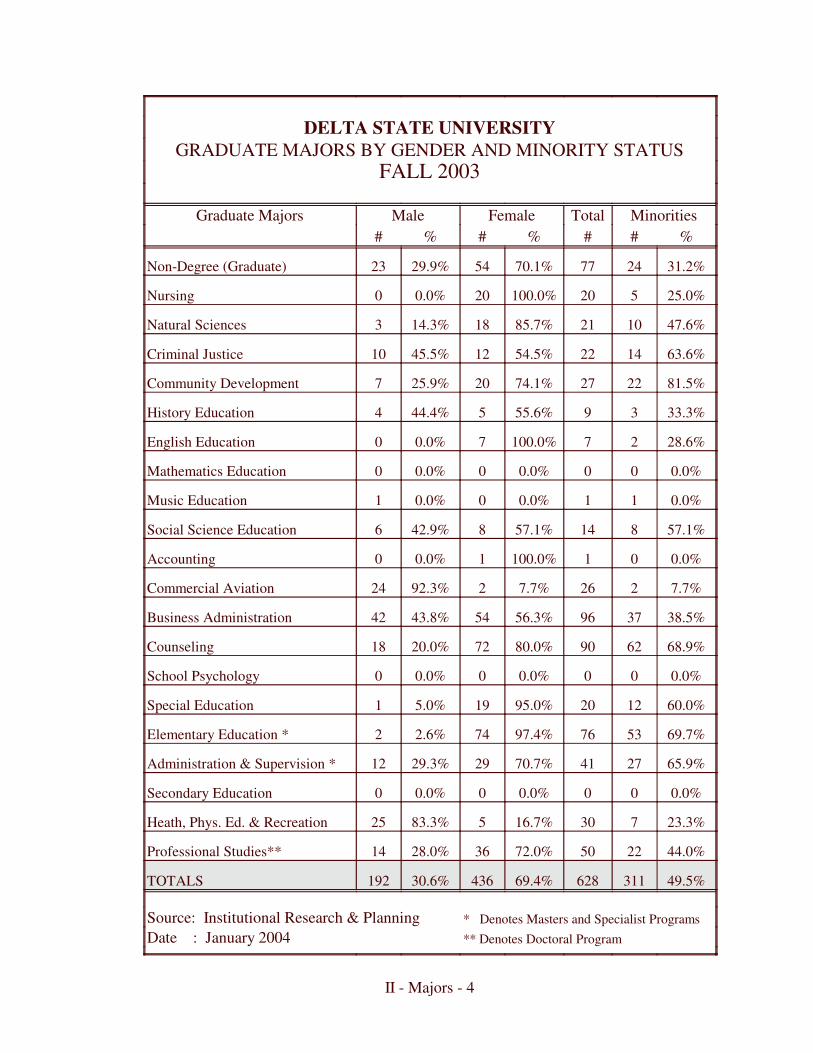
DELTA STATE UNIVERSITYGRADUATE MAJORS BY GENDER AND MINORITY STATUS
FALL 2003
MinoritiesTotalFemaleMaleGraduate Majors%##%#%#
31.2%247770.1%5429.9%23Non-Degree (Graduate)
25.0%520100.0%200.0%0Nursing
47.6%102185.7%1814.3%3Natural Sciences
63.6%142254.5%1245.5%10Criminal Justice
81.5%222774.1%2025.9%7Community Development
33.3%3955.6%544.4%4History Education
28.6%27100.0%70.0%0English Education
0.0%000.0%00.0%0Mathematics Education
0.0%110.0%00.0%1Music Education
57.1%81457.1%842.9%6Social Science Education
0.0%01100.0%10.0%0Accounting
7.7%2267.7%292.3%24Commercial Aviation
38.5%379656.3%5443.8%42Business Administration
68.9%629080.0%7220.0%18Counseling
0.0%000.0%00.0%0School Psychology
60.0%122095.0%195.0%1Special Education
69.7%537697.4%742.6%2Elementary Education *
65.9%274170.7%2929.3%12Administration & Supervision *
0.0%000.0%00.0%0Secondary Education
23.3%73016.7%583.3%25Heath, Phys. Ed. & Recreation
44.0%225072.0%3628.0%14Professional Studies**
49.5%31162869.4%43630.6%192TOTALS
* Denotes Masters and Specialist ProgramsSource: Institutional Research & Planning** Denotes Doctoral ProgramDate : January 2004
II - Majors - 4


DELTA STATE UNIVERSITYRETENTION OF FIRST-TIME ENTERING FRESHMEN BY ACT SCORE CATEGORY
FOR 1997-98 FRESHMAN CLASS
ACT 16-18ACT 19-21ACT 22-27ACT 28-36Fall SemesterFall SemesterFall SemesterFall SemesterYear *
Deg.% ofCumm.Deg.% ofCumm.Deg.% ofCumm.Deg.% ofCumm.Awd.Orig.GPAEnr.Awd.Orig.GPAEnr.Awd.Orig.GPAEnr.Awd.Orig.GPAEnr.
16415812514FY 97-98066.5%2.42109074.7%2.78118084.8%3.14106092.9%3.4713FY 98-99657.3%2.5394263.3%2.85100673.6%3.1792085.7%3.5112FY 99-00
2644.5%2.60733454.4%2.89864259.2%3.2474864.3%3.659FY 00-012729.3%2.58483334.8%2.80552928.0%3.1635128.6%3.574FY 01-02716.5%2.6727610.8%2.8817112.8%3.13160.0%0.000FY 02-03
6675789Total Degrees40.2%47.5%62.4%64.3%Percentage
TOTALACT Not AvailableACT 15 and BelowFall SemesterFall SemesterFall SemesterYear *
Deg.% ofCumm.Deg.% ofCumm.Degrees Awd.% of Orig.Cumm. GPAEnrolledAwd.Orig.GPAEnr.Awd.Orig.GPAEnr.
500138FY 97-98174.8%2.783741100.0%3.181071.1%2.4327FY 98-99
1465.0%2.8432500.0%0.000071.1%2.4327FY 99-0012053.2%2.9126600.0%0.0001063.2%2.6724FY 00-019931.2%2.8215600.0%0.000936.8%2.6314FY 01-021713.0%2.856500.0%0.000313.2%2.925FY 02-03251122Total Degrees
50.2%100.0%57.9%Percentage
* FY 2003-04 data unavailable as of publication dateSource: Office of Research & Planning, IHLDate : August 2003

DELTA STATE UNIVERSITYRETENTION OF FIRST-TIME ENTERING FRESHMEN
(ALL FIRST-TIME FRESHMEN)FALL 1997 - 2003
2003200220012000199919981997YEAR ENTERED%#%#%#%#%#%#%#Retention & Graduation Rates
100%330100%358100%430100%471100%465100%433100%504All first-time entering freshmen
20.420.220.419.719.720.119.8Average ACT Score
71%25368%29470%33168%31476%32774%3752nd Year - Returned
57%24361%28759%27356%24266%3313rd Year - Returned
1%31%52%73%15Degrees thru 3 years58%27255%25553%22853%2694th Year - Returned
23%10823%9927%134Degrees thru 4 years35%16530%12931%1585th Year - Returned
41%17747%237Degrees thru 5 years16%7113%686th Year - Returned
51%255Degrees thru 6 years
8%417th Year - Returned
Source: Office of Institutional Research & PlanningDate : January 2004

DELTA STATE UNIVERSITYRETENTION OF FIRST-TIME ENTERING FRESHMEN
(WHITE FIRST-TIME FRESHMEN)FALL 1997 - 2003
2003200220012000199919981997YEAR ENTERED%#%#%#%#%#%#%#Retention & Graduation Rates
100%200100%252100%308100%331100%341100%301100%365White first-time entering freshmen
21.221.121.220.420.421.120.4Average ACT Score
75%18869%21374%24466%22677%23176%2762nd Year - Returned
59%18263%20758%19855%16665%2383rd Year - Returned
1%31%52%63%10Degrees thru 3 years59%19454%18451%15456%2054th Year - Returned
24%8325%7528%101Degrees thru 4 years36%12327%8034%1235th Year - Returned
44%13247%173Degrees thru 5 years12%3612%456th Year - Returned
54%198Degrees thru 6 years
6%217th Year - Returned
Source: Office of Institutional Research & PlanningDate : January 2004

DELTA STATE UNIVERSITYRETENTION OF FIRST-TIME ENTERING FRESHMEN
(BLACK FIRST-TIME FRESHMEN)FALL 1997 - 2003
2003200220012000199919981997YEAR ENTERED%#%#%#%#%#%#%#Retention & Graduation Rates
100%116100%104100%119100%128100%123100%123100%131Black first-time entering freshmen
18.218.118.418.017.817.518.0Average ACT Score
61%6366%7866%8571%8772%8971%932nd Year - Returned
49%5861%7860%7458%7169%903rd Year - Returned
0%00%01%13%4Degrees thru 3 years59%7658%7158%7147%624th Year - Returned
20%2520%2424%31Degrees thru 4 years34%4237%4526%345th Year - Returned
40%4940%52Degrees thru 5 years28%3517%226th Year - Returned
43%56Degrees thru 6 years
15%197th Year - Returned
Source: Office of Institutional Research & PlanningDate : January 2004


DELTA STATE UNIVERSITYON AND OFF-CAMPUS STUDENT CREDIT HOURS SUMMARY BY SEMESTER
2003-04
TOTAL Spring 2004Fall 2003Summer 2003SEMESTER%#%#%#%#
100.0%96,472100.0%41,360100.0%44,018100.0%11,094UNIVERSITY TOTAL
45.8%44,23046.2%19,09847.4%20,85738.5%4,275ARTS & SCIENCES
9.1%4,0339.3%1,7779.2%1,9237.8%333Art
3.1%1,3563.4%6453.0%6361.8%75Audiology/Speech Path.
11.2%4,94011.6%2,22010.7%2,22411.6%496Biological Sciences
7.6%3,3607.5%1,4377.4%1,5488.8%375History
23.6%10,44622.8%4,36124.3%5,06223.9%1,023Languages, Lit. & Phil.
9.7%4,2999.4%1,79810.0%2,0939.5%408Mathematics
5.0%2,2155.3%1,0105.6%1,1670.9%38Music
9.3%4,1008.1%1,5409.8%2,03412.3%526Physical Sciences
16.8%7,41217.0%3,25516.1%3,36618.5%791Social Sciences
4.7%2,0695.5%1,0553.9%8044.9%210Social Work
24.5%23,67724.3%10,04024.6%10,82225.4%2,815BUSINESS
41.0%9,70343.2%4,33841.4%4,48231.4%883Accounting & CIS*
9.9%2,34910.9%1,09710.2%1,1085.1%144Commercial Aviation
1.7%3930.0%-0.0%-14.0%393Economics & Finance*
44.0%10,41042.7%4,28745.1%4,88444.0%1,239Mgt., Mkt., OAD, & BED*
0.9%2130.5%511.1%1201.5%42Executive BBA
2.6%6092.7%2672.1%2284.0%114Executive MBA
27.7%26,67927.1%11,19926.3%11,58035.2%3,900EDUCATION
22.5%5,99322.7%2,54121.5%2,49224.6%960Behavioral Sciences**
41.2%10,98738.3%4,28741.3%4,77749.3%1,923C & I, Leader., & Res.
25.4%6,77626.5%2,96426.6%3,07818.8%734H P E & R
10.2%2,73412.6%1,40710.6%1,2332.4%94Family & Consumer Sci.
0.7%1890.0%-0.0%-4.8%189Psychology**
2.0%1,8862.5%1,0231.7%7590.9%104NURSING
100.0%1,886100.0%1,023100.0%759100.0%104Nursing
Note: Departments are reported as % of Colleges/School.Source: Institutional Research and Planning Colleges/School are reported as a % of the University Total.Date : July 2004 * Economics combined with Mgt, Mkt, OAD and BED in Summer 2003. Finance and IRR combined with Accounting and CIS in Summer 2003. ** Psychology combined with Behavioral Sciences in Summer 2003.
II - Credit Hours - 2

DELTA STATE UNIVERSITYON-CAMPUS STUDENT CREDIT HOURS SUMMARY BY SEMESTER
2003-04
TOTAL Spring 2004Fall 2003Summer 2003SEMESTER%#%#%#%#
100.0%93,086100.0%40,264100.0%42,562100.0%10,260UNIVERSITY TOTAL
46.7%43,47146.8%18,83648.3%20,55839.7%4,077ARTS & SCIENCES
9.3%4,0339.4%1,7779.4%1,9238.2%333Art
3.1%1,3563.4%6453.1%6361.8%75Audiology/Speech Path.
11.4%4,94011.8%2,22010.8%2,22412.2%496Biological Sciences
7.5%3,2617.4%1,4017.3%1,4949.0%366History
23.6%10,25722.8%4,29824.0%4,93625.1%1,023Languages, Lit. & Phil.
9.7%4,2219.4%1,76510.2%2,0938.9%363Mathematics
5.1%2,2155.4%1,0105.7%1,1670.9%38Music
9.2%3,9837.8%1,4769.7%2,00212.4%505Physical Sciences
16.4%7,13616.9%3,18915.9%3,27916.4%668Social Sciences
4.8%2,0695.6%1,0553.9%8045.2%210Social Work
24.0%22,30024.1%9,68623.7%10,07524.7%2,539BUSINESS
42.7%9,52344.7%4,32942.8%4,31134.8%883Accounting & CIS*
10.5%2,34911.3%1,09711.0%1,1085.7%144Commercial Aviation
1.8%3930.0%-0.0%-15.5%393Economics & Finance*
45.0%10,03544.0%4,26046.2%4,65644.1%1,119Mgt., Mkt., OAD, & BED*
27.7%25,74827.1%10,91426.5%11,29434.5%3,540EDUCATION
22.6%5,83122.1%2,40921.8%2,46227.1%960Behavioral Sciences**
40.9%10,53937.9%4,13440.7%4,59651.1%1,809C & I, Leader., & Res.
25.1%6,45527.2%2,96426.6%3,00313.8%488H P E & R
10.6%2,73412.9%1,40710.9%1,2332.7%94Family & Consumer Sci.
0.7%1890.0%-0.0%-5.3%189Psychology**
1.7%1,5672.1%8281.5%6351.0%104NURSING
100.0%1,567100.0%828100.0%635100.0%104Nursing
Note: Departments are reported as % of Colleges/School.Source: Institutional Research and Planning Colleges/School are reported as a % of the University Total.Date : July 2004 * Economics combined with Mgt, Mkt, OAD and BED in Summer 2003. Finance and IRR combined with Accounting and CIS in Summer 2003. ** Psychology combined with Behavioral Sciences in Summer 2003.
II - Credit Hours - 3
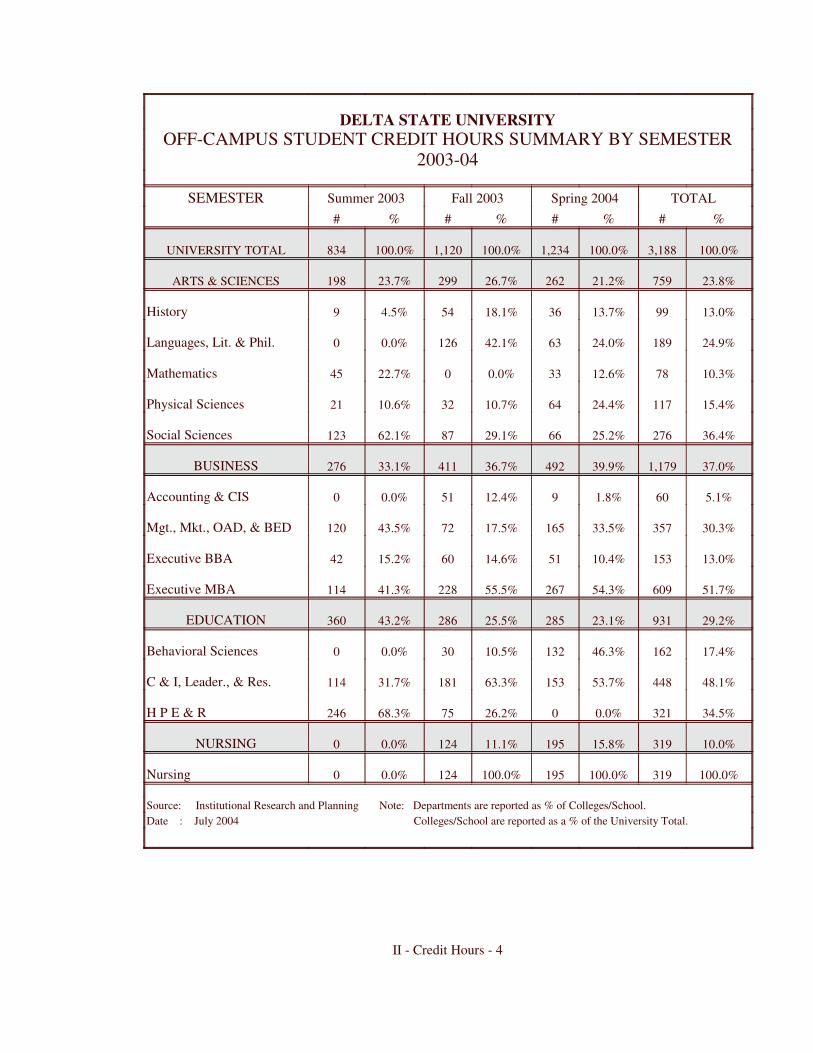
DELTA STATE UNIVERSITYOFF-CAMPUS STUDENT CREDIT HOURS SUMMARY BY SEMESTER
2003-04
TOTAL Spring 2004Fall 2003Summer 2003SEMESTER%#%#%#%#
100.0%3,188100.0%1,234100.0%1,120100.0%834UNIVERSITY TOTAL
23.8%75921.2%26226.7%29923.7%198ARTS & SCIENCES
13.0%9913.7%3618.1%544.5%9History
24.9%18924.0%6342.1%1260.0%0Languages, Lit. & Phil.
10.3%7812.6%330.0%022.7%45Mathematics
15.4%11724.4%6410.7%3210.6%21Physical Sciences
36.4%27625.2%6629.1%8762.1%123Social Sciences
37.0%1,17939.9%49236.7%41133.1%276BUSINESS
5.1%601.8%912.4%510.0%0Accounting & CIS
30.3%35733.5%16517.5%7243.5%120Mgt., Mkt., OAD, & BED
13.0%15310.4%5114.6%6015.2%42Executive BBA
51.7%60954.3%26755.5%22841.3%114Executive MBA
29.2%93123.1%28525.5%28643.2%360EDUCATION
17.4%16246.3%13210.5%300.0%0Behavioral Sciences
48.1%44853.7%15363.3%18131.7%114C & I, Leader., & Res.
34.5%3210.0%026.2%7568.3%246H P E & R
10.0%31915.8%19511.1%1240.0%0NURSING
100.0%319100.0%195100.0%1240.0%0Nursing
Note: Departments are reported as % of Colleges/School.Source: Institutional Research and Planning Colleges/School are reported as a % of the University Total.Date : July 2004
II - Credit Hours - 4

DELTA STATE UNIVERSITYON-CAMPUS STUDENT CREDIT HOURS SUMMARY BY LEVEL
TWO-YEAR COMPARISON
Fall 2003Fall 2002LEVELTotalGrad.UpperLowerTotalGrad.UpperLower42,5623,79319,60019,16945,1664,02820,62120,517UNIVERSITY TOTAL
20,5586357,11712,80621,4896947,16213,633ARTS & SCIENCES
0000250232Aerospace Studies
1,92369489691,98199491,023Art
636057363534049242Audiology/Speech Path.
2,224677661,3912,146767861,284Biological Sciences
1,494571891,2481,641481141,479History
4,936421,1193,7755,277601,1544,063Languages, Lit. & Phil.
2,09302551,8382,32102822,039Mathematics
1,16734666981,2453462780Music
2,002524221,5281,957634491,445Physical Sciences
3,2794081,7731,0983,4624351,7941,233Social Sciences
80406061989000657243Social Work
10,0758225,8003,45312,1341,4456,6903,999BUSINESS
4,3112162,6461,4493,8321382,0771,617Accounting & CIS
1,1081685054351,465195694576Commercial Aviation
----2,9252841,3901,251Economics & Finance*
4,6564382,6491,5693,5615372,469555Mgt., Mkt., OAD, & BED----600600Executive BBA**----29129100Executive MBA**
11,2942,1266,2582,91010,8911,7426,2642,885EDUCATION
2,4626527421,0681,595531950114Behavioral Sciences
4,5961,3003,1191773,7601,0732,540147C & I, Leader., & Res.
3,0031741,4851,3442,9331321,3981,403H P E & R
1,23309123211,0520806246Family & Consumer Sci.
----1,5516570975Psychology***
63521042506521475050NURSING
63521042506521475050Nursing
* Economics combined with Mgt, Mkt, OAD and BED in Summer 2003. Source: IHL Statistical Report Finance and IRR combined with Accounting and CIS in Summer 2003.Date : February 2004 ** Executive courses were taught on campus thru the Spring 2003
semester. Beginning in the Summer of 2003, these courses
relocated to the Greenville campus and are reported as off-campus.
*** Psycholgy combined with Behavioral Sciences in Summer 2003.
II - Credit Hours - 5

DELTA STATE UNIVERSITYON-CAMPUS STUDENT CREDIT HOURS SUMMARY BY DISCIPLINE
FALL 2003
TOTAL GRADUATE UPPER LOWERLEVEL%#%#%#%#
100.0%425628.9%379346.1%1960045.0%19169University Total
48.3%205583.1%63534.6%711762.3%12806Arts & Sciences1.1%2331.3%320.6%4878.1%182AMU0.0%00.0%00.0%00.0%0ANT9.4%19230.3%649.3%94850.4%969ART0.0%00.0%00.0%00.0%0ASP3.1%6360.0%090.1%5739.9%63AUP10.8%22243.0%6734.4%76662.5%1391BIO4.9%10154.8%4935.4%35959.8%607CHE0.7%153100.0%1530.0%00.0%0COD3.8%77719.7%15380.3%6240.0%0CRJ16.1%33170.9%3026.3%87172.8%2416ENG0.5%1050.0%014.3%1585.7%90FRE0.1%270.0%90.0%180.0%0GBK3.4%6903.0%2153.9%37243.0%297GEO0.3%660.0%04.5%395.5%63GER0.1%300.0%0100.0%300.0%0GIS1.4%2850.0%00.0%0100.0%285GST7.3%14943.8%5712.7%18983.5%1248HIS0.0%00.0%00.0%00.0%0HON0.6%1170.0%051.3%6048.7%57JOU0.0%00.0%00.0%00.0%0LEN10.2%20930.0%012.2%25587.8%1838MAT4.5%9340.0%044.8%41855.2%516MUS1.1%2281.3%347.4%10851.3%117PHI4.7%9570.3%33.4%3396.2%921PHY0.3%690.0%00.0%690.0%0PLS2.3%4740.6%343.7%20755.7%264PSC4.7%9756.5%6338.5%37555.1%537SOC1.1%2280.0%011.8%2788.2%201SPA2.7%5630.0%03.0%1797.0%546SPE0.7%14110.6%1589.4%1260.0%0SSC3.9%8040.0%075.4%60624.6%198SWO0.0%00.0%00.0%00.0%0WLF 0
Source: IHL Statistical ReportPage 1 of 2Date : February 2004
II - Credit Hours - 6

DELTA STATE UNIVERSITYON-CAMPUS STUDENT CREDIT HOURS SUMMARY BY DISCIPLINE
FALL 2003
TOTAL GRADUATE UPPER LOWERLEVEL%#%#%#%#
23.7%100758.2%82257.6%580034.3%3453BUSINESS11.3%11409.5%10849.5%56441.1%468ACC0.0%30.0%0100.0%30.0%0BED11.0%11080.0%1680.0%5050.0%435CAV20.5%20642.0%4250.4%104147.5%981CIS9.5%9603.8%3618.4%17777.8%747ECO6.3%6398.0%5192.0%5880.0%0FIN3.5%3480.0%02.6%997.4%339GBA4.6%4683.2%1596.8%4530.0%0IRR0.0%00.0%00.0%00.0%0MBA17.7%178810.4%18678.4%140111.2%201MGT10.8%109219.8%21680.2%8760.0%0MKT4.6%4650.0%039.4%18360.6%282OAD
54.9%1129418.8%212655.4%625825.8%2910EDUCATION2.1%234100.0%2340.0%00.0%0AED5.8%65579.4%5200.0%020.6%135CED17.3%195416.9%33083.1%16240.0%0CEL0.9%999.1%990.9%900.0%0CML2.4%2730.0%035.2%9664.8%177CRD0.5%540.0%0100.0%540.0%0CSD6.4%72517.0%12383.0%6020.0%0CSP7.9%89326.9%24073.1%6530.0%0CUR1.2%130100.0%1300.0%00.0%0EDL1.9%210100.0%2100.0%00.0%0ELR3.6%41131.4%12968.6%2820.0%0EPY10.9%12330.0%074.0%91226.0%321FCS5.4%6139.8%6022.5%13867.7%415HSE21.2%23904.8%11456.4%134738.9%929PER12.4%13960.2%333.0%46066.8%933PSY0.2%240.0%240.0%00.0%0SUP3.1%63533.1%21066.9%4250.0%0NURSING
100.0%63533.1%21066.9%4250.0%0NUR
Page 2 of 2Source: IHL Statistical ReportDate : February 2004
II - Credit Hours - 7

DELTA STATE UNIVERSITYON-CAMPUS STUDENT CREDIT HOURS SUMMARY BY LEVEL
TWO-YEAR COMPARISON
Fall 2003Fall 2002LEVELTotalGrad.UpperLowerTotalGrad.UpperLower42,5623,79319,60019,16945,1664,02820,62120,517UNIVERSITY TOTAL
20,5586357,11712,80621,4896947,16213,633ARTS & SCIENCES
0000250232Aerospace Studies
1,92369489691,98199491,023Art
636057363534049242Audiology/Speech Path.
2,224677661,3912,146767861,284Biological Sciences
1,494571891,2481,641481141,479History
4,936421,1193,7755,277601,1544,063Languages, Lit. & Phil.
2,09302551,8382,32102822,039Mathematics
1,16734666981,2453462780Music
2,002524221,5281,957634491,445Physical Sciences
3,2794081,7731,0983,4624351,7941,233Social Sciences
80406061989000657243Social Work
10,0758225,8003,45312,1341,4456,6903,999BUSINESS
4,3112162,6461,4493,8321382,0771,617Accounting & CIS
1,1081685054351,465195694576Commercial Aviation
----2,9252841,3901,251Economics & Finance*
4,6564382,6491,5693,5615372,469555Mgt., Mkt., OAD, & BED----600600Executive BBA**----29129100Executive MBA**
11,2942,1266,2582,91010,8911,7426,2642,885EDUCATION
2,4626527421,0681,595531950114Behavioral Sciences
4,5961,3003,1191773,7601,0732,540147C & I, Leader., & Res.
3,0031741,4851,3442,9331321,3981,403H P E & R
1,23309123211,0520806246Family & Consumer Sci.
----1,5516570975Psychology***
63521042506521475050NURSING
63521042506521475050Nursing
* Economics combined with Mgt, Mkt, OAD and BED in Summer 2003. Source: IHL Statistical Report Finance and IRR combined with Accounting and CIS in Summer 2003.Date : February 2004 ** Executive courses were taught on campus thru the Spring 2003
semester. Beginning in the Summer of 2003, these courses
relocated to the Greenville campus and are reported as off-campus.
*** Psycholgy combined with Behavioral Sciences in Summer 2003.
II - Credit Hours -8

DELTA STATE UNIVERSITYON-CAMPUS STUDENT CREDIT HOURS SUMMARY BY COLLEGE/SCHOOL & DEPARTMENT
5-YEAR TREND
5-Yr. Change20042003200220012000FALL%#%#%#%#%#%#SEMESTER
-4%-1990100%43469100%42562100%45166100%45549100%45459UNIVERSITY TOTAL
-2%-47450.0%2174048.3%2055847.6%2148948.2%2195048.9%22214ARTS & SCIENCES
-100%-34-100%00.0%00.1%250.1%320.2%34Aerospace Studies
-24%-555-24%17859.4%19239.2%19819.4%205510.5%2340Art
118%450118%8313.1%6362.5%5342.1%4571.7%381Audiology/Speech Path.
-100%-2675-100%010.8%222410.0%214611.9%260612.0%2675Biological Sciences****
ERR4310ERR43100.0%00.0%00.0%00.0%0Biological & Phys Sci.****
-24%-453-24%14077.3%14947.6%16418.7%19088.4%1860History
-11%-602-11%500824.0%493624.6%527725.8%565325.3%5610Languages, Lit. & Phil.
-11%-275-11%219910.2%209310.8%232110.5%230811.1%2474Mathematics
0%00%40.0%00.0%00.0%00.0%0Military Science
12%14712%14255.7%11675.8%12456.2%13675.8%1278Music
-100%-1846-100%09.7%20029.1%19577.2%15738.3%1846Physical Sciences****
25%74025%375715.9%327916.1%346214.6%319613.6%3017Social Sciences
45%31545%10143.9%8044.2%9003.6%7953.1%699Social Work
-13%-138022.2%965923.7%1007526.9%1213425.1%1143024.3%11039BUSINESS
31%114631%478842.8%431131.6%383233.4%382234.6%3642Accounting & CIS*
-14%-151-14%95711.0%110812.1%146511.6%132312.0%1108Commercial Aviation
-100%******0%0.0%00.0%292525.8%294926.7%3054Economics & Finance*
39%109639%391446.2%465638.4%356127.1%309628.0%2818Mgt., Mkt., OAD, & BED*
-100%******-100%0.0%00.0%600.4%510.5%174Executive BBA**
0%--0.0%00.0%2911.7%1891.7%243Executive MBA**
1%6826.0%1129726.5%1129424.1%1089124.5%1114824.7%11229EDUCATION
-100%-17480.0%021.8%246214.6%159515.0%166715.6%1748Behavioral Sciences***
ERR345430.6%34540.0%00.0%00.0%00.0%0Counselor Ed & PSY ***
-8%-30431.2%352640.7%459634.5%376031.7%353834.1%3830C & I, Leader., & Res.
-10%-34226.3%297426.6%300326.9%293330.7%342529.5%3316H P E & R
77%58611.9%134310.9%12339.7%10529.5%10576.7%757Family & Consumer Sci.
--0.0%00.0%014.2%155113.1%146114.1%1578Psychology***
-21%-2041.8%7731.5%6351.4%6522.2%10212.1%977NURSING
-21%-204100.0%773100.0%635100.0%652100.0%1021100.0%977Nursing
Departments are reported as % of Colleges/School. Note:Source: IHL Statistical Report Colleges/School are reported as % of the University TotalDate : February 2004 * Economics combined with Mgt, Mkt, OAD and BED in Summer 2003.
Finance and IRR combined with Accounting and CIS in Summer 2003.
** Executive courses were taught on campus through the Spring 2003
semester. Beginning in the Summer of 2003, these courses
relocated to the Greenville campus and are reported as off-campus.
*** Psychology combined with Behavioral Sciences in Summer 2003. Biological and Physical Sciences combined in Summer 2003. ****
II - Credit Hours - 9

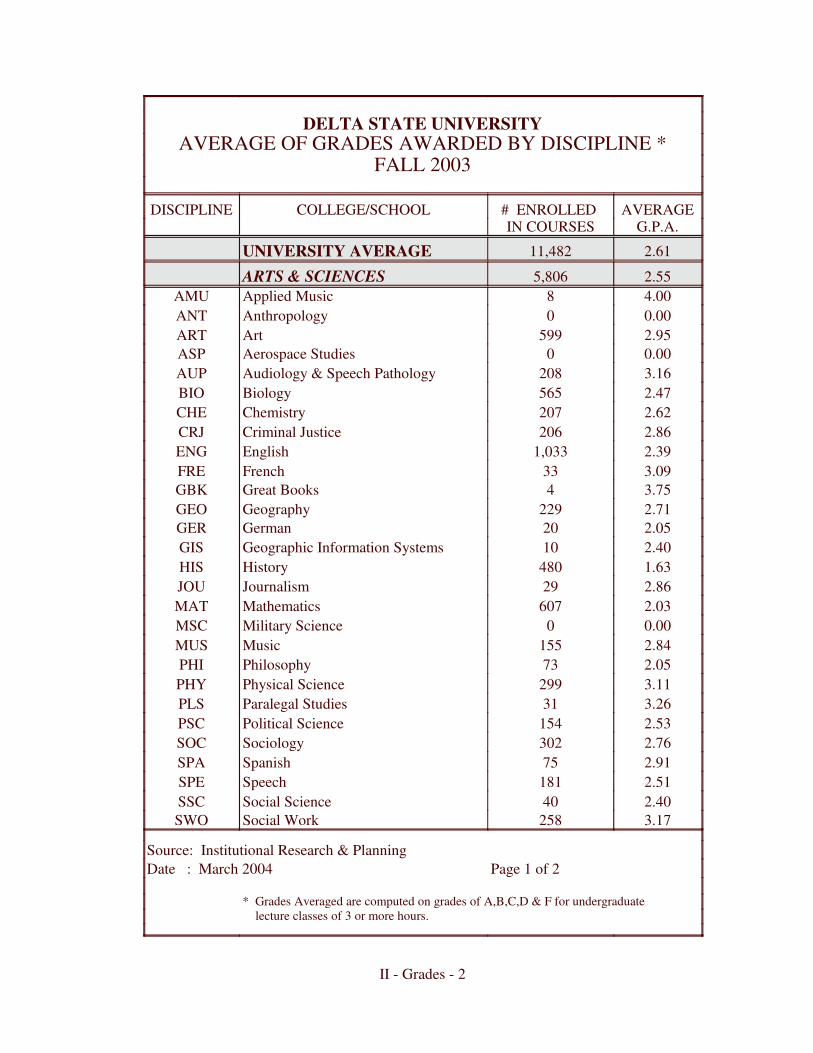
DELTA STATE UNIVERSITYAVERAGE OF GRADES AWARDED BY DISCIPLINE *
FALL 2003
AVERAGE# ENROLLED COLLEGE/SCHOOLDISCIPLINEG.P.A.IN COURSES
2.6111,482UNIVERSITY AVERAGE2.555,806ARTS & SCIENCES4.008Applied MusicAMU0.000AnthropologyANT2.95599ArtART0.000Aerospace StudiesASP3.16208Audiology & Speech PathologyAUP2.47565BiologyBIO2.62207ChemistryCHE2.86206Criminal JusticeCRJ2.391,033EnglishENG3.0933FrenchFRE3.754Great BooksGBK2.71229GeographyGEO2.0520GermanGER2.4010Geographic Information SystemsGIS1.63480HistoryHIS2.8629JournalismJOU2.03607MathematicsMAT0.000Military ScienceMSC2.84155MusicMUS2.0573PhilosophyPHI3.11299Physical SciencePHY3.2631Paralegal StudiesPLS2.53154Political SciencePSC2.76302SociologySOC2.9175SpanishSPA2.51181SpeechSPE2.4040Social ScienceSSC3.17258Social WorkSWO
Source: Institutional Research & PlanningPage 1 of 2Date : March 2004
* Grades Averaged are computed on grades of A,B,C,D & F for undergraduate lecture classes of 3 or more hours.
II - Grades - 2

DELTA STATE UNIVERSITYAVERAGE OF GRADES AWARDED BY DISCIPLINE *
FALL 2003
AVERAGE# ENROLLEDCOLLEGE/SCHOOLDISCIPLINEG.P.A.IN COURSES
2.443,319BUSINESS
2.12346AccountingACC
2.001Business EducationBED
2.92261Commercial AviationCAV
2.90670Computer Information SystemsCIS
2.24304EconomicsECO
2.94195FinanceFIN
2.71112General BusinessGBA
2.92150Insurance & Real EstateIRR
2.81553ManagementMGT
2.55291MarketingMKT
2.68136Office AdministrationOAD
2.982,256EDUCATION0.003CounselingCED2.78433Elementary Ed.CEL
2.9237Media-Library ScienceCML
2.2935Reading Ed.CRD
3.9418Secondary Ed.CSD
2.95194Special Ed.CSP
3.2798CurriculumCUR
2.9993Educational PsychologyEPY
3.22378Family and Consumer ScienceFCS
3.03164Health & Safety Ed.HSE
3.22336Physical Ed. & Rec.PER
2.76467PsychologyPSY
3.3188NURSING3.3188NursingNUR 3.00
Source: Institutional Research & PlanningPage 2 of 2Date : March 2004
II - Grades - 3

DELTA STATE UNIVERSITYAVERAGE OF GRADES AWARDED BY COURSE TYPE: ARTS & SCIENCES *
FALL 2003
Source: Institutional Research & Planning* Represents undergraduate classes only.Date : March 2004
0.00
1.00
2.00
3.00
4.00
AV
ER
AG
E G
RA
DE
AMUANT ART ASP AUP BIO CHE CRJ ENG FRE GBK GEO GER GIS HIS JOU MATMSC MUS PHI PHY PLS PSC SOC SPA SPE SSC
ARTS & SCIENCES
4.00
0.00
2.95
0.00
3.16
2.47
2.62
2.86
2.39
3.09
3.75
2.71
2.05
2.40
1.63
2.86
2.03
0.00
2.84
2.05
3.11
3.26
2.53
2.76
2.91
2.512.40

DELTA STATE UNIVERSITYAVERAGE OF GRADES AWARDED BY COURSE TYPE: BUSINESS *
FALL 2003
Source: Institutional Research & Planning* Represents undergraduate classes only.Date : March 2004
0.00
1.00
2.00
3.00
4.00
AV
ER
AG
E G
RA
DE
ACC BED CAV CIS ECO FIN GBA IRR MGT MKT OADBUSINESS
2.71
2.122.00
2.92 2.90
2.24
2.94
2.71
2.922.81
2.55

DELTA STATE UNIVERSITYAVERAGE OF GRADES AWARDED BY COURSE TYPE: EDUCATION *
FALL 2003
Source: Institutional Research & Planning* Represents undergraduate classes only.Date : March 2004
0.00
1.00
2.00
3.00
4.00
AV
ER
AG
E G
RA
DE
CED CEL CML CRD CSD CSP CUR EPY FCS HSE PER PSYEDUCATION
2.80
0.00
2.782.92
2.29
3.94
2.95
3.27
2.99
3.22
3.03
3.22


DELTA STATE UNIVERSITYINTERCOLLEGIATE ATHLETICS
2003-04
2003-04 RecordLast Title /TEAMSTiesLossesWinsChampionship
011542004 Division II National ChampionsBaseball . . . . . . . . . . . . . . . . . . . . . . . . . .2004 NCAA South Central
Region Champions2004 Gulf South Conference Champions
Basketball:017102003 -2nd - GSC West Division Men's . . . . . . . . . . . . . . . . . . . . . . . . .08232003 - 4th - GSC West Division Women's . . . . . . . . . . . . . . . . . . . . . . .
9th Place - GSCWomen's Cross-Country . . . . . . . . . . . . . 2nd Place - GSC TournamentGolf . . . . . . . . . . . . . . . . . . . . . . . . . . . . .
First Year/Club SportMen's and Women's Soccer . . . . . . . . . . .016362nd - GSC West DivisionWomen's Softball . . . . . . . . . . . . . . . . . . .
Tennis:06142003-3rd Place-GSC Tournament Men's . . . . . . . . . . . . . . . . . . . . . . . . . .06182003-4th Place-GSC Tournament Women's . . . . . . . . . . . . . . . . . . . . . . .
Swimming & Diving:2003 NSISC Champions Men's . . . . . . . . . . . . . . . . . . . . . . . . . .2003 NSISC Champions Women's . . . . . . . . . . . . . . . . . . . . . . .
0292000 GSC Tri-ChampionsFootball . . . . . . . . . . . . . . . . . . . . . . . . . . . .2000 NCAA Division II South
Region Champions2000 NCAA Division II
National Champions
Seating CapacityATHLETIC FACILITIES 8,000 Parker Field (Football) 4,000 Walter Sillers Coliseum (Basketball) 1,500 Ferriss Field (Baseball) 1,000 DSU Aquatics Center(Swimming, Diving) 500 DSU Softball Field (Softball)
100 DSU Soccer Field (Soccer)
GENERAL INFORMATIONDivision : National Collegiate Athletic Association (NCAA Division II)Conference: Gulf South ConferenceNickname : Statesmen, Lady StatesmenColors : Forest Green and White
Source: Office of Sports InformationDate : July 2004
II - Miscellaneous - 2

DELTA STATE UNIVERSITYFINANCIAL AID SUMMARY
2003-04Summer Spring Fall# of
200420042003TOTALStudents
$1,194,215$5,843,669$5,348,100$12,385,9845544STUDENT LOANS
$491,679$3,921,439$3,630,860$8,043,9783483Stafford
$334,020$1,613,618$1,416,917$3,364,5551729Unsubsidized Stafford
$82,283$198,492$195,210$475,985107PLUS
$286,233$96,120$93,113$475,466211Perkins
$0$14,000$12,000$26,00014CIOS
$191,718$2,196,694$2,293,876$9,466,3224627SCHOLARSHIPS
$40,968$1,858,746$1,972,967$3,872,6811429Pell Grant
$65,350$46,457$52,032$163,839270SEOG
$400$4,550$4,750$9,70016LEAP
$85,000$286,941$264,127$636,068412FWS
$1,173,129458Academic Scholarship
$953,248226Athletic Scholarship
$370,125144Music Scholarship
$867,795498Other Service
$92,45854Dependent Scholarship
$198,839191Foundation
$1,128,440929State Scholarships
Average AwardTotal / Year# of Students $7,281$23,880,7473280 Total Accepted All Types:$6,898$17,879,6492592 Total Title IV Accepted:
$5,200$3,655,594703 Total Inst. Sources Accepted:$1,884$1,217,064646 Total Outside Sources:
Note: Student figures are unduplicatedSource: Student Financial AssistanceDate : August 2004
II - Miscellaneous - 3


DELTA STATE UNIVERSITYDEGREES OFFERED
2003-04
BACHELOR'S DEGREESBACHELOR OF ARTSBA
BACHELOR OF BUSINESS ADMINISTRATIONBBA
BACHELOR OF COMMERCIAL AVIATIONBCA
BACHELOR OF FINE ARTSBFA
BACHELOR OF MUSICBM
BACHELOR OF MUSIC EDUCATIONBME
BACHELOR OF SCIENCEBS
BACHELOR OF SCIENCE IN CRIMINAL JUSTICEBSCJ
BACHELOR OF SCIENCE IN EDUCATIONBSE
BACHELOR OF SCIENCE IN GENERAL STUDIESBSGS
BACHELOR OF SCIENCE IN NURSINGBSN
BACHELOR OF SOCIAL WORKBSW
MASTER'S DEGREESMASTER OF BUSINESS ADMINISTRATIONMBA
MASTER OF COMMERCIAL AVIATIONMCA
MASTER OF EDUCATIONMED
MASTER OF MUSIC EDUCATIONMME
MASTER OF SCIENCEMS
MASTER OF SCIENCE IN NURSINGMSN
MASTER OF SCIENCES IN NATURAL SCIENCESMSNS
MASTER OF SOCIAL WORKMSW
SPECIALIST'S DEGREESEDUCATIONAL SPECIALISTEDS
DOCTORAL DEGREESDOCTOR OF EDUCATION EDD
Source: IHL Academic Program InventoryDate : July 2003
III - Degrees - 2

DELTA STATE UNIVERSITYACADEMIC PROGRAM INVENTORY
2003-04
ACCREDITING BODYDEGREESPROGRAMSCIPACBSPBBAAccounting52.0301
NASAD & NACATEBAArt50.0101NASADBFAArt50.0101
CAAHEPBSAthletic Training and Sports Medicine51.0913BSAudiology & Speech Pathology51.0204
BSGSAudiology & Speech Pathology51.0204CAABCAAviation Management49.0101
BSBiology26.0101NCATEBSEBiology Education13.1399ACBSPMBABusiness Administration52.0201NCATEBSEBusiness Education13.1303
ACS & NCATEBSChemistry40.0501MCACommercial Aviation49.0104MSCommunity Development44.0201
ACBSPBBAComputer Information Systems52.1201CACREP & NCATEMEDCounseling13.1101
BSCJCriminal Justice43.0104MSCriminal Justice43.0104
NCATEMEDEducational Administration & Supervision13.0401NCATEEDSEducational Administration & Supervision13.0401NCATEBSEElementary Education13.1202NCATEMEDElementary Education13.1202NCATEEDSElementary Education13.1202
BAEnglish23.0101NCATEBSEEnglish Education13.1305NCATEMEDEnglish Education13.1305
BSEnvironmental Sciences30.0101NCATE & AAFCSBSFamily and Consumer Science19.0101
AAFCSBSFashion Merchandising52.1902ACBSPBBAFinance52.0801
CAABCAFlight Operations49.0102ACBSPBBAGeneral Business52.0101NCATEBSEHealth, Physical Education & Recreation13.1314
Source: IHL Academic Program InventoryPage 1 of 2Date : July 2004
III - Degrees - 3

DELTA STATE UNIVERSITYACADEMIC PROGRAM INVENTORY
2003-04
ACCREDITING BODYDEGREESPROGRAMSCIPNCATEBSGSHealth, Physical Education & Recreation13.1314NCATEMEDHealth, Physical Education & Recreation13.1314
BAHistory54.0101BSGSHistory54.0101
NCATEMEDHistory Education13.1399ACBSPBBAHospitality Services Management52.0901ACBSPBBAInsurance & Real Estate52.1701
BAJournalism09.0401ACBSPBBAManagement52.0201ACBSPBBAMarketing52.1401
BSMathematics27.0101NCATEBSEMathematics Education13.1311NCATEMEDMathematics Education13.1311NCATEBAModern Foreign Languages16.0101NASMBAMusic50.0901NASMBMMusic50.0901
NASM & NCATEBMEMusic Education13.1312NASM & NCATEMMEMusic Education13.1312
NCATEMSNSNatural Sciences30.0101NLNAC & IHLBSNNursing51.1601NLNAC & IHLMSNNursing51.1699
ACBSPBBAOffice Administration52.0204BAPolitical Science45.1001
NCATEEDDProfessional Studies13.0101BAPsychology42.0101
NCATEEDSSecondary Education13.1205BSSocial Science45.0101
NCATEBSESocial Science Education13.1317NCATEMEDSocial Science Education13.1317CSWEBSWSocial Work44.0701CSWEMSWSocial Work44.0701
NCATEBSESpecial Education13.1001NCATEMEDSpecial Education13.1001
Source: IHL Academic Program InventoryPage 2 of 2Date : July 2004
III - Degrees - 4

DELTA STATE UNIVERSITYDEGREES AWARDED: BY TYPE OF DEGREE
5-YEAR TREND
5-YR Change2004*2003*2002*2001*2000Degrees%#%#%#%#%#%#
4%2374.1%62076.0%59677.5%63974.8%59878.2%597Bachelor's
29%107.1%447.4%449.4%606.4%385.7%34BA
8%1431.0%19232.2%19226.6%17027.1%16229.8%178BBA
18%44.2%264.0%241.9%123.7%223.7%22BCA
32%74.7%293.2%193.8%243.0%183.7%22BFA
0%20.3%20.0%00.3%20.0%00.0%0BM
-56%-101.3%82.2%131.3%82.7%163.0%18BME
63%4418.4%11416.6%9914.6%9316.1%9611.7%70BS
-7%-24.4%273.0%183.9%254.3%264.9%29BSCJ
1%117.3%10717.8%10618.8%12019.1%11417.8%106BSE
-33%-196.3%396.2%3711.4%739.2%559.7%58BSGS
-58%-141.6%104.7%284.9%314.8%294.0%24BSN
-39%-143.5%222.7%163.3%213.7%226.0%36BSW
21%3423.2%19421.7%17020.8%17123.3%18621.0%160Master's
93%2526.8%5224.1%4125.1%4320.4%3816.9%27MBA
120%65.7%115.9%101.8%31.6%33.1%5MCA
-100%-90.0%00.0%01.2%21.6%35.6%9MPA
13%1149.5%9649.4%8447.4%8152.2%9753.1%85MED
0%00.5%12.4%42.9%51.6%30.6%1MME
0%66.7%132.9%55.8%102.2%44.4%7MSCD
0%03.1%64.1%74.7%82.7%55.0%8MSCJ
-38%-32.6%54.1%75.8%1010.2%195.0%8MSN
0%05.2%107.1%125.3%97.5%146.3%10MSNS
325%132.0%172.2%171.3%111.8%140.5%4Specialist's
325%13100%17100%17100%11100%14100%4EDS
200%40.7%60.1%10.4%30.3%20.3%2Doctoral
200%4100%6100%1100%3100%2100%2EDD
10%74100%837100%784100%824100%800100%763TOTAL
* Total degrees awarded in December and MaySource: Office of the RegistrarDate : June 2004
III - Degrees - 5

DELTA STATE UNIVERSITYDEGREES CONFERRED BY CIP CATEGORY
5-YEAR TRENDYEARYEARYEARYEARYEAR2004*2003*2002*2001*2000DEGREES
620596639598597BACHELOR'S DEGREE--2631Marketing & Distribution**1231--Communications
151145179166139Education10113Foreign, Lang. & Lit./Letters282614199Home Economics8101257English, Lang. & Lit./Letters2928373823Bio. Sciences/Life Sciences12463Mathematics33814Multi/Interdisciplinary Studies--31----Parks, Rec., Leisure/Fitness Studies**111391217Physical Sciences1916221714Psychology2718252629Protective Services2216212236Public Admin. & Services2730392847Social Sciences & History2624122222Transportation & Materials3726342626Visual & Performing Arts3340424339Health Profession & Related Sci.
196192170162178Business Mgt. & Admin. Services
194170171187160MASTER'S DEGREE97888610086Education5710208Health Profession & Related Sci.101291410Multi/Interdisciplinary Studies67858Protective Services1351047Public Admin. & Services1110335Transportation & Materials5241454136Business Mgt. & Admin. Services
171711134SPECIALIST'S DEGREE171711134Education
61322DOCTORAL DEGREE61322Education
837784824800763GRAND TOTAL - ALL DEGREES
* Total degrees awarded in December and MaySource: IHL Statistical Report** In 2004, these CIPs changed to a differentDate : July 2003 category
III - Degrees - 6

DELTA STATE UNIVERSITYDEGREES AWARDED BY COLLEGE, SCHOOL AND DEPARTMENT
5-YEAR TREND
5-YR Change2004*2003*2002*2001*2000DEGREES%#%#%#%#%#%#
-8%-2431%26230%23835%28834%26438%286A&S48%1113%3411%2510%299%248%23Art
-415%524%617%525%64%1 BA
0%00%00%00%00%00%0 BSGS
32%785%2976%1983%2475%1896%22 BFA
33%58%205%124%115%145%15Aud. / Sp. Path.
-100%-30%00%00%00%020%3 BSGS
-8100%20100%12100%11100%1480%12 BS
20%614%3614%3317%4916%4210%30Biological Sci.
33%111%46%210%510%410%3 BSE
26%681%2985%2873%3688%3777%23 BS
-25%-18%39%316%82%113%4 BS-Env. Sci.
0%03%73%73%84%102%7History
150%371%543%375%650%529%2 BA
-100%-10%00%00%00%014%1 BSGS
-50%-229%257%425%250%557%4 MED
29%47%187%179%275%145%14Lang., Lit. & Phil.
0%056%1071%1259%1650%771%10 BA
-00%00%00%00%00%0 BSGS
25%128%512%230%829%429%4 BSE
ERR317%318%311%321%30%0 MED
0%03%73%72%65%122%7Mathematics
-67%-214%129%283%550%643%3 BS
100%386%657%417%150%643%3 BSE
0%00%00%00%00%00%0 BSGS
0%-10%014%10%00%014%1 MED
-45%-105%128%186%188%218%22Music
0%217%20%011%20%00%0 BM
-56%-1067%872%1344%876%1682%18 BME
-67%-28%16%117%310%214%3 BA
-08%122%428%514%35%1 MME
* Total degrees awarded in December and MaySource: Office of the RegistrarPage 1 of 3Date : June 2004
III - Degrees - 7

DELTA STATE UNIVERSITYDEGREES AWARDED BY COLLEGE, SCHOOL AND DEPARTMENT
5-YEAR TREND
5-YR Change2004*2003*2002*2001*2000DEGREES%#%#%#%#%#%#
A&S (CONT.)
0%04%105%123%95%143%10Natural Sci.
0%0100%10100%12100%9100%14100%10 MSNS
-35%-64%115%133%95%126%17Physical Sci.
0%00%00%00%00%00%0 BSE
-35%-6100%11100%13100%9100%12100%17 BS
-19%-2032%8533%7835%10130%7937%105Social Sci.
117%715%1317%1314%1415%126%6 BSE
0%05%48%68%83%24%4 BA
-1418%1513%103%35%41%1 BS
-7%-232%2723%1825%2533%2628%29 BSCJ
-92%-364%314%1122%2227%2137%39 BSGS
-64%-75%410%811%116%510%11 MED--15%136%510%105%47%7 MSCD--27%69%78%86%58%8 MSCJ
-39%-148%227%167%218%2213%36Social Work
-39%-14100%22100%16100%21100%22100%36 BSW
17%4134%28434%27028%23330%23333%243Business42%2935%9823%6223%5427%6628%69Acctg, Finance, & CIS**
63%38100%98100%6296%5295%6387%60 BBA
-100%-90%00%04%25%313%9 MPA
93%2518%5215%4118%4318%3811%27Bus. Admin.
93%25100%52100%41100%43100%38100%27 MBA
37%1013%3713%346%1515%2511%27Comm. Avia.
18%470%2671%2480%1288%2281%22 BCA-630%1129%1020%312%319%5 MCA
----------0%0CIS & OAD
------------ BBA
------------ BSE
-100%-560%-21%5722%5124%5723%56ECO & FIN**
-100%-560%-100%57100%51100%57100%56 BBA
52%3334%9728%7630%7033%4731%64Mgt., Mkt., Bus. Admin**
52%3297%9496%7396%6789%4297%62 BBA--3%34%34%311%5-2 BSE
* Total degrees awarded in December and MaySource: Office of the Registrar** In July 2003, Economics combined with MgtPage 2 of 3Date : June 2004 and Mkt; and, Finance combined with Acc, CIS & IRR
III - Degrees - 8

DELTA STATE UNIVERSITYDEGREES AWARDED BY COLLEGE, SCHOOL AND DEPARTMENT
5-YEAR TREND
5-YR Change2004*2003*2002*2001*2000DEGREES%#%#%#%#%#%#
48%9033%27631%24132%26230%23625%186Education
87%2016%4310%239%2316%3712%23Counselor Ed & Psychology**
0%1944%190%00%00%00%0 BA
-40%-27%330%722%530%1122%5 BSE
40%649%2170%1678%1870%2665%15 MED
0%-30%00%00%00%013%3 EDS
16%1949%13647%11445%11753%12463%117Curriculum & Instr.
-14%-1148%6559%6763%7457%7165%76 BSE
26%1035%4825%2925%2930%3732%38 MED
1600%1613%1715%179%1111%141%1 EDS
200%44%61%13%32%22%2 EDD
195%4324%6525%6031%8015%3612%22Health PE & Rec.0%35%35%31%10--- BS
14%112%813%813%106%232%7 BSE
140%2155%3643%2664%5194%3468%15 BSGS
13%228%1838%2323%1858%2173%16 MED
220%2212%3212%288%209%225%10Family & Cons. Sci.
300%313%47%230%614%310%1 BS-Fshn. Mds.
211%1988%2893%2670%1486%1990%9 BS-Fam. & Con. Sci.
-100%-140%-7%168%227%178%14Psychology **
-100%-140%-100%16100%22100%17100%14 BA
-53%-172%154%355%416%484%32Nursing
-53%-17100%15100%35100%41100%48100%32Nursing
-58%-1467%1080%2876%3160%2975%24 BSN
0%00%50%70%100%190%8 MSN
12%90100%837100%784100%824100%781100%747Univ. Total
* Total degrees awarded in December and MaySource: Office of the Registrar** In July 2003, Psychology combined withPage 3 of 3Date : June 2004 Counseling
III - Degrees - 9

DELTA STATE UNIVERSITYDEGREES AWARDED BY UNDERGRADUATE MAJORS
2003-04
%#DEGREES%#DEGREES
36%221BUSINESS36%223ARTS & SCIENCES
8%18Accounting (2)15%33Art (1)
4%9Aviation Management0%1Art Education
1%3Business Education 9%20Audiology & Speech Path.
26%57Comp. Info. Systems13%29Biology (1)
3%6Finance (1)2%4Biology Education
8%17Flight Operations 5%11Chemistry
18%40General Business (14)0%0Chemistry Education
8%17Insurance and Real Estate 12%27Criminal Justice
11%24Management4%8English
12%26Marketing 2%5English Education
2%4Office Administration (1)1%3Environmental Science
27%166EDUCATION2%5History
2%3Athletic Training0%1Journalism
39%65Elementary Education0%1Mathematics
17%28Family & Consumer Sciences3%6Mathematics Education
2%4Fashion Merchandising0%0Medical Technology
27%44Health, PE & Recreation0%1Modern Foreign Languages
11%19Psychology (1)1%3Music
2%3Special Education4%8Music Education
2%10NURSING2%4Political Science (1)
100%10Nursing8%18Social Science
6%13Social Science Education
100%620UNIVERSITY TOTALS10%22Social Work
0%0Sociology
Source: Office of the Registrar( ) Denotes the number of additional 2nd majorsDate : June 2004
III - Degrees - 10

DELTA STATE UNIVERSITYDEGREES AWARDED BY UNDERGRADUATE MAJORS
DECEMBER 2003
%#DEGREES%#DEGREES
38%107BUSINESS34%94ARTS & SCIENCES
7%7Accounting (1)23%22Art (1)
3%3Aviation Management1%1Art Education
1%1Business Education 7%7Audiology & Speech Path.
26%28Comp. Info. Systems 12%11Biology
3%3Finance (1)3%3Biology Education
7%8Flight Operations 4%4Chemistry
16%17General Business (8)0%0Chemistry Education
10%11Insurance and Real Estate16%15Criminal Justice
14%15Management2%2English
10%11Marketing 3%3English Education
3%3Office Administration 1%1Environmental Science
28%77EDUCATION0%0History
3%2Athletic Training0%0Journalism
38%29Elementary Education1%1Mathematics
17%13Family & Consumer Sciences3%3Mathematics Education
4%3Fashion Merchandising0%0Medical Technology
27%21Health, PE & Recreation0%0Modern Foreign Languages
10%8Psychology 2%2Music
1%1Special Education3%3Music Education
0%0NURSING1%1Political Science
0%0Nursing10%9Social Science
5%5Social Science Education
100%278UNIVERSITY TOTALS1%1Social Work
0%0Sociology
Source: Office of the Registrar( ) Denotes the number of additional 2nd majorsDate : January 2004
III - Degrees - 11
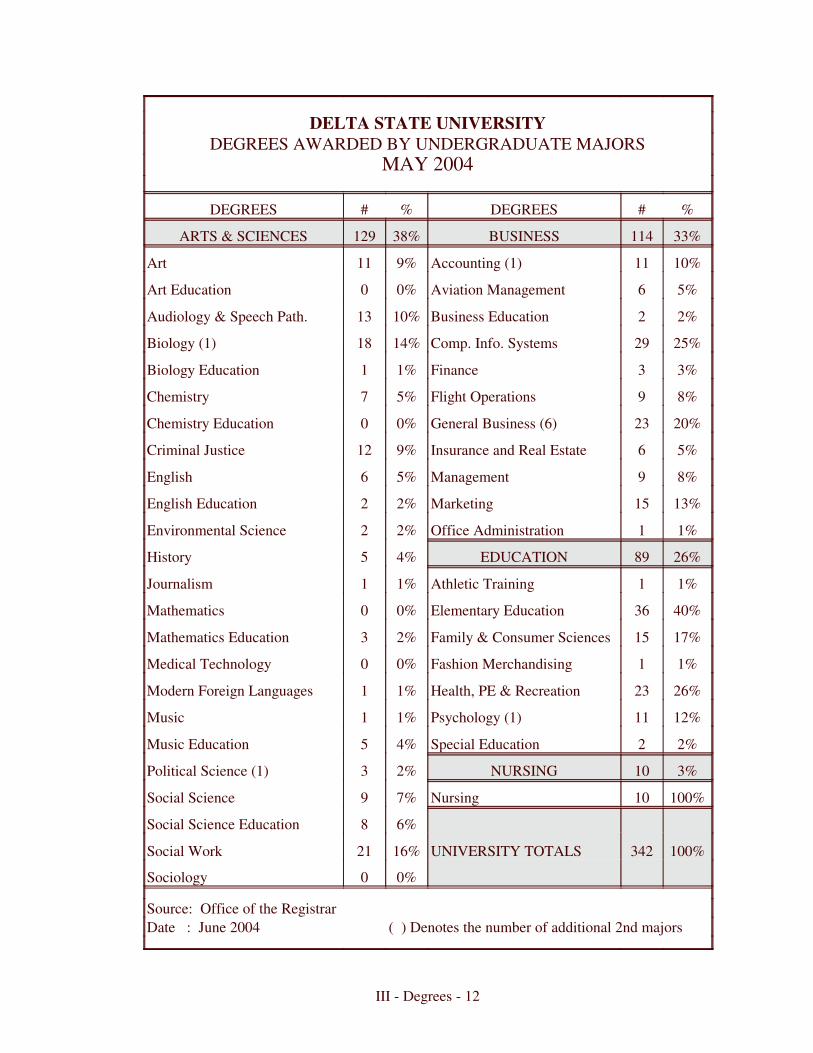
DELTA STATE UNIVERSITYDEGREES AWARDED BY UNDERGRADUATE MAJORS
MAY 2004
%#DEGREES%#DEGREES
33%114BUSINESS38%129ARTS & SCIENCES
10%11Accounting (1)9%11Art
5%6Aviation Management0%0Art Education
2%2Business Education 10%13Audiology & Speech Path.
25%29Comp. Info. Systems 14%18Biology (1)
3%3Finance 1%1Biology Education
8%9Flight Operations 5%7Chemistry
20%23General Business (6)0%0Chemistry Education
5%6Insurance and Real Estate 9%12Criminal Justice
8%9Management 5%6English
13%15Marketing 2%2English Education
1%1Office Administration 2%2Environmental Science
26%89EDUCATION4%5History
1%1Athletic Training1%1Journalism
40%36Elementary Education0%0Mathematics
17%15Family & Consumer Sciences2%3Mathematics Education
1%1Fashion Merchandising0%0Medical Technology
26%23Health, PE & Recreation1%1Modern Foreign Languages
12%11Psychology (1)1%1Music
2%2Special Education4%5Music Education
3%10NURSING2%3Political Science (1)
100%10Nursing7%9Social Science
6%8Social Science Education
100%342UNIVERSITY TOTALS16%21Social Work
0%0Sociology
Source: Office of the Registrar( ) Denotes the number of additional 2nd majorsDate : June 2004
III - Degrees - 12

DELTA STATE UNIVERSITYDEGREES AWARDED BY GRADUATE MAJORS
2003-04
%#DEGREES%#DEGREES
29%63BUSINESS12%26ARTS & SCIENCES
0%0Accounting23%6Criminal Justice
83%52Business Administration12%3English Education
17%11Commercial Aviation8%2History Education
0%0Mathematics Education
4%1Music Education
38%10Natural Sciences
15%4Social Science Education
57%123EDUCATION
15%19Community Counseling
11%13Community Development
12%15Educational Administration*
14%17Educational Leadership
2%2Elementary Education*
25%31Elementary Education
15%18Health, PE, & Recreation
5%6Professional Studies**
0%0School Counseling
2%2Special Education
2%5NURSING
100%5Nursing
100%217UNIVERSITY TOTALS
* Denotes EDSSource: Office of the Registrar** Denotes EDDDate : June 2004
III - Degrees - 13

DELTA STATE UNIVERSITYDEGREES AWARDED BY GRADUATE MAJORS
DECEMBER 2003
%#DEGREES%#DEGREES
22%30BUSINESS13%18ARTS & SCIENCES
0%0Accounting28%5Criminal Justice
80%24Business Administration17%3English Education
20%6Commercial Aviation11%2History Education
0%0Mathematics Education
6%1Music Education
28%5Natural Sciences
11%2Social Science Education
60%81EDUCATION
10%8Community Counseling
11%9Community Development
14%11Educational Administration*
21%17Educational Leadership
2%2Elementary Education*
23%19Elementary Education
14%11Health, PE, & Recreation
2%2Professional Studies**
0%0School Counseling
2%2Special Education
4%5NURSING
100%5Nursing
100%134UNIVERSITY TOTALS
* Denotes EDSSource: Office of the Registrar** Denotes EDDDate : January 2004
III - Degrees - 14
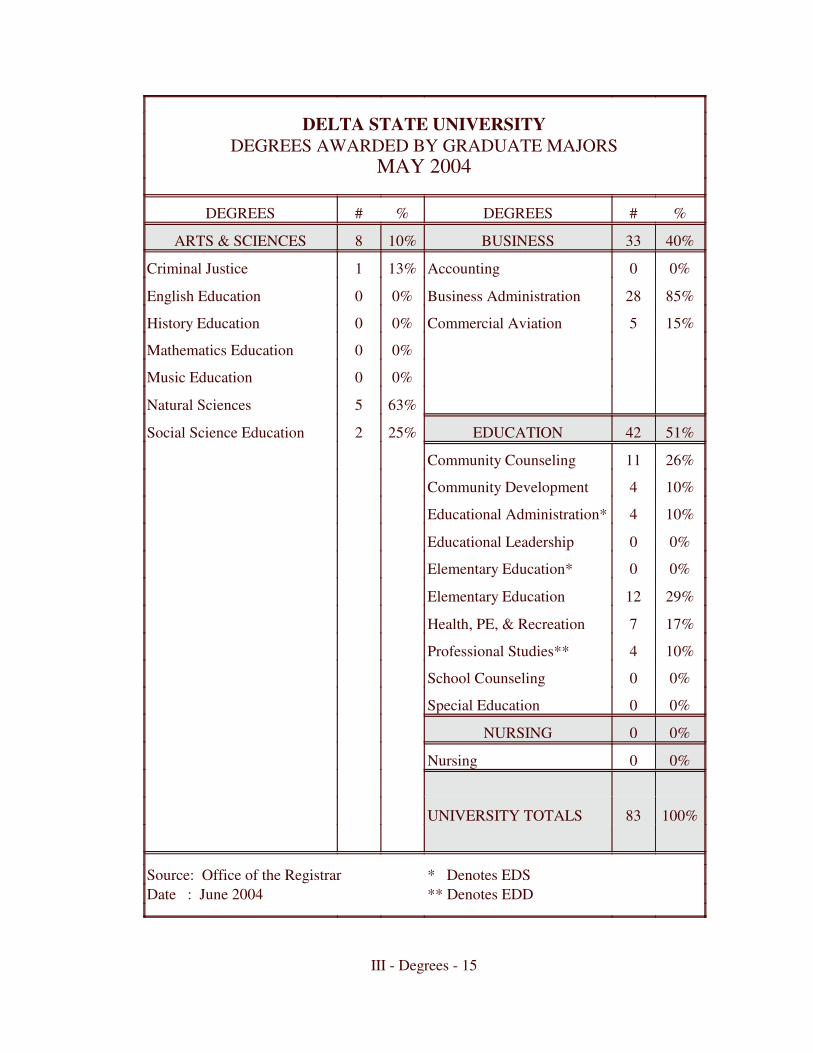
DELTA STATE UNIVERSITYDEGREES AWARDED BY GRADUATE MAJORS
MAY 2004
%#DEGREES%#DEGREES
40%33BUSINESS10%8ARTS & SCIENCES
0%0Accounting13%1Criminal Justice
85%28Business Administration0%0English Education
15%5Commercial Aviation0%0History Education
0%0Mathematics Education
0%0Music Education
63%5Natural Sciences
51%42EDUCATION25%2Social Science Education
26%11Community Counseling
10%4Community Development
10%4Educational Administration*
0%0Educational Leadership
0%0Elementary Education*
29%12Elementary Education
17%7Health, PE, & Recreation
10%4Professional Studies**
0%0School Counseling
0%0Special Education
0%0NURSING
0%0Nursing
100%83UNIVERSITY TOTALS
* Denotes EDSSource: Office of the Registrar** Denotes EDDDate : June 2004
III - Degrees - 15

DELTA STATE UNIVERSITYGRADUATION WITH HONORS
5-YEAR TREND
20042003*2002*2001*2000*HONORS:
6148636047ARTS & SCIENCES
1258104Bach. of Arts
84652Bach. of Fine Arts
20200Bach. of Music
58569Bach. of Music Education
2122252021Bach. of Science
21244Bach. of Science in Crim. Just.
8610113Bach. of Science in Education
10213Bach. of Science in Gen. Stud.
22331Bach. of Social Work
2834403531BUSINESS
2326352727Bach. of Business Admin.
47374Bach. of Commercial Aviation
11210Bach. of Science in Education
2619402822EDUCATION
33730Bach. of Arts
73550Bach. of Science
1312211920Bach. of Science in Education
31712Bach. of Science in Gen. Stud.
145911NURSING
145911Bach. of Science in Nursing
116105148132111TOTAL HONORS AWARDED
* Includes 2 and 4 year honorsSource: Office of the Registrar** Effective May 2004, 2 and 4 year honorsDate : June 2004 changed to Latin honors
III - Degrees - 16

DELTA STATE UNIVERSITYGRADUATION WITH HONORS
DECEMBER 2003
%AllTotal Honors
HonorsGraduatesHonors4 yr.2 yr.
20.2%9419118ARTS & SCIENCES
33.3%6211Bach. of Arts
19.0%21422Bach. of Fine Arts
0.0%1101Bach. of Music
66.7%3220Bach. of Music Education
19.4%31651Bach. of Science
0.0%15000Bach. of Science in Crim. Just.
28.6%14413Bach. of Science in Education
0.0%2000Bach. of Science in Gen. Stud.
0.0%1000Bach. of Social Work
14.0%1071578BUSINESS
12.6%951266Bach. of Business Admin.
27.3%11312Bach. of Commercial Aviation
0.0%1000Bach. of Science in Education
11.7%77936EDUCATION
12.5%8101Bach. of Arts
11.1%18202Bach. of Science
19.4%31633Bach. of Science in Education
0.0%20000Bach. of Science in Gen. Stud.
0.0%0000NURSING
0.0%0000Bach. of Science in Nursing
15.5%278432122TOTALS
Source: Office of the RegistrarDate : January 2004
III - Degrees - 17

DELTA STATE UNIVERSITYGRADUATION WITH HONORS
MAY 2004
%AllTotal Honors
HonorsGraduatesHonorsCum LaudeSumma
Cum LaudeMagna
Cum Laude
32.8%1284271124ARTS & SCIENCES
52.6%1910118Bach. of Arts
50.0%84004Bach. of Fine Arts
100.0%11010Bach. of Music
60.0%53021Bach. of Music Education
31.3%4815456Bach. of Science
16.7%122002Bach. of Science in Crim. Just.
30.8%134121Bach. of Science in Education
100.0%11100Bach. of Science in Gen. Stud.
9.5%212002Bach. of Social Work
11.4%11413139BUSINESS
11.3%9711137Bach. of Business Admin.
6.7%151001Bach. of Commercial Aviation
50.0%21001Bach. of Science in Education
18.9%90173410EDUCATION
18.2%112110Bach. of Arts
29.4%175014Bach. of Science
15.2%467205Bach. of Science in Education
18.8%163021Bach. of Science in Gen. Stud.
10.0%101001NURSING
10.0%101001Bach. of Science in Nursing
21.3%34273111844TOTALS
Source: Office of the RegistrarDate : June 2004
III - Degrees - 18


DELTA STATE UNIVERSITYFACULTY PROFILE: UNIVERSITY TOTALS
FALL 2003
ALL RANKSINSTRUCTORASSIS. PROF.ASSOC. PROF.PROFESSORTotalPTFTTotalPTFTTotalPTFTTotalPTFTTotalPTFT264129135996534631944331320693237Headcount
184.545.5313955.6620.5335.1352.147.3544.7924.754.752051.9612.939.06FTE*14878704536936132320713472225Men1165165542925276211367221012Women8436480009271266632835Tenured
180938799653454173721714642Not Tenured14964851917240103029920612833Doctoral
633321211000101First Professional431330101000000Specialist
97534468383019811330743Master's Degree752541101110000Bachelor's Degree
246121125906129591841331320642935Caucasian321110110000101Asian
1367734303000330Black202101000000101Hispanic
$45,536$36,266$42,542$50,267$54,228Average Salary **
* Department chairs FTE decreased from 100% to 75% in Fall 2002Source: Office of Institutional Research & Planning** Based on salary of filled positions only.Date : March 2004

DELTA STATE UNIVERSITYFACULTY PROFILE: COLLEGE OF ARTS AND SCIENCES
FALL 2003
ALL RANKSINSTRUCTORASSIS. PROF.ASSOC. PROF.PROFESSORTotalPTFTTotalPTFTTotalPTFTTotalPTFTTotalPTFT12858703924153410241147442024Headcount96.523.4673.0424.248.1116.1328.74.624.18.751.87.0034.81925.81FTE*8039412118322517716301515Men4819291861212574311459Women522428000413642421923Tenured76344239241530921505211Not Tenured71274444021516927371621Doctoral532321211000000First Professional110110000000000Specialist
4321222512131046110743Master's Degree752541101110000Bachelor's Degree
11954653421133210221147421923Caucasian000000000000000Asian743431202000110Black202101000000101Hispanic
$35,410$28,735$33,940$37,336$43,349Average Salary **
* Department chairs FTE decreased from 100% to 75% in Fall 2002.Source: Office of Institutional Research & Planning** Based on salary of filled positions only.Date : March 2004

DELTA STATE UNIVERSITYFACULTY PROFILE: COLLEGE OF BUSINESS
FALL 2003
ALL RANKSINSTRUCTORASSIS. PROF.ASSOC. PROF.PROFESSORTotalPTFTTotalPTFTTotalPTFTTotalPTFTTotalPTFT
4819292091110371046835Headcount35.256.252913.752.75118177.251.2566.251.255FTE*
301317844633835835Men186121257404211000Women17611000514422835Tenured31131820911523624000Not Tenured241014321523936734Doctoral101000000000101First Professional101000101000000Specialist
2291317710413110000Master's Degree000000000000000Bachelor's Degree
42162617899271046624Caucasian321110110000101Asian312202000000110Black000000000000000Hispanic
$54,134$38,691$57,912$60,617$68,323Average Salary **
* Department chairs FTE decreased from 100% to 75% in Fall 2002.Source: Office of Institutional Research & Planning** Based on salary of filled positions only.Date : March 2004

DELTA STATE UNIVERSITYFACULTY PROFILE: COLLEGE OF EDUCATION
FALL 2003
ALL RANKSINSTRUCTORASSIS. PROF.ASSOC. PROF.PROFESSORTotalPTFTTotalPTFTTotalPTFTTotalPTFTTotalPTFT
764828353141751210551477Headcount43.5114.5728.9413.579.57413.941.2512.696.751.7559.2527.25FTE*
38261216142853532945Men38221619172909523532Women13580000001011257Tenured6343203531417512954220Not Tenured48252311110143119451477Doctoral000000000000000First Professional220220000000000Specialist
2621522184321110000Master's Degree000000000000000Bachelor's Degree
734726343131651110551367Caucasian000000000000000Asian312101101000110Black000000000000000Hispanic
$47,100$38,800$42,991$46,638$57,760Average Salary **
* Department chairs FTE decreased from 100% to 75% in Fall 2002.Source: Office of Institutional Research & Planning** Based on salary of filled positions only.Date : March 2004

DELTA STATE UNIVERSITYFACULTY PROFILE: SCHOOL OF NURSING
FALL 2003
ALL RANKSINSTRUCTORASSIS. PROF.ASSOC. PROF.PROFESSORTotalPTFTTotalPTFTTotalPTFTTotalPTFTTotalPTFT
1248514211202321Headcount9.2511.25184.100.1041.50.5012021.650.651FTE*
000000000000000Men1248514211202321Women211000000101110Tenured
1037514211101211Not Tenured624101000202321Doctoral000000000000000First Professional000000000000000Specialist624413211000000Master's Degree000000000000000Bachelor's Degree
1248514211202321Caucasian000000000000000Asian000000000000000Black000000000000000Hispanic
$50,964$45,762$49,205$55,229$65,000Average Salary **
* Department chairs FTE decreased from 100% to 75% in Fall 2002.Source: Office of Institutional Research & Planning** Based on salary of filled positions only.Date : March 2004

DELTA STATE UNIVERSITYPUPIL-TEACHER RATIO
FALL 2003
FTECreditFTEPTRStudentsHours*Faculty
162,900.6942,562184.01UNIVERSITY TOTAL
141,381.1320,55899.25ARTS & SCIENCES00.0000.00Aerospace****
10128.301,92312.75Art1542.406362.75Audiology & Speech Pathology16149.402,2249.33Biological Sciences21100.551,4944.75History15329.774,93622.70Languages, Literature and Philosophy19139.532,0937.50Mathematics00.0000.00Military Science**577.851,16714.81Music
15134.332,0028.91Physical Sciences19225.403,27912.00Social Sciences1453.608043.75Social Work
20685.3710,07533.75BUSINESS***17291.004,31117.00Accounting, Finance, & Comp. Info. Syst.2276.671,1083.50Commercial Aviation24317.704,65613.25Management, Marketing, & Busin. Adm.
19788.3611,29441.76EDUCATION18175.002,4629.88Counselor Educaiton and Psychology21328.064,59615.75C & I, Leadership, & Research18203.103,00311.23H P E & R1782.201,2334.90Family & Consumer Science
545.836359.25NURSING545.836359.25Nursing
* On-campus Undergraduate & Graduate data combinedSource: Institutional Research & Planning
** Program discontinued in Summer 1995Date : March 2004
*** Does not include EBBA or EMBA
**** Program discontinued in 2003
IV - Faculty & Staff - 7

DELTA STATE UNIVERSITYFACULTY CHARACTERISTICS
1994 - 2003
2003-042002-032001-022000-011999-20001998-991997-981996-971995-961994-95SCHOOL YEAR84100100100889095938378Tenured71636878999390899399Not-Tenured, Tenure Track
1099599112978790949092Not-Tenured148144144162161163164165158166Male116114116128123107111111108103Female69879091888387827985Professor33292629323437383226Associate Professor63576471777468687373Assistant Professor99858799877883888284Instructor0000010001Other
149142145148153143142140130124Doctoral6322196536First Professional4376422122Specialist
97103105125118111120123123133Master's7788855784Bachelor's
264258267290284270275276266269Total203198194193183176FTE Filled Positions*
* Full-time Equivalent Filled Positions as reported in the IHL Analysis of Operating Budgets. Teaching facultySource: Institutional Research only. Does not include administrative, part-time, or professional non-faculty with faculty rank. As of JuneDate : March 2004 2000, IHL no longer collects this data.

DELTA STATE UNIVERSITYMEAN SALARIES OF FACULTY BY RANK
5-YEAR TREND
20032002200120001999RANK
$54,228$54,947$55,726$55,173$55,603Professor
$50,267$50,726$50,086$48,050$47,289Associate Professor
$42,542$42,325$42,613$40,900$42,103Assistant Professor
$36,266$35,655$34,331$36,347$37,018Instructor
$45,536$45,505$45,564$46,210$46,829ALL RANKS
Source: Institutional Research and PlanningDate : March 2004
IV - Faculty & Staff - 9
20000
25000
30000
35000
40000
45000
50000
55000
60000
ME
AN
SA
LA
RY
1999 2000 2001 2002 2003YEAR
PROFESSOR ASSOC. PROF. ASSIS. PROF.
INSTRUCTOR ALL RANKS

DELTA STATE UNIVERSITYDISTRIBUTION OF EMPLOYEES *
FALL 2003
* Includes full-time and part-time.Source: IHL Statistical ReportDate : December 2003
IV - Faculty & Staff - 10
SERVICE (34.36%)
SKILLED (1.48%)TECHNICAL (2.83%)
CLERICAL (15.02%)
PROFESSIONAL (18.47%)
FACULTY (21.06%)
EXECUTIVE (6.77%)
150
TOTAL: 812
171
55
23
122
279


DELTA STATE UNIVERSITYTUITION & FEES: ANNUAL RATES
2003-04
Room RentStudent
Board &ActivityHealthTechnologyUnionAthleticGeneralFULL-TIME STUDENTS
TotalLaundryFeeFeeFeeFeeFeeTutition
$6,942$3,594$40$51$40$45$248$2,924MS Res. - Dorm Student
$3,348--$40$51$40$45$248$2,924MS Res. - Day Student
$11,559$3,594$40$51$40$45$248$7,541Nonres. - Dorm Student
$7,965--$40$51$40$45$248$7,541Nonres. - Day Student
SPECIAL FEES
$550Private room per semester.............................................................................................................................................
Overload Fees:
$119 Undergraduate - for each hour over 19............................................................................................................................
$156 Graduate - for each hour over 13.................................................................................................................................
$119Correspondence course fee per semester hour...........................................................................................................................
Private music lesson fee:
$50 For each semester hour credit....................................................................................................................................
$5Transcript - after first..............................................................................................................................................
$20Late registration fee.................................................................................................................................................
$5Change of schedule (after registration)...............................................................................................................................
$5Lab Fee......................................................................................................................................................
Source: University AccountingDate : June 2003
V - Resources - 2

DELTA STATE UNIVERSITYTUITION AND FEES*
1994 - 2003
* Cost is for full-time MS resident students.Source: University AccountingDate : June 2003
V - Resources - 3
$500
$1,000
$1,500
$2,000
$2,500
$3,000
$3,500
$4,000
DO
LL
AR
S/Y
EA
R
1994-95 1995-96 1996-97 1997-98 1998-99 1999-2000 2000-01 2001-02 2002-03 2003-04YEAR
TUITION AND FEES ROOM, BOARD, LAUNDRY

DELTA STATE UNIVERSITYINSTRUCTION vs. TOTAL E&G
5-YEAR TREND: 1999-2003
2003-042002-032001-022000-011999-2000
$34,244,835$33,510,440$33,514,872$33,814,910$33,492,919Total E&G
$14,505,106$14,223,115$15,682,422$16,062,842$16,333,257Instruction
$4,217,724$3,960,137$3,742,182$4,104,243$4,034,648Acad. Support
TOTAL EDUCATION AND GENERAL EXPENDITURES
Source: Institutional Research & PlanningDate : June 2003
V - Resources - 4
$0
$5
$10
$15
$20
$25
$30
$35
DO
LL
AR
S/Y
EA
RM
illio
ns
1999-2000 2000-01 2001-02 2002-03 2003-04YEAR
Other Instruction Academic Support
11.9% 12.0% 12.1%
48.8% 47.5% 46.8%
11.2%
49.6% 42.4%
12.3%

DELTA STATE UNIVERSITYCOST PER STUDENT vs. TUITION AND APPROPRIATION *
5-YEAR TREND: 1999-2003
2003-20042002-20032001-20022000-20011999-2000
$11,057$10,852$10,227$10,678$9,976Cost per student
$4,936$4,954$5,281$6,208$5,728State Appropriation
$3,348$3,348$3,100$2,696$2,596Tuition
Source: Institutional Research & Planning* Cost = Edu. & General Expense Per FTE StudentDate : January 2004
V - Resources - 5
$0
$1,000
$2,000
$3,000
$4,000
$5,000
$6,000
$7,000
$8,000
$9,000
$10,000
$11,000
$12,000
DO
LL
AR
S/Y
EA
R
1999-2000 2000-2001 2001-2002 2002-2003 2003-2004YEAR
$9,976
$10,678$10,227
$10,852 $11,057
57.4%58.1%
51.6%45.7% 44.6%
26.0% 25.2%30.3% 30.9% 30.3%
Cost per student Appropriation Tuition

DELTA STATE UNIVERSITYCURRENT FUNDS REVENUES BY SOURCE
5-YEAR PROFILE
2003-20042002-20032001-20022000-20011999-2000FISCAL YEARS
$12,912,486$12,555,511$11,177,164$10,103,430$9,548,190Tuition and Fees
20,380,58320,255,81221,134,31122,300,29122,547,263State Appropriations
103,000103,000103,000103,000103,000Grants and Contracts
493,463482,669426,850741,073750,450Sales & Services
355,303113,448673,547567,116544,016Other Sources*
$34,244,835$33,510,440$33,514,872$33,814,910$33,492,919Total E&G
9,019,6269,147,2098,365,4227,730,1477,054,384Auxiliary Enterprises
$43,264,461$42,657,649$41,880,294$41,545,057$40,547,303TOTAL
2003-04 FUNDS REVENUES BY SOURCE
* Other Sources of $1,119,626 less $764,323Source: IHL Analysis of Operating Budgets in Board Mandated Reserve.Date : June 2003
V - Resources - 6
Tuition and Fees (37.71%)
Sales & Services (1.44%)Other Sources (1.04%)
Grants and Contracts (0.30%)
State Appropriations (59.51%)

DELTA STATE UNIVERSITYCURRENT FUNDS EXPENDITURES AND TRANSFERS BY FUNCTION
5-YEAR PROFILE
2003-20042002-20032001-20022000-20011999-2000FISCAL YEARS
$14,505,106$14,223,115$15,682,422$16,062,842$16,333,257Instruction
13,00013,35039,72261,41281,124Research
991,698666,378583,914627,866488,129Public Service
4,217,7243,960,1373,742,1824,104,2434,034,845Academic Support
3,302,4193,218,7363,087,7553,174,2463,107,305Student Services
3,522,8933,692,6393,454,0883,336,2703,317,196Institutional Support
3,559,1333,573,5533,421,6713,030,6173,031,361Operation & Maint.
3,041,3702,999,1482,818,3162,815,7122,555,602Schol. & Fellowships
1,091,4921,163,384684,802601,702544,100Transfers
34,244,83533,510,44033,514,87233,814,91033,492,919 Total Ed. & General
9,019,6269,147,2098,365,4227,730,1477,054,384Auxiliary Enterprises
$43,264,461$42,657,649$41,880,294$41,545,057$40,547,303TOTAL
2003-04 FUNDS EXPENDITURES AND TRANSFERS BY FUNCTION
Source: IHL Analysis of Operating BudgetsDate : June 2003
V - Resources - 7
Instruction (42.36%)Operation & Maintenance (10.39%)
Scholarships & Fellowships (8.88%)
Public Service (2.90%)Transfers (3.19%)
Student Services (9.64%)
Research (0.04%)
Academic Support (12.32%)
Institutional Support (10.29%)

DELTA STATE UNIVERSITYROBERTS-LAFORGE LIBRARY COLLECTIONS AND UTILIZATIONS
1999-2003
2003-042002-032001-022000-011999-2000FISCAL YEAR
LIBRARY COLLECTIONS345,565334,710331,251320,751312,631 Bound Volumes35,20330,38627,66619,78915,131 Electronic Books
828,979809,103795,827779,420754,713 Microforms1,2681,2921,3301,3771,365 Serial Subscriptions9,2706,1095,1853,5822,857 Serial Subscriptions - Electronic
18,49318,08316,97516,21215,470 Audio Visual
INTERLIBRARY LOAN1,4731,4291,4701,7041,869 Provided to Other Libraries1,077918972806485 Received from Other Libraries
CIRCULATION TRANSACTIONS36,57435,39239,21435,78634,643 General Collection
1,512*4,1196,3104,5544,548 Reserve Collection224,659133,439139,691291,893367,084 Electronic Index and Full-Text Database Use
* Does not include Electronic Reserves Source: Roberts-LaForge Library
Date : September 2004