Embed Size (px)
Citation preview
Review of the
Hellenic Observatory of Corporate Governance
(HOCG)
Vol. 6, No. 2, December, 2012 ISSN 1759-0108
Boards in Greek Maritime Listed Companies: Findings
from the Fourth Annual Research

©Review of the HOCG ISSN 1759-0108
Page | 2
TABLE OF CONTENTS
1 INTRODUCTION 4
SECTION 1.1: DEVELOPMENTS IN 2008-2012 5
SECTION 1.2: DEVELOPMENTS IN 2013 6
SECTION 1.3: GREEK SHIPPING INDUSTRY 7
2. METHODOLOGY 09
SECTION 2.1: POPULATION/SAMPLE 09
SECTION 2.2: VARIABLES ANALYZED 13
3. FINDINGS 14
SECTION 3.1: BOARD DEMOGRAPHICS 14
SECTION 3.2: BOARD SIZE 17
SECTION 3.3: BOARD TENURE 20
SECTION 3.4: CEO DUALITY 22
SECTION 3.5: CROSS DIRECTORSHIPS 23
4. SUMMARY 25
5. REFERENCES 27

©Review of the HOCG ISSN 1759-0108
Page | 3
The most vital and solid sector of the Greek economy is undoubtedly maritime. The
shipping industry contributes significantly to the Greek economy and Greece continues
to be the leading shipping-nation in the world, controlling a fleet of 217 million dwt
(Institute of Shipping Economics and Logistics, 2012). It is patently clear that the year
2008 was a pivot of the world trade as it was the year that affected intensely the
economy as we knew it, not only in maritime that is the landmark of this report- but in
the entire world. In the introductory part of this research, we try to highlight some of
the factors that contributed to general downward trend of the shipping markets and
present how some of the ship owners have managed to cope with the financial crisis.
This review will extent the previous findings presented in three previously published
reports by the HOCG (Vol. 5, No. 1 in 2011, Vol. 4, No. 3 in 2010 and Vol. 3 No. 3 in 2009)
that portrayed a picture of the board composition of Greek Maritime Companies listed
on international bourses.
The current study attempts to contribute in the area of corporate governance by
offering some further findings from an under searched but very critical sector in Greece.
The entrepreneurial philosophy of ship owners and their family ties could give us useful
lessons of corporate governance practices of an industry which is extremely cyclical and
volatile.
Our study further extends the findings of previous reports that have been conducted by
the HOGC on key economic sectors in Greece. We trust you will find this study
interesting and that our findings will assist the progress of the quest for solid corporate
governance mechanisms.
Dr Dimitrios N. Koufopoulos BSc, MBA, PhD, AIIA, MCMI, FIC, MCSI
RevVer: 2013-05-28

©Review of the HOCG ISSN 1759-0108
Page | 4
Boards in Greek Maritime Listed Companies: Findings from the
Fourth Annual Research
1. Introduction
The maritime shipping industry is considered as the most cost-effective means of
transporting large volumes of commodities. Shipping is a cyclical, seasonal and volatile
business and the main factors that affect its market are the following:
• Global economic growth
• Fuel prices
• Trade patterns
• Supply and demand for vessels
• Climate changes
• The scrapping rate of older vessels.
All the commercial vessels are built to carry specific cargo types and for this reason are
categorized into oil tankers, bulk carriers, general cargo ships, containers, liquefied gas
carriers, offshore vessels, and passenger ships. The structure of the world fleet and its
growth for the years 2003-2013 is depicted in Table 1.
*Note: From 2012 combined carriers included in bulk carrier fleet
Table 1: World Fleet by principal vessel types 2001-2013 Sources: Platou Report 2011 and Platou Report 2013
TANKERS CHEMICAL
CARRIERS
BULK
CARRIERS
COMBINED
CARRIERS
OTHERS TOTAL
2001 276.1 15.0 274 14.6 169.3 749.0
2002 269.7 15.0 287.4 13.8 760.6 760.6
2003 270.7 23.1 289.1 12.6 181.2 776.8
2004 279.1 25.0 297.4 12.1 189.6 803.3
2005 295.0 25.7 314.9 11.6 200.5 847.6
2006 317.7 26.9 336.0 11.6 213.3 905.4
2007 334.7 29.0 359.2 11.2 232.5 966.7
2008 352.3 31.7 387.1 11.2 254.2 1036.4
2009 369.0 34.0 415.0 10.4 278.3 1106.7
2010 396.2 35.8 453.4 9.6 300.0 1194.9
2011 413.1 36.1 527.7 6.8 315.1 1298.8
2012 439.0 36.5 609.2 * 330.9 1415.6
2013 460.5 36.6 673.5 * 350.1 1520.7

©Review of the HOCG ISSN 1759-0108
Page | 5
1.1 Developments in 2008-2012
As we have noted in our previous Reviews, the year 2008 is considered as a turning
point in the history of the world trade as the global crisis affected severely the shipping
markets. Freight and charter rates collapsed, bank financing vanished and the Baltic Dry
Index (BDI), which is a composite of shipping prices for various dry bulk products,
experienced a severe decline of more than 90% by the end of the year.
In 2009, we noticed the sharpest trade decline in the last 70 years with world
merchandise export volumes to have plummeted by 13.7 per cent (UNCTAD 2010). By
the end of 2009, asset values declined and ship charter rates in all sectors remained
substantially lower than those of 2008. Contracting activity in 2009 was historically low
and a notable cancellation of shipping deliveries was continued throughout the year.
The volatility of the shipping markets continued into 2010 and we noticed low tanker
and dry bulk charter markets despite of the surprisingly high order book. The markets
could not absorb the large supply of vessels despite of the growth in demand of
products. The analysis of PWC (2011) concludes that shipping recovered to the same
levels as in 2008 and the overall performance of shipping companies improved
somewhat in 2010 compared to 2009.
Some of the main events that affected the industry in 2011 were the extreme weakness
of the global economy, the Tsunami in Japan and the Arab spring that led to disruption
of shipments and shipping lanes. Despite these difficulties, the world merchant fleet
expanded and new vessels were delivered. Seaborne trade continued to grow and an
increase of over 37% of the world fleet was noticed from 2008 to 2011 UNCTAD (2012).
Low growth of global oil trade, increased bunker prices and vessel oversupply led the
tanker rates for 2011 and the beginning of 2012 at their lowest level since 1994. Dry
market was also hit but due to China’s healthy growth the rates didn’t collapse. The
upward trend in the containers during the first half of 2011 was followed by the general
downward trend of the other shipping markets.
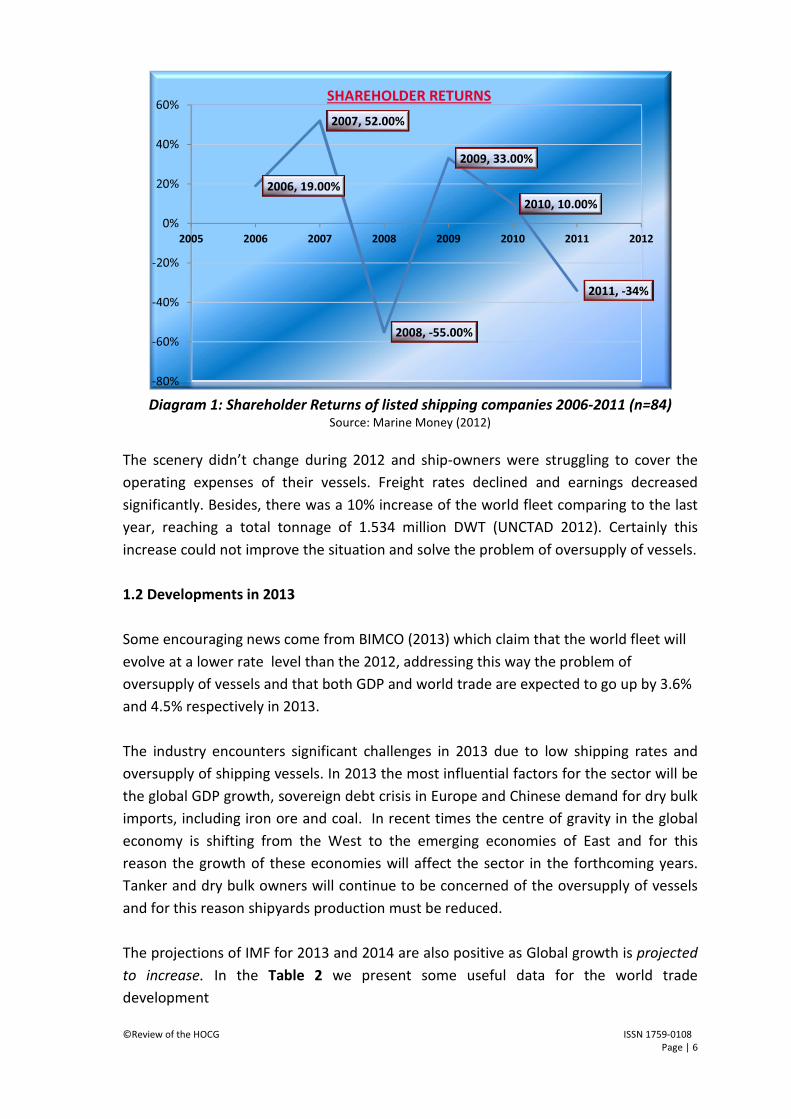
In a study of 84 public listed shipping companies, Marine Money (2012) found that 75
companies delivered negative Returns to Shareholders, with a negative industry median
(-34%) for the year ended 31.12.11, as depicted in Diagram 1. It’s remarkable to note
that only some years ago, in 2007, the industry average had climbed up by 52%. Among
the ten companies who had positive shareholder returns in 2011, we find only one
Greek shipping company- Costamare- which was listed in the NYSE in November 2010.
©Review of the HOCG ISSN 1759-0108
Page | 6
Diagram 1: Shareholder Returns of listed shipping companies 2006-2011 (n=84)
Source: Marine Money (2012)
The scenery didn’t change during 2012 and ship-owners were struggling to cover the
operating expenses of their vessels. Freight rates declined and earnings decreased
significantly. Besides, there was a 10% increase of the world fleet comparing to the last
year, reaching a total tonnage of 1.534 million DWT (UNCTAD 2012). Certainly this
increase could not improve the situation and solve the problem of oversupply of vessels.
1.2 Developments in 2013
Some encouraging news come from BIMCO (2013) which claim that the world fleet will
evolve at a lower rate level than the 2012, addressing this way the problem of
oversupply of vessels and that both GDP and world trade are expected to go up by 3.6%
and 4.5% respectively in 2013.
The industry encounters significant challenges in 2013 due to low shipping rates and
oversupply of shipping vessels. In 2013 the most influential factors for the sector will be
the global GDP growth, sovereign debt crisis in Europe and Chinese demand for dry bulk
imports, including iron ore and coal. In recent times the centre of gravity in the global
economy is shifting from the West to the emerging economies of East and for this
reason the growth of these economies will affect the sector in the forthcoming years.
Tanker and dry bulk owners will continue to be concerned of the oversupply of vessels
and for this reason shipyards production must be reduced.
The projections of IMF for 2013 and 2014 are also positive as Global growth is projected
to increase. In the Table 2 we present some useful data for the world trade
development
2006, 19.00%
2007, 52.00%
2008, -55.00%
2009, 33.00%
2010, 10.00%
2011, -34%
2005 2006 2007 2008 2009 2010 2011 2012
-80%
-60%
-40%
-20%
0%
20%
40%
60%SHAREHOLDER RETURNS

©Review of the HOCG ISSN 1759-0108
Page | 7
Projections
2011 2012 2013 2014
World Output 3.9 3.2 3.5 4.1
Advanced Economies 1.6 1.3 1.4 2.2
United States 1.8 2.3 2.0 3.0
Euro Area 1.4 –0.4 –0.2 1.0
Germany 3.1 0.9 0.6 1.4
Japan –0.6 2.0 1.2 0.7
United Kingdom 0.9 –0.2 1.0 1.9
Canada 2.6 2.0 1.8 2.3
Newly Industrialized Asian Economies 4.0 1.8 3.2 3.9
Emerging Market and Developing Economies 6.3 5.1 5.5 5.9
Russia 4.3 3.6 3.7 3.8
China 9.3 7.8 8.2 8.5
India 7.9 4.5 5.9 6.4
Latin America and the Caribbean 4.5 3.0 3.6 3.9
European Union 1.6 –0.2 0.2 1.4
World Growth Based on Market Exchange
Rates
2.9 2.5 2.7 3.4
World Trade Volume (goods and services) 5.9 2.8 3.8 5.5
Imports
Advanced Economies 4.6 1.2 2.2 4.1
Emerging Market and Developing
Economies
8.4 6.1 6.5 7.8
Exports
Advanced Economies 5.6 2.1 2.8 4.5
Emerging Market and Developing
Economies
6.6 3.6 5.5 6.9
Table 2: Overview of the World Economic Outlook Projections Source: IMF (2013)
1.3 Greek Shipping Industry
Research conducted by the Institute of Shipping Economics and Logistics (2012)
underlined that Greece is -for one more year- the leading shipping nation in the world,
controlling a fleet of 217 million dwt. It should be also noted that there is approximately
a 5.4% increase of tonnage that is controlled from Greek ship-owners for the period
2008-2012.
Petrofin (2012) research concludes that there were 718 Greek Shipping companies
during 2012 although there has been a reduction of 5.77% compared to last year
(Diagram 2).

©Review of the HOCG ISSN 1759-0108
Page | 8
Diagram 2: Number of Greek Shipping Companies 1998-2012
Source: Petrofin Research, 2012
However, the findings of the research support that those small ship owners, operating
1-2 vessels are responsible for this reduction, whereas large ship-owners, operating
above 16 vessels, seem to remain robust in the financial crisis. Small owners exit the
market because they don’t have the financial means to cope well with the increasing
operational costs of their vessels.
Besides, the Database of Hellenic Chamber of Shipping presents useful information
about the number of ships in the Greek national registry (Table 3).
Year Number of Ships Gross Tonnage
2011 2,014 43,397,583
2010 2,096 43,086,974
2009 2,112 41,358,711
2008 2,082 39,156,211
2007 1,916 36,239,543
2006 1,874 32,765,042
2005 1,901 31,444,245
2004 1,972 32,769,792
2003 1,974 31,915,727
2002 1,965 29,204,859
2001 1,959 29,257,366
Table 3: Ships in the Greek national registry 2001-2011 (ships over 100 gt) Source: Hellenic Chamber of Shipping (2013)
0 200 400 600 800 1000
1998
2000
2002
2004
2006
2008
2010
2012
926
754
835
785
749
729
733
690
693
725
758
773
758
762
718
Number of Greek Shipping Companies
No of Companies

©Review of the HOCG ISSN 1759-0108
Page | 9
From the UNCTAD report of 2012, we note that among 35 countries, Greece is ranking
on the first position of the countries with largest owned fleets. In Table 4, we have
depicted the top ten of countries with the largest estimated market share as of 1
January 2012. Greece, Japan, Germany and China own half of the world tonnage.
Country
Number of vessels Deadweight tonnage
National
Flag
Foreign
Flag Total
National
Flag
Foreign
Flag Total
Foreign
Flag as a
percentage
of total
Estimated
market
share
1 January
2012
Greece 738 2 583 3 321 64 921 486 159 130 395 224 051 881 71.02 16.10
Japan 717 3 243 3 960 20 452 832 197 210 070 217 662 902 90.60 15.64
Germany 422 3 567 3 989 17 296 198 108 330 510 125 626 708 86.23 9.03
China 2 060 1 569 3 629 51 716 318 72 285 422 124 001 740 58.29 8.91
Korea,
Republic
of
740 496 1 236 17 102 300 39 083 270 56 185 570 69.56 4.04
United
States 741 1 314 2 055 7 162 685 47 460 048 54 622 733 86.89 3.92
China,
Taiwan
Province
470 383 853 28 884 470 16 601 518 45 485 988 36.50 3.27
Norway 851 1 141 1 992 15 772 288 27 327 579 43 099 867 63.41 3.10
Denmark 394 649 1 043 13 463 727 26 527 607 39 991 334 66.33 2.87
Chinese
Taipei 102 601 703 4 076 815 34 968 474 39 045 289 89.56 2.81
Note: Vessels of 1000 GT and above, ranked by deadweight tonnage
Table 3: Countries with largest owned vessels Source: UNCTAD, 2012
2. Methodology
2.1 Population /Sample
The current study focuses on the board characteristics of Greek maritime companies,
which are listed in foreign Stock Exchanges. Table 4 presents all maritime companies
included in our study from 2001-2011 and Diagram 3 illustrates their number
throughout the same period. Besides, Table 5 demonstrates the number of IPOs,
Mergers & Acquisitions & Delisting of public listed Maritime Companies for the period
2001-2011.
Data was collected both from the annual reports found in the corporate websites of the
Greek maritime companies and corresponding websites of the Securities & Exchange
Commission (SEC) (www.sec.gov), the related Stock Exchanges were consulted: the New
York Stock Exchange (www.nyse.com), the London Stock Exchange
(www.londonstockexchange.com), the Nasdaq Stock Market (www.nasdaq.com) and
the Singapore Stock Exchange (www.sgx.com). The data collection process took place

©Review of the HOCG ISSN 1759-0108
Page | 10
during the last part of 2012, while the analysis was based on 33 maritime companies.
It should be mentioned, that in the current research, some omissions made in our
previous Reviews have been corrected. More specifically, we incorporated data for two
shipping companies- more specifically- Costamare and Diana Containership- which had
not been included in our previous research findings.

©Review of the HOCG ISSN 1759-0108
Page | 11
Table 4: Greek Maritime Listed Enterprises for the period 2004-2011 Note 1: Aries Maritime Transport Limited as of December 21, 2009 Company was Renamed 'New Lead Holdings Ltd' and trades Under the
Symbol 'NEWL'
Note 2: As of April, 2009 Oceanaut, Inc. went out of business
Note 3: On April 15, 2008, Quintana Maritime Limited (QMAR) was merged into Excel Maritime
Note 4: March 2011: OceanFreight has become a wholly-owned subsidiary of DryShips
Note 5: On September 2011: Capital Product Partners LP Announces Completion Of Acquisition Of Crude Carriers Corp
DIANA SHPPING INC. (DSX) MAR
2005
DRY SHIPS INC. (DRYS), FEB 2005
GOLDENPORT HOLDING INC.
(GPRT), APR 2006
OMEGA NAVIGATION
ENT. (ONAV50), APR
2006
NAVIOS MARITIME PARTNERS
(NMM), NOV 2007
EUROSEAS LTD (ESEA), JAN 2007
GLOBUS MARITIME LTD.
(GLBS),JUN 2007
AEGEAN MARINE PETROLEUM
NETWORK INC(ANW), DEC 2006
SEANERGY MARITIME HOL (SHIP), SEP
2007
HELLENIC CARRIERS LTD (HCL),
NOV. 2007
TSAKOS ENERGY NAVIGATION
(TNP),MAR 2002
PARAGON SHIPPING INC. (PRGN),
AUG 2007
OCEANAUT INC. (OKN), APR
20072
STAR BULK CARRIERS CORP(SBLK),
DEC 2007
NAVIOS MARITIME ACQ. (NNA),
JUL 2008
OMEGA NAVIGATION ENT. (ONAV50),
APR 2006
EXCEL MARITIME CARRIERS
(EXM), SEP 2005
OCEAN FREIGHT INC.(OCNF), APRIL
2007
DANAOS CORP (DAC), OCT 2006
CAPITAL PRODUCT PARTNERS L.P.
(CPLP), APR 2007
SAFE BULKERS INC (SB), MAY
2008
NAVIOS MARITIME HOLDINGS(NM),
NOV 2005
STAR BULK CARRIERS
ORP(SEA),DEC 2005
FREESEAS INC (FREE), DEC 2005
GENCO SHIPPING
&TRADIN.(GNK),JUL 2005
ARIES MARITIME TRANSPORT
(RAMS), JUN 20051
GENERAL MARITIME CORP.
(GMR), JUN 2001
QUINTANA MARITIME LTD. (QMAR),
JUL20053
CRUDE CARRIERS CORP. (CRU),
MAR 2010
DIANA CONTAINERSHIPS, (DCIX)JUNE
2011
BOX SHIPS (TEU)APRIL 2011
OCEAN RIG(ORIG) OCTOBER 2011
COSTAMARE(CMRE), NOV 2010

©Review of the HOCG ISSN 1759-0108
Page | 12
In the Diagram 3, we can see the number of Greek-Owned Abroad listed Maritime
companies operating the years 2001-2011.
Diagram 3: Number of Greek Maritime Listed Companies (2001 – 2011)
From Table 5 we note that almost half of the shipping companies got listed in the
Stock Exchanges within 2005. Besides, in these 11 years 2 acquisitions took place and
one company was dissolved.
Table 5: IPOs, Mergers & Acquisitions & Exits of Maritime Companies
2001 2002 2003 2004 2005 2006 2007 2008 2009 2010 2011
1 2 2 3
1317
26 28 27 29 31
Number of Listed Maritime
companies
Year No. of
Companies
listed
Mergers
&
Acquisition
s
Delisted
2001 1
2002 1
2003 0
2004 1
2005 10
2006 4
2007 9
2008 2 1
2009 0 1
2010 2
2011 3 1
Total
33 2 1

©Review of the HOCG ISSN 1759-0108
Page | 13
2.2 Variables analysed
The study examined the following variables for the period 2001-2011.
Board Member age was captured by recording the date of birth and calculating their
age for the year ended 31.12.11.
Age of the Chairpersons and the CEOs was captured by recording the date of birth and
calculating their age by the end of each year for the period 2001-2011. Furthermore,
this variable was classified as:
-Age of sole Chairpersons who served only in that position
-Age of sole CEOs who served only in that position
-Age in case of duality (The Chairman and the CEO is the same individual)
Foreign Nationals were counted by looking at the surnames’ origin.
The gender of Chairpersons and CEOs was identified by their full names.
Total Board Memberships was captured by the number of all directorships through
the years. This particular variable captures the number of positions/seats that Boards
have, rather than the number of persons (individual directors) that occupy them.
Total Male Board Memberships was captured by the absolute number of male
directorships that existed within the Boards through the years. The exact number was
ascertained by examining both their names and surnames. Further, we calculated the
total male board members by excluding any cross directorships or/and mobility.
Total Female Board Memberships was captured by the absolute number of female
directorships that existed within the Boards through the years. The exact number was
ascertained by examining their names and surnames. Additionally, we calculated the
total female board members by excluding any cross directorships or/and mobility.
Board Size was measured by capturing the absolute number of serving directors of
each company as of December of each year.
Average Board Size was measured by calculating the average of each company’s board
size for all the years.
Total Board Members: was calculated by excluding any mobility and/or cross
directorships from the total board memberships. This variable captures the absolute
number of directors that serve as board members in one or more companies.
Average Tenure of the Board members (in months) was measured by calculating the
sum of the serving period (in months) of all directors (including Chairman and CEO)
divided by their total number for each company.
Average Tenure of Directors (in Months excluding Chairperson and CEO) was

©Review of the HOCG ISSN 1759-0108
Page | 14
measured as the “Average Tenure of the Board” but excluding the Chairperson(s) and
the CEO(s).
Average Tenure of Chairpersons and Average Tenure of CEOs was measured by
calculating the sum of the serving period (in months) for the Chairpersons or CEOs of
each company, divided by the total number of Chairpersons or CEOs that served in
each of the maritime companies throughout the years.
Average tenure of sole Chairpersons and sole CEOs was measured by calculating the
sum of the serving period (in months), divided by the total number of sole
Chairpersons or sole CEOs that served in each of the maritime companies throughout
the years.
The number of Chairpersons and CEOs was calculated by counting the absolute
number of Chairpersons and CEO’s respectively for each company through the years.
The number of the sole Chairpersons and CEOs was calculated by counting the
absolute number of sole Chairpersons and sole CEO’s respectively through the years.
CEO Duality, as of 31st
of December of each year, was captured by examining whether
the CEO was also the Chairperson or whether the two positions were separate.
Cross Directorships: the directors that were serving in more than one board
simultaneously have been identified and recorded along with the corresponding
companies.
3. Findings
3.1 Board demographics
Α) Age
Age is a very substantial variable in the examination of board composition for it could
be a double-edged sword as the age of Directors could be related to greater
experience in the field under consideration but also a risk aversion for new ventures.
Average age of the Board, as well as the age of CEO and Chairman, has been linked
with the financial performance of the organizations. It has also been supported that by
expanding the age diversity between the board members, the board’s aggregated
human and social capital can be maximised.
Diagram 4 presents the average age of all directors on a board. Our findings showcase
that the average age of directors who hold positions in the Board as of 31.12.11 was
55 years old, while the older person in the board was 67 years old. The majority
(64.5%) of the companies had directors who on average were running their sixth
decade of life.

©Review of the HOCG ISSN 1759-0108
Page | 15
Diagram 4: Age of directors for the year 2011 in Greek Maritime
Companies (n=31)
At the end of 2011 the average Chairperson’s age is 50 years old while the CEO’s is 46
years old. It should be noted that the youngest CEO was 33 years old and the oldest
was 70 years old. Besides, the younger Chairperson was 41 and the oldest 79 years old.
Another thought-provoking finding is that when we calculated the age of the sole
Chairpersons and CEOs for the whole decade, we found that the average age of the
sole Chairpersons was 55 years old while the sole CEOs had an average age of 45.
B) Foreign Nationals in the Board
An interesting finding was the presence of non Greek nationals in the Board. Out of the
250 directors in the 33 Boards we note that there were 110 foreign nationals directors
with an average of 3.3 members per board. Every Board had at least one foreign
national as a director, while the maximum number of foreigners identified was 7.
The existence of non-Greek directors brings new perspective to the management and
operation of the company. Expanding our findings, we noted that more than half of
the companies (54.5%) had up to 3 foreign nationals in their boards, while in 33.4% of
the companies foreign nationals were between 4 and 5. Remarkably, in 12.1 % of our
sampling companies the boards had between 6 and 7 foreign nationals (Diagram 5).
Various scholars support that there are great advantages of improved board
composition through the addition of foreign national’s directors, as foreigners could
bring knowledge on corporate governance practices to meet the highest international
19.40%
64.50%
16.10%
Age of directors in Greek Maritime
Companies
up to 50 years old
More than 50 and up to
60 years old
more than 60 years old

©Review of the HOCG ISSN 1759-0108
Page | 16
standards. Due to the global operation of shipping, foreigners with their international
perspective and expertise could enhance the advisory capability of Boards significantly.
Diagram 5: Number of Foreign Nationals in Greek Maritime
Boards (n=33)
C) Gender
It has been widely accepted that BoDs in many industries are male-dominated and the
number of female board members is very low. Nowadays, board diversity is required
more than ever. The recent financial crisis and previous corporate collapses have led to
a re-examination of corporate governance practices and various initiatives have been
taken in some parts of the world for the presence of women in boards. For example, in
Australia it is required that companies listed on the Australian Securities Exchange
should establish measurable objectives for achieving gender diversity and assess
annually both the objectives and progress towards achieving them.
It should be also underlined that women have been found to contribute in corporate
governance due to their “power sharing” style, whereas their presence could bring
long term company success and competitive advantage in the organization.
For the period 2001-2011, 279 out of 292 directorships (BOD positions) were held by
men, with an average of 8.4 per company. Respectively, there were only 13
directorships held by women with an average of 0.4. The sharp discrepancy that exists
between men and women in the board composition is depicted in Table 6.
The total number of directors was 250 after excluding mobility (6 directors) and cross
directorships. Out of these, 240 (96%) were men; while there were only 10 female
directors (4%).
0.00%
10.00%
20.00%
30.00%
40.00%
50.00%
60.00%
more than 5 and
up to 7 foreigners more than 3 and
up to 5 foreigners up to 3 foreigners
13.80%
34.50%
51.70%
Foreign Nationals
Percentage

©Review of the HOCG ISSN 1759-0108
Page | 17
As for the top positions in the board, remarkably there were 3 (8%) Chairpersonships
held by women, whereas 35 (92%) Chairpersonships were occupied by men. Similarly,
4 (9.7%) CEO positions were held by women compared to the 37 (90.3%) men CEOs.
More specifically, for these top positions, only one woman, Mrs. Angeliki Frangou, was
simultaneously the Chairman and the CEO of three different maritime companies
(Navios Maritime Holdings, Navios Maritime Partners and Navios Acquisition), which
preferred the duality structure for their governance. Besides, Mrs. Foteini Karamanlis
was the CEO of Hellenic Carriers.
Total Directorships
Male Directorships
Female Directorships
MEAN 8.8 8.4 .4
STD.DEV 3 3.1 .8
MIN 4 3 .00
MAX 18 17 3
SUM 292 279 13
Table 6: Total Memberships, Men and Women served in Boards
(n=33)
If we focus only on the end of 2011, we deduce that the scenery has not changed at all;
there were again 10 women holding 13 BOD positions. Remarkably, in one company,
Hellenic Carriers, 3 out of the 5 board members, were women.
3.2 Board size
Board Size is of paramount importance for studying the board structure and many
researchers have questioned whether there is an optimal board size. A large volume of
literature has also examined the effect of board size on corporate performance.
Besides, there are researchers who support that larger boards can make coordination
and decision making cumbersome while others claim that smaller boards could be
more flexible in the decision making process and more likely to function effectively.
At the end of 2011, the average board size was 6.5, noting that most companies prefer
a board between 6 and 7 members as depicted in Diagram 6. The smallest board
comprised 4 members and the largest 10.

©Review of the HOCG ISSN 1759-0108
Page | 18
Diagram 6: Average Board Size For the year ended 31.12.11
For the whole period 2001-2011 the average board size of the 33 companies included
in our sample is 6.5, indicating that the findings for these 11 years are very similar to
the ones of the year ended 31.12.2011 (Diagram 7).
Diagram 7: Average Board Size for the period 2001-2011
We should also note that the average board size, as of 31/12 each year, fluctuated
from 6 to 9 members in the years 2001—2011 (Diagram 8).
up to 5 members
more than 5 and up to 7 members
more than 7 and up to 9 members
more than 9 members
0% 10% 20% 30% 40% 50% 60% 70%
27.60%
62.10%
10.40%
3.40%
Average Board size for 2011
up to 5 members
more than 5 and up to 7 members
more than 7 and up to 9 members
more than 9 members
0% 10% 20% 30% 40% 50% 60% 70%
24.20%
60.60%
12.20%
3.00%
Average board size 2001 - 2011

©Review of the HOCG ISSN 1759-0108
Page | 19
Diagram 8: Yearly Average Board size as of 31/12
Concluding our remarks for the board size, most of these maritime companies (42.4%)
prefer their Board to be comprised of 7 members.
Another remarkable variable of our study is the Total Board Members Served in each
one company for the period 2001-2011. In 19 out of the 33 companies (57.6%), we
note that 7 to 10 members served their board for the respective period. The average
number of directorships, namely the number of positions that boards have on each
maritime company, was 9 with a standard deviation of 3.
Diagram 9: Total Board Members served for the period 2001-2011
7.00
8.50 8.508.33
6.31
6.716.38
6.86 6.70 6.836.55
0.00
1.00
2.00
3.00
4.00
5.00
6.00
7.00
8.00
9.00
2001 2002 2003 2004 2005 2006 2007 2008 2009 2010 2011
Yearly Average Board Size
Average Board Size
up to 6 members
from 7 to 10 members
from 11 to 14 members
from 15 to 18 members
0% 10% 20% 30% 40% 50% 60%
21.20%
57.60%
15.10%
6.10%
Total members served

©Review of the HOCG ISSN 1759-0108
Page | 20
21.20%
18.20%
33.30%
21.20%
6.10%
up to 24 months more than 24 and up to 48 months
more than 48 and up to 72 months more than 72 and up to 96 months
more than 96 months
3.3 Board Tenure
Board tenure reveals the sum of the serving period (in months) of all directors.
Experience directors with long tenures could bring significant advantages to the
organization. Directors with longer board experiences perform their duties with
greater skills. Nevertheless, different findings have also been presented demonstrating
that longer tenure could befriend management at the expense of shareholders.
Balancing distribution of length of tenure across board members could represent an
efficient mix of “old” and “new” thinking.
At this point we should mention that shipping companies have stable boards without
many changes in their composition each year. For example, for the 31 companies
operating in 2011, we found in total 6 departures and 3 new appointments of
Directors. For the top positions in the Board, we noticed only one CEO departure and a
new CEO appointment. No change took place in any position of Chairman.
The average tenure of the board members was between 3 and 4 years although this
term of service can vary significantly, and average board tenure may range from 3 up
to 86 months (Diagram 10). For the Boards with low tenure, we should mention that
this may be explained by the year listed in a Stock Exchange.
The average Tenure of Directors, after excluding the tenure of the Chairman and CEO,
was 40.44 months with a high standard deviation of 20.3.
Diagram 10: Average Tenure of the whole Board (n=33)

©Review of the HOCG ISSN 1759-0108
Page | 21
24.20%
18.20%
30.30%
21.20%
6.10%
up to 24 months
more than 24 and up to 48 months
more than 48 and up to 72 months
more than 72 and up to 96 months
more than 96 months
Interestingly, the average Tenure of CEO was 51.3 months with a standard deviation of
30 months. More than half of these companies have CEOs served more than 4 years. In
some companies, the CEO has served the company for approximately 10 years.
Diagram 11: Average Tenure of the CEO (n=33)
As for the average Tenure of the Chairman, we noted that it had an average of 51.84
with a standard deviation of 28.55 months. A high percentage of- 60.6%- of these
companies have Chairpersons who serve for more than 4 years in the Board.
Diagram 12: Average Tenure of the Chairman (n=33)
Other variables that we included in our analysis are the average tenure of the sole
Chairpersons and the sole CEOs.
21.20%
18.20%
33.30%
21.20%
6.10%
up to 24 months
more than 24 and up to 48 months
more than 48 and up to 72 months
more than 72 and up to 96 months
more than 96 months

©Review of the HOCG ISSN 1759-0108
Page | 22
For the 17 sole Chairpersons their average tenure was 52.99 months while for the 17
sole CEOs was 50.29. The average tenure of CEO and Chairman we presented above
was almost at the same level (just slightly lower) than the tenure of the sole Chairman
and CEO.
3.4 CEO Duality
Our research findings indicate that the total number of chairpersonships for these
eleven (11) years was 39 while the exact number of Chairpersons was 30 due to cross
directorships. It is notable, that in 29 out of the 33 companies (88%) there was no
change of the Chairperson during the examined period. For the rest of the companies
it was found that three companies had changed their Chairman once and one company
twice.
The total Number of CEO positions was 41 while the exact number of CEOs was 35 due
to cross directorships. There were 28 companies (85%) that didn’t change their CEO at
all, 2 changed only once and 3 that replaced him twice.
Extending our research, we traced the sole Chairpersons and CEOs meaning the
individuals who served exclusively in these two roles-excluding the duality cases and
we found that the total number of sole Chairpersons was 19.
In 17 companies out of 19 (89%) we found one sole Chairperson while 2 companies
(11%) had two and three respectively. Our calculations show that 14 companies out of
33 (42.4%) had none sole Chairman. As for the sole CEOs, it was found that in 17
companies out of 20 (87%) there was one sole CEO served the Board, while in only 2
(13%) we met two and three sole CEOs respectively. Finally, in 16out of the 33
companies in our sample (or 48,5%) no sole CEO was found.
When one person is serving both as a firm’s CEO and Chairman, then CEO duality
occurs. CEO Duality has been characterised as double-edged sword because on the one
hand the monitoring effectiveness of the Board is reduced while on the other hand a
unity of command is evident. There are various cases that CEO duality has been widely
criticised and various proposals have been made for the separation of CEO and board
chair in an attempt to restore organizational performance and shareholder confidence.
In our study the CEO duality was examined as of December of each year for the period
2001-2011. Diagram 13 illustrates that across the years there is a tendency for many
companies towards a more concentrating structure of governance where the Chairman
and the CEO is the same individual. In 18 (58%) out of the 31 companies operating in
2011, CEO and Chairperson positions were in the hands of one person.

©Review of the HOCG ISSN 1759-0108
Page | 23
Diagram 13: Duality vs. Separation for the period 2001-2011
3.5 Cross directorships
A few studies have examined the multiple directorships held by board members but we
consider this variable extremely significant as directors who sit on more than one board
have remarkable experience in the industry and valuable network ties. It goes without
saying that there are time constraints and their ability to perform their different roles
sometimes has been questioned.
In this section we will present the number of directors that were serving in more than
one board simultaneously for these 11 years. For the sake of clarity, it is important to
mention that directorships are positions in the Board held by Directors.
For the period 2001-2011, we found out 292 directorships for which 82 were held by
37 directors who possessed simultaneous positions in two or more different listed
companies’ Boards during their tenure.
Out of these 37 directors, there were 29(8.2%) who held positions in 2 different
boards, while 8 (2.2%) directors served in three companies.
Focusing solely in the year 2011, we note that for the 197 directorships, 39 were held
by 18 directors. From Table 7, we deduce that 15 directors held positions in 2 boards
and there are 3 directors who hold positions in 3 boards.
100%
50% 50%
25%
43% 39% 36%46% 48%
54% 58%
0%
50% 50%
75%
57% 61% 64%54% 52%
46% 42%
CE0 Duality
Duality Separation2001 2002 2003 2004 2005 2006 2007 2008 2009 2010 2011

©Review of the HOCG ISSN 1759-0108
Page | 24
Table 7: Number of Directors who hold more than one position in the BOD
in 2011
FIRST NAME LAST NAME POSITION COMPANY
1
Michael Bodouroglou CHAIRMAN,CEO PARAGON SHIPPING
CHAIRMAN,CEO BOX SHIPS
2
George
Economou CHAIRMAN,CEO DRYSHIPS
DIRECTOR DANAOS CORP.
CHAIRMAN,CEO OCEAN RIG
3
Angeliki
Frangou
CHAIRMAN,CEO NAVIOS MP
CHAIRMAN,CEO NAVIOS MH
CHAIRMAN,CEO NAVIOS ACQUISITION
4
Peter C.
Georgiopoulos
CHAIRMAN AEGEAN MARINE PETROLEUM
CHAIRMAN,CEO GENERAL MARITIME
CHAIRMAN,CEO GENCO
5
Michael G.
Jolliffe
DEPUTY
CHAIRMAN
TSAKOS ENERGY
NAVIGATION
CHAIRMAN STEALTHGAS
6
George
Konomos
DIRECTOR AEGEAN MARINE PETROLEUM
DIRECTOR GENERAL MARITIME
7
Apostolos
Kontoyannis
DIRECTOR DIANA SHIPPING
DIRECTOR EXCEL MARITIME CARRIERS
8
Anastassis
Margaronis
DIRECTOR DIANA SHIPPING
DIRECTOR DIANA CONTAINERSHIPS
9
Symeon
Palios
CHAIRMAN,CEO DIANA SHIPPING
CHAIRMAN,CEO DIANA CONTAINERSHIPS
10
Dimitrios N. Panagiotopoulos DIRECTOR FREESEAS
DIRECTOR SEANERGY MARITIME
11
Ted C.
Petrone
DIRECTOR NAVIOS MH
DIRECTOR NAVIOS ACQUISITION
12
Abel L.
Rasterhoff
DIRECTOR AEGEAN MARINE PETROLEUM
DIRECTOR CAPITAL PRODUCT PARTNERS
13
Charlotte
Stratos
DIRECTOR HELLENIC CARRIERS
DIRECTOR COSTAMARE
14
George
Taniskidis
DIRECTOR EUROSEAS
DIRECTOR SEANERGY MARITIME
15
John P.
Tavlarios
DIRECTOR AEGEAN MARINE PETROLEUM
CEO GENERAL MARITIME
16
Nikolas P.
.
Tsakos
CEO TSAKOS ENERGY NAVIGATION
DIRECTOR DRYSHIPS
17
Prokopios
(Akis)
Tsirigakis
CEO STAR BULK CARRIERS
DIRECTOR OCEAN RIG
18
George
Xiradakis
DIRECTOR DRYSHIPS
DIRECTOR PARAGON SHIPPING

©Review of the HOCG ISSN 1759-0108
Page | 25
4. Summary
Current demands for transparency in the decision making of the organizations have led
boards to take various initiatives so as to ensure a framework in which decisions take
into account the best interests of employees and shareholders. Widely known
corporate scandals, such as those involving Enron and WorldCom, have created an
urgent need for good Corporate Governance practices and specific expertise in the
Boards.
Our annual study captured the status quo on the Board’s characteristics of Greek
owned Maritime Shipping Companies which are listed in foreign Stock Exchanges and
we formulated significant conclusions about their structure.
At this point we should underline that various scholars have found that an effective
board may vary from one industry to another and sometimes, across time, for the
same company; thus, an ideal board structure have not yet been identified. National
and organizational culture, history, size of the company and family ties are only some
of the various factors that have to been taken into consideration.
In our study, the average Board size consists of 6.54 members. Directors stay in office
for 42.5 months on average while there is even more stability with the Chairman’s and
CEO’s position which average 51.8 months and 51.3 months, respectively.
Notably, 87.7% of the companies retained the same Chairperson from 2001-2011 and
the 84.4% of the companies continues without CEO change. It would be interesting in
our next annual study to see if tenure continues to increase over time in an increasing
complex and volatile global economy. For maritime companies, in which a founding
family member plays a prominent role, may benefit from a longer tenure.
Regarding the board’s age, a remarkably high percentage of board members (64.5%) as
of 31.12.11, runs their sixth decade of their life with an average age of 54.6. However,
there is evidence from previous scholar studies that younger directors above 40 years
old could bring fresh ideas to the organization since this demographic is more IT
literate and.
Cross directorships was another significant variable in our study. For the period 2001-
2011, out of the 292 directorships that were, 82 were held by 37 directors who
possessed simultaneous positions in two or more listed companies’ Boards during their
tenure.
For the whole period of these 11 years only 13 out of 192 directorships were held by
women. From our study it is evident that there is plenty of room of public listed
©Review of the HOCG ISSN 1759-0108
Page | 26
maritime companies to consider an increase in the number of women in their boards
as the percentages are dramatically low.
CEO duality attracts significant attention and many proposals have been made for the
separation of the roles. Regarding CEO duality, it is very common in the shipping
companies that the position of the Chairman and the CEO to be held by the same
individual. In 18 out of the 31 companies operating in 2011 (58%,) CEO and Chairman
positions were in the hands of one person.
It is very important to underline, that in Greek shipping companies there are strong
family affiliations and networks. Family members apart from retaining ownership in
the company usually hold key positions such as CEO or Chairman, in an attempt to
control closely the organization. In most cases it is very obvious that family members
are among the major shareholders. We have also noted that in many shipping
companies the Founder serves as the CEO or Chairperson or holds both positions.
The shipping cluster and ship owners contribute significantly to the Greek economy in
a number of ways. Despite the recent financial crisis, Greek shipping companies have
remained competitive and have attracted global recognition. The entrepreneurial
philosophy of ship owners and their family business structure could give us some
useful lessons for healthy corporate governance practices.
Corporate governance may not be in the top priorities’ list of Greek maritime
companies, but, nowadays, it is a key factor towards gaining access to the international
equities’ markets and complies with disclosure requirements. By means of this study,
we believe to have captured the status quo on their Board’s characteristics and
facilitated the quest for solid corporate governance mechanisms.
©Review of the HOCG ISSN 1759-0108
Page | 27
References
Bimco, 2013, Market analysis reports 2013, Available from
https://www.bimco.org/Reports/Market_Analysis/2013.aspx (Accessed: 1 February, 2013)
Hellenic Chamber of Shipping (2013) Available from: http://www.nee.gr/ (Accessed: 1 March, 2013)
Institute of Shipping Economics and Logistics (2012), “ISL Shipping Statistics and Market Review
(SSMR)”, Volume 56 (1/2), pp.1-68
International Monetary Fund (2013), “World Economic Outlook Update”, Available from:
http://www.imf.org/external/pubs/ft/weo/2013/update/01/index.htm, (Accessed: 1 March, 2013)
International Chamber of Shipping, (2013) Available from: http://www.marisec.org/ (Accessed: 1
January, 2013)
Marine Money (2012) “Marine Money’s Rankings of Publicly Traded Shipping Companies”, Vol. 28,
No. 4, pp. 1-81.
Petrofin Research (2012) “2012 Greek fleet statistics” Available from
:http://www.petrofin.gr/Upload/2ndPart-2012-Petrofin_Researcht-GreekFleetStatistics.pdf
(Accessed: 1 February, 2013)
Petrofin Research (2012) “2012 – Research and Analysis: Greek shipping companies”
Available from: http://www.petrofin.gr/Upload/1stdPart-2012-GreekCompanyStatistics.pdf
(Accessed: 1 February, 2013)
PCW, 2011, “Global Shipping Benchmarking Analysis 2011”, Available from
http://www.pwc.com/en_GX/gx/transportation-logistics/assets/riding-the-storm-global-shipping-
benchmarking-analysis-2011.pdf (Accessed: 1 February, 2013)
RsPlatou (2011), “The Platou Report 2011”, Available from:
http://www.platou.com/dnn_site/LinkClick.aspx?fileticket=4pyOacnpros%3D&tabid=84 (Accessed:
1 March, 2013)
RsPlatou (2013), “The Platou Report 2013”, Available from:
http://www.platou.com/dnn_site/LinkClick.aspx?fileticket=ZH6mB%2B9UXqQ%3D&tabid=313
(Accessed: 1 February, 2011)
Theotokas, I. & Harlaftis, G. (2009) Leaders in the World Shipping: Greek Family Firms in
International Business. UK: Palgrave Macmillan
United Nations Conference on Trade and Development (2009), “Review of Maritime Transport
2009”, Available from: http://www.unctad.org/en/docs/rmt2009_en.pdf (Accessed: 1 July, 2011)
United Nations Conference on Trade and Development (2010), “Review of Maritime Transport
2010”, Available from: http://www.unctad.org/en/docs/rmt2010_en.pdf
(Accessed: 1 January, 2013)
United Nations Conference on Trade and Development (2012), “Review of Maritime Transport
2012”, Available from: http://unctad.org/en/PublicationsLibrary/rmt2012_en.pdf (Accessed: 1
January, 2013).

©Review of the HOCG ISSN 1759-0108
Page | 28
Dr. Dimitrios N. Koufopoulos of Brunel Business School is the Scientific Director of the
HOCG and Editor of the Review.
Project Leaders: Aspasia S. Pastra
Contributors: Ioannis P. Gkliatis, Anna N. Dimou
Disclaimer: The views expressed in this newsletter are those of the authors of the research and not those of the Brunel
University, Brunel Business School and the Federation of the Greek Industries and Enterprises.