Embed Size (px)
Citation preview

Page 1 of 35
Board Performance Report Performance Report
For the period ended 31 st December 2017
S
tatu
s
T
rend
Comments
Blood Components
Stocks fell sharply to c25k during the month and have remained at that level to date. The underlying root cause has been under collection as a result of insufficient donor numbers of the right type/location. Stocks are expected to build post January month end but we remain vulnerable to the impact of flu / poor weather until they do.
DTS A positive income trend continues to be seen with overall year to date income growth of 10% for DTS overall. There have
now been 173 adult donor stem cell provisions versus 157 planned year to date (with international issues compensating for lower domestic use). Cornea stocks increased to 313 units by the end of December.
ODT
There were 129 deceased donors in December. Year to date deceased donors are 1.2% behind plan but are 7.5% higher than last year. The number of deceased transplants is now 6.5% lower than plan year to date but 4.4% higher than last year. Living Donors (reported one month in arrears) are 26% lower than plan in the year to date.
Corporate The focus on regulatory overdues has seen numbers decline over the last 2 months. Sickness absence was marginally
higher this month at 3.6%.
Finance
NHSBT is reporting a year to date deficit of £2.4m, £4.7m better than plan. The latest forecast is a £11.7m deficit versus £15.3m planned. The impact of reduced red cell demand and the costs of CSM are impacting the 5 year cash projection to a major degree with a significant cash gap in 2019/20 requiring cost reductions and/or price increases of around 10% to compensate.
Change Programme
The overall transformation programme continues to report at red status. The CSM project continues to report at red status, along with the Networks and Telephony project. Spend in total to date on CSM is £18.2m with £5m spend expected in Q4.
Contents Pages 1. Performance Summary 1 2. Financial Report 2-4 3. Blood Components - Summary 5-16 4. DTS – Summary 17-23 5. ODT – Summary 24-31 6. Group Level Trends 32-33 7. Risk Management 34-35

IncomePlan WTE
(Ave YTD)
Actual
WTE at
period
end
Budget Actual Variance2016-17
Actual
Full Year
BudgetForecast
£k £k £k £k £k £k
Revenue Cash Limit - Organ Donation & Transplantation 46,445 46,445 0 61,697 61,927 61,927
Revenue Cash Limit - Diagnostic and Therapeutic Services 3,130 3,130 0 4,173 4,173 4,173
Blood & Components Income 195,081 193,297 (1,785) 262,506 257,730 256,502
Diagnostic and Therapeutic Services Income 50,697 52,965 2,268 65,377 68,507 70,373
Research & Development 825 1,106 280 1,985 1,101 857
Organ Donation & Transplantation Other Income 9,046 8,982 (65) 11,544 12,062 11,984
All Other Income 5,246 5,366 120 7,266 7,001 6,919
Total Income 310,472 311,290 819 414,548 412,500 412,735
Expenditure
Cost of Sales - Blood Component Stock Movement (259) (962) (702) (143) 0 0
Cost of Sales - Tissues Stock Movement 0 (126) (126) 42 0 0
Organ Donation & Transplantation: Operational Expenditure 404 389 (44,663) (43,913) 749 (60,062) (59,601) (59,168)
Organ Donation & Transplantation: Change Programme 4 16 (3,593) (3,462) 132 (5,216) (6,526) (5,819)
Blood Supply: Manufacturing, Testing & Issue 794 741 (51,115) (51,313) (198) (69,589) (67,484) (67,799)
Blood Supply: Blood Donation 1,410 1,427 (54,609) (53,729) 880 (76,577) (72,309) (71,751)
Blood Supply: Logistics 350 334 (15,592) (15,741) (148) (21,175) (20,649) (21,052)
Diagnostic and Therapeutic Services 849 791 (45,864) (46,110) (246) (60,293) (61,113) (62,035)
Quality 83 87 (3,777) (3,752) 24 (4,783) (5,023) (5,042)
Chief Executive and Board 3 4 (466) (504) (39) (623) (621) (660)
Communications 73 72 (5,210) (5,137) 73 (7,397) (7,363) (7,363)
Estates & Facilities 77 76 (28,506) (28,382) 123 (40,182) (39,211) (39,363)
Finance 98 93 (4,193) (4,252) (59) (5,760) (5,573) (5,675)
Business Transformation Services 27 23 (1,247) (1,034) 213 (1,588) (1,662) (1,366)
Workforce 135 121 (5,783) (5,184) 599 (7,529) (7,710) (7,227)
Information Communication Technology 169 166 (17,112) (17,622) (511) (20,661) (22,814) (23,314)
Clinical Directorate 181 170 (10,766) (10,459) 307 (14,014) (14,168) (13,761)
Research & Development 33 39 (2,799) (3,083) (284) (5,627) (4,443) (4,443)
Change Programme (Blood & Corporate) 6 29 (20,760) (17,391) 3,369 (17,850) (27,842) (26,345)
Miscellaneous and Capital Charges (1,182) (1,486) (304) (439) (2,150) (2,215)
Total Expenditure 4,696 4,576 (317,495) (313,643) 3,852 (419,467) (426,263) (424,398)
Surplus/(Deficit) (7,023) (2,353) 4,671 (4,919) (13,762) (11,663)
Statutory Accounts Presentation
NHSBT Surplus/(Deficit) as above (7,023) (2,353) 4,671 (4,919) (13,762) (11,663)
Add back Notional Cost of Capital 5,238 5,238 0 7,323 7,121 7,121
Remove Revenue Cash Limit (49,575) (49,575) 0 (65,870) (66,100) (66,100)
Deduct Capital Charges Cash Payment (13,158) (13,158) 0 (17,292) (17,544) (17,544)
Net Expenditure (64,519) (59,848) 4,671 (80,758) (90,285) (88,186)
A deficit of £3.6m was reported in December,
£1.8m worse than plan.
Year to date NHSBT is reporting a deficit of £2.4m
versus a planned deficit of £7.0m. This is driven by
a favourable DTS contribution (£1.9m higher
income in TAS, SCDT and RCI), an in-year VAT
return (£1.8m), lower change programme costs in
both Blood/Group (£3.4m) and ODT (£0.9m),
partially offset by an adverse costs of sales
position (£0.7m - red cell stocks lower than
planned).
The current forecast for the year is a £11.7m
deficit (versus £13.8m budgeted). This is £3.2m
lower than the forecast last month, mainly
reflecting lower change programme spend (£2.3m)
and increased Blood Component income (£1.0m).
Balance sheet - current assets were £58.8m at the
end of December 2017 with a cash balance of
£49.9m (including capital charges payable of
£4.4m). The projected year end cash balance is
now £30m.
Debtor days were at 26 in December, equal with
last month, but higher than target of 22 days.
Year to date
NHSBT REVENUE STATEMENT - FOR THE PERIOD ENDED 31 DECEMBER 2017
Page 2 of 35

NHSBT CASH FLOW - FORECAST 2017/18
Actual Actual Actual Actual Actual Actual Actual Actual Act ual Forecast Forecast ForecastApr-17 May-17 Jun-17 Jul-17 Aug-17 Sep-17 Oct-17 Nov-17 Dec -17 Jan-18 Feb-18 Mar-18 Total
£k £k £k £k £k £k £k £k £k £k £k £k £k
Opening bank balance 32,755 30,381 51,874 37,988 50,333 54,137 51,918 48,521 50,507 49,920 47,209 37,305 32,755
ReceiptsDebtors & Other Receipts 19,729 34,209 25,544 35,518 32,118 28,783 34,402 29,645 30,683 27,730 28,784 37,980 365,125Revenue Cash Limit 0 16,525 0 5,508 5,508 5,509 5,508 5,508 5,509 5,508 5,508 5,509 66,100Capital Cash Limit 0 0 0 2,500 0 0 2,000 0 0 0 500 1,500 6,500 Total income 19,729 50,734 25,544 43,526 37,626 34,292 41,910 35,153 36,192 33,238 34,792 44,989 437,725
PaymentsStaff Expenses 9,778 16,766 16,853 16,745 16,520 17,999 17,230 17,055 16,628 16,671 16,689 22,933 201,867Other Revenue Payments 12,241 11,980 22,306 14,270 17,040 18,425 19,105 15,967 19,729 18,778 18,735 26,011 214,587Capital Charges 0 0 0 0 0 0 8,772 0 0 0 8,772 0 17,544Capital Payments 84 495 271 166 262 87 200 145 422 500 500 3,368 6,500 Total costs 22,103 29,241 39,430 31,181 33,822 36,511 45,307 33,167 36,779 35,949 44,696 52,312 440,498
Closing bank balance 30,381 51,874 37,988 50,333 54,137 51,918 48,521 50,507 49,920 47,209 37,305 29,982 29,982
Debtor Days (Target is 22 days) 28 20 24 20 19 27 23 26 26YTD BPPC By Value % (Target is 95%) 99.0% 97.3% 98.3% 98.6% 98.5% 98.6% 98.6% 98.7% 98.7%YTD BPPC By Number % (Target is 95%) 97.8% 97.9% 98.3% 98.2% 98.1% 97.9% 98.0% 97.8% 97.8%
Top 5 Overdue Debtors NBS/ODT £000'sTotal
Overdue £000's
1-30 Days overdue £000's
31-60 Days
overdue £000's
61-90 Days
overdue £000's
>90 Days overdue £000's
Comments
King's College Hospital NHS Foundation Trust 1,966 662 587 203 514 £466k received 08/01 - remainder invoices not authorised Cambridge University Hospitals NHS Foundation Trust 774 425 321 8 20 Invoices not authorised for paymentImperial College Healthcare NHS Trust 760 349 103 74 234 £200k received 08/01 - remainder invoices not authorised Barking, Havering & Redbridge Hospitals NHS Trust 715 160 152 173 230 £617k received 02/01 - remainder invoices not authorised Buckinghamshire Healthcare NHS Trust 696 149 159 144 244 Invoices not authorised for payment
Page 3 of 35

Year to date Actual £mBlood &
Components inc. R&D
RCI H&I Reagents IBGRL Tissues CMT CBC BBMR CBB TAS ODT TOTAL
IncomePrices 196.1 10.2 10.0 1.2 0.9 9.6 7.0 - 2.8 0.9 6.8 - 245.6Central Funding from DHAs - - - - - - - - - - - 8.9 8.9Grant in Aid - - - - - - - 0.0 1.3 1.7 - 46.4 49.4Other 3.8 0.3 0.3 - - - 0.6 1.0 0.1 0.9 0.4 0.1 7.4
Total Income 199.9 10.5 10.3 1.2 0.9 9.6 7.6 1.0 4.2 3.4 7.2 55.4 311.3
ExpenditureVariable Costs
Consumables (30.8) (0.8) (2.7) (0.4) (0.2) (1.4) (1.4) (0.3) (0.5) (0.4) (2.6) (2.6) (43.8)Other - - - - - - - - - - - - -
Total Variable Costs (30.8) (0.8) (2.7) (0.4) (0.2) (1.4) (1.4) (0.3) (0.5) (0.4) (2.6) (2.6) (43.8)
Variable Contribution 169.1 9.7 7.6 0.9 0.7 8.2 6.2 0.7 3.7 3.1 4.6 52.9 267.5
Direct CostsPay (65.0) (5.5) (4.8) (0.6) (0.9) (4.9) (3.0) (0.6) (1.0) (1.6) (1.9) (18.8) (108.6)Non Pay (15.5) (0.5) (0.7) (0.1) (0.1) (2.2) (0.6) (0.2) (0.7) (0.4) (0.6) (22.9) (44.5)
Total Direct Costs (80.5) (6.0) (5.5) (0.6) (1.0) (7.1) (3.6) (0.8) (1.7) (2.0) (2.5) (41.8) (153.1)
Direct Contribution 88.6 3.8 2.1 0.2 (0.3) 1.1 2.6 (0.1) 2.0 1.1 2.2 11.1 114.4
Direct SupportOperational Directorate costs (4.1) (0.1) (0.1) (0.0) (0.0) (0.1) (0.1) (0.0) (0.0) (0.0) (0.1) (0.9) (5.7)Logistics (15.4) (0.1) (0.0) (0.0) - (0.0) (0.0) - (0.0) (0.1) (0.1) (0.0) (15.7)Clinical (6.6) (0.3) - - - (0.1) (0.1) - (0.1) (0.1) (0.2) (0.7) (8.3)Attributable Estates costs (15.9) (0.9) (0.7) (0.1) (0.3) (1.0) (1.0) (0.0) (0.1) (0.1) (0.1) (0.9) (21.2)Attributable IT costs (3.2) (0.1) (0.1) (0.0) (0.0) (0.0) (0.0) - (0.0) (0.0) (0.0) (1.8) (5.4)
Depreciation / Cost of CapitalDepreciation / Cost of Capital (1.5) (0.2) (0.3) (0.0) (0.1) (0.2) (0.4) (0.1) (0.1) (0.1) (0.2) (0.4) (3.6)Total Direct Support (46.7) (1.8) (1.2) (0.2) (0.5) (1.5) (1.6) (0.1) (0.5) (0.5) (0.6) (4.8) (59.9)
Notional Internal Income Uplift (1.6) (0.1) 1.5 0.2 0.3 0.0 0.0 (0.0) (0.4) 0.0 0.0 (0.0) (0.0)Cost of Sales (1.0) - - - - (0.1) - - - - - - (1.1)
Contribution to Unallocated Costs 39.4 1.9 2.4 0.2 (0.5) (0.5) 1.1 (0.3) 1.1 0.6 1.6 6.3 53.4
Total Allocated Costs (160.5) (8.6) (7.9) (1.0) (1.4) (10.1) (6.5) (1.3) (3.1) (2.9) (5.6) (49.2) (257.9)
Unallocated Costs ApportionedDirectorate costs (15.6) (0.8) (0.7) (0.1) (0.1) (0.9) (0.6) (0.1) (0.3) (0.3) (0.5) (4.6) (24.5)Estates costs (4.6) (0.2) (0.2) (0.0) (0.0) (0.3) (0.2) (0.0) (0.1) (0.1) (0.1) (1.4) (7.2)Depreciation / Cost of Capital (2.1) (0.1) (0.1) (0.0) (0.0) (0.1) (0.1) (0.0) (0.0) (0.0) (0.1) (0.6) (3.2)
Total Unallocated Costs (22.3) (1.1) (1.0) (0.1) (0.2) (1.3) (0.8) (0.2) (0.4) (0.4) (0.7) (6.6) (34.9)
Operating Net Surplus / (Deficit) 17.1 0.9 1.4 0.1 (0.7) (1.7) 0.3 (0.4) 0.8 0.2 0.9 (0.3) 18.5
Transformation Costs (17.4) - - - - - - - - - - (3.5) (20.9)
Total Allocated Costs Inc Transformation (177.9) (8.6) (7.9) (1.0) (1.4) (10.1) (6.5) (1.3) (3.1) (2.9) (5.6) (52.6) (278.7)
Net Surplus / (Deficit) Inc Transformation (0.3) 0.9 1.4 0.1 (0.7) (1.7) 0.3 (0.4) 0.8 0.2 0.9 (3.8) (2.3)
RAG STATUS (Actuals V Plan) G G G G G R G G G G G G G
R&D PROGRAMME COSTS (3.0) (0.7) (0.1) - - (0.3) (0.4) - - - - (0.0) (4.6)
NHSBT HIGH LEVEL ABC CONTRIBUTION ANALYSIS FOR THE PERIOD ENDED 31 DECEMBER 2017
Diagnostics Stem Cells
Page 4 of 35
Page 5 of 35
DIVISION PILLAR BLOOD 2020 – STRATEGIC TARGETS YTD RAG
RAG CHANGE
PERFORMANCE
72% of blood donors scoring =/> 9/10 for satisfaction. G - 78.7% vs plan of 75% – Chart 21.
No. of complaints per million donation G - 0.38% vs plan of 0.44% – Chart 22
% of whole blood donations in donor centres G - Month at 20.0%.
% of 9 bed sessions G - 71.0% vs plan of 80%.
Blood Donation Productivity: units/FTE/year G - 1,395 vs plan of 1,410 – charts 29/30.
Number of Donors Donating over the last 12 months (000’s) R Worse 825.0k vs plan of 842.9 – Chart 23.
Frequency of Donation (overall) G -- 1.86 (vs 1.85 planned) - (Chart 23).
Number of O- neg Donors donating last 12 months (000’s) R - 103.4k vs 107.1k planned – Chart 24.
Frequency of Donation (O neg donors) A - 1.96 versus 1.91 planned – Chart 24.
Blood Donation and the Donor Experience
Recruitment of new Ro donors - 7k R - 2.8k versus 5.8k target
Red Cell Blood Stocks – Alert Levels R Worse Above 3 day alert on 2 occasions– chart 14/15.
Platelet Demand vs. Stock levels R - Stocks were below target - 2 occasions in month.
Number of ‘critical’ and “major” regulatory non-compliances G - None reported in the month.
97% of Products Issued on Time A - On target at 96.9% – chart 3.
Manufacturing Productivity (units/FTE/year) A - 10.1k vs 10.3k planned – Chart 27.
BLOOD
Supply-Chain Operations
Testing Productivity (units/FTE/year) A - 28.9k vs plan of 29.7k – Chart 28.
Page 6 of 35
DIVISION PILLAR BLOOD 2020 – STRATEGIC TARGETS YTD RAG
RAG CHANGE
PERFORMANCE
BLOOD Supply Chain Operations
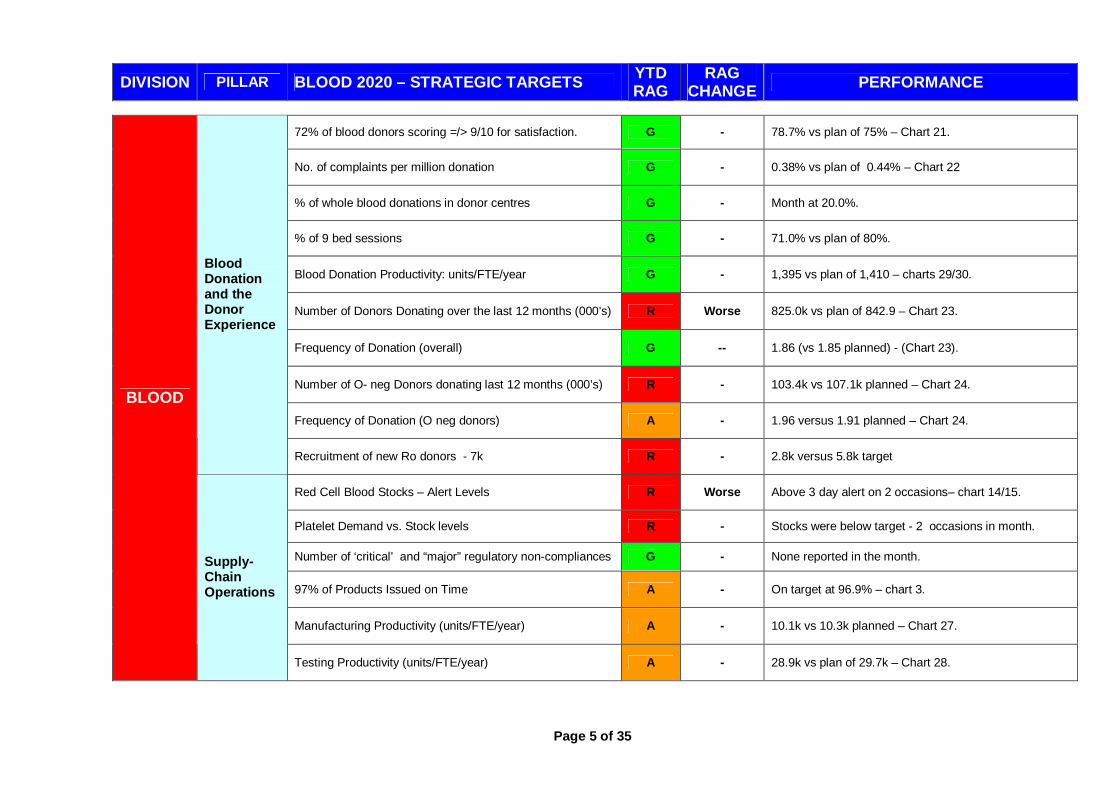
70 % hospitals scoring =/> 9/10 for satisfaction (chart 4). A - December at 66% (better than target). Next survey March 2018
• Issues in December were 1.9% higher than forecast (with a large demand seen in w/c 18 December). In addition, Collections were 2% lower than plan
(especially during w/c 11 December as a result of snow/ice) and hence stocks fell sharply to c25k around mid month (c 4.5 days) and have stayed at this level to date. Stocks being at this level (and with low levels of O negative and B negative), for his period of time, is unprecedented and we remain vulnerable to poor weather (and short term demand fluctuation) until they can be built back to above 6 days.
• Although stocks were specifically impacted in the month by short term issues we entered December with lower stocks than planned (and with the vulnerable
groups already low) and hence did not have the headroom to cope with the fluctuation seen. In turn, this reflects under collection over the past few months as a result of falling numbers of active donors of the right group / locations and an inability to effectively utilise our deployed capacity. The total number of active whole blood donors, and the number of active O neg (and B neg) donors are both below plan, with the latter at red status and continuing to fall (charts 23 and 24).
• During December, efforts were focused on improving stock availability via pushing work in progress and, during January, collections have been well above
plan (especially the first week of January). Demand, however, continues to be comparatively high and we anticipate that stocks will remain at ca 25k through January before stocks start to build.
• Due to the donor shortfall, collection capacity is having to being retained, rather than being reduced in line with falling demand over the longer term. As a
result productivity is starting to fall (chart 27), as well as capacity utilisation, and will run significantly short of Blood 2020 targets. Marketing costs will also require a significant increase to re-build the donor base (an additional £2m is being assumed for 2018/19).
• The proportion of O neg issues to total issues was higher this month at 13.6% and, in the year to date, is at 13.4% (versus 13.1% for full year 2016/17).
Demand however, appears to be falling and may reflect NBTC guidance to use O positive in massive trauma cases where possible. • OTIF in December was 96.6% (versus 97% target) with the year to date marginally below target at 96.9%. The two main drivers of the OTIF fails continue to
be insufficient supply of Ro red cells to met hospital requests (36% of total) and ‘Timing Only’ fails (39% of the total). By centre, Tooting, Colindale and Basildon continue to record the highest numbers of Ro fails. Timing only performance decreased in December mainly due to Manchester and ongoing ordering protocol issues with the Central Manchester Foundation Trust.
• In order to meet the increasing Ro demand £1m has been set aside from transformation funds to pay for the recruitment of black donors and we would expect
to fully spend this by year end. At the end of December the number of active black blood donors continues to be much lower than planned (11,160 vs 18,846), compounded by a lower than anticipated conversion rate for new recruits. As a result the increase in new black donors donating is much lower than planned (3,612 in the year to date vs 10,478 planned).

Page 7 of 35
• The red cell loss rate was higher in December at 4.91% with the year to date (4.57%) higher than both plan (3.60%) and previous year (3.86%). Red cell process losses are now well in excess of historic levels and continue to develop adversely.
• The red cell expiry rate was lower in December at 1.20% with the year to date (1.51%) also higher than the previous year (1.29%) and target (1.25%). At a
group level 983 of the 1,398 red cell expiries in the month were A negative and continues to reflect over collection of A negative whole blood to manufacture platelets (in lieu of a lack of A negative CD platelet donors).
• Platelet stocks in December came under significant pressure during the month with 15 out of 19 working days between 1-2 days stock and below the 1 day
alert on the 6th December and two alert level notifications to hospitals during the month. At a group level group A- and AB- was below the alert level on 3 days. Early January has seen a continuation of the trend with overall stocks lower than the alert level on the 4th January 2018 and with the majority of working days between 1-2 days stock. Additionally groups A+ and AB- have been below the alert level on two consecutive days.
• Platelet donors (in total and for A negative) continue to be around 10% lower than plan albeit the numbers appear to have stabilised with the attrition over the
last few months halted. Until donor numbers are increased the expiry of A negative red cells (above) will continue to be high.
• The number of faints in the month was better at 158 and better than target (160). The number of rebleeds was higher than last month at 30 although level with target (30).
• Donor satisfaction improved this month to 79% and continues to be better than plan (75%). Donor complaints (excluding those complaints related to consolidation /
team closures and also those related to cancellation of sessions) were better this month at 3.8k (November 3.9k), and also better than plan of 4.4k. The primary drivers for complaints are “cancellation of session”, “slot availability”, “not seen at appointment time” and also “staff attitude”. Work is ongoing to review our SMS communications with donors and with a stakeholder workshop planned.
• Sickness absence in logistics was marginally worse this month at 4.7%
• There was 1 SABRE reportable events this month - this related to an irradiated unit labeling error.
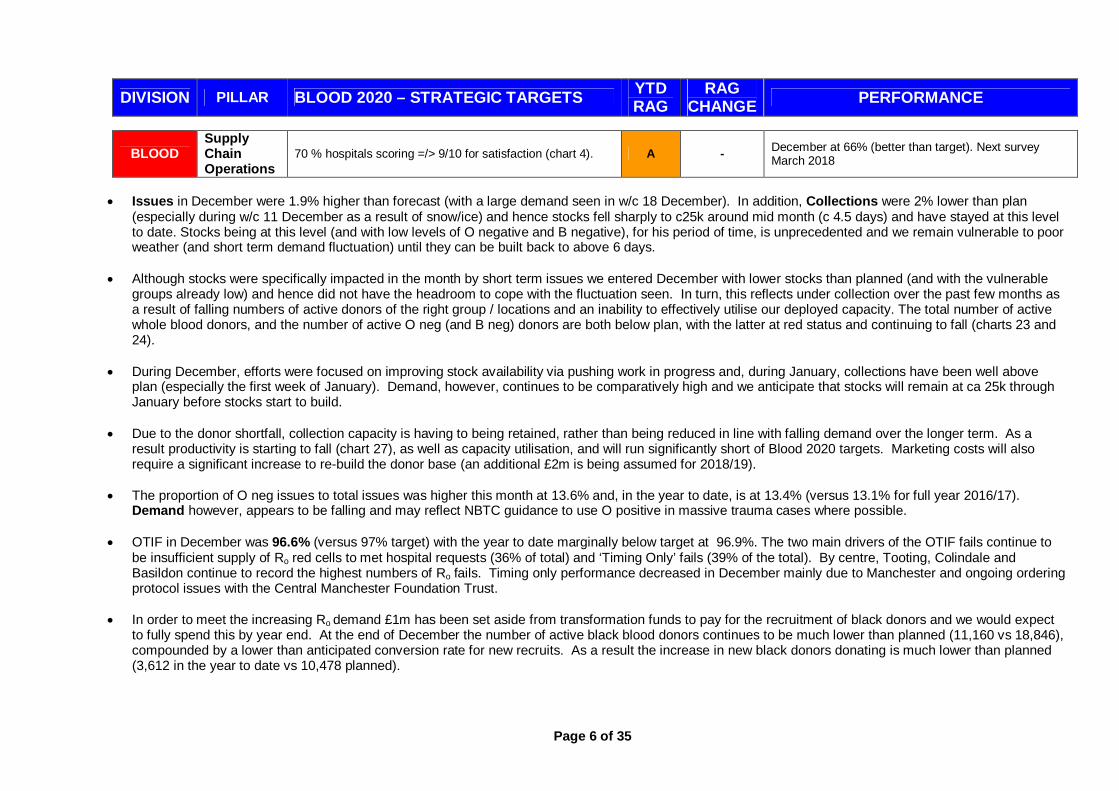
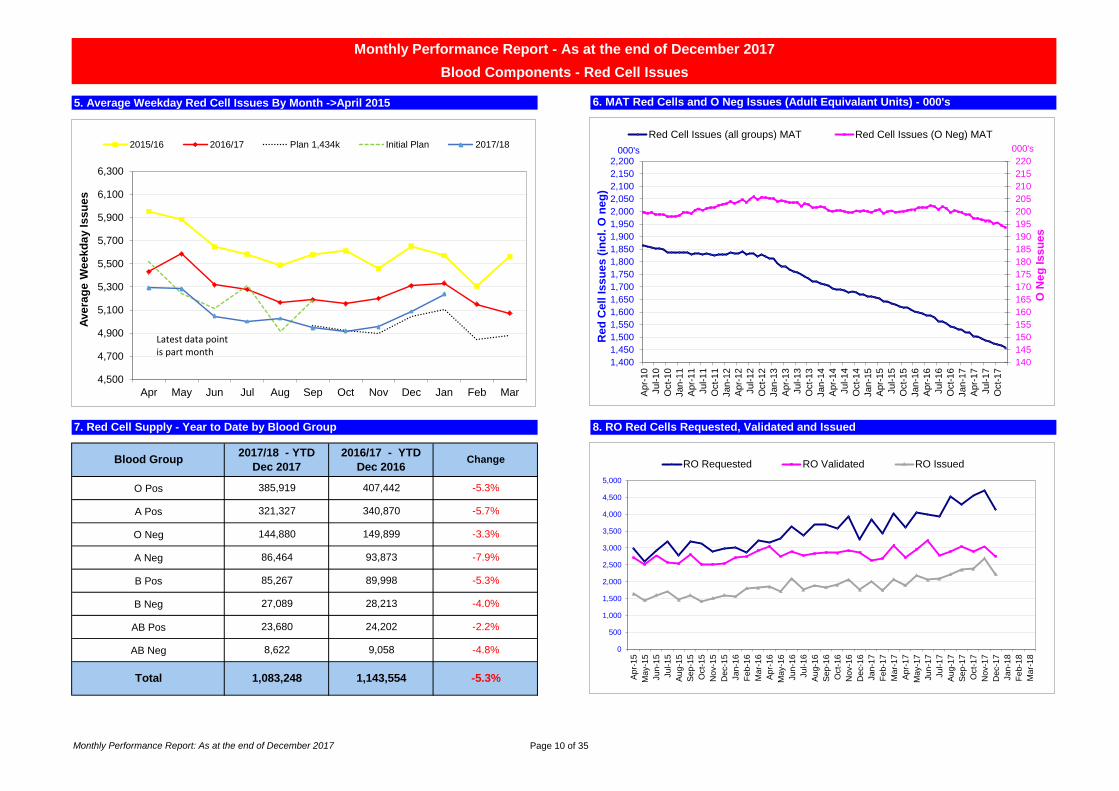
• There were no major/critical non-compliances reported this month. • The demand forecast for red cells in 2017/18 has improved slightly this month to 1.439m (1.434m last month) although it continues to be lower than the level
agreed with NCG of 1.461m units. The demand forecast for 2018/19 of 1.398m units, agreed with the NCG in early November, has been revised downward to 1.390m. Platelet demand has remained unchanged at 0.260m for 17/18 through to 19/20.
Year 2016-17 actual
2017-18 forecast
2018-19 forecast
2019-20 forecast
2020-21 forecast
2021-22 forecast
Red cell issues (million) 1.522 1.439 1.390 1.333 1.282 1.231
% change vs 2016/17 - -5.5% -8.7% -12.4% -15.8% -19.1%

Page 8 of 35
• The 5 year financial projection is materially impacted by the costs of CSM and the impact of lower demand. In addition, the removal of the 1% pay inflation cap in 2018/19 and now also higher marketing costs (to correct both the current donor shortfall but also the risk from the impact of the Interval/Compare studies) are further impacting the projection, despite a successful round of costs savings over the last few months. On current projections there will be a significant cash shortfall from 2019/20 onwards and, although the 2018/19 price rise has reduced the impact, further significant price increases and/or cost reductions will be required to establish a robust financial position.
Blood Supply - Status of Strategic Projects per TPB reporting:
Project title Status This RAG
Last RAG
Approved Cost
(£m’s)
F/Cast Cost
(£m’s)
F/cast Benefit (£m’s)
Planned to
complete
F/Cast to
complete Supply Chain Modernisation (National Operations) Delivery G G 6.5 6.5 1.4 Oct 17 Jan 18
Core Systems Modernisation Delivery R R 11.4(i) (1.6) 14.8 1.2 Jan 20 Dec 19
Euro Blood Pack 2 Delivery A A 0.4 0.3 0.7 Aug 18 Jun 18 Leicester Mobile Team Base & Donor Centre Relocation Delivery A R 1.2 1.2 0.1 May 18 Oct 18
HEV Universal Screening Delivery A A N/A(ii) N/A N/A Jan 18 Jan 18 SotF – Session Connectivity Pilot Start-Up G G 0.1 0.1 0.3 May 18 Nov 18 SotF – Continuous Care Delivery G G 0.8 0.8 1.4 Apr 19 Apr 19 SotF – Unconstrained Supply Plan Delivery G G 1.7 N/A N/A Nov 18 Nov 18 E-Rostering Delivery G G 0.2 0.2 N/A Apr 18 Jul 18 NTMRL Database Upgrade Delivery A A 0.1 0.1 N/A Jan 18 Mar 18 West End Donor Centre Expansion Start-Up G N/A 0.5 0.5 0.4 N/A Jan 19
Notes: i) This is the non-recurring figure for 2017/18. Recurring figure in brackets. ii) No project budget required – contract related costs are not part of project budget.

1. Major QIs raised per month - Blood Supply Directorate 2. % of Patients Receiving Grade A or B1 HLA Matched Platelets H&I # 5
Annual
Target
YTD
Target
YTD
ActualRAG
YTD RAG
Trend
75.0% 75.0% 71.2% A -
3. Percentage of Products Issued OTIF BC # 1
Annual
Target
YTD
Target
YTD
Actual
YTD
RAG
YTD RAG
Trend
Annual
Target
YTD
Target
YTD
Actual
YTD
RAG
YTD RAG
Trend
97.00% 97.00% 96.89% A - 70% 70% 66% A Worse
YTD Performance
% On Time In Full delivery
4. Hospital Satisfaction
YTD Performance
Hospitals rating satisfaction at >/=9/10
Blood Components - Blood Collection: Customer Service
Monthly Performance Report - As at the end of December 2017
Blood Components - Safety and Compliance
YTD Performance
% of patients receiving A or B1
platelets
0
10
20
30
40
50
60Jan
-17
Feb
-17
Ma
r-1
7
Apr-
17
Ma
y-1
7
Jun
-17
Jul-1
7
Aug-1
7
Sep-1
7
Oct-
17
No
v-1
7
De
c-1
7
Blood Donation Manufacturing & Logistics
0.0%
10.0%
20.0%
30.0%
40.0%
50.0%
60.0%
70.0%
80.0%
Jan-1
7
Fe
b-1
7
Ma
r-1
7
Ap
r-1
7
Ma
y-1
7
Ju
n-1
7
Jul-17
Aug-1
7
Sep-1
7
Oct-
17
No
v-1
7
De
c-1
7
Grade A Grade B1 Target
90.0%
91.0%
92.0%
93.0%
94.0%
95.0%
96.0%
97.0%
98.0%
99.0%
100.0%
Jan-1
7
Feb
-17
Ma
r-1
7
Apr-
17
Ma
y-1
7
Jun-1
7
Jul-1
7
Aug-1
7
Sep-1
7
Oct-
17
No
v-1
7
De
c-1
7OTIF Actual OTIF Plan
70% 70% 70% 70%
76%
84%
76%
66%
50%
55%
60%
65%
70%
75%
80%
85%
90%
Ma
r-1
7
Jun-1
7
Sep-1
7
De
c-1
7
Plan Actual
Monthly Performance Report: As at the end of December 2017 Page 9 of 35
5. Average Weekday Red Cell Issues By Month ->April 2015 6. MAT Red Cells and O Neg Issues (Adult Equivalant Units) - 000's
7. Red Cell Supply - Year to Date by Blood Group
O Pos
A Pos
O Neg
A Neg
B Pos
B Neg
AB Pos
AB Neg
Monthly Performance Report - As at the end of December 2017
Blood Components - Red Cell Issues
Blood Group2017/18 - YTD
Dec 2017
2016/17 - YTD
Dec 2016Change
8. RO Red Cells Requested, Validated and Issued
385,919 407,442 -5.3%
27,089 28,213 -4.0%
85,267 89,998 -5.3%
86,464 93,873 -7.9%
321,327 340,870 -5.7%
Total 1,083,248 1,143,554 -5.3%
144,880 149,899 -3.3%
8,622 9,058 -4.8%
23,680 24,202 -2.2%
140
145
150
155
160
165
170
175
180
185
190
195
200
205
210
215
220
1,400
1,450
1,500
1,550
1,600
1,650
1,700
1,750
1,800
1,850
1,900
1,950
2,000
2,050
2,100
2,150
2,200
Ap
r-1
0
Ju
l-1
0
Oct-
10
Jan-1
1
Apr-
11
Jul-1
1
Oct-
11
Jan-1
2
Apr-
12
Jul-1
2
Oct-
12
Jan-1
3
Ap
r-1
3
Ju
l-1
3
Oct-
13
Ja
n-1
4
Ap
r-1
4
Jul-1
4
Oct-
14
Jan-1
5
Apr-
15
Jul-1
5
Oct-
15
Jan-1
6
Apr-
16
Jul-1
6
Oct-
16
Ja
n-1
7
Ap
r-1
7
Ju
l-1
7
Oct-
17
O N
eg
Is
su
es
Re
d C
ell
Is
su
es
(in
cl.
O n
eg
)
Red Cell Issues (all groups) MAT Red Cell Issues (O Neg) MAT
000's000's
4,500
4,700
4,900
5,100
5,300
5,500
5,700
5,900
6,100
6,300
Apr May Jun Jul Aug Sep Oct Nov Dec Jan Feb Mar
Ave
rag
e W
ee
kd
ay I
ss
ue
s
2015/16 2016/17 Plan 1,434k Initial Plan 2017/18
Latest data point is part month
0
500
1,000
1,500
2,000
2,500
3,000
3,500
4,000
4,500
5,000
Apr-
15
May-1
5
Jun
-15
Jul-
15
Aug-1
5
Sep-1
5
Oct-
15
No
v-1
5
De
c-1
5
Jan
-16
Feb-1
6
Mar-
16
Ap
r-16
Ma
y-1
6
Jun
-16
Jul-
16
Aug-1
6
Sep-1
6
Oct-
16
No
v-1
6
De
c-1
6
Jan-1
7
Fe
b-1
7
Ma
r-1
7
Ap
r-17
Ma
y-1
7
Jun-1
7
Jul-
17
Aug-1
7
Sep-1
7
Oct-
17
Nov-1
7
De
c-1
7
Jan
-18
Fe
b-1
8
Ma
r-1
8
RO Requested RO Validated RO Issued
Monthly Performance Report: As at the end of December 2017 Page 10 of 35
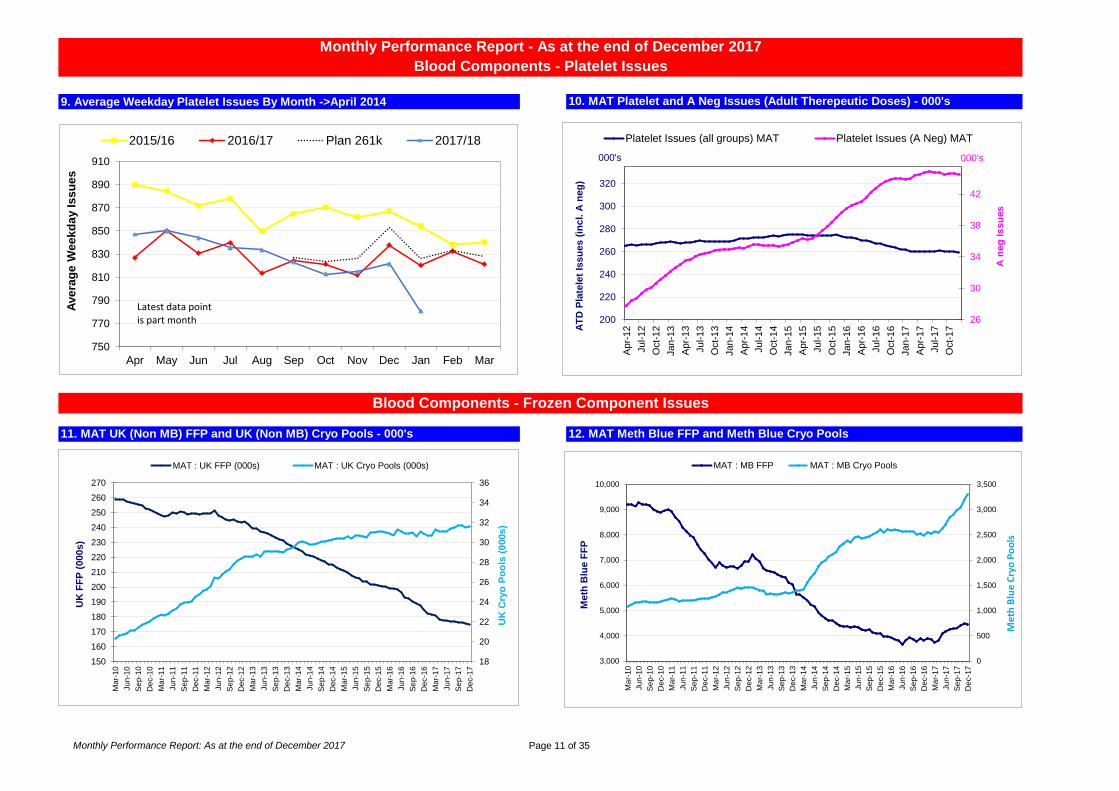
9. Average Weekday Platelet Issues By Month ->April 2014 10. MAT Platelet and A Neg Issues (Adult Therepeutic Doses) - 000's
11. MAT UK (Non MB) FFP and UK (Non MB) Cryo Pools - 000's 12. MAT Meth Blue FFP and Meth Blue Cryo Pools
Monthly Performance Report - As at the end of December 2017
Blood Components - Platelet Issues
Blood Components - Frozen Component Issues
0
500
1,000
1,500
2,000
2,500
3,000
3,500
3,000
4,000
5,000
6,000
7,000
8,000
9,000
10,000
Ma
r-10
Jun
-10
Se
p-1
0
Dec-1
0
Ma
r-11
Jun
-11
Se
p-1
1
Dec-1
1
Ma
r-12
Jun
-12
Se
p-1
2
Dec-1
2
Ma
r-13
Jun
-13
Se
p-1
3
Dec-1
3
Mar-
14
Jun
-14
Se
p-1
4
Dec-1
4
Ma
r-15
Jun
-15
Se
p-1
5
Dec-1
5
Ma
r-16
Jun
-16
Se
p-1
6
Dec-1
6
Ma
r-17
Jun
-17
Se
p-1
7
Dec-1
7
Meth
Blu
e F
FP
MAT : MB FFP MAT : MB Cryo Pools
18
20
22
24
26
28
30
32
34
36
150
160
170
180
190
200
210
220
230
240
250
260
270
Mar-
10
Jun
-10
Se
p-1
0
Dec-1
0
Mar-
11
Jun
-11
Se
p-1
1
Dec-1
1
Mar-
12
Jun
-12
Se
p-1
2
Dec-1
2
Mar-
13
Jun
-13
Se
p-1
3
Dec-1
3
Mar-
14
Jun
-14
Se
p-1
4
Dec-1
4
Mar-
15
Jun
-15
Se
p-1
5
Dec-1
5
Mar-
16
Jun
-16
Se
p-1
6
Dec-1
6
Mar-
17
Jun
-17
Se
p-1
7
Dec-1
7
UK
Cry
o P
oo
ls (
00
0s)
UK
FF
P (
000s
)
MAT : UK FFP (000s) MAT : UK Cryo Pools (000s)
26
30
34
38
42
200
220
240
260
280
300
320
Apr-
12
Jul-1
2
Oct-
12
Jan-1
3
Apr-
13
Jul-1
3
Oct-
13
Jan-1
4
Apr-
14
Jul-1
4
Oct-
14
Jan-1
5
Apr-
15
Jul-1
5
Oct-
15
Jan-1
6
Apr-
16
Jul-1
6
Oct-
16
Jan-1
7
Apr-
17
Jul-1
7
Oct-
17
A n
eg
Issu
es
AT
D P
late
let
Issu
es (
incl. A
neg
)
Platelet Issues (all groups) MAT Platelet Issues (A Neg) MAT
000's 000's
750
770
790
810
830
850
870
890
910
Apr May Jun Jul Aug Sep Oct Nov Dec Jan Feb Mar
Ave
rag
e W
ee
kd
ay I
ss
ue
s
2015/16 2016/17 Plan 261k 2017/18
Latest data point is part month
Me
th B
lue
Cry
o P
oo
ls
Monthly Performance Report: As at the end of December 2017 Page 11 of 35

13. Red Cell - Blood Stocks (Units)
15. Red Cell - O neg : weekday stock levels BC # 3 16. Platelet - Total and A neg : weekday stock levels BC # 4
YTD PerformanceAnnual
Target
YTD
Target
YTD
Actual
YTD
RAG
YTD RAG
TrendYTD Performance
Annual
Target
YTD
Target
YTD
Actual
YTD
RAG
YTD RAG
Trend
Number of occasions where red cell stocks (for
any blood group) are below the three day alert
level for three or more consecutive days
0 0 2 R Worse
Number of occasions where opening stock of
platelets (for any blood group) is below average
daily demand for two or more consecutive days
0 0 24 R -
Monthly Performance Report - As at the end of December 2017
Blood Components - Stocks
14. Average Red Cell Stock Levels for the month by blood group
1.50
2.50
3.50
4.50
5.50
6.50
7.50
16-J
an
-17
30-J
an
-17
13-F
eb
-17
27-F
eb
-17
13-M
ar-
17
27-M
ar-
17
10-A
pr-
17
24-A
pr-
17
08-M
ay-1
7
22-M
ay-1
7
05-J
un
-17
19-J
un
-17
03-J
ul-
17
17-J
ul-
17
31-J
ul-
17
14-A
ug-1
7
28-A
ug-1
7
11-S
ep-1
7
25-S
ep-1
7
09-O
ct-
17
23-O
ct-
17
06-N
ov-1
7
20-N
ov-1
7
04-D
ec-1
7
18-D
ec-1
7
01-J
an
-18
O- AlertDays stock
0.00
0.75
1.50
2.25
3.00
3.75
01-J
un-1
7
08-J
un-1
7
15-J
un-1
7
22-J
un-1
7
29-J
un-1
7
06-J
ul-17
13-J
ul-17
20-J
ul-17
27-J
ul-17
03-A
ug-1
7
10-A
ug-1
7
17-A
ug-1
7
24-A
ug-1
7
31-A
ug-1
7
07-S
ep-1
7
14-S
ep-1
7
21-S
ep-1
7
28-S
ep-1
7
05-O
ct-
17
12-O
ct-
17
19-O
ct-
17
26-O
ct-
17
02-N
ov-1
7
09-N
ov-1
7
16-N
ov-1
7
23-N
ov-1
7
30-N
ov-1
7
07-D
ec-1
7
14-D
ec-1
7
21-D
ec-1
7
28-D
ec-1
7
04-J
an-1
8
11-J
an-1
8
Total Platelet Stocks Alert Level A-
20,000
25,000
30,000
35,000
40,000
45,000
Ja
n
Fe
b
Ma
r
Ap
r
Ma
y
Jun
Ju
l
Au
g
Se
p
Oct
No
v
De
c
Yr to 13 Jan 2017 Yr to 12 Jan 2018
5.3
6.35.8
8.4
4.0
10.2
3.3
7.7
5.9
0
1
2
3
4
5
6
7
8
9
10
11
12
O+ A+ B+ AB+ O- A- B- AB- Total
Arrows indicate change from last month
Day
s St
ock
Monthly Performance Report: As at the end of December 2017 Page 12 of 35

17. O neg RC Demand and Issues 18. A neg Platelet Demand and Issues
19. Percentage of Donations NOT Converted to Validated Red Cells and Expiries 20. Percentage of Platelets Produced NOT Issued
Monthly Performance Report - As at the end of December 2017
Blood Components - Red Cell Demand/Issues (O Neg) and Platelet Demand/Issues (A Neg)
Blood Components - Wastage
12000
13000
14000
15000
16000
17000
18000
19000
41730 41821 41913 42005 42095 42186 42278 42370 42461 42552 42644
O- Demand O- Issues
12,000
13,000
14,000
15,000
16,000
17,000
18,000
19,000
Apr-
14
Ju
n-1
4
Aug
-14
Oct-
14
Dec-1
4
Feb
-15
Apr-
15
Ju
n-1
5
Aug
-15
Oct-
15
Dec-1
5
Feb
-16
Apr-
16
Ju
n-1
6
Aug
-16
Oct-
16
Dec-1
6
Feb
-17
Apr-
17
Ju
n-1
7
Aug
-17
Oct-
17
Dec-1
7
O- Demand O- Issues
2,000
2,200
2,400
2,600
2,800
3,000
3,200
3,400
3,600
3,800
4,000
4,200
Ap
r-1
4
Ju
n-1
4
Au
g-1
4
Oct-
14
Dec-1
4
Feb
-15
Apr-
15
Ju
n-1
5
Aug-1
5
Oct-
15
Dec-1
5
Feb
-16
Ap
r-1
6
Ju
n-1
6
Au
g-1
6
Oct-
16
Dec-1
6
Feb
-17
Apr-
17
Ju
n-1
7
Aug-1
7
Oct-
17
Dec-1
7
A- Demand A- Issues
0.00%
0.50%
1.00%
1.50%
2.00%
2.50%
3.00%
3.50%
4.00%
4.50%
5.00%
5.50%
6.00%
20
10
/11 F
Y
20
11
/12 F
Y
20
12
/13 F
Y
20
13
/14 F
Y
20
14
/15 F
Y
20
15
/16 F
Y
20
16
/17 F
Y
Ap
r-17
May-1
7
Ju
n-1
7
Ju
l-1
7
Au
g-1
7
Se
p-1
7
Oct-
17
No
v-1
7
De
c-1
7
Ja
n-1
8
Fe
b-1
8
Mar-
18
Actual Process Losses Plan Process Losses Actual Expiries Plan Expiries
0.00%
2.50%
5.00%
7.50%
10.00%
12.50%
15.00%
17.50%
20.00%
22.50%
20
10
/11 F
Y
20
11
/12 F
Y
20
12
/13 F
Y
20
13
/14 F
Y
20
14
/15 F
Y
20
15
/16 F
Y
20
16
/17 F
Y
Ap
r-17
May-1
7
Ju
n-1
7
Ju
l-1
7
Au
g-1
7
Se
p-1
7
Oct-
17
No
v-1
7
De
c-1
7
Ja
n-1
8
Fe
b-1
8
Mar-
18
Period Total Pooled CD Plan
Monthly Performance Report: As at the end of December 2017 Page 13 of 35

21. Donor Satisfaction BC # 5 22. Donor Complaints BC # 10
YTD PerformanceAnnual
Target
YTD
Target
YTD
Actual
YTD
RAG
YTD RAG
TrendYTD Performance
Annual
Target
YTD
Target
YTD
Actual
YTD
RAG
YTD RAG
Trend
% of donors scoring >= 9/10 for satisfaction 75.0% 75.0% 78.7% G - Number of complaints per million donations 4,400 4,400 3,833 G -
23.Donor Base and Frequency of Donation BC # 6 BC # 7 24. O Neg: Donorbase and Frequency of Donation BC # 8 BC # 9
YTD PerformanceAnnual
Target
YTD
Target
YTD
Actual
YTD
RAG
YTD RAG
TrendYTD Performance
Annual
Target
YTD
Target
YTD
Actual
YTD
RAG
YTD RAG
Trend
Number of donors donating in the last 12
months838,342 842,946 825,042 R Worse
Number of active O neg donors donating
over the last 12 months107,513 107,089 103,379 R -
Frequency of donation (overall) 1.836 1.849 1.864 G - Frequency of donation (O neg donors) 1.887 1.911 1.958 A -
Monthly Performance Report - As at the end of December 2017
Blood Components - Blood Donor Base
1.838
1.888
1.938
1.988
2.038
2.088
2.138
100,000
101,000
102,000
103,000
104,000
105,000
106,000
107,000
108,000
109,000
110,000
Ja
n-1
7
Fe
b-1
7
Ma
r-1
7
Apr-
17
Ma
y-1
7
Ju
n-1
7
Ju
l-1
7
Au
g-1
7
Se
p-1
7
Oct-
17
No
v-1
7
De
c-1
7
O-neg Donors Donating O-neg Frequency
0
10,000
20,000
30,000
40,000
50,000
60,000
750,000
770,000
790,000
810,000
830,000
850,000
870,000
890,000
Ja
n-1
7
Fe
b-1
7
Ma
r-1
7
Ap
r-1
7
Ma
y-1
7
Jun-1
7
Jul-1
7
Au
g-1
7
Se
p-1
7
Oct-
17
No
v-1
7
De
c-1
7
New Donors Registering New Donors Attending Donors Donating (All Groups)
0%
10%
20%
30%
40%
50%
60%
70%
80%
90%
20
10
/11
FY
20
11
/12
FY
20
12
/13
FY
20
13
/14
FY
20
14
/15
FY
20
15
/16
FY
20
16
/17
FY
Ap
r-1
7
Ma
y-1
7
Ju
n-1
7
Ju
l-1
7
Au
g-1
7
Se
p-1
7
Oct-
17
No
v-1
7
De
c-1
7
Ja
n-1
8
Fe
b-1
8
Ma
r-1
8
Donor Satisfaction - Actual Donor Satisfaction - Plan
0
1,000
2,000
3,000
4,000
5,000
6,000
7,000
8,000
0
200
400
600
800
1,000
1,200
Ap
r-15
Jun
-15
Au
g-1
5
Oct-
15
De
c-1
5
Feb-1
6
Ap
r-16
Jun
-16
Au
g-1
6
Oct-
16
De
c-1
6
Feb-1
7
Ap
r-17
Jun
-17
Au
g-1
7
Oct-
17
De
c-1
7
Ra
tio
/ m
illi
on
To
tal n
um
be
rs -
for
Co
mp
lain
an
ts
wit
h D
on
ati
on
s f
ac
tore
d b
y 1
/250 t
o
fit
ch
art
Collections/250 Complainants Complainants/million donations
Monthly Performance Report: As at the end of December 2017 Page 14 of 35

25. Ro Donor Base and Black Donor Recruitment BC # 6 BC # 7 26. CD platelet Donor Base : Total and A Neg BC # 8 BC # 9
YTD PerformanceAnnual
Target
YTD
Target
YTD
Actual
YTD
RAG
YTD RAG
Trend
Number of Ro donors donating in the
last 12 months29,440 25,137 19,186 R -
Frequency of donation (overall) 1.836 1.860 1.866 G -
Monthly Performance Report - As at the end of December 2017
Blood Components - Blood Donor Base (continued)
The table below reports that the Component Donation donor base is substantially lower
than target. A flaw has been identified in the counting methodolgy, and this is the first
month where the actual counts have been restated (downwards). It is not possible to
restate historical counts.
Targets were based on the old counting methodology and will be restated. The correct
donor base and restated targets will be reported when available (with history from
September 2017 onwards).
Sep-2017 A- A+ AB- AB+ B- B+ O- O+ Total
777Target
Reviewed
report
Variance vs
target
2,365
-206
820 2,824 11,497
2,159 3,598 165 300 219 695 760 2,611 10,507
3,982 156 331 242
-60 -213 -990-384 9 -31 -23 -82
0
5,000
10,000
15,000
20,000
25,000
30,000
35,000
0
500
1,000
1,500
2,000
2,500
3,000
Ap
r-1
7
Ma
y-1
7
Ju
n-1
7
Ju
l-1
7
Au
g-1
7
Se
p-1
7
Oct-
17
No
v-1
7
De
c-1
7
Jan-1
8
Feb
-18
Ma
r-1
8
Black Donors Registering New Black Donors Donating
Ro Donors donating (last 12 mths) Ro Donor base target
Ro
Do
no
rbase
Bla
ck
Do
no
rs
Monthly Performance Report: As at the end of December 2017 Page 15 of 35

27. Processing Productivity : YTD and Current Month BC # 17 28. Testing Productivity : YTD and Current Month BC # 18
Annual
Target
YTD
Target
YTD
ActualRAG
YTD
RAG
Trend
Annual
Target
YTD
Target
YTD
ActualRAG
YTD
RAG
Trend
10,300 10,286 10,079 A - 29,700 29,710 28,887 A -
29. Blood Donation Productivity : YTD and Current Month BC # 19 30. Blood Donation Productivity - Distribution Mobile Teams
Annual
Target
YTD
Target
YTD
ActualRAG
YTD
RAG
Trend
1,411 1,410 1,395 G -
Blood Components - Productivity
Monthly Performance Report - As at the end of December 2017
YTD Performance
Testing productivity (units/FTE/year)
YTD Performance
Manufacturing productivity (units/FTE/year)
YTD Performance
Blood Donation Productivity (units/FTE/Year)
1,3
95
1,2
89
900
1,000
1,100
1,200
1,300
1,400
1,500
1,600
1,700
1,800
1,900
2008/0
9
2009/1
0
2010/1
1
2011/1
2
2012/1
3
2013/1
4
2014/1
5
2015/1
6
2016/1
7
2017/1
8 Y
TD
2017/1
8P
eri
od
EBA Top Quartile 1,752
10,0
79
9,9
96
4,000
5,000
6,000
7,000
8,000
9,000
10,000
11,000
2008/0
9
2009/1
0
2010/1
1
2011/1
2
20
12
/13
20
13
/14
20
14
/15
2015/1
6
2016/1
7
2017/1
8 Y
TD
2017/1
8P
eri
od
EBA Top Quartile 9,749
28,8
87
31,1
13
5,000
10,000
15,000
20,000
25,000
30,000
35,000
2008/0
9
2009/1
0
2010/1
1
2011/1
2
2012/1
3
2013/1
4
2014/1
5
2015/1
6
2016/1
7
2017/1
8 Y
TD
2017/1
8P
eri
od
EBA Top Quartile23,996
1,050
1,150
1,250
1,350
1,450
1,550
1,650
1,750
1,850
1,950
YTD Average includes static sites
23 above average
Slough (1,867)Reading (1,731)Teesside (1,644)
Tunbridge Wells (1,579)York (1,567)
26 below average
Plymouth (1,176)Liverpool (1,189)
Sheffield South (1,200)Sheffield North (1,202)Hertfordshire (1,221)
Top 5
Bottom 5
Monthly Performance Report: As at the end of December 2017 Page 16 of 35

Page 17 of 35
DIVISION THEME STRATEGIC TARGET YTD RAG
RAG CHANGE PERFORMANCE
Sales Income (£69.3m) G - £56.1m (vs plan of £53.8m).
Number of Serious Incidents (SI’s) G - None reported this month
Zero ‘critical’ regulatory non-compliances G - None reported in the month.
Group Targets
Number of ‘major’ regulatory non-compliances R Worse 5 reported at the Birmingham ATU in the month.
Sales income achieved - £13.6m (chart 31) G - Marginally lower than plan at £9.6m (vs £9.8m).
80% percent of customers scoring =/> 9/10 for satisfaction with Tissues - - March 2017 (reported in April 2017) at 75%.
Tissue & Eye Services
98.0% of Product issued on time G - 99.4% vs plan of 98.0% (year to date).
Sales Income achieved - £13.9m (chart 32) A - £10.3m vs plan of £10.4m.
% of patients receiving A or B1 platelets A - 71% vs plan of 75% - Chart 2.
Time to type deceased organ donors G - Reporting monthly in arrears - at 85% vs target of 80%.
H&I
Turnaround time vs SLA (chart 36) G - Better than plan at 95.8% (vs 95% target).
£14.95m Sales income achieved (chart 32) G - £11.7m vs plan of £11.1m.
DTS
RCI Sample turnaround time vs SLA (chart 35) G - 96.1% vs plan of 95%.

Page 18 of 35
DIVISION THEME STRATEGIC TARGET YTD RAG
RAG CHANGE PERFOMANCE
£11.2m sales income achieved (chart 33) G - £8.6m vs plan of £8.4m. CMT
On time in full – target 100% G At target.
£9.8m sales income achieved (chart 33) G - £7.3m vs plan of £7.1m.
2,300 increase to Banked Cords TNC > 140 R - 1196 vs plan of 1724.
40% BAME Cord Blood units add to the bank G - 40% in the year to date (> 40).
Issue 75 Cord Blood units R Worse 41 units issued in the year to date (vs plan of 53).
Adult Donor Provisions (216) G - 173 vs plan of 157
SCDT
Donors recruited to fit panel – 10k A - 7,475 vs plan of 7,498
£7.6m sales income achieved (chart 34) G - £7.3m vs plan of £5.7m.
62% of hospitals scoring =/> 9/10 for satisfaction - - 70.5% vs 62% at February 2017.
DTS
Therapeutic Apheresis Services
95% of Patients rating patient experience =/>9/10 G - December 2017 at 97% (vs 95%)
• DTS is reporting an I&E surplus of £1.9m in the year to date. The forecast outturn for the year remains unchanged this month at a surplus of £0.8m. • Sickness absence in DTS was better this month at 2.6% and remains much better than the NHSBT target of 4%.
• All SBUs are reporting an I&E contribution at or better than plan in the year to date, with the exception of Tissues, which has seen a marked decline in the sales of
skin through the year (and is expected to continue through the year).
Page 19 of 35
DTS Income by SBU – YTD December 2017
2017/18 Budget
2017/18 Income
2017/18 Variance
2016/17 Actual Growth
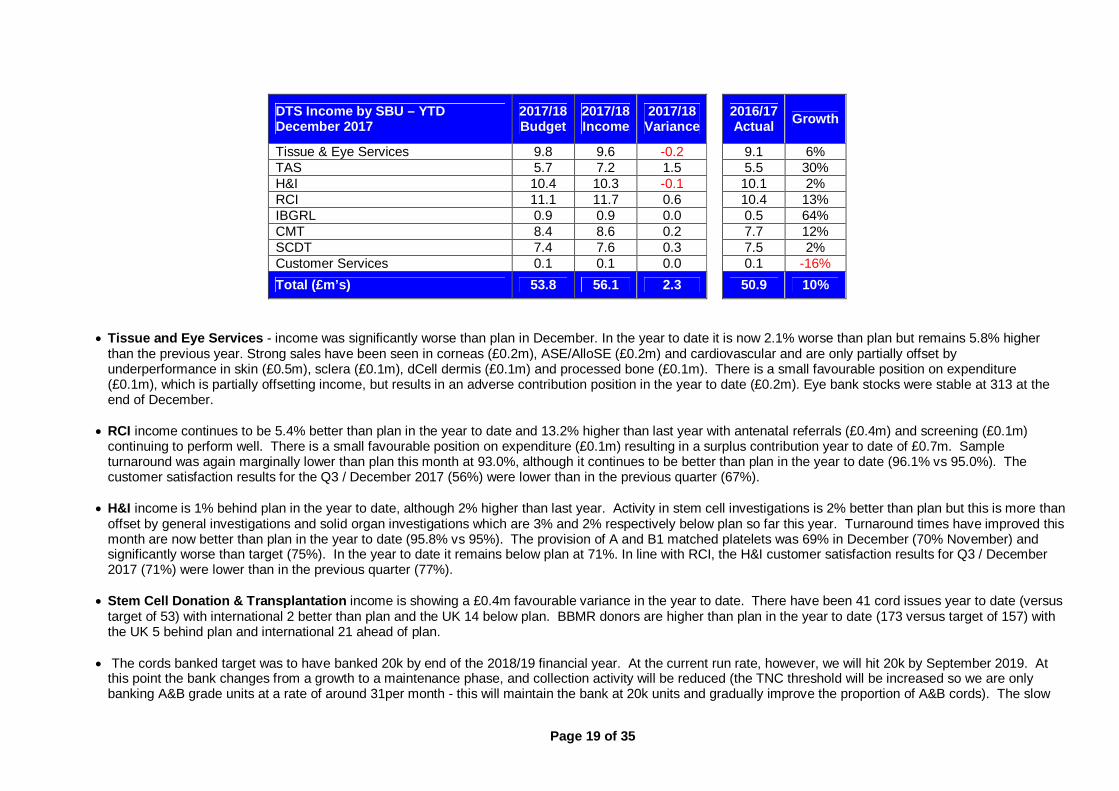
Tissue & Eye Services 9.8 9.6 -0.2 9.1 6% TAS 5.7 7.2 1.5 5.5 30% H&I 10.4 10.3 -0.1 10.1 2% RCI 11.1 11.7 0.6 10.4 13% IBGRL 0.9 0.9 0.0 0.5 64% CMT 8.4 8.6 0.2 7.7 12% SCDT 7.4 7.6 0.3 7.5 2% Customer Services 0.1 0.1 0.0 0.1 -16%
Total (£m’s) 53.8 56.1 2.3
50.9 10%
• Tissue and Eye Services - income was significantly worse than plan in December. In the year to date it is now 2.1% worse than plan but remains 5.8% higher
than the previous year. Strong sales have been seen in corneas (£0.2m), ASE/AlloSE (£0.2m) and cardiovascular and are only partially offset by underperformance in skin (£0.5m), sclera (£0.1m), dCell dermis (£0.1m) and processed bone (£0.1m). There is a small favourable position on expenditure (£0.1m), which is partially offsetting income, but results in an adverse contribution position in the year to date (£0.2m). Eye bank stocks were stable at 313 at the end of December.
• RCI income continues to be 5.4% better than plan in the year to date and 13.2% higher than last year with antenatal referrals (£0.4m) and screening (£0.1m)
continuing to perform well. There is a small favourable position on expenditure (£0.1m) resulting in a surplus contribution year to date of £0.7m. Sample turnaround was again marginally lower than plan this month at 93.0%, although it continues to be better than plan in the year to date (96.1% vs 95.0%). The customer satisfaction results for the Q3 / December 2017 (56%) were lower than in the previous quarter (67%).
• H&I income is 1% behind plan in the year to date, although 2% higher than last year. Activity in stem cell investigations is 2% better than plan but this is more than
offset by general investigations and solid organ investigations which are 3% and 2% respectively below plan so far this year. Turnaround times have improved this month are now better than plan in the year to date (95.8% vs 95%). The provision of A and B1 matched platelets was 69% in December (70% November) and significantly worse than target (75%). In the year to date it remains below plan at 71%. In line with RCI, the H&I customer satisfaction results for Q3 / December 2017 (71%) were lower than in the previous quarter (77%).
• Stem Cell Donation & Transplantation income is showing a £0.4m favourable variance in the year to date. There have been 41 cord issues year to date (versus target of 53) with international 2 better than plan and the UK 14 below plan. BBMR donors are higher than plan in the year to date (173 versus target of 157) with the UK 5 behind plan and international 21 ahead of plan.
• The cords banked target was to have banked 20k by end of the 2018/19 financial year. At the current run rate, however, we will hit 20k by September 2019. At
this point the bank changes from a growth to a maintenance phase, and collection activity will be reduced (the TNC threshold will be increased so we are only banking A&B grade units at a rate of around 31per month - this will maintain the bank at 20k units and gradually improve the proportion of A&B cords). The slow

Page 20 of 35
down in the banking rate is due to a decision to leave posts vacant, and shifts uncovered, hence avoiding the need to recruit staff to reach target only to make them redundant next year. DH is in agreement with this approach as we are tracking towards the agreed bank size. The introduction of NICE guidelines on delayed cord clamping in March 2017 is now being implemented in hospitals and has impacted our clinical conversion rate. Taken together the number of cord units banked continues to run behind plan (31% lower in the year to date) and will report at red status through the rest of the year. BAME cord donations banked were equal with target in the month at 40% and in the year to date, remains level with plan.
• Cellular and Molecular Therapies - service income in the year to date is £0.2m better than budget and generating a small income and expenditure surplus
(£0.1m).
• Therapeutic Apheresis Services income in the year to date is 27% ahead of target and 30% higher than in the previous year, primarily due to strong performance on ECP (£1.2m), red cell exchange (£0.1m) and stem cell harvests (£0.2m). The income surplus (£1.5m), when combined with the increased expenditure to support these activity levels, is resulting in a favourable contribution surplus of £0.6m. The Patient Experience Survey achieved a Top Box score of 97%, with 5 out of 8 sites achieving 100%.
• There were 5 major regulatory findings reported as a result of an MHRA inspection on 9th January 2018 of the Advanced Therapies Unit in Birmingham. This is a
poor result (close to being a critical finding) and NHSBT will receive a Type 2 letter from the MHRA reflecting the seriousness of the findings and setting a tight timeframe for rectification. The findings were:
� Deficiencies within the Environmental Monitoring process with insufficient investigation of failures, inadequate evidence to support selection of monitoring points – HACCP analysis not performed, EM failures not reported as QIs, and no trend investigation
� Data Integrity � Control of change – including change control for Merlin not including changes to the process or sufficiently risk assess changes and licence not updated to
reflect changes in named personnel. � Personal locker in the GMP lobby area containing food and drink containers, rejected consumables, personal medication, and equipment with unclear
status. � Inadequate controls to minimise risks for sterile products eg aseptic operator technique, cellotape used in cloakroom, inadequate controls for sterile fill
validation testing
DTS – Status of Strategic Projects per TPB reportin g:
Project title Status This
RAG Last RAG
Approved Cost
(£m’s)
F/Cast Cost
(£m’s)
F/cast Benefit (£m’s)
Planned to complete
F/Cast to complete
Stock Management Rollout(i) Closure N/A R 0.3 0.3 N/A Nov 17 Jan 18 TAS - Liverpool Delivery G G N/A N/A N/A Mar 20 Mar 20 Filton Extension Delivery G G 0.2 0.2 N/A Jan 21 Oct 21 Automated Software Testing Delivery G G N/A 0.2 N/A Nov 18 Mar 19
Notes: i) EPR due February 2018. Not reported to TPB this month.

31. Tissue and Eye Services Income (MAT) TS # 1 32. Diagnostic Service Income (MAT) H&I # 1 RCI # 1
Annual
Target
YTD
Target
YTD
ActualRAG
YTD RAG
Trend
Annual
Target
YTD
Target
YTD
ActualRAG
YTD RAG
Trend
14.884 11.138 11.741 G -13.882 10.398 10.319 A -
33. Stem Cells - SCDT/CMT Income (MAT) CMT # 1 SCDT # 1 34. Therapeutic Apheresis Services Income (MAT) TAS # 1
Annual
Target
YTD
Target
YTD
ActualRAG
YTD RAG
Trend
Annual
TargetYTD Target YTD Actual RAG
YTD RAG
Trend
11.212 8.410 8.563 G -
9.795 7.365 7.644 G -
Monthly Performance Report - As at the end of December 2017
Diagnostic and Therapeutic Services - Income
YTD Performance YTD Performance
-
YTD Performance
Income (£m's) - CMT
Income (£m's) - SCDT7.581 5.679 7.209 G
YTD Performance
Income (£m's) - TAS
A -Income (£m's) - H&I
Income (£m's) - TES 13.602 9.802 9.594Income (£m's) - RCI
7,000
8,000
9,000
10,000
11,000
12,000
13,000
14,000
15,000
Ap
r-1
4
Ju
n-1
4
Au
g-1
4
Oct-
14
Dec-1
4
Fe
b-1
5
Ap
r-1
5
Ju
n-1
5
Au
g-1
5
Oct-
15
Dec-1
5
Fe
b-1
6
Ap
r-1
6
Ju
n-1
6
Au
g-1
6
Oct-
16
Dec-1
6
Fe
b-1
7
Ap
r-1
7
Ju
n-1
7
Au
g-1
7
Oct-
17
Dec-1
7
Fe
b-1
8
£000
s
TES Actual TES Budget
11,500
12,000
12,500
13,000
13,500
14,000
14,500
15,000
15,500
16,000
Ap
r-1
4
Jun
-14
Au
g-1
4
Oct-
14
Dec-1
4
Fe
b-1
5
Ap
r-1
5
Jun
-15
Au
g-1
5
Oct-
15
Dec-1
5
Fe
b-1
6
Ap
r-16
Ju
n-1
6
Au
g-1
6
Oct-
16
Dec-1
6
Fe
b-1
7
Ap
r-17
Ju
n-1
7
Au
g-1
7
Oct-
17
Dec-1
7
Fe
b-1
8
£000s
H&I Actual RCI Actual H&I Budget RCI Budget
5,000
5,500
6,000
6,500
7,000
7,500
8,000
8,500
9,000
9,500
10,000
Ap
r-14
Jun
-14
Au
g-1
4
Oct-
14
De
c-1
4
Feb-1
5
Ap
r-1
5
Ju
n-1
5
Au
g-1
5
Oct-
15
De
c-1
5
Feb-1
6
Ap
r-16
Jun
-16
Au
g-1
6
Oct-
16
De
c-1
6
Feb-1
7
Ap
r-1
7
Ju
n-1
7
Au
g-1
7
Oct-
17
De
c-1
7
Feb-1
8
£000s
TAS Actual TAS Target
6,000
7,000
8,000
9,000
10,000
11,000
12,000
13,000
Ap
r-14
Jun
-14
Au
g-1
4
Oct-
14
Dec-1
4
Fe
b-1
5
Ap
r-15
Jun
-15
Au
g-1
5
Oct-
15
Dec-1
5
Fe
b-1
6
Ap
r-16
Jun
-16
Au
g-1
6
Oct-
16
De
c-1
6
Fe
b-1
7
Ap
r-17
Jun
-17
Au
g-1
7
Oct-
17
De
c-1
7
Fe
b-1
8
£000
s
CMT Actual SCDT Actual CMT Budget SCDT Budget
Monthly Performance Report: As at the end of December 2017 Page 21 of 35

35. Turnaround Time vs SLA (RCI) RCI # 5 36. Turnaround Time vs SLA (H&I) H&I # 7
Annual
Target
YTD
Target
YTD
ActualRAG
YTD RAG
Trend
Annual
Target
YTD
Target
YTD
ActualRAG
YTD RAG
Trend
95.0% 95.0% 96.1% G - 95.0% 95.0% 95.8% G -
37. Hospital Satisfaction H&I # 3 RCI # 3 38. Major QI's raised per month - DTS
Annual
Target
YTD
Target
YTD
ActualRAG
YTD RAG
Trend
61% 61% 56% A Worse
61% 61% 71% G -Percent of hospitals scoring =/> 9/10
for satisfaction with H&I - RCI
Monthly Performance Report - As at the end of December 2017
Diagnostic and Therapeutic Services - Customer service and safety
Percentage of hospitals scoring =/>
9/10 for satisfaction with RCI - RCI
Turnaround Time vs SLA - H&I
YTD Performance
YTD Performance
Turnaround Time vs SLA - RCI
YTD Performance
60% 61% 61% 61%
53%
74%
67%
56%60% 61% 61% 61%
74%
92%
77%
71%
40%45%50%55%60%65%70%75%80%85%90%95%
Mar-
17
Jun
-17
Se
p-1
7
Dec-1
7
RCI Target RCI Survey H&I Target H&I Survey
86.0%
88.0%
90.0%
92.0%
94.0%
96.0%
98.0%
100.0%
Ap
r-15
May-1
5
Jun
-15
Jul-1
5
Au
g-1
5
Se
p-1
5
Oct-
15
Nov-1
5
Dec-1
5
Jan
-16
Feb-1
6
Ma
r-16
Ap
r-16
Ma
y-1
6
Jun
-16
Jul-1
6
Au
g-1
6
Se
p-1
6
Oct-
16
Nov-1
6
Dec-1
6
Jan
-17
Fe
b-1
7
Ma
r-17
Ap
r-17
Ma
y-1
7
Jun
-17
Jul-1
7
Au
g-1
7
Se
p-1
7
Oct-
17
Nov-1
7
Dec-1
7
RCI Target RCI sample turnaround time vs SLA
84.0%
86.0%
88.0%
90.0%
92.0%
94.0%
96.0%
98.0%
100.0%
Ap
r-15
May-1
5
Jun
-15
Jul-1
5
Au
g-1
5
Se
p-1
5
Oct-
15
Nov-1
5
Dec-1
5
Jan
-16
Fe
b-1
6
Ma
r-16
Ap
r-16
Ma
y-1
6
Jun
-16
Jul-1
6
Au
g-1
6
Se
p-1
6
Oct-
16
Nov-1
6
Dec-1
6
Jan
-17
Fe
b-1
7
Mar-
17
Ap
r-17
Ma
y-1
7
Jun
-17
Jul-1
7
Au
g-1
7
Se
p-1
7
Oct-
17
Nov-1
7
Dec-1
7
H&I target H&I sample turnaround time vs SLA
0
2
4
6
8
10
12
14
16
18
Ja
n-1
7
Fe
b-1
7
Ma
r-17
Ap
r-1
7
Ma
y-1
7
Ju
n-1
7
Jul-
17
Au
g-1
7
Se
p-1
7
Oct-
17
Nov-1
7
De
c-1
7
BBMR H&INHS Cord Bank RCICMT Tissue ServicesTAS IBGRL - Molecular DiagnosticsCustomer Services
Monthly Performance Report: As at the end of December 2017 Page 22 of 35

39. Adult donor provisions : UK and International - MATs SCDT # 8 40. Issue of cord blood units : UK and International - MATs SCDT # 7
SCDT # 8 SCDT # 8
Annual
Target
YTD
Target
YTD
ActualRAG
YTD RAG
Trend
Annual
Target
YTD
Target
YTD
ActualRAG
YTD RAG
Trend
216 157 173 G - 75 53 41 R -
41. Suitable Cornea Donations - MAT, and Cornea stocks 42. NHSBT CBB stock (active units - cell dose post process TNC) SCDT # 5
Annual
Target
YTD
Target
YTD
ActualRAG
YTD RAG
Trend
2,300 1,724 1,196 R -
Adult donor provisions (total)
Monthly Performance Report - As at the end of December 2017
Stem Cell Donation and Transplantation, and Tissue and Eye Services : Corneas - Strategic Targets
YTD Performance
Banked Donations TNC > 140
YTD Performance
YTD Performance
Number of Cord Units Issued (total)
30
50
70
90
110
130
150
170
Ap
r-14
Ju
n-1
4
Au
g-1
4
Oct-
14
De
c-1
4
Fe
b-1
5
Ap
r-15
Ju
n-1
5
Au
g-1
5
Oct-
15
De
c-1
5
Fe
b-1
6
Ap
r-16
Ju
n-1
6
Au
g-1
6
Oct-
16
De
c-1
6
Fe
b-1
7
Ap
r-17
Ju
n-1
7
Au
g-1
7
Oct-
17
De
c-1
7
Fe
b-1
8
UK MAT International MAT UK Target International Target
200
220
240
260
280
300
320
340
360
3,600
3,800
4,000
4,200
4,400
4,600
Jan
-17
Feb-1
7
Mar-
17
Ap
r-17
May-1
7
Jun
-17
Jul-1
7
Au
g-1
7
Se
p-1
7
Oct-
17
Nov-1
7
Dec-1
7
Co
rnea S
tock
Su
itab
le C
orn
ea D
on
ati
on
s M
AT
MAT Suitable Cornea Donations Cornea Stock
7,798
11,178
4,247
1,445
0
2,000
4,000
6,000
8,000
10,000
12,000
Less than 90 TNC(Research grade)
Between 90 to 139 TNC(Operational C Grade)
Between 139 to 190 TNC(Operational B Grade)
Greater than 190 TNC(Operational A Grade)
0
10
20
30
40
50
60
Apr-
14
Ju
n-1
4
Aug
-14
Oct-
14
Dec-1
4
Feb
-15
Apr-
15
Ju
n-1
5
Aug
-15
Oct-
15
Dec-1
5
Feb
-16
Apr-
16
Ju
n-1
6
Aug
-16
Oct-
16
Dec-1
6
Feb
-17
Apr-
17
Ju
n-1
7
Aug
-17
Oct-
17
Dec-1
7
Feb
-18
UK MAT International MAT UK Target International Target
Monthly Performance Report: As at the end of December 2017 Page 23 of 35
Page 24 of 35
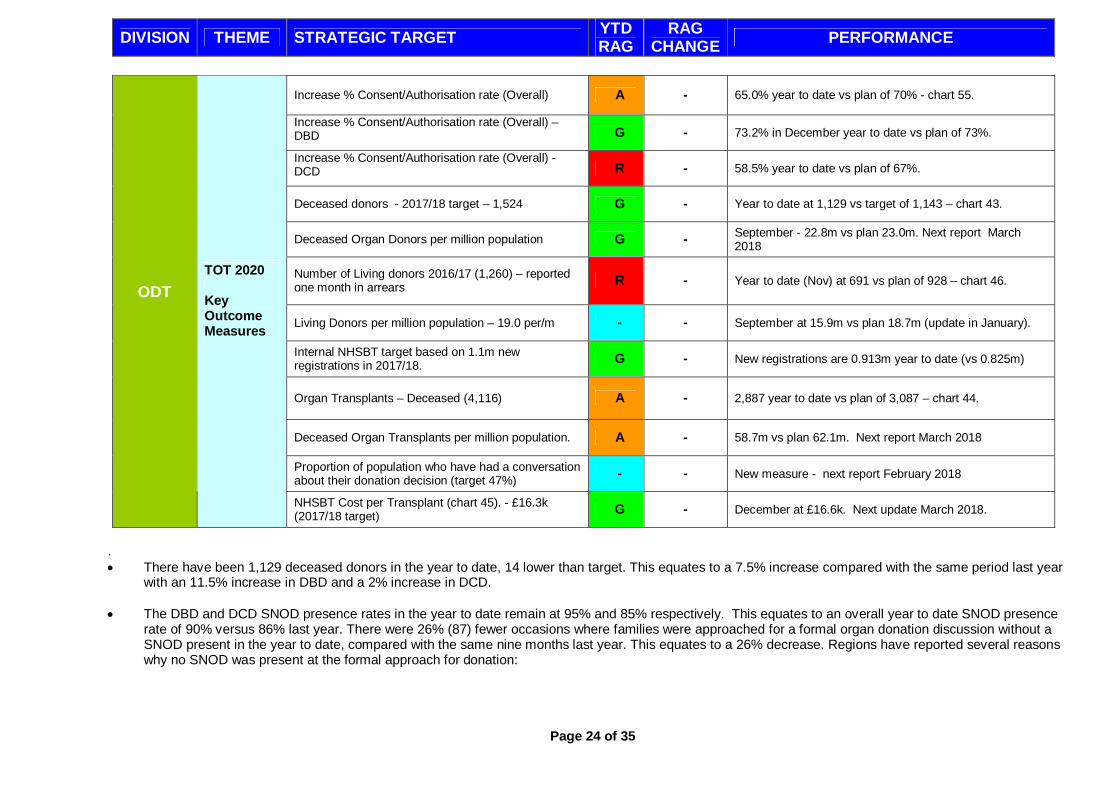
. • There have been 1,129 deceased donors in the year to date, 14 lower than target. This equates to a 7.5% increase compared with the same period last year
with an 11.5% increase in DBD and a 2% increase in DCD. • The DBD and DCD SNOD presence rates in the year to date remain at 95% and 85% respectively. This equates to an overall year to date SNOD presence
rate of 90% versus 86% last year. There were 26% (87) fewer occasions where families were approached for a formal organ donation discussion without a SNOD present in the year to date, compared with the same nine months last year. This equates to a 26% decrease. Regions have reported several reasons why no SNOD was present at the formal approach for donation:
DIVISION THEME STRATEGIC TARGET YTD RAG
RAG CHANGE PERFORMANCE
Increase % Consent/Authorisation rate (Overall) A - 65.0% year to date vs plan of 70% - chart 55.
Increase % Consent/Authorisation rate (Overall) – DBD G - 73.2% in December year to date vs plan of 73%.
Increase % Consent/Authorisation rate (Overall) - DCD R - 58.5% year to date vs plan of 67%.
Deceased donors - 2017/18 target – 1,524 G - Year to date at 1,129 vs target of 1,143 – chart 43.
Deceased Organ Donors per million population G - September - 22.8m vs plan 23.0m. Next report March 2018
Number of Living donors 2016/17 (1,260) – reported one month in arrears R - Year to date (Nov) at 691 vs plan of 928 – chart 46.
Living Donors per million population – 19.0 per/m - - September at 15.9m vs plan 18.7m (update in January).
Internal NHSBT target based on 1.1m new registrations in 2017/18. G - New registrations are 0.913m year to date (vs 0.825m)
Organ Transplants – Deceased (4,116) A - 2,887 year to date vs plan of 3,087 – chart 44.
Deceased Organ Transplants per million population. A - 58.7m vs plan 62.1m. Next report March 2018
Proportion of population who have had a conversation about their donation decision (target 47%) - - New measure - next report February 2018
ODT
TOT 2020 Key Outcome Measures
NHSBT Cost per Transplant (chart 45). - £16.3k (2017/18 target) G - December at £16.6k. Next update March 2018.

Page 25 of 35
- 2 cases where SNOD en route to hospital (1 re-approached); - 4 cases where there was no referral to SNOD team; - 2 cases where the SNOD was unable to attend due to activity (clinical team coached by SR on approach); - 2 cases where SNOD was over 3 hours away and family wanted withdrawal; - 3 cases where Clinical team were discussing withdrawal of treatment but discussed donation at the same time; - 6 cases where the SNOD was present on the ICU however were refused to be allowed into the conversation.
• The overall consent rate in the year to date remains at 65% versus the 62% achieved in the same nine months last year. • Formal organ donation discussions have taken place with patients from black and Asian communities on 42 more occasions than last year to date with
consent being achieved on 40 more occasions. The overall consent rate for patients from black and Asian communities is 43% (110 out of 257) in the year to date, 10% higher than in the same nine months last year. Q3, however, was considerably lower than the consent rate achieved in Q2.
• There were 24 ODR overrides in Q1, 21 in Q2 and 15 in Q3, equating to 60 in the year to date.. In total there have been 7 fewer ODR overrides in the year
to date compared to last year. 12 of the 60 ODR overrides in the year to date have happened without a SNOD present. If a SNOD had been present, consent may have been ascertained on 10 more occasions in the year to date, assuming a 94% consent rate achieved by the SNODs.
• For patients known to have opted-in on the ODR, the quarterly consent rates in 2017/18 were as follows:
- SNOD present: Q1=93%, Q2=92%, Q3=95%, and in the year to date is 94% (1% higher than same nine months last year). - SNOD not present: Q1=33% (3/9), Q2=73% (8/11), Q3=79% (11/14), and in the year to date is 65% (22/34).
• For patients who had not opted-in on the ODR, or this was not known at the time, the quarterly consent rates in 2017/18 have been:
- SNOD present: Q1=57%, Q2=56%, Q3=60%, YTD=58% (<1% higher than same nine months last year) - SNOD not present: Q1=8% (6/75), Q2=13% (9/71), Q3=11% (8/72), YTD=11% (23/218) If a SNOD had been present on the 218 occasions, consent may have been ascertained on 103 more occasions in the year to date (in addition to the 23 achieved), assuming a 58% consent rate achieved by the SNODs.
. • The increase in deceased donor transplants is not as great as the increase in deceased donors being 4.4% higher than last year to date and 200 lower than
target. • December was a poor month for registrations with only 69,833 new opt-in registrations but are ahead of the annual target for 1.1 million new opt-in
registrations, with 913k in the year to date. The DVLA data transfer feed was significantly lower than usual in December and is the main reason for the drop in new registrations. 43% of new registrations came through digital activity (compared to 34% the previous month). This increased proportion of digital registrations reflects both the reduction in data feed registrations through the DVLA and England and Wales GP service as well as the launch of the Government’s consultation which prompted a spike in web visits and online sign ups on the 12th December. It is important to note that the Scottish GP Service is inactive. There is an error in the source data that is currently being worked through by the third party provider. The NHS Tracing Service & De-Duplication Process has also been inactive since June 2015. This may result in significant numbers of duplicate registrations on the live ODR i.e. over-reporting the number of registrants.
• Absence decreased marginally following a reduction in long term absence. In total short term absence is at 2.29% and long term absence at 1.43%. There are five teams with absence above 4%: Eastern, Northern Ireland, Northern, South Central and South Wales.

Page 26 of 35
.
. ODT – Status of Strategic Projects per TPB reportin g:
Project title Status This RAG
Last RAG
Approved Cost
(£m’s)
F/Cast Cost
(£m’s)
F/cast Benefit (£m’s)
Planned to complete
F/Cast to complete
ODT Hub Define G G 3.2(i) (0.6) N/A(ii) N/A Dec 19 Dec 19
Notes: i) This is non-recurring figure for 2017/18, recurring figure in brackets. ii) Now an under spend of £403k.

43. MAT number of Deceased Organ Donors ODT # 4 44. MAT number of Deceased Donor Organ Transplants ODT # 9
YTD PerformanceAnnual
Target
YTD
Target
YTD
ActualYTD RAG
YTD RAG
TrendYTD Performance
Annual
Target
YTD
Target
YTD
ActualRAG
YTD RAG
Trend
Number of Deceased Organ Donors 1,524 1,143 1,129 G - Number of Deceased Donor Transplants 4,116 3,087 2,887 A -
45. ODT Cost per Donor/Transplant ODT # 11 46. MAT number of Live Organ Donors (reported one month in arrears) ODT # 6
Annual
Target
Forecast
for the
year
YTD RAGYTD RAG
TrendYTD Performance
Annual
Target
YTD
Target
YTD
ActualYTD RAG
YTD RAG
Trend
16.2 16.4 G -Number of Living Organ Donors (reported
one month in arrears)1,392 928 691 R -
Monthly Performance Report - As at the end of December 2017
Organ Donation and Transplant - Outcomes
YTD Performance
NHSBT Cost per Transplant (£k's)
0
500
1000
1500
2000
2500
3000
3500
4000
4500
0
10
20
30
40
50
60
70
80
10/11 11/12 12/13 13/14 14/15 15/16 16/17 Budget17/18
Forecast17/18
Do
no
rs/T
ran
sp
lan
ts (
No
.)
£
ODT Total Spend (£M) Cost per donor (£K) Cost per transplant (£K)
Transplants (No.) Donors (No.)
1418
1432
1445
1447
1465
1473
1482
1484
1492
1524
17
64
1000
1100
1200
1300
1400
1500
1600
1700
1800
Apr-
17
Ma
y-1
7
Jun-1
7
Ju
l-17
Au
g-1
7
Se
p-1
7
Oct-
17
Nov-1
7
Dec-1
7
Jan-1
8
Fe
b-1
8
Ma
r-1
8
Ma
r-1
9
Ma
r-2
0
Ma
r-2
1
Ma
r-2
2
MAT Actual MAT Plan
3708
3760
3769
3786
3828
3866
3874
3858
3836 4
116
5028
2800
3100
3400
3700
4000
4300
4600
4900
5200
Apr-
17
Ma
y-1
7
Jun-1
7
Ju
l-17
Aug
-17
Sep
-17
Oct-
17
No
v-1
7
De
c-1
7
Ja
n-1
8
Feb-1
8
Ma
r-18
Ma
r-19
Mar-
20
Ma
r-21
Mar-
22
MAT Actual MAT Plan
1018
1027
1031
1030
1047
1044
1033
1007
1392
900
950
1000
1050
1100
1150
1200
1250
1300
1350
1400
1450
Ap
r-17
May-1
7
Ju
n-1
7
Ju
l-1
7
Au
g-1
7
Se
p-1
7
Oct-
17
No
v-1
7
De
c-1
7
Ja
n-1
8
Fe
b-1
8
Mar-
18
MAT Actual MAT Plan
Monthly Performance Report: As at the end of December 2017 Page 27 of 35
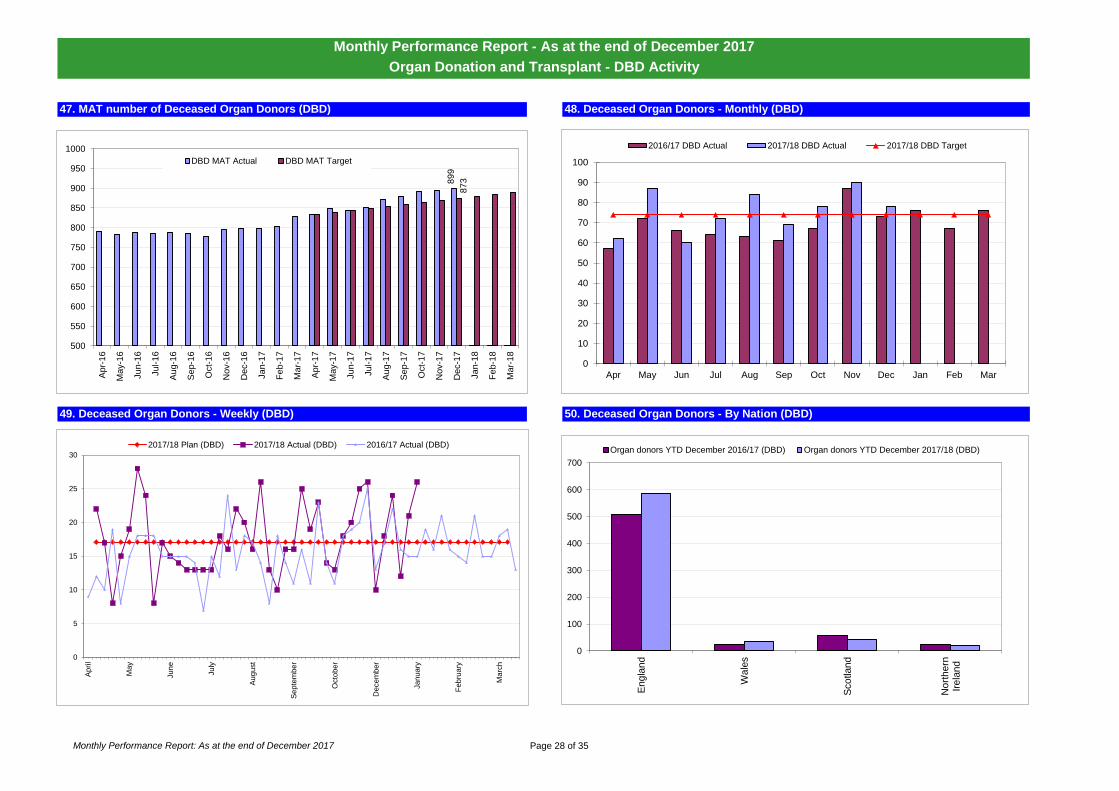
47. MAT number of Deceased Organ Donors (DBD) 48. Deceased Organ Donors - Monthly (DBD)
49. Deceased Organ Donors - Weekly (DBD) 50. Deceased Organ Donors - By Nation (DBD)
Monthly Performance Report - As at the end of December 2017
Organ Donation and Transplant - DBD Activity
0
5
10
15
20
25
30
Ap
ril
May
Jun
e
July
Au
gust
Se
pte
mber
Octo
ber
Decem
ber
Jan
uary
Febru
ary
Marc
h
2017/18 Plan (DBD) 2017/18 Actual (DBD) 2016/17 Actual (DBD)
0
100
200
300
400
500
600
700
En
gla
nd
Wale
s
Scotland
No
rth
ern
Irela
nd
Organ donors YTD December 2016/17 (DBD) Organ donors YTD December 2017/18 (DBD)8
99
87
3
500
550
600
650
700
750
800
850
900
950
1000
Ap
r-1
6
May-1
6
Jun
-16
Jul-
16
Au
g-1
6
Se
p-1
6
Oct-
16
Nov-1
6
Dec-1
6
Jan
-17
Fe
b-1
7
Ma
r-1
7
Ap
r-1
7
May-1
7
Jun
-17
Jul-
17
Au
g-1
7
Se
p-1
7
Oct-
17
Nov-1
7
Dec-1
7
Jan
-18
Fe
b-1
8
Ma
r-1
8
DBD MAT Actual DBD MAT Target
0
10
20
30
40
50
60
70
80
90
100
Apr May Jun Jul Aug Sep Oct Nov Dec Jan Feb Mar
2016/17 DBD Actual 2017/18 DBD Actual 2017/18 DBD Target
Monthly Performance Report: As at the end of December 2017 Page 28 of 35

51. MAT number of Deceased Organ Donors (DCD) 52. Deceased Organ Donors - Monthly (DCD)
53. Deceased Organ Donors - Weekly (DCD) 54. Deceased Organ Donors - By Nation (DCD)
Monthly Performance Report - As at the end of December 2017
Organ Donation and Transplant - DCD Activity
0
2
4
6
8
10
12
14
16
18
20
Ap
ril
May
Jun
e
July
Au
gust
Se
pte
mber
Octo
ber
Decem
ber
Jan
uary
Febru
ary
Marc
h
2017/18 Plan (DCD) 2017/18 Actual (DCD) 2016/17 Actual (DCD)
0
50
100
150
200
250
300
350
400
450
En
gla
nd
Wale
s
Sco
tla
nd
No
rth
ern
Ire
land
Organ donors YTD December 2016/17 (DCD) Organ donors YTD December 2017/18 (DCD)5
93
62
3
450
500
550
600
650
Apr-
16
May-1
6
Ju
n-1
6
Jul-16
Aug-1
6
Se
p-1
6
Oct-
16
Nov-1
6
De
c-1
6
Ja
n-1
7
Feb-1
7
Ma
r-1
7
Ap
r-1
7
May-1
7
Ju
n-1
7
Ju
l-1
7
Aug-1
7
Sep-1
7
Oct-
17
Nov-1
7
Dec-1
7
Ja
n-1
8
Fe
b-1
8
Mar-
18
DCD MAT Actual DCD Target
0
10
20
30
40
50
60
70
Apr May Jun Jul Aug Sep Oct Nov Dec Jan Feb Mar
2016/17 DCD Actual 2017/18 DCD Actual 2017/18 DCD Target
Monthly Performance Report: As at the end of December 2017 Page 29 of 35
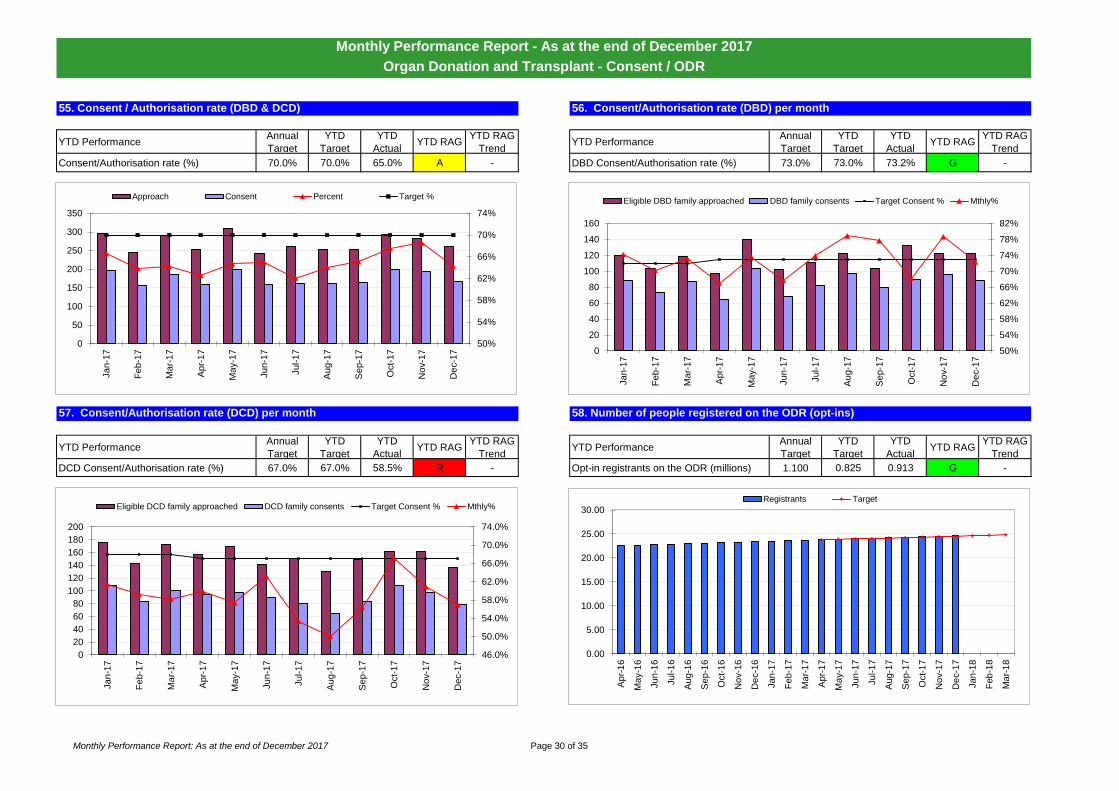
55. Consent / Authorisation rate (DBD & DCD) ODT # 1 56. Consent/Authorisation rate (DBD) per month ODT # 2
YTD PerformanceAnnual
Target
YTD
Target
YTD
ActualYTD RAG
YTD RAG
TrendYTD Performance
Annual
Target
YTD
Target
YTD
ActualYTD RAG
YTD RAG
Trend
Consent/Authorisation rate (%) 70.0% 70.0% 65.0% A - DBD Consent/Authorisation rate (%) 73.0% 73.0% 73.2% G -
57. Consent/Authorisation rate (DCD) per month ODT # 3 58. Number of people registered on the ODR (opt-ins) ODT # 8
YTD PerformanceAnnual
Target
YTD
Target
YTD
ActualYTD RAG
YTD RAG
TrendYTD Performance
Annual
Target
YTD
Target
YTD
ActualYTD RAG
YTD RAG
Trend
DCD Consent/Authorisation rate (%) 67.0% 67.0% 58.5% R - Opt-in registrants on the ODR (millions) 1.100 0.825 0.913 G -
Monthly Performance Report - As at the end of December 2017
Organ Donation and Transplant - Consent / ODR
000's
0.00
5.00
10.00
15.00
20.00
25.00
30.00
Ap
r-1
6
Ma
y-1
6
Ju
n-1
6
Jul-
16
Au
g-1
6
Sep-1
6
Oct-
16
No
v-1
6
De
c-1
6
Jan-1
7
Fe
b-1
7
Ma
r-1
7
Ap
r-1
7
Ma
y-1
7
Jun-1
7
Ju
l-1
7
Aug-1
7
Se
p-1
7
Oct-
17
No
v-1
7
De
c-1
7
Ja
n-1
8
Feb
-18
Ma
r-1
8
Registrants Target
50%
54%
58%
62%
66%
70%
74%
0
50
100
150
200
250
300
350
Jan-1
7
Feb
-17
Ma
r-1
7
Apr-
17
Ma
y-1
7
Ju
n-1
7
Jul-
17
Au
g-1
7
Se
p-1
7
Oct-
17
No
v-1
7
De
c-1
7
Approach Consent Percent Target %
50%
54%
58%
62%
66%
70%
74%
78%
82%
0
20
40
60
80
100
120
140
160
Ja
n-1
7
Fe
b-1
7
Ma
r-1
7
Apr-
17
Ma
y-1
7
Jun-1
7
Ju
l-1
7
Au
g-1
7
Se
p-1
7
Oct-
17
No
v-1
7
De
c-1
7
Eligible DBD family approached DBD family consents Target Consent % Mthly%
46.0%
50.0%
54.0%
58.0%
62.0%
66.0%
70.0%
74.0%
0
20
40
60
80
100
120
140
160
180
200
Jan-1
7
Feb
-17
Ma
r-1
7
Ap
r-1
7
Ma
y-1
7
Ju
n-1
7
Jul-1
7
Aug-1
7
Sep-1
7
Oct-
17
No
v-1
7
De
c-1
7
Eligible DCD family approached DCD family consents Target Consent % Mthly%
Monthly Performance Report: As at the end of December 2017 Page 30 of 35

59. Transplantable Organs per Donor 60. ODT Hub Operations - Incidents per Organ Offer
61. ODT Absence rate (%) 62. Annual Turnover rate (%)
Monthly Performance Report - As at the end of December 2017
Organ Donation and Transplant - Absence/Turnover
Organ Donation and Transplant - Transplantable Organs and Duty Office Incidents
0.0
0.5
1.0
1.5
2.0
2.5
3.0
3.5
4.0
4.5
Jan-1
7
Feb
-17
Ma
r-1
7
Apr-
17
Ma
y-1
7
Jun-1
7
Jul-1
7
Aug-1
7
Sep-1
7
Oct-
17
No
v-1
7
De
c-1
7
DBD (Actual) DCD (Actual)
%
0.0
0.5
1.0
1.5
2.0
2.5
3.0
3.5
4.0
4.5
5.0
Jan
-17
Feb-1
7
Mar-
17
Ap
r-17
May-1
7
Jun
-17
Jul-1
7
Au
g-1
7
Se
p-1
7
Oct-
17
Nov-1
7
Dec-1
7
ODT Overall % Absence Organ Donation % Absence Transplant Support Services % Absence
0
5
10
15
20
25
30
Jan
-17
Feb-1
7
Mar-
17
Ap
r-17
May-1
7
Jun
-17
Jul-1
7
Au
g-1
7
Se
p-1
7
Oct-
17
Nov-1
7
Dec-1
7
ODT % turnover Organ Donation % turnover Transplant Support Services % turnover
0
500
1,000
1,500
2,000
2,500
3,000
3,500
0.00%
0.20%
0.40%
0.60%
0.80%
1.00%
Jan-1
7
Feb
-17
Ma
r-1
7
Apr-
17
Ma
y-1
7
Jun-1
7
Jul-1
7
Aug-1
7
Sep-1
7
Oct-
17
No
v-1
7
De
c-1
7
Incid
en
t R
ate
Incident Rate Organ Offers made
Monthly Performance Report: As at the end of December 2017 Page 31 of 35

Page 32 of 35
SECTOR NOTES/UPDATE REPORT
NHSBT Corporate
Sickness absence was a slightly higher this month at 3.6% but equal to last year. As previously noted a sustained and significant improvement within logistics is supporting the overall performance seen in NHBST. Health and Safety – the Lost Time Incidence Rate (12 months to November 2017) is at 1.7 (a welcome decrease from last month of 0.2). Exercise “Fulcrum”, designed for the National Emergency Team (NET), will be held in January or February. The aim of the exercise is to run a NET in as realistic a manner. The date is therefore confidential and staff will be asked to take part in the exercise via teleconference. In response to the NHS marking its 70th birthday in 2018, building to a national celebration on 5th July, NHSBT will be putting NHS70 branding on our websites and other materials. We hope to involve the B Positive choir in national events, celebrate with our donors and align our staff awards with the birthday year.
Corporate - Status of Strategic Projects per TPB re porting:
Project title Status This RAG
Last RAG
Approved Cost
(£m’s)
F/Cast Cost
(£m’s)
F/cast Benefit (£m’s)
Planned to complete
F/Cast to complete
Networks & Telephony Contract Delivery R A 1.6 1.4 0.1 Apr 17 May 18 Barnsley Project (Leeds Sheffield) Delivery G G 16.5 16.5 1.1 Jan 21 Jan 21 Desktop Modernisation – Infrastructure Improvement Delivery G G 3.5 2.2 N/A Apr 17 Feb 18
QPulse Performance Remediation & Upgrade Delivery G G 0.1 0.1 N/A TBC Feb 18
Exchange On-Line Migration Delivery G G 0.6 N/A N/A TBC Jul 18 Pulse GUI/Middleware Server Upgrade Delivery G G 0.6 N/A N/A TBC Apr 18
Portfolio and Resource Management Start-Up G G N/A N/A N/A TBC May 18 Robotic Process Automation Start-Up G G N/A N/A N/A TBC Feb 18 Tooting 2nd Floor Delivery G G 0.4 0.4 0.3 Jan 18 Jan 18 Pager Replacement(i) Start-Up N/A N/A 0.1 0.1 N/A Aug 18 Feb 18
Notes: i) Not reported this month as this project will be covered under the Hub Programme Pack and will go to Hub PgM Board & ODT CPB..

63. IT system performance 64. Health and Safety - Accident Reporting
Period
Target
Period
Actual
Period
RAG
RAG
Trend
Level 1&2
MAT Target
Level 1&2 MAT
Total
Level 1-3
Mthly Target
Level 1-3
Period Actual
<=17 12 <=24 9
<=6 4 <=4.5 2
<=1 1 <=2 1
0 0 <=1 0
0 0 <=1 0
<=24 17 <=32.5 12
65. Quality System >30 days Overdue Items 66. Sickness Absence
Directorate (as at 08 Jan) DocumentsQuality
Incidents
Adverse
Events
Change
Control
Audit
FindingsTOTAL
DTS 12 20 2 18 52
M&L 3 22 4 4 4 37
ICT 4 3 7
QA 5 5
BD 3 2 5
All Other 2 4 2 1 9
Total 15 51 10 11 28 115
Pulse
G
Better
NHSBT
M&L
Organ Donation
Group Services99.95% 99.77% A Worse
DTS/SpS
Worse
EOS
NtXD
R
G Better
99.95% 100.00% Better
-
100.00% G
99.95% 100.00% G
99.95%
Monthly Performance Report - As at the end of December 2017
NHSBT Corporate - ICT / Workforce
System availability
100.00% G BetterDonor Portal 99.95%
H&S Incident Levels (x 1 mth
in arrears)
Blood Donation
TMS
OBOS 99.95% 99.02%
Hematos
99.95% 100.00%
12
0
10
20
30
Dec-1
6
Jan
-17
Feb-1
7
Mar-
17
Ap
r-17
May-1
7
Jun
-17
Jul-1
7
Au
g-1
7
Se
p-1
7
Oct-
17
Nov-1
7
Blood Supply - MTI / Donation DTS Organ Donation Group Services NHSBT Total
2017/18 Monthly Target (33)
2.50%
3.50%
4.50%
5.50%
6.50%
7.50%
8.50%
Jan
-17
Feb-1
7
Mar-
17
Ap
r-17
May-1
7
Jun
-17
Jul-1
7
Au
g-1
7
Se
p-1
7
Oct-
17
Nov-1
7
Dec-1
7
NHSBT Blood Donation Logistics
0
50
100
150
200
250
300
350
15 May 17 19 Jun 17 17 Jul 17 14 Aug 17 11 Sep 17 09 Oct 17 13 Nov 17 11 Dec 17 08 Jan 18
>30 days Quality System Overdue Items
DTS Blood ODT All Other
Monthly Performance Report: As at the end of December 2017 Page 33 of 35

Page 34 of 35
RISK MANAGEMENT Risk register summary ( net risk) and summary by themes
Corporate Risk Register Summary Red Amber Green
130 12 112 6
The dependency and reliance on the SME that currently provides support for our critical operational systems (PULSE/Hematos) and, in particular, their ability to retain the necessary capability and service levels as we transition away to new systems as part of the CSM project. The ability to supply in case of the loss of a key facility (e.g. Filton, Speke) or the loss of critical IT systems (Pulse, Hematos, networks etc). The risk of critical system loss is increasing on the back of the significant changes that are planned (e.g. new desktop, CSM etc.) and the significant complexity and inter-dependency between them. Inability to supply as a result of planning / supply challenges through: • (at the macro level) limited visibility with regard to longer term blood demand trends and especially when current demand decline
will be offset by the anticipated impact of demographic trends • significant differential short term demand trends at group / component level (eg O neg red cells, A neg platelets) The scale of the transformation programme across NHSBT will create a significant challenge on the capacity and capability of NHSBT to safely execute the change (both ICT and business resources) and a potential distraction to delivering business as usual. The ability to avoid blood price rises is highly dependant on our ability to manage the combined impact of : • the increased cost of CSM (and uncertainty regarding the phasing of the spend and timescale) • the organisational focus required to safely implement CSM and a slow down in the delivery of underlying BAU efficiency
improvements • ongoing reduction in red cell demand and the loss of related income and contribution • being able to generate significant productivity improvements in Blood Donation especially (given the inherent productivity gap
and high contribution to overall costs) and the significant impact on service configuration required. • the marketing costs needed to re-build / re-balance the blood donor base Ongoing reduction in demand will require significant changes to the configuration of blood collection services in order to not just maintain productivity but deliver the increased Blood 2020 targets. This would involve fewer / larger mobile sessions, greater use of fixed donor venues and much less collection activity in certain parts of the country. This could result in adverse donor reaction (and potentially attendance) if not managed and communicated well and an impact on supply if, for example, sufficient numbers of O neg donors cannot be retained. The high prevalence of manual, paper based and verbal processes throughout NHSBT’s operations, especially within reference testing and in the duty office within organ donation and transplant. Although these are mitigated by appropriate manual control checks, and new systems are removing transcription in some areas, there is a residual risk that these are ineffective and cause transcription errors that could lead to the death or harm of NHS patients.

Page 35 of 35
RISK MANAGEMENT Risk register summary ( net risk) and summary by themes (cont.)
Risk to delivery of TOT 2020 strategic targets driven by : • adverse trends in the organ donor pool • inability to change consent levels • lack of funding required for supporting business cases in respect of consent strategy and new technologies • lack of transplant capacity. Changing clinical/commissioning intentions in Stem Cells (ie Cord Blood / BBMR) as a recommended treatment, may impact on the outcomes and therefore the future viability of these services.
There are no new high/extreme risk’s this month: There is a risk that significant numbers of donors may need to be deferred as a result of the impact of the Interval/Compare trials which has not yet been formally escalated through the risk register. If this risk were to materialise it would represent a threat to supply and mitigation would require a significant increase in active donor numbers (with a resulting increase in marketing costs) and introduction of more accurate iron testing (also at increased cost).