Embed Size (px)
Citation preview
BOARD OF TRUSTEES
THE CITY UNIVERSITY OF NEW YORK
COMMITTEE ON FISCAL AFFAIRS AGENDA FOR MEETING
April 15, 2019
I. ACTION ITEMS
A. APPROVAL OF THE MINUTES OF February 25, 2019
B. POLICY CALENDAR
1. Borough of Manhattan Community College
Expenditure Authorization for Furniture
2. Central Office
Authorization of an Enterprise License Agreement with the
Palo Alto Networks Corporation
Authorization of Three Contracts for Executive Search and
Recruitment for Community Colleges
II. INFORMATION ITEMS
1. Fiscal Matters Information Report
2. Third Quarter Financial Report

BOARD OF TRUSTEES THE CITY UNIVERSITY OF NEW YORK
COMMITTEE ON MINUTES OF THE MEETING FISCAL AFFAIRS FEBRUARY 25, 2019
1
The meeting was called to order by Committee Chair Fernando Ferrer at 6:32 p.m. The following people were present: Committee Members: Hon. Fernando Ferrer, Chair Hon. Henry T. Berger Hon. Lorraine A. Cortés-Vázquez Hon. Ken Sunshine Faculty Member: Prof. John Verzani, faculty representative Student Member: Ms. Razieh Arabi, student representative COP Liaison: President José Luis Cruz Ex-officio: Hon. Barry F. Schwartz (left @ 7:28 p.m.) Trustee Observer: Hon. Haris Khan
Observer: Prof. Ned Benton Trustee Staff: Senior Advisor to the Chancellor and Secretary of
the Board Gayle M. Horwitz Ms. Teisha Mitchell Ms. Fenella Ramsami University Staff: Interim Chancellor Vita C. Rabinowitz Senior Vice Chancellor and Chief Financial Officer
Matthew Sapienza Deputy Chief Financial Officer Christina Chiappa University Executive Budget Director Catherine
Abata
Cal. No. DISPOSITION
The agenda items were considered and acted upon in the following order: I. ACTION ITEMS:
A. APPROVAL OF THE MINUTES OF THE MEETING OF JANUARY 14, 2019. Moved by
Committee Chair Fernando Ferrer and seconded by Trustee Lorraine Cortés-Vázquez, the minutes were unanimously approved as submitted.
B. POLICY CALENDAR
1. Borough of Manhattan Community College - Authorization of a Contract with Summit Security Services. Committee Chair Ferrer requested the Committee’s approval for authorization of the contract with Summit Security Services for Borough of Manhattan Community College (BMCC). Senior Vice Chancellor and Chief Financial Officer (SVC&CFO) Matthew Sapienza added that BMCC will use this contract to provide supplemental security services for its facilities at 199 Chambers Street, 70 Murray, 163 West 125th Street, and 25 Broadway. Moved by Committee Chair Ferrer and seconded by Prof. John Verzani, and following discussion, the item was unanimously approved for submission to the Board.
2. Approval of Academic Excellence Fees: Baruch College Hunter College John Jay College

BOARD OF TRUSTEES THE CITY UNIVERSITY OF NEW YORK
COMMITTEE ON MINUTES OF THE MEETING FISCAL AFFAIRS FEBRUARY 25, 2019
2
Lehman College Queens College
Committee Chair Ferrer requested the Committee’s approval of requests for academic excellence fees for the following programs: Baruch College, Master of International Affairs (MIA); Hunter College, Master of Science in Integrated Program in Nutrition and Dietetics; John Jay College, Master of Arts in Criminal Justice; Lehman College, Master of Science in Accounting and Master of Science in Business; and Queens College, Post Baccalaureate Pre-Health Certificate Program. SVC&CFO Sapienza then provided background on the requests. Senior officials further provided information about the academic excellence fee proposal on the requests at the respective colleges. A discussion about the academic excellence fees followed, including the operating budget relating to the Marxe School of Public and International Affairs program, student government consultation, Senate Council composition and voting governance structure, the Bloomberg terminals, revenue sources, anticipated enrollment relating to the Post Baccalaureate Pre-Health Certificate Program at Queens College, annual percentage increases, process and submission timeline, accounting and academic structure, and degree credits. Vice Chairperson Barry Schwartz suggested that Office of Budget and Finance (OBF) to make a request of Bloomberg philanthropies for a donation of terminals across the CUNY campuses. Committee Chair Ferrer then requested that OBF provide the Committee with a metrics report on approved academic excellence fees. He further suggested that the Chancellor and Senior Vice Chancellor and Chief Operating Officer consult with CUNY students on process improvements. Trustee Cortés-Vázquez made a motion to amend the resolution by removing the word, “elected” in the third WHEREAS paragraph. Committee Chair Ferrer seconded, and following discussion, the amended motion was approved. Moved by Committee Chair Ferrer and seconded by Trustee Henry Berger, and following discussion, the amended item was approved for submission to the Board. Ms. Razieh Arabi voted NO.
3. Approval of Executive Program Supplement Fees:
Baruch College John Jay College
SVC&CFO Sapienza requested the Committee’s approval of requests for Executive Program Supplement fees for the following programs: Baruch College, Executive Masters of Science in Entrepreneurship (Dual Degree Program with Brazilian International Business School), Executive Masters of Science in Finance (Dual Degree Program with Brazilian International Business School), Executive Masters of Science in Finance, Executive Masters of Science in Information Systems with Concentration in Data Analytics, and Executive Masters of Science in Industrial and Organizational Psychology; and John Jay College, Executive Master of Arts in Criminal Justice.

BOARD OF TRUSTEES THE CITY UNIVERSITY OF NEW YORK
COMMITTEE ON MINUTES OF THE MEETING FISCAL AFFAIRS FEBRUARY 25, 2019
3
Senior officials further provided information about the supplement fee proposal on the requests at the respective colleges. A discussion about the program supplement fees followed, including process structure and tuition, professional targeted market, program specifics relating to the Executive Master’s program at John Jay College, and program objectives. Committee Chair Ferrer made a motion to amend the resolution by removing the word, “elected” in the fourth WHEREAS paragraph, and replacing the words, “academic excellence fees” with “program supplement fees” in the second RESOLVED paragraph. Trustee Berger seconded, and following discussion, the amended motion was approved. Moved by Committee Chair Ferrer and seconded by Trustee Berger, and following discussion, the amended item was approved for submission to the Board. Trustee Cortés-Vázquez voted NO. Ms. Arabi abstained.
II. INFORMATION ITEM:
A. Fiscal Matters Information Report
SVC&CFO Sapienza reported on the CFA Financial Matters Information items for February 2019, noting that the report will provide a list of items—grants, non-monetary gifts, and blanket tuition waivers.
Committee Chair Ferrer moved to adjourn the meeting. The motion was seconded by Trustee Cortés-Vázquez and the meeting was adjourned at 7:55 p.m.
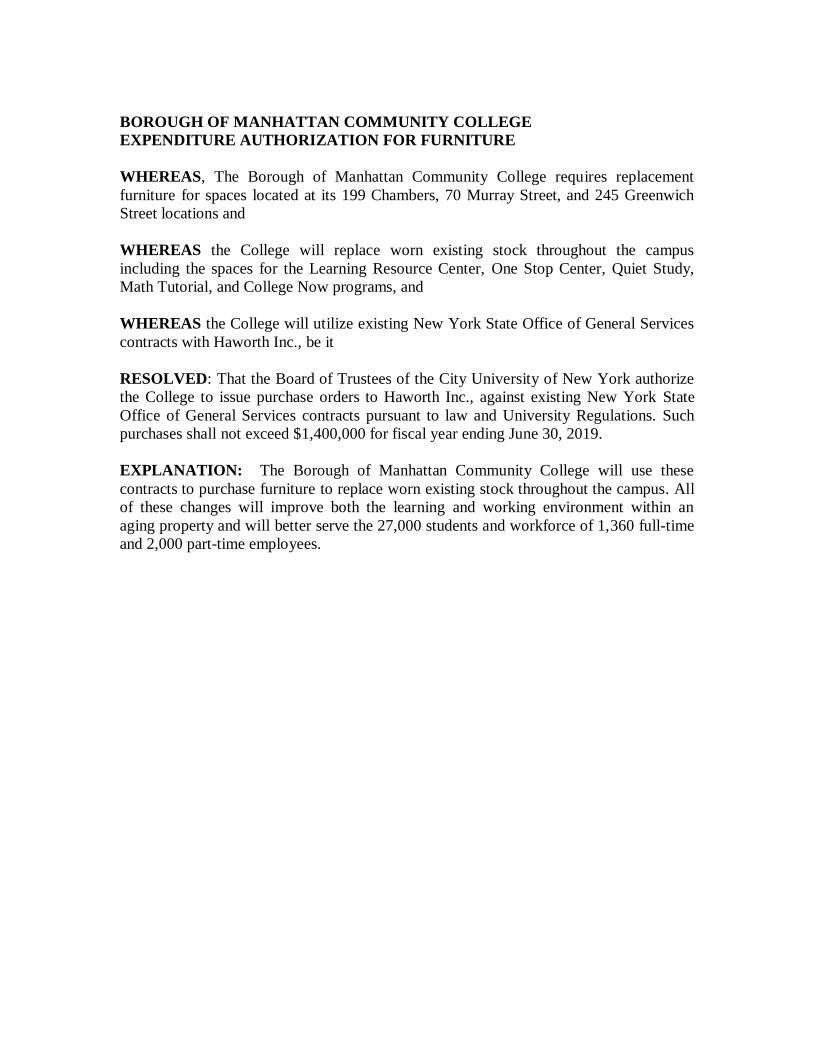
BOROUGH OF MANHATTAN COMMUNITY COLLEGE
EXPENDITURE AUTHORIZATION FOR FURNITURE
WHEREAS, The Borough of Manhattan Community College requires replacement
furniture for spaces located at its 199 Chambers, 70 Murray Street, and 245 Greenwich
Street locations and
WHEREAS the College will replace worn existing stock throughout the campus
including the spaces for the Learning Resource Center, One Stop Center, Quiet Study,
Math Tutorial, and College Now programs, and
WHEREAS the College will utilize existing New York State Office of General Services
contracts with Haworth Inc., be it
RESOLVED: That the Board of Trustees of the City University of New York authorize
the College to issue purchase orders to Haworth Inc., against existing New York State
Office of General Services contracts pursuant to law and University Regulations. Such
purchases shall not exceed $1,400,000 for fiscal year ending June 30, 2019.
EXPLANATION: The Borough of Manhattan Community College will use these
contracts to purchase furniture to replace worn existing stock throughout the campus. All
of these changes will improve both the learning and working environment within an
aging property and will better serve the 27,000 students and workforce of 1,360 full-time
and 2,000 part-time employees.
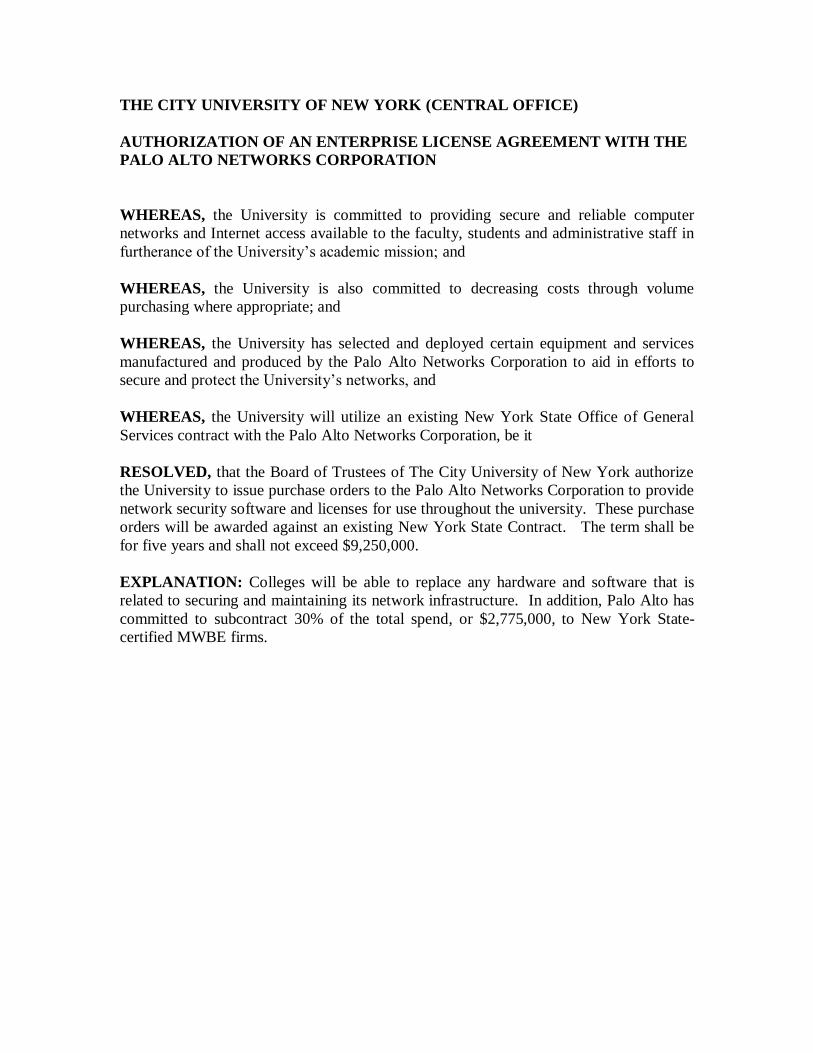
THE CITY UNIVERSITY OF NEW YORK (CENTRAL OFFICE)
AUTHORIZATION OF AN ENTERPRISE LICENSE AGREEMENT WITH THE
PALO ALTO NETWORKS CORPORATION
WHEREAS, the University is committed to providing secure and reliable computer
networks and Internet access available to the faculty, students and administrative staff in
furtherance of the University’s academic mission; and
WHEREAS, the University is also committed to decreasing costs through volume
purchasing where appropriate; and
WHEREAS, the University has selected and deployed certain equipment and services
manufactured and produced by the Palo Alto Networks Corporation to aid in efforts to
secure and protect the University’s networks, and
WHEREAS, the University will utilize an existing New York State Office of General
Services contract with the Palo Alto Networks Corporation, be it
RESOLVED, that the Board of Trustees of The City University of New York authorize
the University to issue purchase orders to the Palo Alto Networks Corporation to provide
network security software and licenses for use throughout the university. These purchase
orders will be awarded against an existing New York State Contract. The term shall be
for five years and shall not exceed $9,250,000.
EXPLANATION: Colleges will be able to replace any hardware and software that is
related to securing and maintaining its network infrastructure. In addition, Palo Alto has
committed to subcontract 30% of the total spend, or $2,775,000, to New York State-
certified MWBE firms.
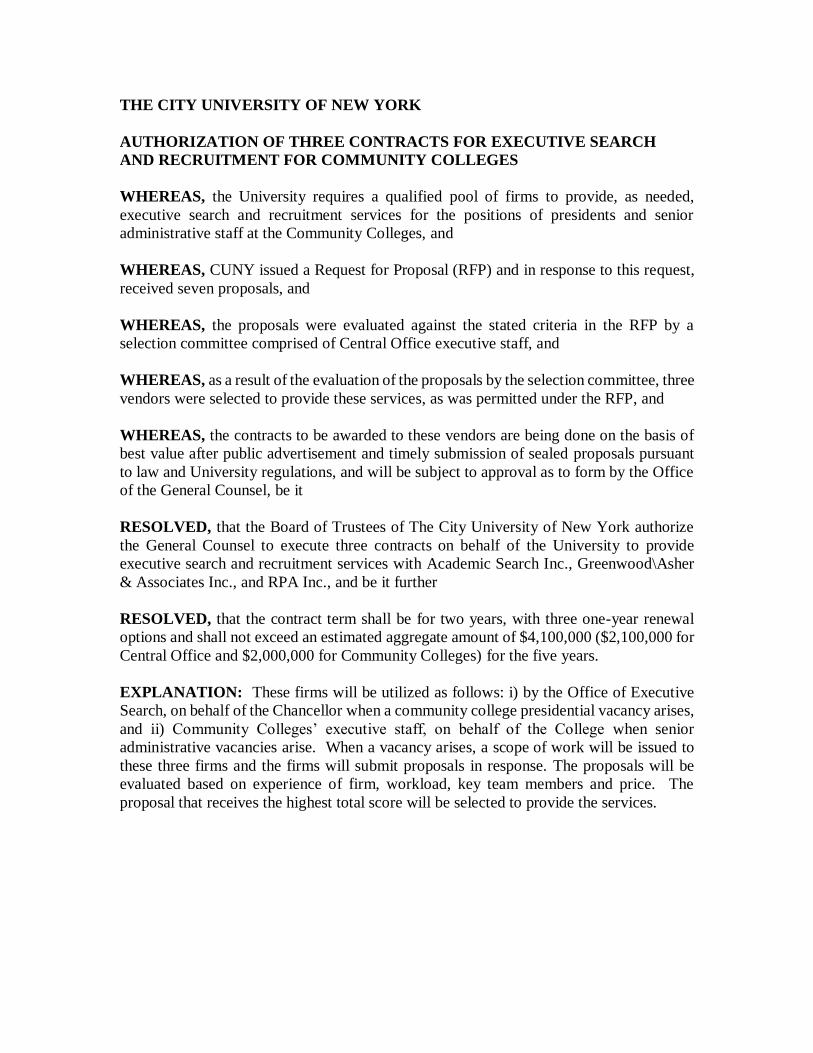
THE CITY UNIVERSITY OF NEW YORK
AUTHORIZATION OF THREE CONTRACTS FOR EXECUTIVE SEARCH
AND RECRUITMENT FOR COMMUNITY COLLEGES
WHEREAS, the University requires a qualified pool of firms to provide, as needed,
executive search and recruitment services for the positions of presidents and senior
administrative staff at the Community Colleges, and
WHEREAS, CUNY issued a Request for Proposal (RFP) and in response to this request,
received seven proposals, and
WHEREAS, the proposals were evaluated against the stated criteria in the RFP by a
selection committee comprised of Central Office executive staff, and
WHEREAS, as a result of the evaluation of the proposals by the selection committee, three
vendors were selected to provide these services, as was permitted under the RFP, and
WHEREAS, the contracts to be awarded to these vendors are being done on the basis of
best value after public advertisement and timely submission of sealed proposals pursuant
to law and University regulations, and will be subject to approval as to form by the Office
of the General Counsel, be it
RESOLVED, that the Board of Trustees of The City University of New York authorize
the General Counsel to execute three contracts on behalf of the University to provide
executive search and recruitment services with Academic Search Inc., Greenwood\Asher
& Associates Inc., and RPA Inc., and be it further
RESOLVED, that the contract term shall be for two years, with three one-year renewal
options and shall not exceed an estimated aggregate amount of $4,100,000 ($2,100,000 for
Central Office and $2,000,000 for Community Colleges) for the five years.
EXPLANATION: These firms will be utilized as follows: i) by the Office of Executive
Search, on behalf of the Chancellor when a community college presidential vacancy arises,
and ii) Community Colleges’ executive staff, on behalf of the College when senior
administrative vacancies arise. When a vacancy arises, a scope of work will be issued to
these three firms and the firms will submit proposals in response. The proposals will be
evaluated based on experience of firm, workload, key team members and price. The
proposal that receives the highest total score will be selected to provide the services.
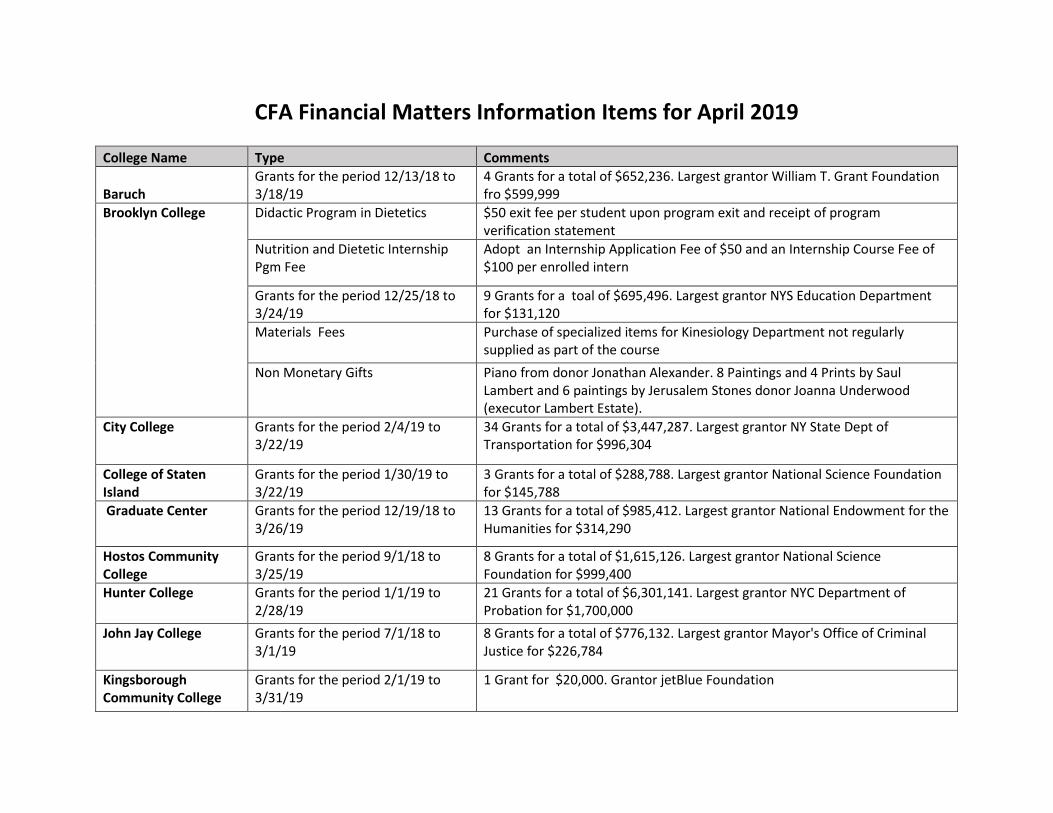
CFA Financial Matters Information Items for April 2019
College Name Type Comments
Baruch Grants for the period 12/13/18 to 3/18/19
4 Grants for a total of $652,236. Largest grantor William T. Grant Foundation fro $599,999
Brooklyn College Didactic Program in Dietetics $50 exit fee per student upon program exit and receipt of program verification statement
Nutrition and Dietetic Internship Pgm Fee
Adopt an Internship Application Fee of $50 and an Internship Course Fee of $100 per enrolled intern
Grants for the period 12/25/18 to 3/24/19
9 Grants for a toal of $695,496. Largest grantor NYS Education Department for $131,120
Materials Fees Purchase of specialized items for Kinesiology Department not regularly supplied as part of the course
Non Monetary Gifts Piano from donor Jonathan Alexander. 8 Paintings and 4 Prints by Saul Lambert and 6 paintings by Jerusalem Stones donor Joanna Underwood (executor Lambert Estate).
City College Grants for the period 2/4/19 to 3/22/19
34 Grants for a total of $3,447,287. Largest grantor NY State Dept of Transportation for $996,304
College of Staten Island
Grants for the period 1/30/19 to 3/22/19
3 Grants for a total of $288,788. Largest grantor National Science Foundation for $145,788
Graduate Center Grants for the period 12/19/18 to 3/26/19
13 Grants for a total of $985,412. Largest grantor National Endowment for the Humanities for $314,290
Hostos Community College
Grants for the period 9/1/18 to 3/25/19
8 Grants for a total of $1,615,126. Largest grantor National Science Foundation for $999,400
Hunter College Grants for the period 1/1/19 to 2/28/19
21 Grants for a total of $6,301,141. Largest grantor NYC Department of Probation for $1,700,000
John Jay College Grants for the period 7/1/18 to 3/1/19
8 Grants for a total of $776,132. Largest grantor Mayor's Office of Criminal Justice for $226,784
Kingsborough Community College
Grants for the period 2/1/19 to 3/31/19
1 Grant for $20,000. Grantor jetBlue Foundation
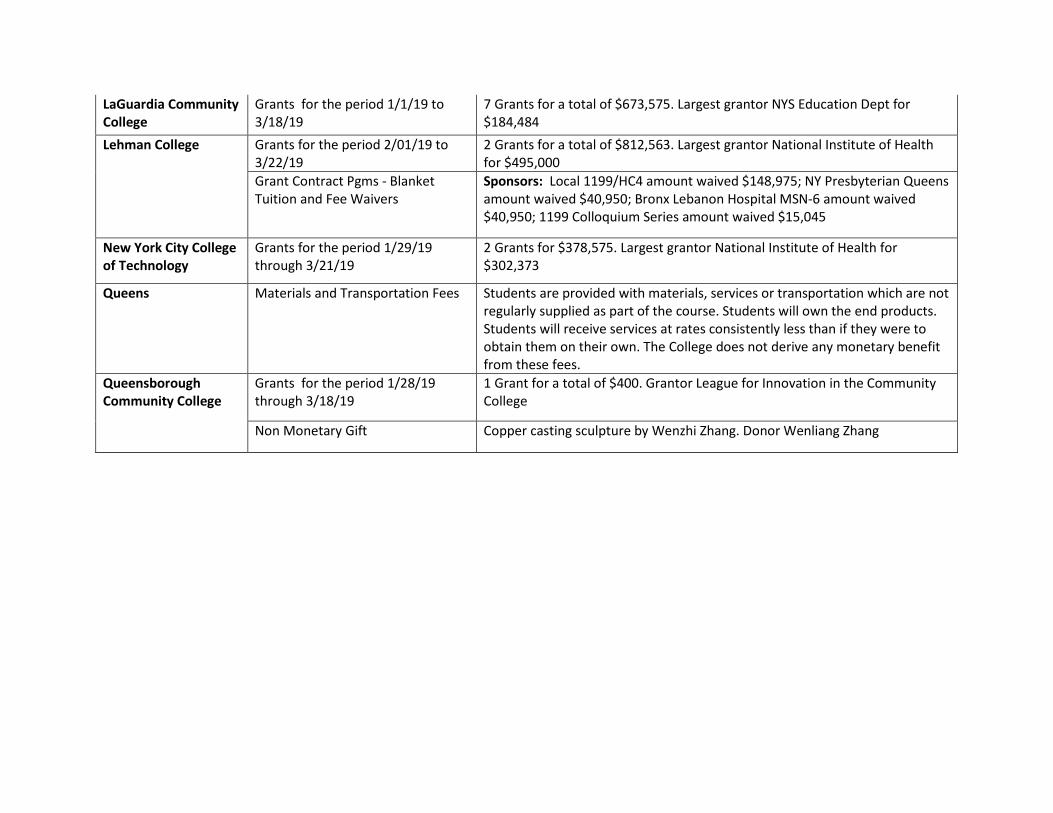
LaGuardia Community College
Grants for the period 1/1/19 to 3/18/19
7 Grants for a total of $673,575. Largest grantor NYS Education Dept for $184,484
Lehman College Grants for the period 2/01/19 to 3/22/19
2 Grants for a total of $812,563. Largest grantor National Institute of Health for $495,000
Grant Contract Pgms - Blanket Tuition and Fee Waivers
Sponsors: Local 1199/HC4 amount waived $148,975; NY Presbyterian Queens amount waived $40,950; Bronx Lebanon Hospital MSN-6 amount waived $40,950; 1199 Colloquium Series amount waived $15,045
New York City College of Technology
Grants for the period 1/29/19 through 3/21/19
2 Grants for $378,575. Largest grantor National Institute of Health for $302,373
Queens Materials and Transportation Fees Students are provided with materials, services or transportation which are not regularly supplied as part of the course. Students will own the end products. Students will receive services at rates consistently less than if they were to obtain them on their own. The College does not derive any monetary benefit from these fees.
Queensborough Community College
Grants for the period 1/28/19 through 3/18/19
1 Grant for a total of $400. Grantor League for Innovation in the Community College
Non Monetary Gift Copper casting sculpture by Wenzhi Zhang. Donor Wenliang Zhang
The City University of New York
FY2019 Third Quarter Financial Report
University Budget Office
April 4, 2019

The City University of New York Financial Report Overview
The Financial Report provides expenditure, revenue, enrollment, and staffing data for the individual colleges as well as University totals. This information is presented both graphically and in tabular format.
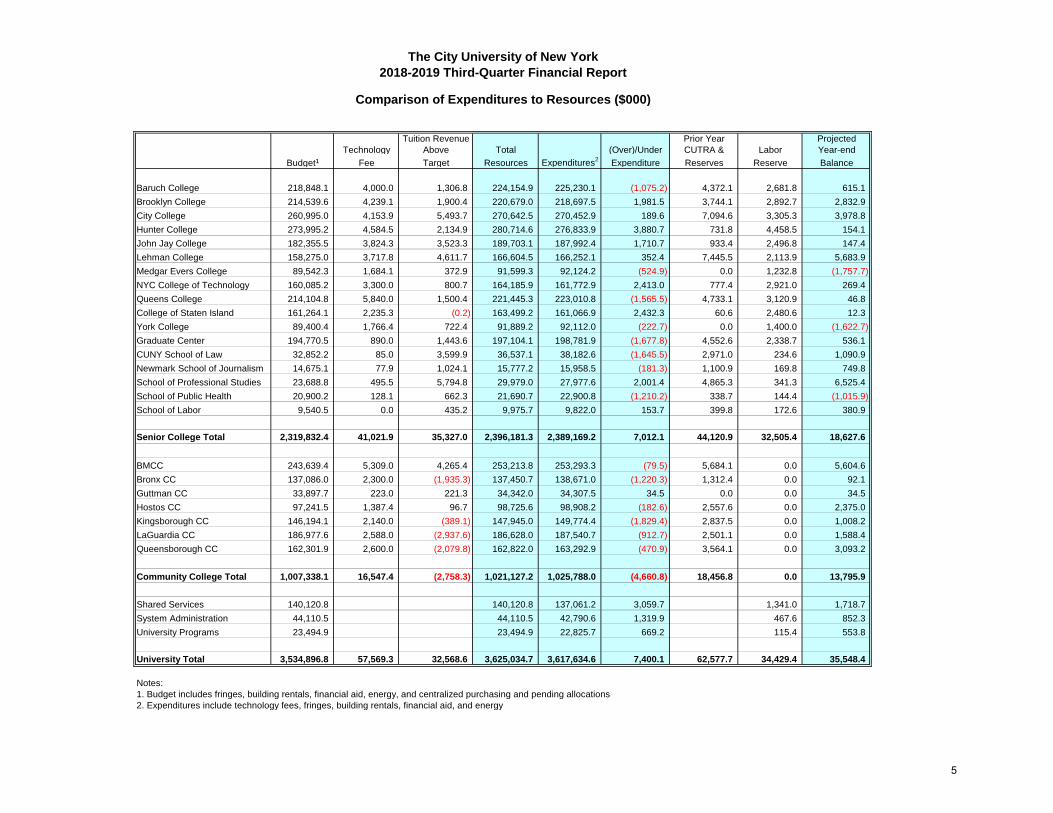
Comparison of Expenditures to Resources
The comparison of total expenditures to total revenue provides the projected year-end condition of each college. Total resources include campus-based tax-levy allocations as well as centrally administered expenditures such as fringes, building rentals and energy. For the community colleges, in addition to technology fees, revenues from language immersion programs and non-miscellaneous income are included.
City University Tuition Reimbursable Account (CUTRA) and reserve balances are used to offset expenditures above total resources. CUTRA and reserve funds are unexpended tuition revenue collections above target for previous years.
Expenditures
Current year 2018-19 tax levy expenditures are compared to 2017-18 tax levy expenditures in total and by category. Expenditures are net of any refunds of appropriations.
Revenue
Revenue data provided includes the FY2019 target and a comparison of FY2019 projected collections to FY2018 actual collections.
Enrollment
FY2019 Fall Headcount and FTE enrollment are compared FY2018 Fall Headcount and FTE totals. These figures were provided by the Office of Institutional Research and Analysis.
Staffing
Full-time staff figures are provided for I&DR Teaching, I&DR Support, Academic Support, Student Services, Maintenance & Operations, General Administration, General Institutional Services, SEEK/CD Staff and Other staff for Spring 2019, Fall 2017, and Fall 2016. The sources for Fall 2016 and Fall 2017 are the legacy FIS/FAS system. The source for Spring 2019 is CUNYfirst.
FY2019 Third-Quarter Financial Report Executive Summary
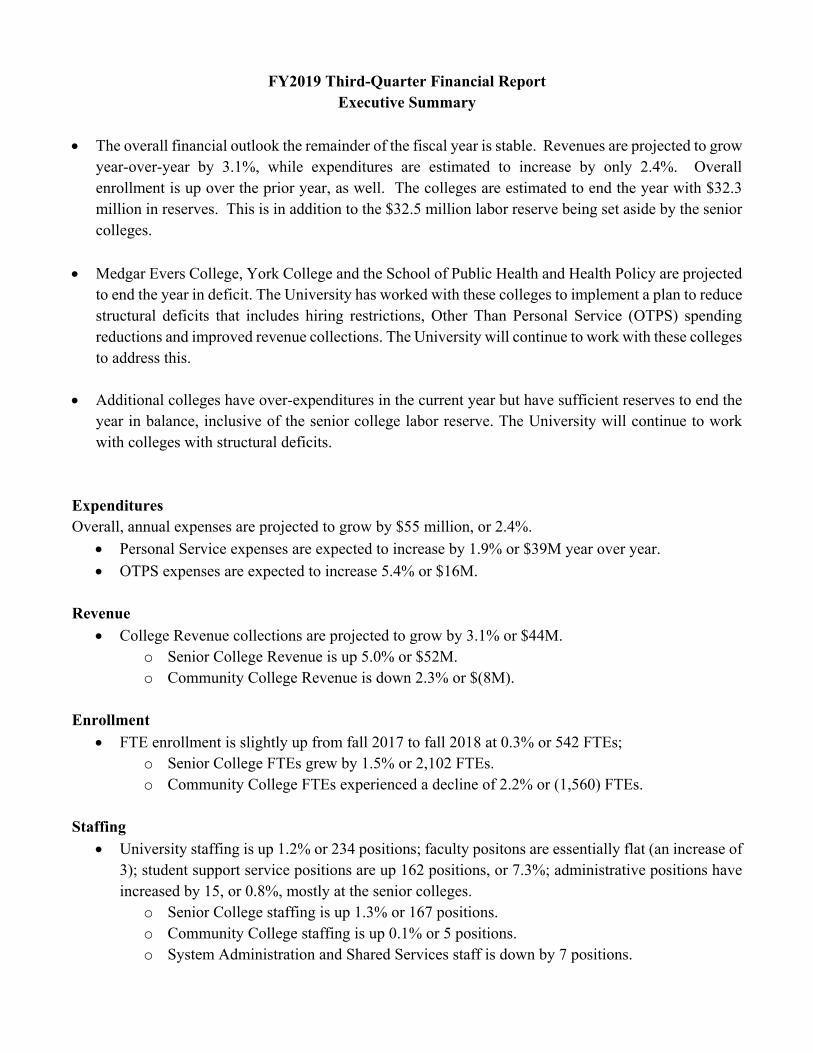
The overall financial outlook the remainder of the fiscal year is stable. Revenues are projected to grow year-over-year by 3.1%, while expenditures are estimated to increase by only 2.4%. Overall enrollment is up over the prior year, as well. The colleges are estimated to end the year with $32.3 million in reserves. This is in addition to the $32.5 million labor reserve being set aside by the senior colleges.
Medgar Evers College, York College and the School of Public Health and Health Policy are projected to end the year in deficit. The University has worked with these colleges to implement a plan to reduce structural deficits that includes hiring restrictions, Other Than Personal Service (OTPS) spending reductions and improved revenue collections. The University will continue to work with these colleges to address this.
Additional colleges have over-expenditures in the current year but have sufficient reserves to end the
year in balance, inclusive of the senior college labor reserve. The University will continue to work with colleges with structural deficits.
Expenditures Overall, annual expenses are projected to grow by $55 million, or 2.4%.
Personal Service expenses are expected to increase by 1.9% or $39M year over year.
OTPS expenses are expected to increase 5.4% or $16M. Revenue
College Revenue collections are projected to grow by 3.1% or $44M. o Senior College Revenue is up 5.0% or $52M. o Community College Revenue is down 2.3% or $(8M).
Enrollment
FTE enrollment is slightly up from fall 2017 to fall 2018 at 0.3% or 542 FTEs; o Senior College FTEs grew by 1.5% or 2,102 FTEs. o Community College FTEs experienced a decline of 2.2% or (1,560) FTEs.
Staffing
University staffing is up 1.2% or 234 positions; faculty positons are essentially flat (an increase of 3); student support service positions are up 162 positions, or 7.3%; administrative positions have increased by 15, or 0.8%, mostly at the senior colleges.
o Senior College staffing is up 1.3% or 167 positions. o Community College staffing is up 0.1% or 5 positions. o System Administration and Shared Services staff is down by 7 positions.

EXPENDITURES
4
Tuition Revenue Prior Year Projected
Technology Above Total (Over)/Under CUTRA & Labor Year-end
Budget¹ Fee Target Resources Expenditures2
Expenditure Reserves Reserve Balance
Baruch College 218,848.1 4,000.0 1,306.8 224,154.9 225,230.1 (1,075.2) 4,372.1 2,681.8 615.1
Brooklyn College 214,539.6 4,239.1 1,900.4 220,679.0 218,697.5 1,981.5 3,744.1 2,892.7 2,832.9
City College 260,995.0 4,153.9 5,493.7 270,642.5 270,452.9 189.6 7,094.6 3,305.3 3,978.8
Hunter College 273,995.2 4,584.5 2,134.9 280,714.6 276,833.9 3,880.7 731.8 4,458.5 154.1
John Jay College 182,355.5 3,824.3 3,523.3 189,703.1 187,992.4 1,710.7 933.4 2,496.8 147.4
Lehman College 158,275.0 3,717.8 4,611.7 166,604.5 166,252.1 352.4 7,445.5 2,113.9 5,683.9
Medgar Evers College 89,542.3 1,684.1 372.9 91,599.3 92,124.2 (524.9) 0.0 1,232.8 (1,757.7)
NYC College of Technology 160,085.2 3,300.0 800.7 164,185.9 161,772.9 2,413.0 777.4 2,921.0 269.4
Queens College 214,104.8 5,840.0 1,500.4 221,445.3 223,010.8 (1,565.5) 4,733.1 3,120.9 46.8
College of Staten Island 161,264.1 2,235.3 (0.2) 163,499.2 161,066.9 2,432.3 60.6 2,480.6 12.3
York College 89,400.4 1,766.4 722.4 91,889.2 92,112.0 (222.7) 0.0 1,400.0 (1,622.7)
Graduate Center 194,770.5 890.0 1,443.6 197,104.1 198,781.9 (1,677.8) 4,552.6 2,338.7 536.1
CUNY School of Law 32,852.2 85.0 3,599.9 36,537.1 38,182.6 (1,645.5) 2,971.0 234.6 1,090.9
Newmark School of Journalism 14,675.1 77.9 1,024.1 15,777.2 15,958.5 (181.3) 1,100.9 169.8 749.8
School of Professional Studies 23,688.8 495.5 5,794.8 29,979.0 27,977.6 2,001.4 4,865.3 341.3 6,525.4
School of Public Health 20,900.2 128.1 662.3 21,690.7 22,900.8 (1,210.2) 338.7 144.4 (1,015.9)
School of Labor 9,540.5 0.0 435.2 9,975.7 9,822.0 153.7 399.8 172.6 380.9
Senior College Total 2,319,832.4 41,021.9 35,327.0 2,396,181.3 2,389,169.2 7,012.1 44,120.9 32,505.4 18,627.6
BMCC 243,639.4 5,309.0 4,265.4 253,213.8 253,293.3 (79.5) 5,684.1 0.0 5,604.6
Bronx CC 137,086.0 2,300.0 (1,935.3) 137,450.7 138,671.0 (1,220.3) 1,312.4 0.0 92.1
Guttman CC 33,897.7 223.0 221.3 34,342.0 34,307.5 34.5 0.0 0.0 34.5
Hostos CC 97,241.5 1,387.4 96.7 98,725.6 98,908.2 (182.6) 2,557.6 0.0 2,375.0
Kingsborough CC 146,194.1 2,140.0 (389.1) 147,945.0 149,774.4 (1,829.4) 2,837.5 0.0 1,008.2
LaGuardia CC 186,977.6 2,588.0 (2,937.6) 186,628.0 187,540.7 (912.7) 2,501.1 0.0 1,588.4
Queensborough CC 162,301.9 2,600.0 (2,079.8) 162,822.0 163,292.9 (470.9) 3,564.1 0.0 3,093.2
Community College Total 1,007,338.1 16,547.4 (2,758.3) 1,021,127.2 1,025,788.0 (4,660.8) 18,456.8 0.0 13,795.9
Shared Services 140,120.8 140,120.8 137,061.2 3,059.7 1,341.0 1,718.7
System Administration 44,110.5 44,110.5 42,790.6 1,319.9 467.6 852.3
University Programs 23,494.9 23,494.9 22,825.7 669.2 115.4 553.8
University Total 3,534,896.8 57,569.3 32,568.6 3,625,034.7 3,617,634.6 7,400.1 62,577.7 34,429.4 35,548.4
Notes:
1. Budget includes fringes, building rentals, financial aid, energy, and centralized purchasing and pending allocations
2. Expenditures include technology fees, fringes, building rentals, financial aid, and energy
Comparison of Expenditures to Resources ($000)
2018-2019 Third-Quarter Financial Report
The City University of New York
5

The City University of New York
2018-2019 Third-Quarter Financial Report
FY2019 Budget Details
Campus
Allocations Fringes Energy Building Rentals Financial Aid Total
Baruch College 140,747.2 68,225.8 5,950.9 2,217.9 1,706.3 218,848.1
Brooklyn College 138,620.8 61,575.1 9,423.1 2,934.5 1,986.0 214,539.6
City College 164,214.4 78,425.4 13,666.7 2,747.3 1,941.2 260,995.0
Hunter College 181,287.8 76,734.2 8,628.1 6,141.9 1,203.2 273,995.2
John Jay College 115,476.8 50,698.5 6,204.1 7,978.5 1,997.7 182,355.5
Lehman College 102,904.7 46,999.7 5,641.3 876.8 1,852.4 158,275.0
Medgar Evers College 59,127.9 26,933.6 2,336.5 335.4 808.9 89,542.3
NYC College of Technology 104,182.7 42,357.9 8,276.5 3,819.0 1,449.0 160,085.2
Queens College 136,829.1 62,503.4 7,815.7 5,114.1 1,842.6 214,104.8
College of Staten Island 106,712.5 46,486.0 6,161.3 639.2 1,265.0 161,264.1
York College 58,181.4 26,821.7 3,202.4 - 1,195.0 89,400.4
Graduate Center 136,691.6 46,488.3 2,590.6 - 9,000.0 194,770.5
CUNY School of Law 18,315.3 9,860.5 34.7 4,630.5 11.2 32,852.2
Newmark School of Journalism 8,054.5 3,791.1 4.5 2,821.9 3.1 14,675.1
School of Professional Studies 14,235.2 5,992.2 207.9 3,249.9 3.6 23,688.8
School of Public Health 11,149.8 6,684.4 - 3,066.1 - 20,900.2
School of Labor 5,678.3 2,083.4 - 1,778.9 - 9,540.5
Senior College Total 1,502,410.0 662,661.2 80,144.2 48,352.0 26,265.1 2,319,832.4
BMCC 179,737.6 58,186.6 5,347.6 - 367.6 243,639.4
Bronx CC 95,946.0 37,625.5 3,217.4 - 297.1 137,086.0
Guttman CC 25,758.5 7,801.0 338.2 - - 33,897.7
Hostos CC 68,504.7 26,148.2 2,484.1 - 104.6 97,241.5
Kingsborough CC 101,699.5 39,249.3 5,001.7 - 243.6 146,194.1
LaGuardia CC 135,486.1 47,479.4 3,775.2 - 236.8 186,977.6
Queensborough CC 113,584.0 44,970.8 3,530.6 - 216.6 162,301.9
Community College Total 720,716.4 261,460.6 23,694.9 - 1,466.2 1,007,338.1
Shared Services 95,853.8 26,983.5 329.3 16,954.2 - 140,120.8
System Administration 27,898.3 9,873.2 135.5 6,203.5 - 44,110.5
University Programs 19,536.8 2,424.1 11.0 1,523.1 - 23,494.9
University Total 2,366,415.2 963,402.6 104,314.9 73,032.8 27,731.3 3,534,896.8
1. Campus based allocations are the current levels and pending items
2. Fringes based on Projected Fringes for current fiscal year prorated based on PSR projections
3. SC Energy based on current year allocation plus water and sewer, CC Energy based on prior year actuals and excludes fuel oil
4. Building rentals from current year SC Rent Budget, CC building rentals are included in campus based allocation
5. Financial Aid includes centrally managed SEEK/CD
6
The City University of New York
2018-2019 Third-Quarter Financial Report
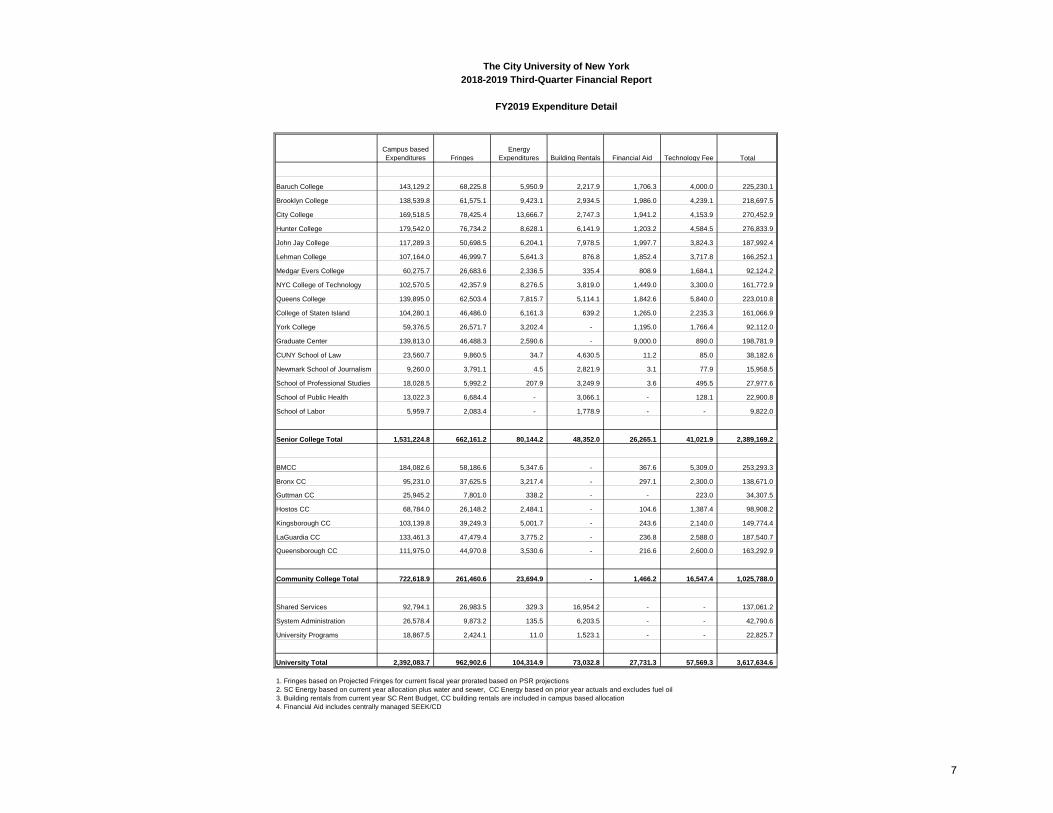
FY2019 Expenditure Detail
Campus based
Expenditures Fringes
Energy
Expenditures Building Rentals Financial Aid Technology Fee Total
Baruch College 143,129.2 68,225.8 5,950.9 2,217.9 1,706.3 4,000.0 225,230.1
Brooklyn College 138,539.8 61,575.1 9,423.1 2,934.5 1,986.0 4,239.1 218,697.5
City College 169,518.5 78,425.4 13,666.7 2,747.3 1,941.2 4,153.9 270,452.9
Hunter College 179,542.0 76,734.2 8,628.1 6,141.9 1,203.2 4,584.5 276,833.9
John Jay College 117,289.3 50,698.5 6,204.1 7,978.5 1,997.7 3,824.3 187,992.4
Lehman College 107,164.0 46,999.7 5,641.3 876.8 1,852.4 3,717.8 166,252.1
Medgar Evers College 60,275.7 26,683.6 2,336.5 335.4 808.9 1,684.1 92,124.2
NYC College of Technology 102,570.5 42,357.9 8,276.5 3,819.0 1,449.0 3,300.0 161,772.9
Queens College 139,895.0 62,503.4 7,815.7 5,114.1 1,842.6 5,840.0 223,010.8
College of Staten Island 104,280.1 46,486.0 6,161.3 639.2 1,265.0 2,235.3 161,066.9
York College 59,376.5 26,571.7 3,202.4 - 1,195.0 1,766.4 92,112.0
Graduate Center 139,813.0 46,488.3 2,590.6 - 9,000.0 890.0 198,781.9
CUNY School of Law 23,560.7 9,860.5 34.7 4,630.5 11.2 85.0 38,182.6
Newmark School of Journalism 9,260.0 3,791.1 4.5 2,821.9 3.1 77.9 15,958.5
School of Professional Studies 18,028.5 5,992.2 207.9 3,249.9 3.6 495.5 27,977.6
School of Public Health 13,022.3 6,684.4 - 3,066.1 - 128.1 22,900.8
School of Labor 5,959.7 2,083.4 - 1,778.9 - - 9,822.0
Senior College Total 1,531,224.8 662,161.2 80,144.2 48,352.0 26,265.1 41,021.9 2,389,169.2
BMCC 184,082.6 58,186.6 5,347.6 - 367.6 5,309.0 253,293.3
Bronx CC 95,231.0 37,625.5 3,217.4 - 297.1 2,300.0 138,671.0
Guttman CC 25,945.2 7,801.0 338.2 - - 223.0 34,307.5
Hostos CC 68,784.0 26,148.2 2,484.1 - 104.6 1,387.4 98,908.2
Kingsborough CC 103,139.8 39,249.3 5,001.7 - 243.6 2,140.0 149,774.4
LaGuardia CC 133,461.3 47,479.4 3,775.2 - 236.8 2,588.0 187,540.7
Queensborough CC 111,975.0 44,970.8 3,530.6 - 216.6 2,600.0 163,292.9
Community College Total 722,618.9 261,460.6 23,694.9 - 1,466.2 16,547.4 1,025,788.0
Shared Services 92,794.1 26,983.5 329.3 16,954.2 - - 137,061.2
System Administration 26,578.4 9,873.2 135.5 6,203.5 - - 42,790.6
University Programs 18,867.5 2,424.1 11.0 1,523.1 - - 22,825.7
University Total 2,392,083.7 962,902.6 104,314.9 73,032.8 27,731.3 57,569.3 3,617,634.6
1. Fringes based on Projected Fringes for current fiscal year prorated based on PSR projections
2. SC Energy based on current year allocation plus water and sewer, CC Energy based on prior year actuals and excludes fuel oil
3. Building rentals from current year SC Rent Budget, CC building rentals are included in campus based allocation
4. Financial Aid includes centrally managed SEEK/CD
7

The City University of New York
2018-2019 Third-Quarter Financial Report
University Expenditures Comparison: FY2018 vs FY2019
FY2018 Total PS
FY2018 Total
OTPS FY2018 FY2019 Total PS
FY2019 Total
OTPS FY2019 PS I/(D) [$] PS I/(D) [%] OTPS I/(D) [$] OTPS I/(D) [%] Total I/(D) [$] Total I/(D) [%]
Baruch College 132,921.3 9,559.9 142,481.2 134,129.2 9,000.0 143,129.2 1,207.9 0.9% (559.9) -5.9% 648.0 0.5%
Brooklyn College 127,298.0 9,358.5 136,656.4 128,820.8 9,719.0 138,539.8 1,522.8 1.2% 360.5 3.9% 1,883.3 1.4%
City College 151,439.7 11,151.5 162,591.2 154,328.4 15,190.1 169,518.5 2,888.7 1.9% 4,038.6 36.2% 6,927.3 4.3%
Hunter College 166,482.7 8,839.6 175,322.3 168,542.0 11,000.0 179,542.0 2,059.3 1.2% 2,160.4 24.4% 4,219.7 2.4%
John Jay College 104,223.5 6,656.5 110,880.0 109,035.0 8,254.2 117,289.3 4,811.5 4.6% 1,597.7 24.0% 6,409.2 5.8%
Lehman College 95,952.0 6,314.0 102,266.0 99,463.0 7,701.0 107,164.0 3,511.0 3.7% 1,387.0 22.0% 4,898.0 4.8%
Medgar Evers College 58,732.7 3,575.1 62,307.8 56,700.7 3,575.0 60,275.7 (2,031.9) -3.5% (0.1) 0.0% (2,032.0) -3.3%
NYC College of Technology 97,161.7 3,681.3 100,843.0 98,695.0 3,875.5 102,570.5 1,533.3 1.6% 194.2 5.3% 1,727.5 1.7%
Queens College 128,721.6 8,487.9 137,209.5 131,211.0 8,684.0 139,895.0 2,489.4 1.9% 196.1 2.3% 2,685.5 2.0%
College of Staten Island 96,361.6 4,986.2 101,347.8 98,041.9 6,238.2 104,280.1 1,680.3 1.7% 1,252.0 25.1% 2,932.2 2.9%
York College 56,732.7 1,770.2 58,502.9 56,032.2 3,344.3 59,376.5 (700.5) -1.2% 1,574.1 88.9% 873.6 1.5%
Graduate Center 94,580.9 36,113.7 130,694.6 98,976.0 40,837.0 139,813.0 4,395.1 4.6% 4,723.3 13.1% 9,118.4 7.0%
CUNY School of Law 17,428.0 2,795.8 20,223.8 19,252.1 4,308.7 23,560.7 1,824.1 10.5% 1,512.9 54.1% 3,337.0 16.5%
Newmark School of Journalism 7,464.8 906.4 8,371.2 7,973.0 1,287.0 9,260.0 508.2 6.8% 380.6 42.0% 888.8 10.6%
School of Professional Studies 17,367.8 2,666.9 20,034.7 15,184.3 2,844.3 18,028.5 (2,183.5) -12.6% 177.3 6.6% (2,006.2) -10.0%
School of Public Health 11,061.1 880.1 11,941.2 12,064.7 957.6 13,022.3 1,003.6 9.1% 77.5 8.8% 1,081.1 9.1%
School of Labor 0.0 0.0 0.0 5,059.7 900.0 5,959.7 5,059.7 0.0% 900.0 0.0% 5,959.7 0.0%
Senior College Total 1,363,929.9 117,743.7 1,481,673.6 1,393,508.9 137,715.9 1,531,224.8 29,579.0 2.2% 19,972.2 17.0% 49,551.2 3.3%
BMCC 139,484.1 38,089.9 177,574.0 144,167.6 39,915.0 184,082.6 4,683.5 3.4% 1,825.1 4.8% 6,508.5 3.7%
Bronx CC 85,535.2 9,002.1 94,537.3 84,612.0 10,619.0 95,231.0 (923.2) -1.1% 1,616.9 18.0% 693.7 0.7%
Guttman CC 16,478.0 9,177.2 25,655.2 16,795.2 9,150.0 25,945.2 317.2 1.9% (27.2) -0.3% 290.0 1.1%
Hostos CC 56,425.7 11,583.0 68,008.7 57,824.0 10,960.0 68,784.0 1,398.3 2.5% (623.0) -5.4% 775.2 1.1%
Kingsborough CC 92,221.2 9,038.4 101,259.7 93,332.1 9,807.7 103,139.8 1,110.9 1.2% 769.3 8.5% 1,880.1 1.9%
LaGuardia CC 113,289.5 18,597.3 131,886.9 113,535.7 19,925.6 133,461.3 246.2 0.2% 1,328.3 7.1% 1,574.4 1.2%
Queensborough CC 99,612.0 10,453.5 110,065.5 100,890.0 11,085.0 111,975.0 1,278.0 1.3% 631.5 6.0% 1,909.5 1.7%
Community College Total 603,045.8 105,941.5 708,987.3 611,156.6 111,462.3 722,618.9 8,110.8 1.3% 5,520.8 5.2% 13,631.6 1.9%
Shared Services 55,595.2 27,716.4 83,311.5 57,487.0 35,307.1 92,794.1 1,891.9 3.4% 7,590.7 27.4% 9,482.6 11.4%
System Administration 23,318.8 3,056.8 26,375.5 20,046.3 6,532.0 26,578.4 (3,272.4) -14.0% 3,475.3 113.7% 202.9 0.8%
University Programs 1,853.8 34,767.2 36,621.0 4,949.3 13,918.2 18,867.5 3,095.5 167.0% (20,849.0) -60.0% (17,753.5) -48.5%
University Total 2,047,743.4 289,225.7 2,336,969.0 2,087,148.2 304,935.6 2,392,083.7 39,404.8 1.9% 15,709.9 5.4% 55,114.7 2.4%
¹ Includes CB for PSC and DC37; CC Collective Bargaining was funded and journaled out by City
8
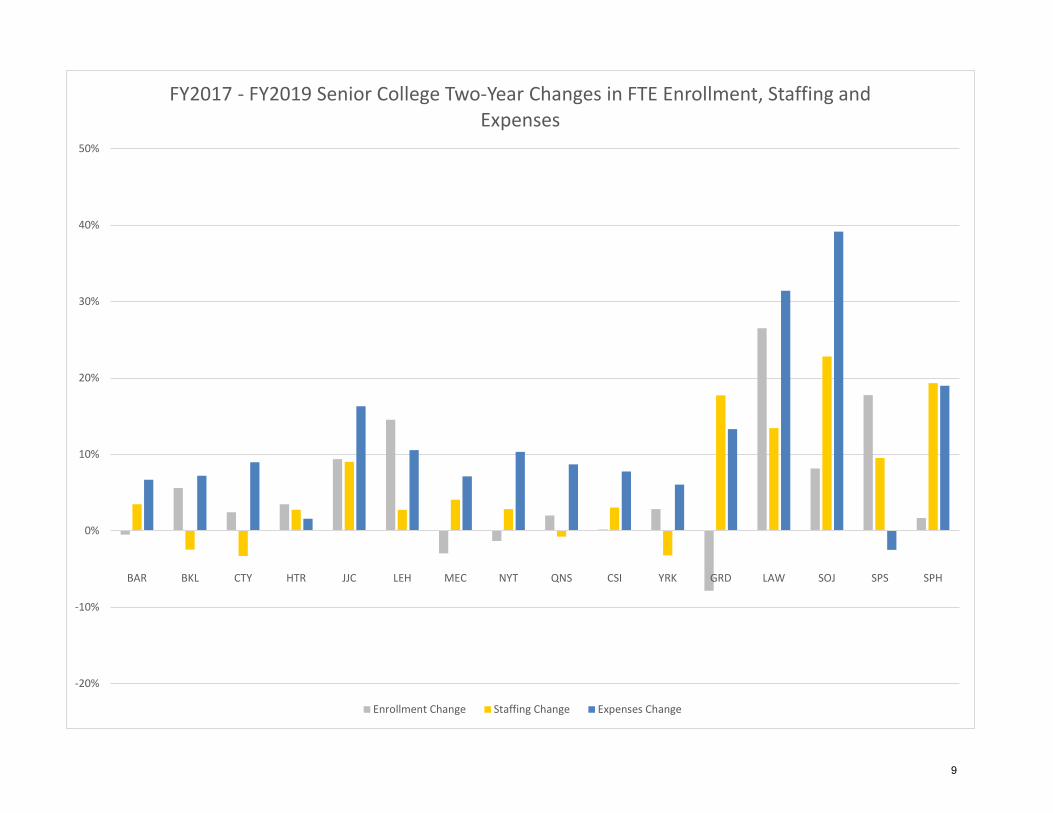
-20%
-10%
0%
10%
20%
30%
40%
50%
BAR BKL CTY HTR JJC LEH MEC NYT QNS CSI YRK GRD LAW SOJ SPS SPH
FY2017 - FY2019 Senior College Two-Year Changes in FTE Enrollment, Staffing and Expenses
Enrollment Change Staffing Change Expenses Change
9
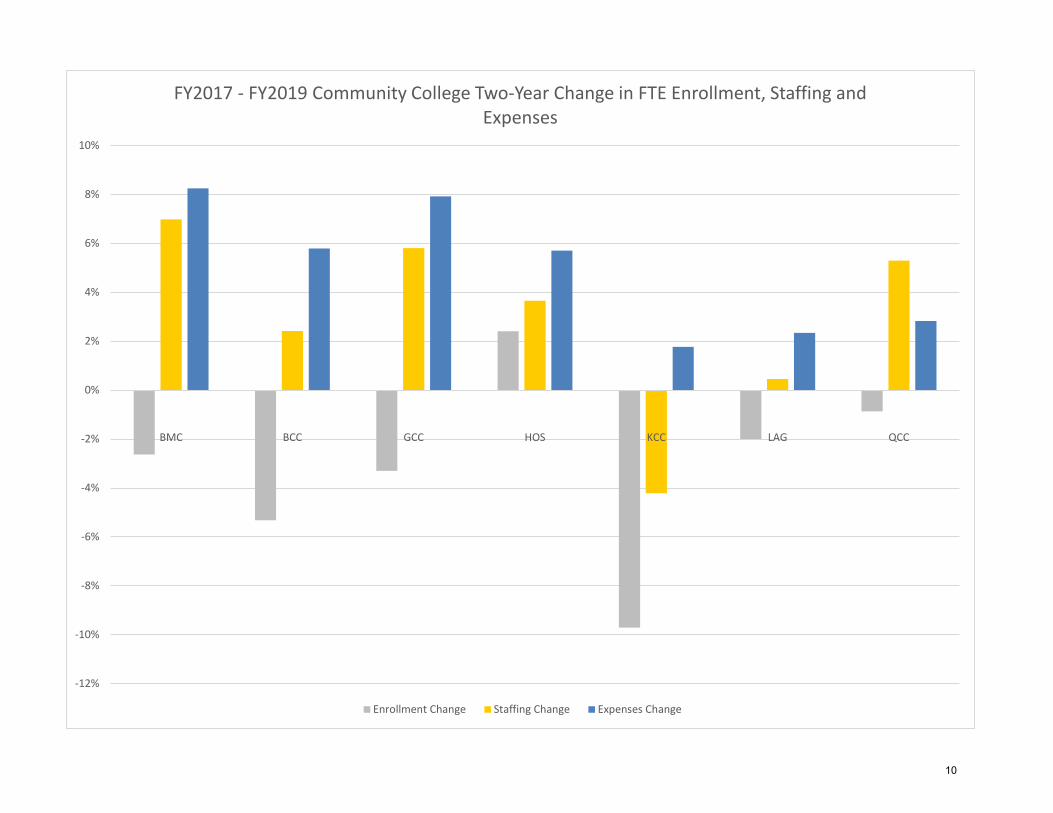
-12%
-10%
-8%
-6%
-4%
-2%
0%
2%
4%
6%
8%
10%
BMC BCC GCC HOS KCC LAG QCC
FY2017 - FY2019 Community College Two-Year Change in FTE Enrollment, Staffing and Expenses
Enrollment Change Staffing Change Expenses Change
10
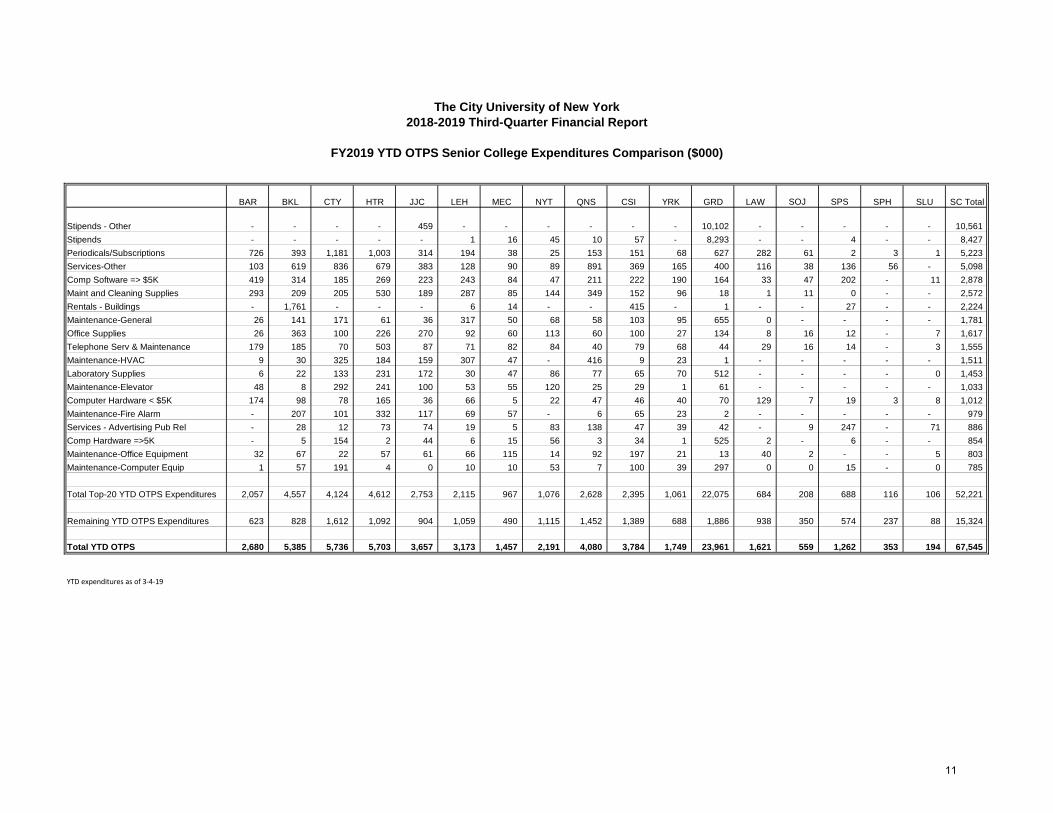
The City University of New York
2018-2019 Third-Quarter Financial Report
FY2019 YTD OTPS Senior College Expenditures Comparison ($000)
BAR BKL CTY HTR JJC LEH MEC NYT QNS CSI YRK GRD LAW SOJ SPS SPH SLU SC Total
Stipends - Other - - - - 459 - - - - - - 10,102 - - - - - 10,561
Stipends - - - - - 1 16 45 10 57 - 8,293 - - 4 - - 8,427
Periodicals/Subscriptions 726 393 1,181 1,003 314 194 38 25 153 151 68 627 282 61 2 3 1 5,223
Services-Other 103 619 836 679 383 128 90 89 891 369 165 400 116 38 136 56 - 5,098
Comp Software => $5K 419 314 185 269 223 243 84 47 211 222 190 164 33 47 202 - 11 2,878
Maint and Cleaning Supplies 293 209 205 530 189 287 85 144 349 152 96 18 1 11 0 - - 2,572
Rentals - Buildings - 1,761 - - - 6 14 - - 415 - 1 - - 27 - - 2,224
Maintenance-General 26 141 171 61 36 317 50 68 58 103 95 655 0 - - - - 1,781
Office Supplies 26 363 100 226 270 92 60 113 60 100 27 134 8 16 12 - 7 1,617
Telephone Serv & Maintenance 179 185 70 503 87 71 82 84 40 79 68 44 29 16 14 - 3 1,555
Maintenance-HVAC 9 30 325 184 159 307 47 - 416 9 23 1 - - - - - 1,511
Laboratory Supplies 6 22 133 231 172 30 47 86 77 65 70 512 - - - - 0 1,453
Maintenance-Elevator 48 8 292 241 100 53 55 120 25 29 1 61 - - - - - 1,033
Computer Hardware < $5K 174 98 78 165 36 66 5 22 47 46 40 70 129 7 19 3 8 1,012
Maintenance-Fire Alarm - 207 101 332 117 69 57 - 6 65 23 2 - - - - - 979
Services - Advertising Pub Rel - 28 12 73 74 19 5 83 138 47 39 42 - 9 247 - 71 886
Comp Hardware =>5K - 5 154 2 44 6 15 56 3 34 1 525 2 - 6 - - 854
Maintenance-Office Equipment 32 67 22 57 61 66 115 14 92 197 21 13 40 2 - - 5 803
Maintenance-Computer Equip 1 57 191 4 0 10 10 53 7 100 39 297 0 0 15 - 0 785
Total Top-20 YTD OTPS Expenditures 2,057 4,557 4,124 4,612 2,753 2,115 967 1,076 2,628 2,395 1,061 22,075 684 208 688 116 106 52,221
Remaining YTD OTPS Expenditures 623 828 1,612 1,092 904 1,059 490 1,115 1,452 1,389 688 1,886 938 350 574 237 88 15,324
Total YTD OTPS 2,680 5,385 5,736 5,703 3,657 3,173 1,457 2,191 4,080 3,784 1,749 23,961 1,621 559 1,262 353 194 67,545
YTD expenditures as of 3-4-19
11
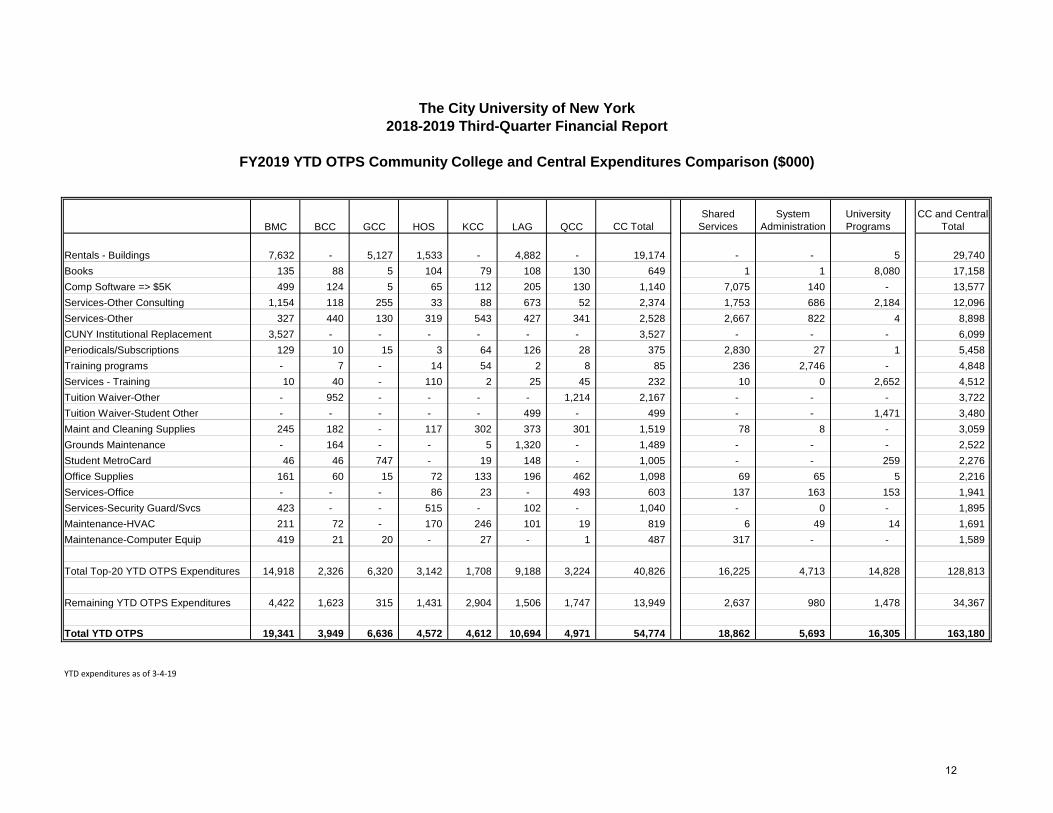
The City University of New York
2018-2019 Third-Quarter Financial Report
FY2019 YTD OTPS Community College and Central Expenditures Comparison ($000)
BMC BCC GCC HOS KCC LAG QCC CC Total
Shared
Services
System
Administration
University
Programs
CC and Central
Total
Rentals - Buildings 7,632 - 5,127 1,533 - 4,882 - 19,174 - - 5 29,740
Books 135 88 5 104 79 108 130 649 1 1 8,080 17,158
Comp Software => $5K 499 124 5 65 112 205 130 1,140 7,075 140 - 13,577
Services-Other Consulting 1,154 118 255 33 88 673 52 2,374 1,753 686 2,184 12,096
Services-Other 327 440 130 319 543 427 341 2,528 2,667 822 4 8,898
CUNY Institutional Replacement 3,527 - - - - - - 3,527 - - - 6,099
Periodicals/Subscriptions 129 10 15 3 64 126 28 375 2,830 27 1 5,458
Training programs - 7 - 14 54 2 8 85 236 2,746 - 4,848
Services - Training 10 40 - 110 2 25 45 232 10 0 2,652 4,512
Tuition Waiver-Other - 952 - - - - 1,214 2,167 - - - 3,722
Tuition Waiver-Student Other - - - - - 499 - 499 - - 1,471 3,480
Maint and Cleaning Supplies 245 182 - 117 302 373 301 1,519 78 8 - 3,059
Grounds Maintenance - 164 - - 5 1,320 - 1,489 - - - 2,522
Student MetroCard 46 46 747 - 19 148 - 1,005 - - 259 2,276
Office Supplies 161 60 15 72 133 196 462 1,098 69 65 5 2,216
Services-Office - - - 86 23 - 493 603 137 163 153 1,941
Services-Security Guard/Svcs 423 - - 515 - 102 - 1,040 - 0 - 1,895
Maintenance-HVAC 211 72 - 170 246 101 19 819 6 49 14 1,691
Maintenance-Computer Equip 419 21 20 - 27 - 1 487 317 - - 1,589
Total Top-20 YTD OTPS Expenditures 14,918 2,326 6,320 3,142 1,708 9,188 3,224 40,826 16,225 4,713 14,828 128,813
Remaining YTD OTPS Expenditures 4,422 1,623 315 1,431 2,904 1,506 1,747 13,949 2,637 980 1,478 34,367
Total YTD OTPS 19,341 3,949 6,636 4,572 4,612 10,694 4,971 54,774 18,862 5,693 16,305 163,180
YTD expenditures as of 3-4-19
12
REVENUE
13
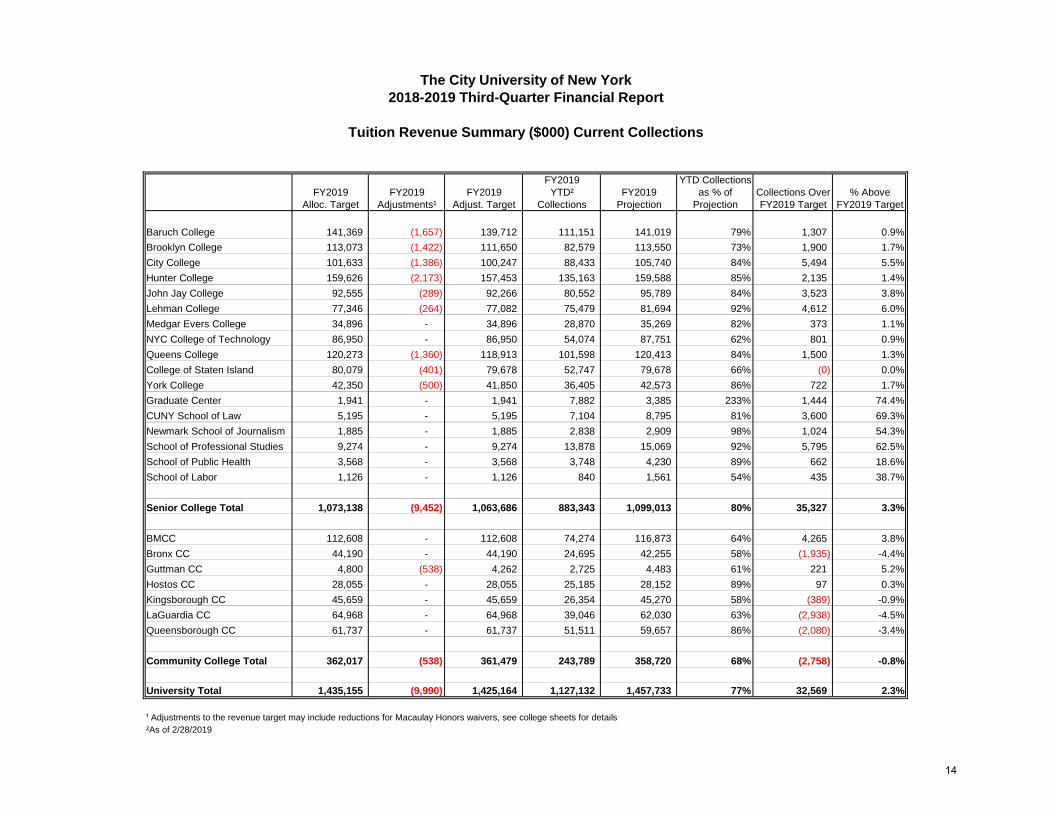
FY2019 YTD Collections
FY2019 FY2019 FY2019 YTD² FY2019 as % of Collections Over % Above
Alloc. Target Adjustments¹ Adjust. Target Collections Projection Projection FY2019 Target FY2019 Target
Baruch College 141,369 (1,657) 139,712 111,151 141,019 79% 1,307 0.9%
Brooklyn College 113,073 (1,422) 111,650 82,579 113,550 73% 1,900 1.7%
City College 101,633 (1,386) 100,247 88,433 105,740 84% 5,494 5.5%
Hunter College 159,626 (2,173) 157,453 135,163 159,588 85% 2,135 1.4%
John Jay College 92,555 (289) 92,266 80,552 95,789 84% 3,523 3.8%
Lehman College 77,346 (264) 77,082 75,479 81,694 92% 4,612 6.0%
Medgar Evers College 34,896 - 34,896 28,870 35,269 82% 373 1.1%
NYC College of Technology 86,950 - 86,950 54,074 87,751 62% 801 0.9%
Queens College 120,273 (1,360) 118,913 101,598 120,413 84% 1,500 1.3%
College of Staten Island 80,079 (401) 79,678 52,747 79,678 66% (0) 0.0%
York College 42,350 (500) 41,850 36,405 42,573 86% 722 1.7%
Graduate Center 1,941 - 1,941 7,882 3,385 233% 1,444 74.4%
CUNY School of Law 5,195 - 5,195 7,104 8,795 81% 3,600 69.3%
Newmark School of Journalism 1,885 - 1,885 2,838 2,909 98% 1,024 54.3%
School of Professional Studies 9,274 - 9,274 13,878 15,069 92% 5,795 62.5%
School of Public Health 3,568 - 3,568 3,748 4,230 89% 662 18.6%
School of Labor 1,126 - 1,126 840 1,561 54% 435 38.7%
Senior College Total 1,073,138 (9,452) 1,063,686 883,343 1,099,013 80% 35,327 3.3%
BMCC 112,608 - 112,608 74,274 116,873 64% 4,265 3.8%
Bronx CC 44,190 - 44,190 24,695 42,255 58% (1,935) -4.4%
Guttman CC 4,800 (538) 4,262 2,725 4,483 61% 221 5.2%
Hostos CC 28,055 - 28,055 25,185 28,152 89% 97 0.3%
Kingsborough CC 45,659 - 45,659 26,354 45,270 58% (389) -0.9%
LaGuardia CC 64,968 - 64,968 39,046 62,030 63% (2,938) -4.5%
Queensborough CC 61,737 - 61,737 51,511 59,657 86% (2,080) -3.4%
Community College Total 362,017 (538) 361,479 243,789 358,720 68% (2,758) -0.8%
University Total 1,435,155 (9,990) 1,425,164 1,127,132 1,457,733 77% 32,569 2.3%
¹ Adjustments to the revenue target may include reductions for Macaulay Honors waivers, see college sheets for details
²As of 2/28/2019
Tuition Revenue Summary ($000) Current Collections
2018-2019 Third-Quarter Financial Report
The City University of New York
14

FY2018 Actuals % Change
FY2018 FY2019 vs FY2019 FY2018-
Actuals Projection Projection FY2019
Baruch College 138,530 141,019 2,489 1.8%
Brooklyn College 109,363 113,550 4,187 3.8%
City College 98,483 105,740 7,257 7.4%
Hunter College 150,839 159,588 8,749 5.8%
John Jay College 90,521 95,789 5,268 5.8%
Lehman College 77,068 81,694 4,626 6.0%
Medgar Evers College 33,960 35,269 1,309 3.9%
NYC College of Technology 84,931 87,751 2,820 3.3%
Queens College 117,154 120,413 3,259 2.8%
College of Staten Island 74,744 79,678 4,934 6.6%
York College 40,843 42,573 1,730 4.2%
Graduate Center 2,885 3,385 500 17.3%
CUNY School of Law 6,581 8,795 2,214 33.6%
Newmark School of Journalism 2,410 2,909 499 20.7%
School of Professional Studies 14,506 15,069 563 3.9%
School of Public Health 3,797 4,230 433 11.4%
School of Labor - 1,561 1,561 0.0%
Senior College Total 1,046,615 1,099,013 52,398 5.0%
BMCC 117,590 116,873 (717) -0.6%
Bronx CC 43,684 42,255 (1,429) -3.3%
Guttman CC 4,428 4,483 55 1.2%
Hostos CC 27,841 28,152 311 1.1%
Kingsborough CC 48,177 45,270 (2,907) -6.0%
LaGuardia CC 64,825 62,030 (2,795) -4.3%
Queensborough CC 60,667 59,657 (1,010) -1.7%
Community College Total 367,212 358,720 (8,491) -2.3%
University Total 1,413,826 1,457,733 43,907 3.1%
¹ Adjustments to the revenue target may include reductions for Macaulay Honors waivers, see college sheets for de
The City University of New York
2018-2019 Third-Quarter Financial Report
Tuition Revenue Summary ($000) vs Prior Year
15

The City University of New York
2018-2019 Third-Quarter Financial Report
Technology Fee Summary ($000)
Initial Balance¹ Initial Balance¹ Initial Balance¹ (Over) / Under YTD YTD (Over) / Under
7/1/2016 7/1/2017 7/1/2018 Revenue² Expenditures² Expenditure Revenue³ Expenditures⁴ YTD Expenditure
Baruch College 2,098.8 1,930.6 543.1 4,000.0 4,000.0 0.0 3,690.1 1,781.6 1,908.5
Brooklyn College 1,215.0 895.5 1,454.7 3,400.0 4,239.1 (839.1) 2,960.5 1,543.8 1,416.7
City College 2,175.2 1,777.5 1,611.4 3,450.8 4,153.9 (703.1) 2,826.9 1,326.6 1,500.3
Hunter College 5,378.0 5,386.8 59.5 4,527.0 4,584.5 (57.5) 4,053.5 1,443.0 2,610.5
John Jay College 2,451.0 1,860.2 1,979.2 3,494.4 3,824.3 (329.9) 2,711.4 1,348.8 1,362.6
Lehman College 1,281.1 1,395.4 917.8 2,800.0 3,717.8 (917.8) 2,607.7 1,727.8 880.0
Medgar Evers College 59.6 280.3 348.0 1,417.3 1,684.1 (266.9) 1,086.4 627.7 458.8
NYC College of Technology 342.0 1,122.2 788.3 3,300.0 3,300.0 0.0 2,328.1 1,801.0 527.1
Queens College 1,145.5 1,966.7 2,467.9 4,181.0 5,840.0 (1,659.0) 3,634.6 2,418.0 1,216.7
College of Staten Island 550.6 38.0 259.4 2,235.3 2,235.3 0.0 2,164.0 1,114.2 1,049.8
York College 322.2 317.6 31.0 1,760.0 1,766.4 (6.4) 1,300.9 546.3 754.6
Graduate Center 48.7 108.5 138.9 765.0 890.0 (125.0) 609.5 173.0 436.5
CUNY School of Law 162.1 223.2 17.6 110.0 85.0 25.0 129.3 11.8 117.5
Newmark School of Journalism 28.5 57.4 83.4 44.0 77.9 (33.9) 43.8 13.1 30.7
School of Professional Studies 583.2 594.9 835.0 503.0 495.5 7.5 438.5 21.2 417.2
School of Public Health 0.0 77.4 99.8 90.0 128.1 (38.1) 89.7 44.4 45.3
School of Labor 0.0 0.0 0.0 - - 0.0 20.7 - 20.7
Senior College Total 17,841.5 18,032.2 11,635.3 36,077.7 41,021.9 (4,944.2) 30,695.6 15,942.2 14,753.4
BMCC 1,658.8 2,314.5 2,077.8 5,309.0 5,309.0 0.0 4,469.8 2,856.6 1,613.2
Bronx CC 723.1 750.0 605.3 2,300.0 2,300.0 0.0 1,938.0 458.2 1,479.7
Guttman CC 13.0 56.8 39.7 223.0 223.0 0.0 149.6 26.5 123.1
Hostos CC 144.4 0.0 40.6 1,387.4 1,387.4 0.0 1,063.9 532.6 531.3
Kingsborough CC 777.7 416.8 217.1 2,140.0 2,140.0 0.0 1,109.7 765.5 344.2
LaGuardia CC 158.8 (158.8) 32.0 2,588.0 2,588.0 0.0 1,660.3 1,432.6 227.8
Queensborough CC 834.0 274.0 101.0 2,600.0 2,600.0 0.0 2,042.5 1,602.0 440.5
Community College Total 4,309.8 3,653.2 3,113.6 16,547.4 16,547.4 0.0 12,433.9 7,674.1 4,759.8
University Total 22,151.3 21,685.5 14,748.8 52,625.1 57,569.3 (4,944.2) 43,129.5 23,616.3 19,513.3
1. Cash balance in SFS for SC; CF for CC
2. Source: college financial plans (revenue includes initial balance)
3. YTD Cash transfers
4. Source: SFS for SC, FMS for CC (fringes only include social security)
FY2019 Projections FY2019 Actuals
16
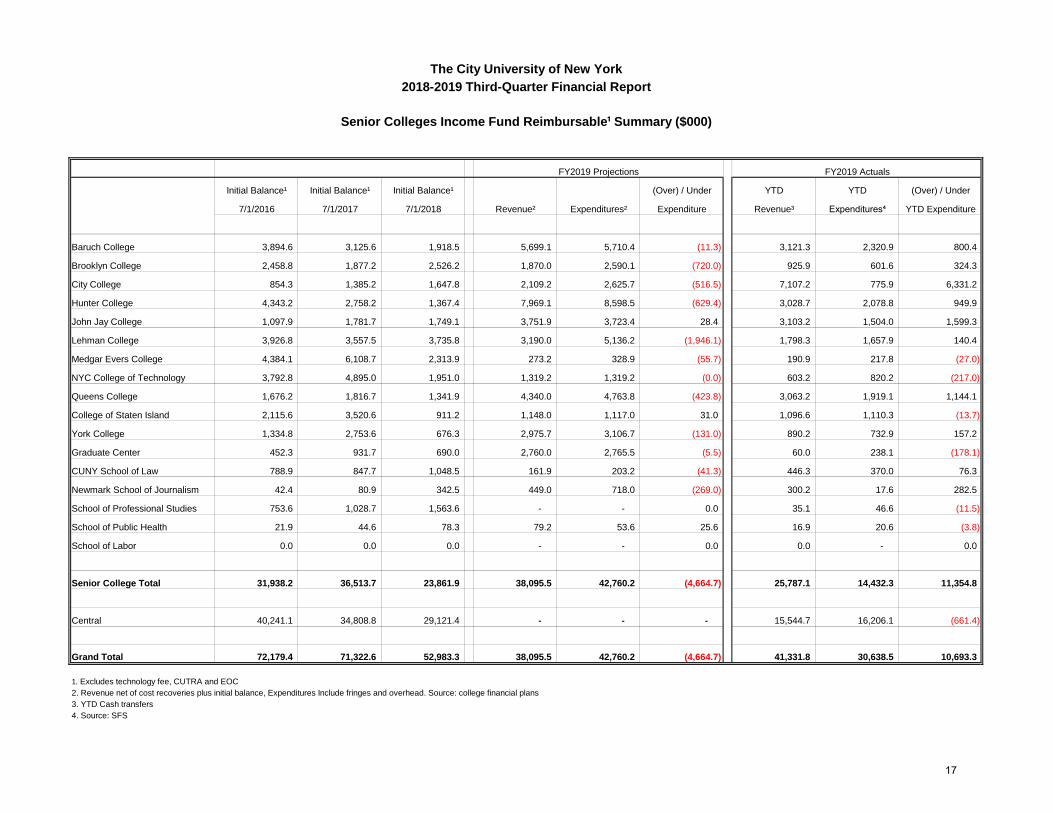
The City University of New York
2018-2019 Third-Quarter Financial Report
Senior Colleges Income Fund Reimbursable¹ Summary ($000)
Initial Balance¹ Initial Balance¹ Initial Balance¹ (Over) / Under YTD YTD (Over) / Under
7/1/2016 7/1/2017 7/1/2018 Revenue² Expenditures² Expenditure Revenue³ Expenditures⁴ YTD Expenditure
Baruch College 3,894.6 3,125.6 1,918.5 5,699.1 5,710.4 (11.3) 3,121.3 2,320.9 800.4
Brooklyn College 2,458.8 1,877.2 2,526.2 1,870.0 2,590.1 (720.0) 925.9 601.6 324.3
City College 854.3 1,385.2 1,647.8 2,109.2 2,625.7 (516.5) 7,107.2 775.9 6,331.2
Hunter College 4,343.2 2,758.2 1,367.4 7,969.1 8,598.5 (629.4) 3,028.7 2,078.8 949.9
John Jay College 1,097.9 1,781.7 1,749.1 3,751.9 3,723.4 28.4 3,103.2 1,504.0 1,599.3
Lehman College 3,926.8 3,557.5 3,735.8 3,190.0 5,136.2 (1,946.1) 1,798.3 1,657.9 140.4
Medgar Evers College 4,384.1 6,108.7 2,313.9 273.2 328.9 (55.7) 190.9 217.8 (27.0)
NYC College of Technology 3,792.8 4,895.0 1,951.0 1,319.2 1,319.2 (0.0) 603.2 820.2 (217.0)
Queens College 1,676.2 1,816.7 1,341.9 4,340.0 4,763.8 (423.8) 3,063.2 1,919.1 1,144.1
College of Staten Island 2,115.6 3,520.6 911.2 1,148.0 1,117.0 31.0 1,096.6 1,110.3 (13.7)
York College 1,334.8 2,753.6 676.3 2,975.7 3,106.7 (131.0) 890.2 732.9 157.2
Graduate Center 452.3 931.7 690.0 2,760.0 2,765.5 (5.5) 60.0 238.1 (178.1)
CUNY School of Law 788.9 847.7 1,048.5 161.9 203.2 (41.3) 446.3 370.0 76.3
Newmark School of Journalism 42.4 80.9 342.5 449.0 718.0 (269.0) 300.2 17.6 282.5
School of Professional Studies 753.6 1,028.7 1,563.6 - - 0.0 35.1 46.6 (11.5)
School of Public Health 21.9 44.6 78.3 79.2 53.6 25.6 16.9 20.6 (3.8)
School of Labor 0.0 0.0 0.0 - - 0.0 0.0 - 0.0
Senior College Total 31,938.2 36,513.7 23,861.9 38,095.5 42,760.2 (4,664.7) 25,787.1 14,432.3 11,354.8
Central 40,241.1 34,808.8 29,121.4 - - - 15,544.7 16,206.1 (661.4)
Grand Total 72,179.4 71,322.6 52,983.3 38,095.5 42,760.2 (4,664.7) 41,331.8 30,638.5 10,693.3
1. Excludes technology fee, CUTRA and EOC
2. Revenue net of cost recoveries plus initial balance, Expenditures Include fringes and overhead. Source: college financial plans
3. YTD Cash transfers
4. Source: SFS
FY2019 Projections FY2019 Actuals
17

The City University of New York
2018-2019 Third-Quarter Financial Report
Community Colleges Adult Continuing Education Summary ($000)
(Over) / Under YTD % of YTD % of YTD Revenue
Revenue¹ Expenditures¹ Expenditure Revenue Proj. Revenue Expenditures Proj. Expenditures Surplus / (Shortfall)
BMCC 970.5 826.0 144.5 344.0 35% 553.4 67% (209.3)
Bronx CC 401.9 342.0 59.9 224.9 56% 152.6 45% 72.3
Guttman CC - - 0.0 - 0% - 0% 0.0
Hostos CC 1,260.0 1,072.4 187.7 745.1 59% 655.3 61% 89.8
Kingsborough CC 2,702.8 2,300.3 402.5 1,797.2 66% 1,652.3 72% 144.8
LaGuardia CC 3,697.7 3,147.0 550.7 1,831.6 50% 1,991.1 63% (159.5)
Queensborough CC 1,277.6 1,082.7 194.9 773.7 61% 899.5 83% (125.8)
Community College Total 10,310.5 8,770.3 1,540.2 5,716.5 55% 5,904.1 67% (187.6)
¹ Source: college financial plans
FY2019 Projections FY2019 Actuals
18

YTD Total
Revenue PS Actuals OTPS Actuals Total Expenses PS Projection
OTPS Actuals
and
Encumbrances Total Expenses
Baruch College 4,184.5 2,067.4 42.6 2,109.9 3,078.4 48.1 3,126.5
Brooklyn College 2,072.3 - 1,856.2 1,856.2 - 1,856.2 1,856.2
City College 368.2 278.4 45.5 323.9 366.1 45.5 411.6
Hunter College 1,856.0 1,263.0 85.1 1,348.1 1,867.5 85.1 1,952.6
John Jay College 235.0 81.1 28.7 109.7 176.5 30.1 206.6
Lehman College 193.8 86.5 27.7 114.2 122.3 40.9 163.3
Queens College 218.6 36.9 99.0 135.9 52.4 110.2 162.6
College of Staten Island 24.8 2.4 19.5 22.0 6.9 19.5 26.4
York College 112.8 28.9 51.0 79.9 64.1 62.4 126.5
Graduate Center 207.3 43.4 1.8 45.2 68.3 1.8 70.1
Senior College Total 9,473.1 3,888.0 2,257.1 6,145.1 5,802.5 2,299.9 8,102.4
Source: budget and expenses from general ledger; revenue from student financials
Source: Budget, Expense, Encumbrances from CUNYfirst, funding source = 801066, fund = 10
Senior Colleges Actuals and Projections for Academic Excellence Fees Summary ($000)
2018-2019 Third-Quarter Financial Report
The City University of New York
19

ENROLLMENT
20

The City University of New York
2018-2019 Third-Quarter Financial Report
Fall 2016 - Fall 2018 FTE Enrollment
Undergraduate FTE Graduate FTE Total FTE
Fall 2016 Fall 2017 Fall 2018 1 Yr # Change 1 Yr % Change Fall 2016 Fall 2017 Fall 2018 1 Yr # Change 1 Yr % Change Fall 2016 Fall 2017 Fall 2018 1 Yr # Change 1 Yr % Change
Baruch College 12,292 12,354 12,312 (42) -0.3% 2,095 2,066 2,002 (64) -3.1% 14,387 14,420 14,314 (106) -0.7%
Brooklyn College 11,443 11,844 12,204 360 3.0% 1,933 1,930 1,921 (9) -0.5% 13,376 13,774 14,125 351 2.5%
City College 10,584 10,607 10,654 47 0.4% 1,696 1,802 1,924 122 6.8% 12,280 12,409 12,578 169 1.4%
Hunter College 13,371 13,603 14,106 503 3.7% 4,135 4,097 4,007 (90) -2.2% 17,506 17,700 18,113 413 2.3%
John Jay College 10,180 10,528 11,044 516 4.9% 1,062 1,161 1,252 91 7.8% 11,242 11,689 12,296 607 5.2%
Lehman College 7,908 8,505 9,156 651 7.7% 1,171 1,249 1,244 (5) -0.4% 9,079 9,754 10,400 646 6.6%
Medgar Evers College 5,357 5,288 5,198 (90) -1.7% - - - - 0.0% 5,357 5,288 5,198 (90) -1.7%
NYC College of Technology 12,919 13,019 12,748 (271) -2.1% - - - - 0.0% 12,919 13,019 12,748 (271) -2.1%
Queens College 13,211 13,451 13,615 164 1.2% 1,910 1,858 1,809 (49) -2.6% 15,121 15,309 15,424 115 0.8%
College of Staten Island 10,463 10,443 10,445 2 0.0% 646 684 682 (2) -0.3% 11,109 11,127 11,127 0 0.0%
York College 5,806 5,823 5,882 59 1.0% 120 163 212 49 30.1% 5,926 5,986 6,094 108 1.8%
Graduate Center - - - - 0.0% 2,981 2,902 2,747 (155) -5.3% 2,981 2,902 2,747 (155) -5.3%
CUNY School of Law - - - - 0.0% 498 530 630 100 18.9% 498 530 630 100 18.9%
Newmark School of Journalism - - - - 0.0% 258 251 279 28 11.2% 258 251 279 28 11.2%
School of Professional Studies 843 976 971 (5) -0.5% 379 446 468 22 4.9% 1,222 1,422 1,439 17 1.2%
School of Public Health - - - - 0.0% 358 344 364 20 5.8% 358 344 364 20 5.8%
School of Labor - - 60 60 0.0% - - 90 90 0.0% 0 0 150 150 0.0%
Senior College Total 114,377 116,441 118,395 1,954 1.7% 19,242 19,483 19,631 148 0.8% 133,619 135,924 138,026 2,102 1.5%
BMCC 20,421 20,299 19,884 (415) -2.0% - - - - 0.0% 20,421 20,299 19,884 (415) -2.0%
Bronx CC 7,936 7,939 7,514 (425) -5.4% - - - - 0.0% 7,936 7,939 7,514 (425) -5.4%
Guttman CC 1,060 1,179 1,025 (154) -13.1% - - - - 0.0% 1,060 1,179 1,025 (154) -13.1%
Hostos CC 4,995 5,013 5,115 102 2.0% - - - - 0.0% 4,995 5,013 5,115 102 2.0%
Kingsborough CC 11,345 10,706 10,243 (463) -4.3% - - - - 0.0% 11,345 10,706 10,243 (463) -4.3%
LaGuardia CC 14,197 14,161 13,913 (248) -1.8% - - - - 0.0% 14,197 14,161 13,913 (248) -1.8%
Queensborough CC 10,768 10,631 10,674 43 0.4% - - - - 0.0% 10,768 10,631 10,674 43 0.4%
Community College Total 70,722 69,928 68,368 (1,560) -2.2% - - - - 0.0% 70,722 69,928 68,368 (1,560) -2.2%
University Total 185,099 186,369 186,763 394 0.2% 19,242 19,483 19,631 148 0.8% 204,341 205,852 206,394 542 0.3%
Source:
FTE from CUNY Office of Institutional Research & Analysis
21
FULL TIME
STAFFING
22

Fall 2016 Fall 2017 Spring 2019 1 Yr # Change 1 Yr % Change Fall 2016 Fall 2017
Spring
2019
Baruch College 1,185 1,204 1,226 22 1.8% 82.3 83.5 85.6
Brooklyn College 1,242 1,233 1,215 (18) -1.4% 92.8 89.5 86.0
City College 1,482 1,470 1,433 (37) -2.5% 120.7 118.5 113.9
Hunter College 1,523 1,550 1,565 15 1.0% 87.0 87.6 86.4
John Jay College 937 985 1,021 36 3.6% 83.3 84.3 83.0
Lehman College 932 939 957 18 1.9% 102.6 96.3 92.0
Medgar Evers College 568 590 591 1 0.2% 106.0 111.6 113.7
NYC College of Technology 877 893 902 9 1.0% 67.9 68.6 70.8
Queens College 1,234 1,199 1,224 25 2.1% 81.6 78.3 79.4
College of Staten Island 913 924 937 13 1.4% 82.2 83.1 84.2
York College 590 598 571 (27) -4.5% 99.6 99.9 93.7
Graduate Center 665 719 783 64 8.8% 223.1 247.9 285.0
CUNY School of Law 134 143 152 9 6.3% 269.1 269.8 241.3
Newmark School of Journalism 57 65 70 5 7.7% 220.9 259.0 250.9
School of Professional Studies 105 132 115 (17) -12.9% 85.9 92.8 79.9
School of Public Health 88 94 105 11 11.7% 245.8 273.3 288.5
School of Labor 0 0 44 44 0.0% - - 293.3
Senior College Total 12,530 12,740 12,911 171 1.3% 93.8 93.7 93.5
BMCC 1,272 1,328 1,364 36 2.7% 62.3 65.4 68.6
Bronx CC 869 917 890 (27) -2.9% 109.5 115.5 118.4
Guttman CC 155 163 164 1 0.6% 146.2 138.3 160.0
Hostos CC 601 621 625 4 0.6% 120.3 123.9 122.2
Kingsborough CC 948 911 908 (3) -0.3% 83.6 85.1 88.6
LaGuardia CC 1,100 1,125 1,105 (20) -1.8% 77.5 79.4 79.4
Queensborough CC 982 1,020 1,034 14 1.4% 91.2 95.9 96.9
Community College Total 5,927 6,085 6,090 5 0.1% 83.8 87.0 89.1
Shared Services 741 692 723 31 4.5% - - -
System Administration 171 208 170 (38) -18.3% - - -
University Programs 78 9 78 69 766.7% - - -
University Total 19,447 19,734 19,972 238 1.2% 95.2 95.9 96.8
Notes:
Graduate Assistants are excluded from the Senior and Community College Totals
Source: FY2017-18 Average Salary Report, FISM115 V&Z; FY2019 from CUNYFirst EPM
Senior College Staffing Spring 2019 from CUNYFirst as of 2/28/19, Fall 2017 from FIS, last payroll in November, Fall 2016 from FIS last payroll in October;
Community College Staffing Spring 2019 from CUNYFirst as of 2/28/19, Fall 2017 from FIS, last payroll in November, Fall 2016 from FIS last payroll in October;
Total Full Time Staffing: Fall 2016, Fall 2017, Spring 2019
2018-2019 Third-Quarter Financial Report
The City University of New York
Staff per 1000 FTEFull Time Staff
23

Fall 2016 Fall 2017 Spring 2019
Fall 2016 to
Fall 2017 % Change
Fall 2017 to
Spring 2019 % Change Fall 2016 Fall 2017 Spring 2019
Baruch College 469 467 479 (1) -0.3% 12 2.5% 32.6 32.4 33.4
Brooklyn College 502 497 493 (5) -0.9% (4) -0.8% 37.5 36.1 34.9
City College 563 561 547 (1) -0.2% (14) -2.6% 45.8 45.2 43.5
Hunter College 616 606 603 (10) -1.7% (3) -0.5% 35.2 34.2 33.3
John Jay College 361 376 381 16 4.4% 5 1.2% 32.1 32.2 31.0
Lehman College 349 348 360 (0) -0.1% 12 3.5% 38.4 35.7 34.6
Medgar Evers College 166 171 156 5 3.0% (15) -8.8% 31.0 32.3 30.0
NYC College of Technology 399 405 387 6 1.5% (18) -4.4% 30.9 31.1 30.4
Queens College 562 547 559 (14) -2.6% 12 2.2% 37.1 35.7 36.3
College of Staten Island 355 366 367 11 3.2% 1 0.1% 32.0 32.9 33.0
York College 187 199 191 12 6.4% (8) -4.0% 31.6 33.2 31.3
Graduate Center 312 311 300 (1) -0.2% (11) -3.7% 104.7 107.3 109.2
CUNY School of Law 43 48 53 5 11.6% 5 10.4% 86.3 90.6 84.1
Newmark School of Journalism 17 20 16 3 17.6% (4) -20.0% 65.9 79.7 57.3
School of Professional Studies 11 15 17 4 36.4% 2 13.3% 9.0 10.5 11.8
School of Public Health 49 48 43 (1) 0.0% (5) 0.0% 136.9 139.5 118.1
School of Labor - - 6 - 0.0% 6 0.0% - - 40.0
Senior College Total 4,959 4,987 4,958 28 0.6% (29) -0.6% 37.1 36.7 35.9
BMCC 545 556 589 11 2.0% 33 5.9% 26.7 27.4 29.6
Bronx CC 300 321 325 21 7.0% 4 1.2% 37.8 40.4 43.3
Guttman CC 46 54 54 8 17.4% - 0.0% 43.4 45.8 52.7
Hostos CC 177 198 199 21 11.9% 1 0.5% 35.4 39.5 38.9
Kingsborough CC 346 342 335 (4) -1.2% (7) -2.0% 30.5 31.9 32.7
LaGuardia CC 369 372 359 3 0.8% (13) -3.5% 26.0 26.3 25.8
Queensborough CC 385 410 425 25 6.5% 15 3.7% 35.8 38.6 39.8
Community College Total 2,168 2,253 2,286 85 3.9% 33 1.5% 30.7 32.2 33.4
Shared Services - - - - 0.0% - 0.0% - - -
System Administration - - - - 0.0% - 0.0% - - -
University Programs - - - - 0.0% - 0.0% - - -
University Total 7,127 7,240 7,244 113 1.6% 4 0.1% 34.9 35.2 35.1
Source: FY2017-18 Average Salary Report, FISM115 V&Z; FY2019 from CUNYFirst EPM
Senior College Staffing Spring 2019 from CUNYFirst as of 2/28/19, Fall 2017 from FIS, last payroll in November, Fall 2016 from FIS last payroll in October;
Community College Staffing Spring 2019 from CUNYFirst as of 2/28/19, Fall 2017 from FIS, last payroll in November, Fall 2016 from FIS last payroll in October;
I&DR Teaching I&DR Staff per 1000 FTE
Instructional and Departmental Research Staff: Fall 2016, Fall 2017, Spring 2019
2018-2019 Third-Quarter Financial Report
The City University of New York
24

Fall 2016 Fall 2017 Spring 2019
Fall 2016 to
Fall 2017 % Change
Fall 2017 to
Spring 2019 % Change Fall 2016 Fall 2017
Spring
2019
Baruch College 137 133 155 (4) -2.9% 22 16.5% 9.5 9.2 10.8
Brooklyn College 171 171 169 - 0.0% (2) -1.2% 12.8 12.4 12.0
City College 258 260 250 2 0.8% (10) -3.8% 21.0 21.0 19.9
Hunter College 201 200 199 (1) -0.5% (1) -0.5% 11.5 11.3 11.0
John Jay College 141 153 144 12 8.5% (9) -5.9% 12.5 13.1 11.7
Lehman College 151 151 168 - 0.0% 17 11.3% 16.6 15.5 16.2
Medgar Evers College 88 90 80 2 2.3% (10) -11.1% 16.4 17.0 15.4
NYC College of Technology 103 104 120 1 1.0% 16 15.4% 8.0 8.0 9.4
Queens College 143 141 143 (2) -1.4% 2 1.4% 9.5 9.2 9.3
College of Staten Island 165 158 175 (7) -4.2% 17 10.8% 14.9 14.2 15.7
York College 76 74 67 (2) -2.6% (7) -9.5% 12.8 12.4 11.0
Graduate Center 69 65 138 (4) -5.8% 73 112.3% 23.1 22.4 50.2
CUNY School of Law 16 17 3 1 6.3% (14) -82.4% 32.1 32.1 4.8
Newmark School of Journalism - - 2 - 0.0% 2 0.0% - - 7.2
School of Professional Studies 16 17 22 1 6.3% 5 29.4% 13.1 12.0 15.3
School of Public Health 2 2 4 - 0.0% 2 0.0% 5.6 5.8 11.0
School of Labor - - 4 - 0.0% 4 0.0% - - 26.7
Senior College Total 1,737 1,736 1,843 (1) -0.1% 107 6.2% 13.0 12.8 13.4
BMCC 131 155 180 24 18.3% 25 16.1% 6.4 7.6 9.1
Bronx CC 129 141 127 12 9.3% (14) -9.9% 16.3 17.8 16.9
Guttman CC 1 1 5 - 0.0% 4 400.0% 0.9 0.8 4.9
Hostos CC 88 90 90 2 2.3% - 0.0% 17.6 18.0 17.6
Kingsborough CC 120 121 143 1 0.8% 22 18.2% 10.6 11.3 14.0
LaGuardia CC 131 142 115 11 8.4% (27) -19.0% 9.2 10.0 8.3
Queensborough CC 156 169 185 13 8.3% 16 9.5% 14.5 15.9 17.3
Community College Total 756 819 845 63 8.3% 26 3.2% 10.7 11.7 12.4
Shared Services - - - - 0.0% - 0.0% - - -
System Administration - - - - 0.0% - 0.0% - - -
University Programs - - - - 0.0% - 0.0% - - -
University Total 2,493 2,555 2,688 62 2.5% 133 5.2% 12.2 12.4 13.0
Source: FY2017-18 Average Salary Report, FISM115 V&Z; FY2019 from CUNYFirst EPM
Senior College Staffing Spring 2019 from CUNYFirst as of 2/28/19, Fall 2017 from FIS, last payroll in November, Fall 2016 from FIS last payroll in October;
Community College Staffing Spring 2019 from CUNYFirst as of 2/28/19, Fall 2017 from FIS, last payroll in November, Fall 2016 from FIS last payroll in October;
I&DR Support I&DR Sup. Staff per 1000 FTE
Instructional and Departmental Research Support Staff: Fall 2016, Fall 2017, Spring 2019
2018-2019 Third-Quarter Financial Report
The City University of New York
25
Fall 2016 Fall 2017 Spring 2019
Fall 2016 to
Fall 2017 % Change
Fall 2017 to
Spring 2019 % Change Fall 2016 Fall 2017
Spring
2019
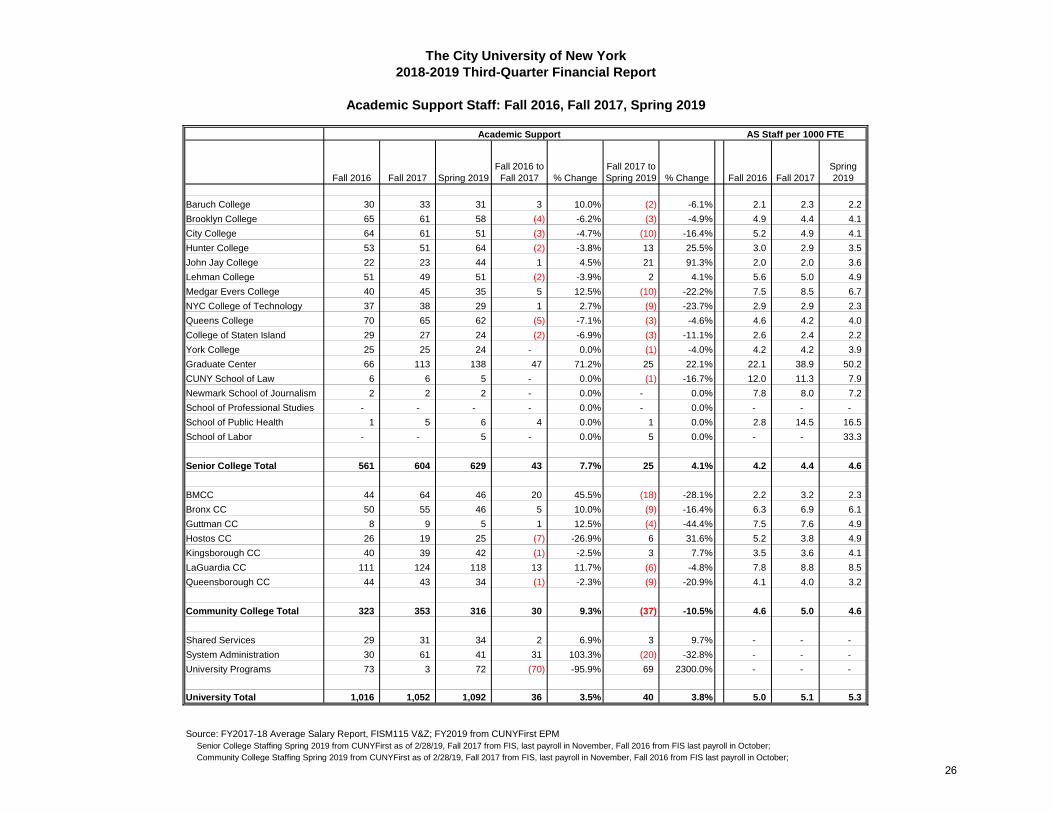
Baruch College 30 33 31 3 10.0% (2) -6.1% 2.1 2.3 2.2
Brooklyn College 65 61 58 (4) -6.2% (3) -4.9% 4.9 4.4 4.1
City College 64 61 51 (3) -4.7% (10) -16.4% 5.2 4.9 4.1
Hunter College 53 51 64 (2) -3.8% 13 25.5% 3.0 2.9 3.5
John Jay College 22 23 44 1 4.5% 21 91.3% 2.0 2.0 3.6
Lehman College 51 49 51 (2) -3.9% 2 4.1% 5.6 5.0 4.9
Medgar Evers College 40 45 35 5 12.5% (10) -22.2% 7.5 8.5 6.7
NYC College of Technology 37 38 29 1 2.7% (9) -23.7% 2.9 2.9 2.3
Queens College 70 65 62 (5) -7.1% (3) -4.6% 4.6 4.2 4.0
College of Staten Island 29 27 24 (2) -6.9% (3) -11.1% 2.6 2.4 2.2
York College 25 25 24 - 0.0% (1) -4.0% 4.2 4.2 3.9
Graduate Center 66 113 138 47 71.2% 25 22.1% 22.1 38.9 50.2
CUNY School of Law 6 6 5 - 0.0% (1) -16.7% 12.0 11.3 7.9
Newmark School of Journalism 2 2 2 - 0.0% - 0.0% 7.8 8.0 7.2
School of Professional Studies - - - - 0.0% - 0.0% - - -
School of Public Health 1 5 6 4 0.0% 1 0.0% 2.8 14.5 16.5
School of Labor - - 5 - 0.0% 5 0.0% - - 33.3
Senior College Total 561 604 629 43 7.7% 25 4.1% 4.2 4.4 4.6
BMCC 44 64 46 20 45.5% (18) -28.1% 2.2 3.2 2.3
Bronx CC 50 55 46 5 10.0% (9) -16.4% 6.3 6.9 6.1
Guttman CC 8 9 5 1 12.5% (4) -44.4% 7.5 7.6 4.9
Hostos CC 26 19 25 (7) -26.9% 6 31.6% 5.2 3.8 4.9
Kingsborough CC 40 39 42 (1) -2.5% 3 7.7% 3.5 3.6 4.1
LaGuardia CC 111 124 118 13 11.7% (6) -4.8% 7.8 8.8 8.5
Queensborough CC 44 43 34 (1) -2.3% (9) -20.9% 4.1 4.0 3.2
Community College Total 323 353 316 30 9.3% (37) -10.5% 4.6 5.0 4.6
Shared Services 29 31 34 2 6.9% 3 9.7% - - -
System Administration 30 61 41 31 103.3% (20) -32.8% - - -
University Programs 73 3 72 (70) -95.9% 69 2300.0% - - -
University Total 1,016 1,052 1,092 36 3.5% 40 3.8% 5.0 5.1 5.3
Source: FY2017-18 Average Salary Report, FISM115 V&Z; FY2019 from CUNYFirst EPM
Senior College Staffing Spring 2019 from CUNYFirst as of 2/28/19, Fall 2017 from FIS, last payroll in November, Fall 2016 from FIS last payroll in October;
Community College Staffing Spring 2019 from CUNYFirst as of 2/28/19, Fall 2017 from FIS, last payroll in November, Fall 2016 from FIS last payroll in October;
The City University of New York
AS Staff per 1000 FTE
Academic Support Staff: Fall 2016, Fall 2017, Spring 2019
Academic Support
2018-2019 Third-Quarter Financial Report
26
Fall 2016 Fall 2017 Spring 2019
Fall 2016 to
Fall 2017 % Change
Fall 2017 to
Spring 2019 % Change Fall 2016 Fall 2017
Spring
2019
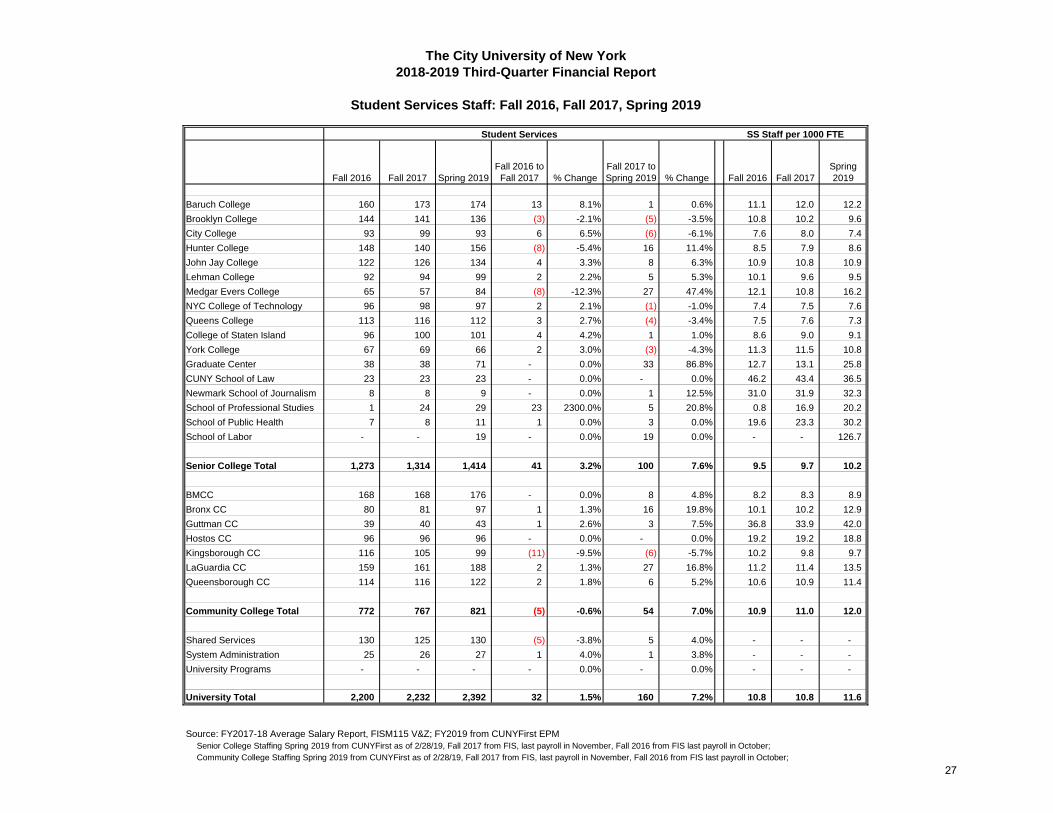
Baruch College 160 173 174 13 8.1% 1 0.6% 11.1 12.0 12.2
Brooklyn College 144 141 136 (3) -2.1% (5) -3.5% 10.8 10.2 9.6
City College 93 99 93 6 6.5% (6) -6.1% 7.6 8.0 7.4
Hunter College 148 140 156 (8) -5.4% 16 11.4% 8.5 7.9 8.6
John Jay College 122 126 134 4 3.3% 8 6.3% 10.9 10.8 10.9
Lehman College 92 94 99 2 2.2% 5 5.3% 10.1 9.6 9.5
Medgar Evers College 65 57 84 (8) -12.3% 27 47.4% 12.1 10.8 16.2
NYC College of Technology 96 98 97 2 2.1% (1) -1.0% 7.4 7.5 7.6
Queens College 113 116 112 3 2.7% (4) -3.4% 7.5 7.6 7.3
College of Staten Island 96 100 101 4 4.2% 1 1.0% 8.6 9.0 9.1
York College 67 69 66 2 3.0% (3) -4.3% 11.3 11.5 10.8
Graduate Center 38 38 71 - 0.0% 33 86.8% 12.7 13.1 25.8
CUNY School of Law 23 23 23 - 0.0% - 0.0% 46.2 43.4 36.5
Newmark School of Journalism 8 8 9 - 0.0% 1 12.5% 31.0 31.9 32.3
School of Professional Studies 1 24 29 23 2300.0% 5 20.8% 0.8 16.9 20.2
School of Public Health 7 8 11 1 0.0% 3 0.0% 19.6 23.3 30.2
School of Labor - - 19 - 0.0% 19 0.0% - - 126.7
Senior College Total 1,273 1,314 1,414 41 3.2% 100 7.6% 9.5 9.7 10.2
BMCC 168 168 176 - 0.0% 8 4.8% 8.2 8.3 8.9
Bronx CC 80 81 97 1 1.3% 16 19.8% 10.1 10.2 12.9
Guttman CC 39 40 43 1 2.6% 3 7.5% 36.8 33.9 42.0
Hostos CC 96 96 96 - 0.0% - 0.0% 19.2 19.2 18.8
Kingsborough CC 116 105 99 (11) -9.5% (6) -5.7% 10.2 9.8 9.7
LaGuardia CC 159 161 188 2 1.3% 27 16.8% 11.2 11.4 13.5
Queensborough CC 114 116 122 2 1.8% 6 5.2% 10.6 10.9 11.4
Community College Total 772 767 821 (5) -0.6% 54 7.0% 10.9 11.0 12.0
Shared Services 130 125 130 (5) -3.8% 5 4.0% - - -
System Administration 25 26 27 1 4.0% 1 3.8% - - -
University Programs - - - - 0.0% - 0.0% - - -
University Total 2,200 2,232 2,392 32 1.5% 160 7.2% 10.8 10.8 11.6
Source: FY2017-18 Average Salary Report, FISM115 V&Z; FY2019 from CUNYFirst EPM
Senior College Staffing Spring 2019 from CUNYFirst as of 2/28/19, Fall 2017 from FIS, last payroll in November, Fall 2016 from FIS last payroll in October;
Community College Staffing Spring 2019 from CUNYFirst as of 2/28/19, Fall 2017 from FIS, last payroll in November, Fall 2016 from FIS last payroll in October;
SS Staff per 1000 FTE
Student Services Staff: Fall 2016, Fall 2017, Spring 2019
2018-2019 Third-Quarter Financial Report
The City University of New York
Student Services
27

Fall 2016 Fall 2017 Spring 2019
Fall 2016 to
Fall 2017 % Change
Fall 2017 to
Spring 2019 % Change Fall 2016 Fall 2017 Spring 2019
Total Owned
GSF (000s)
M&O Staff
per GSF
Baruch College 141 132 130 (9) -6.4% (2) -1.5% 9.8 9.2 9.1 1,537 11,825
Brooklyn College 120 120 127 - 0.0% 7 5.8% 9.0 8.7 9.0 2,408 18,963
City College 177 175 171 (2) -1.1% (4) -2.3% 14.4 14.1 13.6 3,146 18,395
Hunter College 181 184 186 3 1.7% 2 1.1% 10.3 10.4 10.3 2,709 14,564
John Jay College 85 90 89 5 5.9% (1) -1.1% 7.6 7.7 7.2 1,345 15,110
Lehman College 116 119 115 3 2.6% (4) -3.4% 12.8 12.2 11.1 1,571 13,658
Medgar Evers College 73 76 73 3 4.1% (3) -3.9% 13.6 14.4 14.0 561 7,682
NYC College of Technology 70 71 96 1 1.4% 25 35.2% 5.4 5.5 7.5 920 9,580
Queens College 148 141 139 (7) -4.7% (2) -1.4% 9.8 9.2 9.0 2,483 17,866
College of Staten Island 109 105 107 (4) -3.7% 2 1.9% 9.8 9.4 9.6 1,368 12,784
York College 74 71 67 (3) -4.1% (4) -5.6% 12.5 11.9 11.0 932 13,904
Graduate Center 4 4 5 - 0.0% 1 25.0% 1.3 1.4 1.8 847 169,356
CUNY School of Law 2 2 3 - 0.0% 1 50.0% 4.0 3.8 4.8 215 71,533
Newmark School of Journalism - - - - 0.0% - 0.0% - - - - -
School of Professional Studies 3 3 3 - 0.0% - 0.0% 2.5 2.1 2.1 - -
School of Public Health - 2 3 2 0.0% 1 0.0% - 5.8 8.2 - -
School of Labor - - - - 0.0% - 0.0% - - - - -
Senior College Total 1,303 1,295 1,314 (8) -0.6% 19 1.5% 9.8 9.5 9.5 20,040 15,251
BMCC 147 138 131 (9) -6.1% (7) -5.1% 7.2 6.8 6.6 1,123 8,575
Bronx CC 113 113 92 - 0.0% (21) -18.6% 14.2 14.2 12.2 1,288 13,995
Guttman CC 2 3 3 1 50.0% - 0.0% 1.9 2.5 2.9 - -
Hostos CC 71 70 66 (1) -1.4% (4) -5.7% 14.2 14.0 12.9 696 10,546
Kingsborough CC 131 115 110 (16) -12.2% (5) -4.3% 11.5 10.7 10.7 1,307 11,881
LaGuardia CC 50 60 57 10 20.0% (3) -5.0% 3.5 4.2 4.1 1,545 27,110
Queensborough CC 99 105 96 6 6.1% (9) -8.6% 9.2 9.9 9.0 927 9,660
Community College Total 613 604 555 (9) -1.5% (49) -8.1% 8.7 8.6 8.1 6,886 12,408
Shared Services - - - - 0.0% - 0.0% - - - - -
System Administration 19 16 17 (3) -15.8% 1 6.3% - - - - -
University Programs - - - - 0.0% - 0.0% - - - - -
University Total 1,935 1,915 1,886 (20) -1.0% (29) -1.5% 9.5 9.3 9.1 26,927 14,277
Source: FY2017-18 Average Salary Report, FISM115 V&Z; FY2019 from CUNYFirst EPM
Senior College Staffing Spring 2019 from CUNYFirst as of 2/28/19, Fall 2017 from FIS, last payroll in November, Fall 2016 from FIS last payroll in October;
Community College Staffing Spring 2019 from CUNYFirst as of 2/28/19, Fall 2017 from FIS, last payroll in November, Fall 2016 from FIS last payroll in October;
Gross Square Feet from FPCM Significant Statistics report
2018-2019 Third-Quarter Financial Report
The City University of New York
Fall 2017 GSFM&O Staff per 1000 FTEMaintenance & Operations
Maintenance & Operations: Fall 2016, Fall 2017, Spring 2019
28

Fall 2016 Fall 2017 Spring 2019
Fall 2016 to
Fall 2017 % Change
Fall 2017 to
Spring 2019 % Change Fall 2016 Fall 2017 Spring 2019
Baruch College 82 87 89 5 6.1% 2 2.3% 5.7 6.0 6.2
Brooklyn College 82 82 79 - 0.0% (3) -3.7% 6.1 6.0 5.6
City College 103 101 109 (2) -1.9% 8 7.9% 8.4 8.1 8.7
Hunter College 110 135 131 25 22.7% (4) -3.0% 6.3 7.6 7.2
John Jay College 84 88 92 4 4.8% 4 4.5% 7.5 7.5 7.5
Lehman College 59 57 55 (2) -3.4% (2) -3.5% 6.5 5.8 5.3
Medgar Evers College 68 74 69 6 8.8% (5) -6.8% 12.7 14.0 13.3
NYC College of Technology 73 77 73 4 5.5% (4) -5.2% 5.7 5.9 5.7
Queens College 74 73 78 (1) -1.4% 5 6.8% 4.9 4.8 5.1
College of Staten Island 72 71 61 (1) -1.4% (10) -14.1% 6.5 6.4 5.5
York College 57 57 53 - 0.0% (4) -7.0% 9.6 9.5 8.7
Graduate Center 43 45 45 2 4.7% - 0.0% 14.4 15.5 16.4
CUNY School of Law 22 25 36 3 13.6% 11 44.0% 44.2 47.2 57.1
Newmark School of Journalism 8 9 39 1 12.5% 30 333.3% 31.0 35.9 139.8
School of Professional Studies 14 15 17 1 7.1% 2 13.3% 11.5 10.5 11.8
School of Public Health 27 19 27 (8) 0.0% 8 0.0% 75.4 55.2 74.2
School of Labor - - 2 - 0.0% 2 0.0% - - 13.3
Senior College Total 978 1,015 1,055 37 3.8% 40 3.9% 7.3 7.5 7.6
BMCC 71 72 77 1 1.4% 5 6.9% 3.5 3.5 3.9
Bronx CC 63 71 71 8 12.7% - 0.0% 7.9 8.9 9.4
Guttman CC 37 33 31 (4) -10.8% (2) -6.1% 34.9 28.0 30.2
Hostos CC 55 57 55 2 3.6% (2) -3.5% 11.0 11.4 10.8
Kingsborough CC 71 66 67 (5) -7.0% 1 1.5% 6.3 6.2 6.5
LaGuardia CC 93 93 84 - 0.0% (9) -9.7% 6.6 6.6 6.0
Queensborough CC 64 62 52 (2) -3.1% (10) -16.1% 5.9 5.8 4.9
Community College Total 454 454 437 - 0.0% (17) -3.7% 6.4 6.5 6.4
Shared Services 330 295 313 (35) -10.6% 18 6.1% - - -
System Administration 75 86 65 11 14.7% (21) -24.4% - - -
University Programs - - - - 0.0% - 0.0% - - -
University Total 1,837 1,850 1,870 13 0.7% 20 1.1% 9.0 9.0 9.1
Source: FY2017-18 Average Salary Report, FISM115 V&Z; FY2019 from CUNYFirst EPM
Senior College Staffing Spring 2019 from CUNYFirst as of 2/28/19, Fall 2017 from FIS, last payroll in November, Fall 2016 from FIS last payroll in October;
Community College Staffing Spring 2019 from CUNYFirst as of 2/28/19, Fall 2017 from FIS, last payroll in November, Fall 2016 from FIS last payroll in October;
GA Staff per 1000 FTE
General Administration Staff: Fall 2016, Fall 2017, Spring 2019
2018-2019 Third-Quarter Financial Report
The City University of New York
General Administration
29

Fall 2016 Fall 2017 Spring 2019
Fall 2016 to
Fall 2017 % Change
Fall 2017 to
Spring 2019 % Change Fall 2016 Fall 2017
Spring
2019
Baruch College 158 165 158 7 4.4% (7) -4.2% 11.0 11.4 11.0
Brooklyn College 153 149 145 (4) -2.6% (4) -2.7% 11.4 10.8 10.3
City College 199 188 210 (11) -5.5% 22 11.7% 16.2 15.2 16.7
Hunter College 194 208 219 14 7.2% 11 5.3% 11.1 11.8 12.1
John Jay College 113 117 127 4 3.5% 10 8.5% 10.1 10.0 10.3
Lehman College 105 112 99 7 6.7% (13) -11.6% 11.6 11.5 9.5
Medgar Evers College 61 68 85 7 11.5% 17 25.0% 11.4 12.9 16.4
NYC College of Technology 91 86 93 (5) -5.5% 7 8.1% 7.0 6.6 7.3
Queens College 118 109 121 (9) -7.6% 12 11.0% 7.8 7.1 7.8
College of Staten Island 81 80 93 (1) -1.2% 13 16.3% 7.3 7.2 8.4
York College 98 94 93 (4) -4.1% (1) -1.1% 16.5 15.7 15.3
Graduate Center 86 90 86 4 4.7% (4) -4.4% 28.8 31.0 31.3
CUNY School of Law 22 22 29 - 0.0% 7 31.8% 44.2 41.5 46.0
Newmark School of Journalism 22 26 2 4 18.2% (24) -92.3% 85.3 103.6 7.2
School of Professional Studies 20 20 27 - 0.0% 7 35.0% 16.4 14.1 18.8
School of Public Health 2 9 11 7 0.0% 2 0.0% 5.6 26.2 30.2
School of Labor - - 8 - 0.0% 8 0.0% - - 53.3
Senior College Total 1,523 1,543 1,606 20 1.3% 63 4.1% 11.4 11.4 11.6
BMCC 157 149 157 (8) -5.1% 8 5.4% 7.7 7.3 7.9
Bronx CC 127 124 126 (3) -2.4% 2 1.6% 16.0 15.6 16.8
Guttman CC 22 23 23 1 4.5% - 0.0% 20.8 19.5 22.4
Hostos CC 84 88 90 4 4.8% 2 2.3% 16.8 17.6 17.6
Kingsborough CC 117 115 105 (2) -1.7% (10) -8.7% 10.3 10.7 10.3
LaGuardia CC 180 164 178 (16) -8.9% 14 8.5% 12.7 11.6 12.8
Queensborough CC 109 107 114 (2) -1.8% 7 6.5% 10.1 10.1 10.7
Community College Total 796 770 793 (26) -3.3% 23 3.0% 11.3 11.0 11.6
Shared Services 252 241 246 (11) -4.4% 5 2.1% - - -
System Administration 22 19 20 (3) -13.6% 1 5.3% - - -
University Programs - - - - 0.0% - 0.0% - - -
University Total 2,593 2,573 2,665 (20) -0.8% 92 3.6% 12.7 12.5 12.9
Source: FY2017-18 Average Salary Report, FISM115 V&Z; FY2019 from CUNYFirst EPM
Senior College Staffing Spring 2019 from CUNYFirst as of 2/28/19, Fall 2017 from FIS, last payroll in November, Fall 2016 from FIS last payroll in October;
Community College Staffing Spring 2019 from CUNYFirst as of 2/28/19, Fall 2017 from FIS, last payroll in November, Fall 2016 from FIS last payroll in October;
GIS Staff per 1000 FTE
General Institutional Services Staff: Fall 2016, Fall 2017, Spring 2019
2018-2019 Third-Quarter Financial Report
The City University of New York
General Institutional Services
30
Fall 2016 Fall 2017 Spring 2019
Fall 2016 to
Fall 2017 % Change
Fall 2017 to
Spring 2019 % Change Fall 2016 Fall 2017
Spring
2019
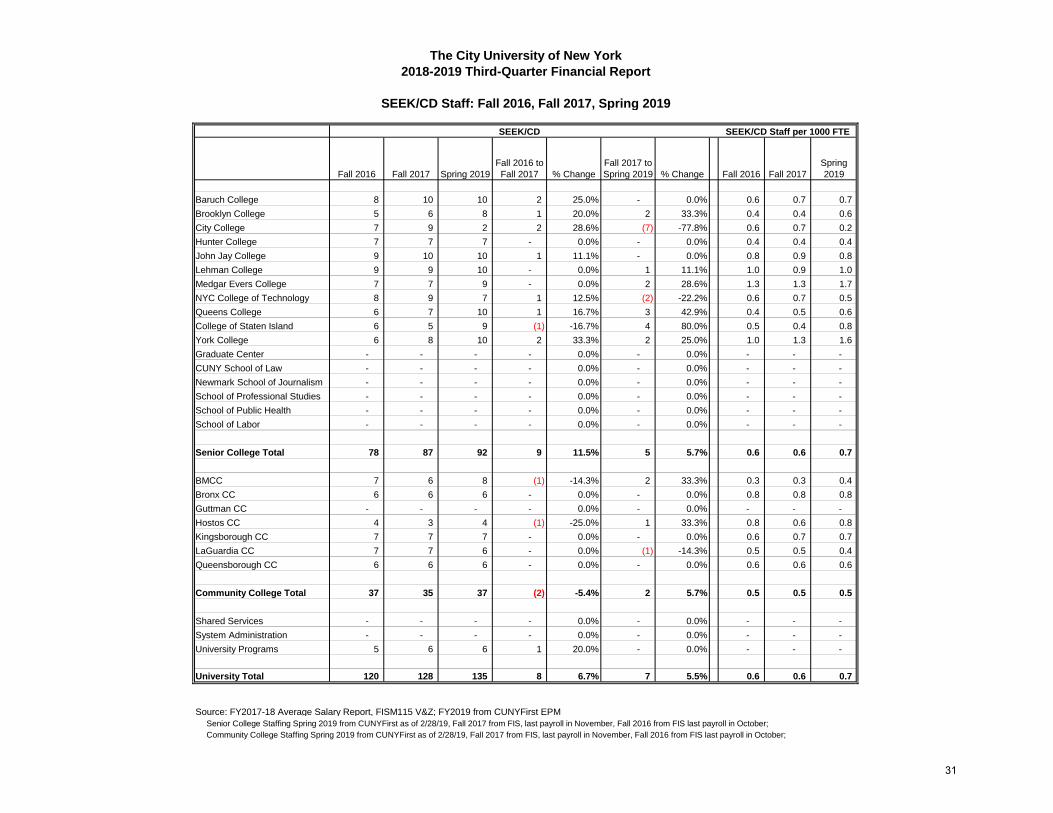
Baruch College 8 10 10 2 25.0% - 0.0% 0.6 0.7 0.7
Brooklyn College 5 6 8 1 20.0% 2 33.3% 0.4 0.4 0.6
City College 7 9 2 2 28.6% (7) -77.8% 0.6 0.7 0.2
Hunter College 7 7 7 - 0.0% - 0.0% 0.4 0.4 0.4
John Jay College 9 10 10 1 11.1% - 0.0% 0.8 0.9 0.8
Lehman College 9 9 10 - 0.0% 1 11.1% 1.0 0.9 1.0
Medgar Evers College 7 7 9 - 0.0% 2 28.6% 1.3 1.3 1.7
NYC College of Technology 8 9 7 1 12.5% (2) -22.2% 0.6 0.7 0.5
Queens College 6 7 10 1 16.7% 3 42.9% 0.4 0.5 0.6
College of Staten Island 6 5 9 (1) -16.7% 4 80.0% 0.5 0.4 0.8
York College 6 8 10 2 33.3% 2 25.0% 1.0 1.3 1.6
Graduate Center - - - - 0.0% - 0.0% - - -
CUNY School of Law - - - - 0.0% - 0.0% - - -
Newmark School of Journalism - - - - 0.0% - 0.0% - - -
School of Professional Studies - - - - 0.0% - 0.0% - - -
School of Public Health - - - - 0.0% - 0.0% - - -
School of Labor - - - - 0.0% - 0.0% - - -
Senior College Total 78 87 92 9 11.5% 5 5.7% 0.6 0.6 0.7
BMCC 7 6 8 (1) -14.3% 2 33.3% 0.3 0.3 0.4
Bronx CC 6 6 6 - 0.0% - 0.0% 0.8 0.8 0.8
Guttman CC - - - - 0.0% - 0.0% - - -
Hostos CC 4 3 4 (1) -25.0% 1 33.3% 0.8 0.6 0.8
Kingsborough CC 7 7 7 - 0.0% - 0.0% 0.6 0.7 0.7
LaGuardia CC 7 7 6 - 0.0% (1) -14.3% 0.5 0.5 0.4
Queensborough CC 6 6 6 - 0.0% - 0.0% 0.6 0.6 0.6
Community College Total 37 35 37 (2) -5.4% 2 5.7% 0.5 0.5 0.5
Shared Services - - - - 0.0% - 0.0% - - -
System Administration - - - - 0.0% - 0.0% - - -
University Programs 5 6 6 1 20.0% - 0.0% - - -
University Total 120 128 135 8 6.7% 7 5.5% 0.6 0.6 0.7
Source: FY2017-18 Average Salary Report, FISM115 V&Z; FY2019 from CUNYFirst EPM
Senior College Staffing Spring 2019 from CUNYFirst as of 2/28/19, Fall 2017 from FIS, last payroll in November, Fall 2016 from FIS last payroll in October;
Community College Staffing Spring 2019 from CUNYFirst as of 2/28/19, Fall 2017 from FIS, last payroll in November, Fall 2016 from FIS last payroll in October;
SEEK/CD Staff per 1000 FTE
SEEK/CD Staff: Fall 2016, Fall 2017, Spring 2019
2018-2019 Third-Quarter Financial Report
The City University of New York
SEEK/CD
31

Fall 2016 Fall 2017 Spring 2019
Fall 2016 to
Fall 2017 % Change
Fall 2017 to
Spring 2019 % Change Fall 2016 Fall 2017
Spring
2019
Baruch College - 4 - 4 0.0% (4) -100.0% - 0.3 -
Brooklyn College - 6 - 6 0.0% (6) -100.0% - 0.4 -
City College 18 16 - (2) -11.1% (16) -100.0% 1.5 1.3 -
Hunter College 13 19 - 6 46.2% (19) -100.0% 0.7 1.1 -
John Jay College - 2 - 2 0.0% (2) -100.0% - 0.2 -
Lehman College - - - - 0.0% - 0.0% - - -
Medgar Evers College - 2 - 2 0.0% (2) -100.0% - 0.4 -
NYC College of Technology - 5 - 5 0.0% (5) -100.0% - 0.4 -
Queens College - - - - 0.0% - 0.0% - - -
College of Staten Island - 12 - 12 0.0% (12) -100.0% - 1.1 -
York College - 1 - 1 0.0% (1) -100.0% - 0.2 -
Graduate Center 47 53 - 6 12.8% (53) -100.0% 15.8 18.3 -
CUNY School of Law - - - - 0.0% - 0.0% - - -
Newmark School of Journalism - - - - 0.0% - 0.0% - - -
School of Professional Studies 40 38 - (2) -5.0% (38) -100.0% 32.7 26.7 -
School of Public Health - 1 - 1 0.0% (1) 0.0% - 2.9 -
School of Labor - - - - 0.0% - 0.0% - - -
Senior College Total 118 159 - 41 34.7% (159) -100.0% 0.9 1.2 -
BMCC 2 20 - 18 900.0% (20) -100.0% 0.1 1.0 -
Bronx CC 1 5 - 4 400.0% (5) -100.0% 0.1 0.6 -
Guttman CC - - - - 0.0% - 0.0% - - -
Hostos CC - - - - 0.0% - 0.0% - - -
Kingsborough CC - 1 - 1 0.0% (1) -100.0% - 0.1 -
LaGuardia CC - 2 - 2 0.0% (2) -100.0% - 0.1 -
Queensborough CC 5 2 - (3) -60.0% (2) -100.0% 0.5 0.2 -
Community College Total 8 30 - 22 275.0% (30) -100.0% 0.1 0.4 -
Shared Services - - - - 0.0% - 0.0% - - -
System Administration - - - - 0.0% - 0.0% - - -
University Programs - - - - 0.0% - 0.0% - - -
University Total 126 189 - 63 50.0% (189) -100.0% 0.6 0.9 -
0%
Source: FY2017-18 Average Salary Report, FISM115 V&Z; FY2019 from CUNYFirst EPM
Senior College Staffing Spring 2019 from CUNYFirst as of 2/28/19, Fall 2017 from FIS, last payroll in November, Fall 2016 from FIS last payroll in October;
Community College Staffing Spring 2019 from CUNYFirst as of 2/28/19, Fall 2017 from FIS, last payroll in November, Fall 2016 from FIS last payroll in October;
Note: FY2017-18 Other Staff includes institutes such as Calandra Institute, Puerto Rico Institute, Sophie Davis and Suspense at the Senior Colleges; In FY19 these staff are captured in other MPs
for Community Colleges it includes Suspense
The City University of New York
Other Staff per 1000 FTE
Other Staff: Fall 2016, Fall 2017, Spring 2019
2018-2019 Third-Quarter Financial Report
32
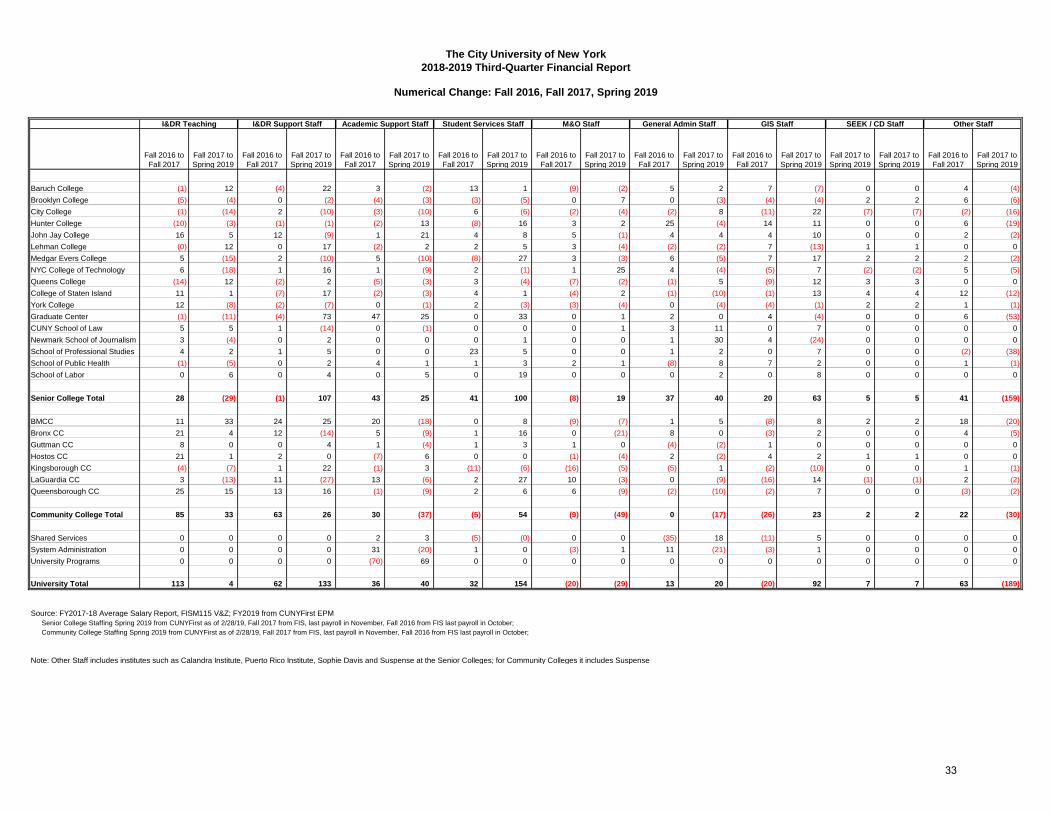
Numerical Change: Fall 2016, Fall 2017, Spring 2019
Fall 2016 to
Fall 2017
Fall 2017 to
Spring 2019
Fall 2016 to
Fall 2017
Fall 2017 to
Spring 2019
Fall 2016 to
Fall 2017
Fall 2017 to
Spring 2019
Fall 2016 to
Fall 2017
Fall 2017 to
Spring 2019
Fall 2016 to
Fall 2017
Fall 2017 to
Spring 2019
Fall 2016 to
Fall 2017
Fall 2017 to
Spring 2019
Fall 2016 to
Fall 2017
Fall 2017 to
Spring 2019
Fall 2017 to
Spring 2019
Fall 2017 to
Spring 2019
Fall 2016 to
Fall 2017
Fall 2017 to
Spring 2019
Baruch College (1) 12 (4) 22 3 (2) 13 1 (9) (2) 5 2 7 (7) 0 0 4 (4)
Brooklyn College (5) (4) 0 (2) (4) (3) (3) (5) 0 7 0 (3) (4) (4) 2 2 6 (6)
City College (1) (14) 2 (10) (3) (10) 6 (6) (2) (4) (2) 8 (11) 22 (7) (7) (2) (16)
Hunter College (10) (3) (1) (1) (2) 13 (8) 16 3 2 25 (4) 14 11 0 0 6 (19)
John Jay College 16 5 12 (9) 1 21 4 8 5 (1) 4 4 4 10 0 0 2 (2)
Lehman College (0) 12 0 17 (2) 2 2 5 3 (4) (2) (2) 7 (13) 1 1 0 0
Medgar Evers College 5 (15) 2 (10) 5 (10) (8) 27 3 (3) 6 (5) 7 17 2 2 2 (2)
NYC College of Technology 6 (18) 1 16 1 (9) 2 (1) 1 25 4 (4) (5) 7 (2) (2) 5 (5)
Queens College (14) 12 (2) 2 (5) (3) 3 (4) (7) (2) (1) 5 (9) 12 3 3 0 0
College of Staten Island 11 1 (7) 17 (2) (3) 4 1 (4) 2 (1) (10) (1) 13 4 4 12 (12)
York College 12 (8) (2) (7) 0 (1) 2 (3) (3) (4) 0 (4) (4) (1) 2 2 1 (1)
Graduate Center (1) (11) (4) 73 47 25 0 33 0 1 2 0 4 (4) 0 0 6 (53)
CUNY School of Law 5 5 1 (14) 0 (1) 0 0 0 1 3 11 0 7 0 0 0 0
Newmark School of Journalism 3 (4) 0 2 0 0 0 1 0 0 1 30 4 (24) 0 0 0 0
School of Professional Studies 4 2 1 5 0 0 23 5 0 0 1 2 0 7 0 0 (2) (38)
School of Public Health (1) (5) 0 2 4 1 1 3 2 1 (8) 8 7 2 0 0 1 (1)
School of Labor 0 6 0 4 0 5 0 19 0 0 0 2 0 8 0 0 0 0
Senior College Total 28 (29) (1) 107 43 25 41 100 (8) 19 37 40 20 63 5 5 41 (159)
BMCC 11 33 24 25 20 (18) 0 8 (9) (7) 1 5 (8) 8 2 2 18 (20)
Bronx CC 21 4 12 (14) 5 (9) 1 16 0 (21) 8 0 (3) 2 0 0 4 (5)
Guttman CC 8 0 0 4 1 (4) 1 3 1 0 (4) (2) 1 0 0 0 0 0
Hostos CC 21 1 2 0 (7) 6 0 0 (1) (4) 2 (2) 4 2 1 1 0 0
Kingsborough CC (4) (7) 1 22 (1) 3 (11) (6) (16) (5) (5) 1 (2) (10) 0 0 1 (1)
LaGuardia CC 3 (13) 11 (27) 13 (6) 2 27 10 (3) 0 (9) (16) 14 (1) (1) 2 (2)
Queensborough CC 25 15 13 16 (1) (9) 2 6 6 (9) (2) (10) (2) 7 0 0 (3) (2)
Community College Total 85 33 63 26 30 (37) (5) 54 (9) (49) 0 (17) (26) 23 2 2 22 (30)
Shared Services 0 0 0 0 2 3 (5) (0) 0 0 (35) 18 (11) 5 0 0 0 0
System Administration 0 0 0 0 31 (20) 1 0 (3) 1 11 (21) (3) 1 0 0 0 0
University Programs 0 0 0 0 (70) 69 0 0 0 0 0 0 0 0 0 0 0 0
University Total 113 4 62 133 36 40 32 154 (20) (29) 13 20 (20) 92 7 7 63 (189)
Source: FY2017-18 Average Salary Report, FISM115 V&Z; FY2019 from CUNYFirst EPM
Senior College Staffing Spring 2019 from CUNYFirst as of 2/28/19, Fall 2017 from FIS, last payroll in November, Fall 2016 from FIS last payroll in October;
Community College Staffing Spring 2019 from CUNYFirst as of 2/28/19, Fall 2017 from FIS, last payroll in November, Fall 2016 from FIS last payroll in October;
Note: Other Staff includes institutes such as Calandra Institute, Puerto Rico Institute, Sophie Davis and Suspense at the Senior Colleges; for Community Colleges it includes Suspense
The City University of New York
2018-2019 Third-Quarter Financial Report
I&DR Teaching I&DR Support Staff Academic Support Staff Other StaffStudent Services Staff M&O Staff General Admin Staff GIS Staff SEEK / CD Staff
33

Percentage Change: Fall 2016, Fall 2017, Spring 2019
Fall 2016 to
Fall 2017
Fall 2017 to
Spring 2019
Fall 2016 to
Fall 2017
Fall 2017 to
Spring 2019
Fall 2016 to
Fall 2017
Fall 2017 to
Spring 2019
Fall 2016 to
Fall 2017
Fall 2017 to
Spring 2019
Fall 2016 to
Fall 2017
Fall 2017 to
Spring 2019
Fall 2016 to
Fall 2017
Fall 2017 to
Spring 2019
Fall 2016 to
Fall 2017
Fall 2017 to
Spring 2019
Fall 2016 to
Fall 2017
Fall 2017 to
Spring 2019
Fall 2016 to
Fall 2017
Fall 2017 to
Spring 2019
Baruch College -0.3% 2.5% -2.9% 16.5% 10.0% -6.1% 8.1% 0.6% -6.4% -1.5% 6.1% 2.3% 4.4% -4.2% 25.0% 0.0% 0.0% -100.0%
Brooklyn College -0.9% -0.8% 0.0% -1.2% -6.2% -4.9% -2.1% -3.5% 0.0% 5.8% 0.0% -3.7% -2.6% -2.7% 20.0% 33.3% 0.0% -100.0%
City College -0.2% -2.6% 0.8% -3.8% -4.7% -16.4% 6.5% -6.1% -1.1% -2.3% -1.9% 7.9% -5.5% 11.7% 28.6% -77.8% -11.1% -100.0%
Hunter College -1.7% -0.5% -0.5% -0.5% -3.8% 25.5% -5.4% 11.4% 1.7% 1.1% 22.7% -3.0% 7.2% 5.3% 0.0% 0.0% 46.2% -100.0%
John Jay College 4.4% 1.2% 8.5% -5.9% 4.5% 91.3% 3.3% 6.3% 5.9% -1.1% 4.8% 4.5% 3.5% 8.5% 11.1% 0.0% 0.0% -100.0%
Lehman College -0.1% 3.5% 0.0% 11.3% -3.9% 4.1% 2.2% 5.3% 2.6% -3.4% -3.4% -3.5% 6.7% -11.6% 0.0% 11.1% 0.0% 0.0%
Medgar Evers College 3.0% -8.8% 2.3% -11.1% 12.5% -22.2% -12.3% 47.4% 4.1% -3.9% 8.8% -6.8% 11.5% 25.0% 0.0% 28.6% 0.0% -100.0%
NYC College of Technology 1.5% -4.4% 1.0% 15.4% 2.7% -23.7% 2.1% -1.0% 1.4% 35.2% 5.5% -5.2% -5.5% 8.1% 12.5% -22.2% 0.0% -100.0%
Queens College -2.6% 2.2% -1.4% 1.4% -7.1% -4.6% 2.7% -3.4% -4.7% -1.4% -1.4% 6.8% -7.6% 11.0% 16.7% 42.9% 0.0% 0.0%
College of Staten Island 3.2% 0.1% -4.2% 10.8% -6.9% -11.1% 4.2% 1.0% -3.7% 1.9% -1.4% -14.1% -1.2% 16.3% -16.7% 80.0% 0.0% -100.0%
York College 6.4% -4.0% -2.6% -9.5% 0.0% -4.0% 3.0% -4.3% -4.1% -5.6% 0.0% -7.0% -4.1% -1.1% 33.3% 25.0% 0.0% -100.0%
Graduate Center -0.2% -3.7% -5.8% 112.3% 71.2% 22.1% 0.0% 86.8% 0.0% 25.0% 4.7% 0.0% 4.7% -4.4% 0.0% 0.0% 12.8% -100.0%
CUNY School of Law 11.6% 10.4% 6.3% -82.4% 0.0% -16.7% 0.0% 0.0% 0.0% 50.0% 13.6% 44.0% 0.0% 31.8% 0.0% 0.0% 0.0% 0.0%
Newmark School of Journalism 17.6% -20.0% 0.0% 0.0% 0.0% 0.0% 0.0% 12.5% 0.0% 0.0% 12.5% 333.3% 18.2% -92.3% 0.0% 0.0% 0.0% 0.0%
School of Professional Studies 36.4% 13.3% 6.3% 29.4% 0.0% 0.0% 2300.0% 20.8% 0.0% 0.0% 7.1% 13.3% 0.0% 35.0% 0.0% 0.0% -5.0% -100.0%
School of Public Health 0.0% 0.0% 0.0% 0.0% 0.0% 0.0% 0.0% 0.0% 0.0% 0.0% 0.0% 0.0% 0.0% 0.0% 0.0% 0.0% 0.0% 0.0%
School of Labor 0.0% 0.0% 0.0% 0.0% 0.0% 0.0% 0.0% 0.0% 0.0% 0.0% 0.0% 0.0% 0.0% 0.0% 0.0% 0.0% 0.0% 0.0%
Senior College Total 0.6% -0.6% -0.1% 6.2% 7.7% 4.1% 3.2% 7.6% -0.6% 1.5% 3.8% 3.9% 1.3% 4.1% 11.5% 5.7% 34.7% -100.0%
BMCC 2.0% 5.9% 18.3% 16.1% 45.5% -28.1% 0.0% 4.8% -6.1% -5.1% 1.4% 6.9% -5.1% 5.4% -14.3% 33.3% 900.0% -100.0%
Bronx CC 7.0% 1.2% 9.3% -9.9% 10.0% -16.4% 1.3% 19.8% 0.0% -18.6% 12.7% 0.0% -2.4% 1.6% 0.0% 0.0% 400.0% -100.0%
Guttman CC 17.4% 0.0% 0.0% 400.0% 12.5% -44.4% 2.6% 7.5% 50.0% 0.0% -10.8% -6.1% 4.5% 0.0% 0.0% 0.0% 0.0% 0.0%
Hostos CC 11.9% 0.5% 2.3% 0.0% -26.9% 31.6% 0.0% 0.0% -1.4% -5.7% 3.6% -3.5% 4.8% 2.3% -25.0% 33.3% 0.0% 0.0%
Kingsborough CC -1.2% -2.0% 0.8% 18.2% -2.5% 7.7% -9.5% -5.7% -12.2% -4.3% -7.0% 1.5% -1.7% -8.7% 0.0% 0.0% 0.0% -100.0%
LaGuardia CC 0.8% -3.5% 8.4% -19.0% 11.7% -4.8% 1.3% 16.8% 20.0% -5.0% 0.0% -9.7% -8.9% 8.5% 0.0% -14.3% 0.0% -100.0%
Queensborough CC 6.5% 3.7% 8.3% 9.5% -2.3% -20.9% 1.8% 5.2% 6.1% -8.6% -3.1% -16.1% -1.8% 6.5% 0.0% 0.0% -60.0% -100.0%
Community College Total 3.9% 1.5% 8.3% 3.2% 9.3% -10.5% -0.6% 7.0% -1.5% -8.1% 0.0% -3.7% -3.3% 3.0% -5.4% 5.7% 275.0% -100.0%
Shared Services 0.0% 0.0% 0.0% 0.0% 6.9% 9.7% -3.8% 4.0% 0.0% 0.0% -10.6% 6.1% -4.4% 2.1% 0.0% 0.0% 0.0% 0.0%
System Administration 0.0% 0.0% 0.0% 0.0% 103.3% -32.8% 4.0% 3.8% -15.8% 6.3% 14.7% -24.4% -13.6% 5.3% 0.0% 0.0% 0.0% 0.0%
University Programs 0.0% 0.0% 0.0% 0.0% -95.9% 2300.0% 0.0% 0.0% 0.0% 0.0% 0.0% 0.0% 0.0% 0.0% 20.0% 0.0% 0.0% 0.0%
University Total 1.6% 0.1% 2.5% 5.2% 3.5% 3.8% 1.5% 7.2% -1.0% -1.5% 0.7% 1.1% -0.8% 3.6% 6.7% 5.5% 50.0% -100.0%
Source: FY2017-18 Average Salary Report, FISM115 V&Z; FY2019 from CUNYFirst EPM
Senior College Staffing Spring 2019 from CUNYFirst as of 2/28/19, Fall 2017 from FIS, last payroll in November, Fall 2016 from FIS last payroll in October;
Community College Staffing Spring 2019 from CUNYFirst as of 2/28/19, Fall 2017 from FIS, last payroll in November, Fall 2016 from FIS last payroll in October;
Note: Other Staff includes institutes such as Calandra Institute, Puerto Rico Institute, Sophie Davis and Suspense at the Senior Colleges; for Community Colleges it includes Suspense
Other Staff
The City University of New York
2018-2019 Third-Quarter Financial Report
I&DR Teaching I&DR Support Staff Academic Support Staff Student Services Staff M&O Staff General Admin Staff GIS Staff SEEK / CD Staff
34
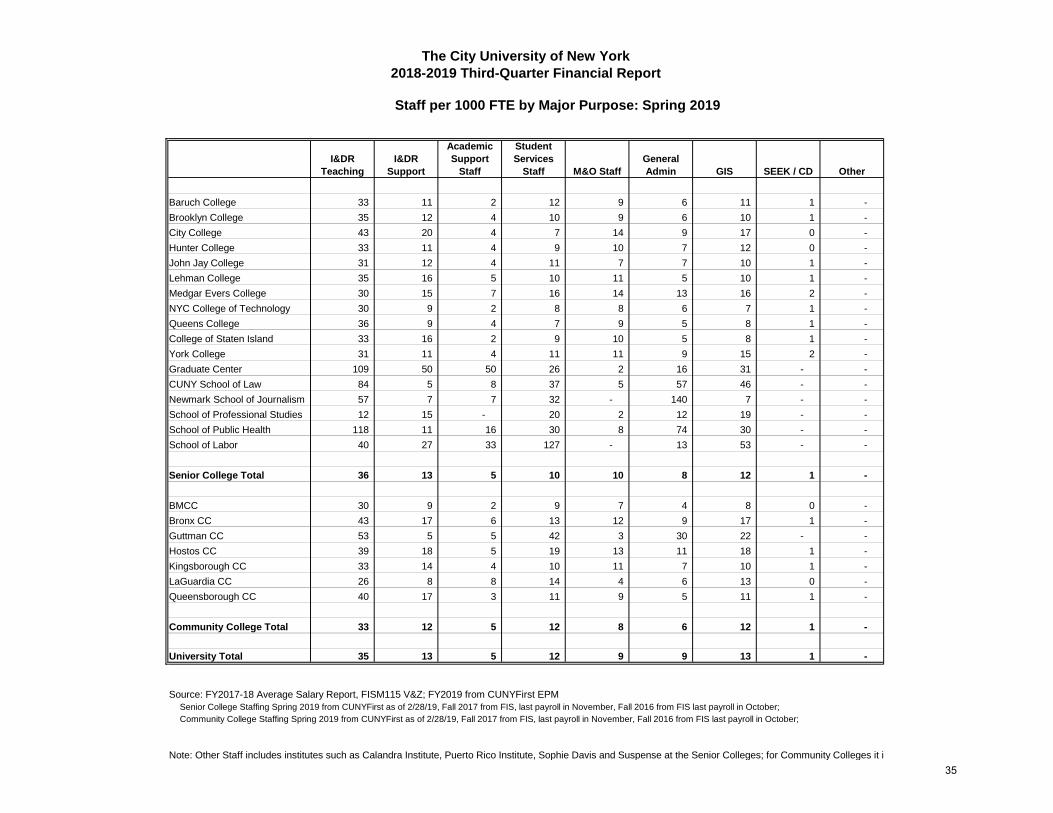
Staff per 1000 FTE by Major Purpose: Spring 2019
I&DR
Teaching
I&DR
Support
Academic
Support
Staff
Student
Services
Staff M&O Staff
General
Admin GIS SEEK / CD Other
Baruch College 33 11 2 12 9 6 11 1 -
Brooklyn College 35 12 4 10 9 6 10 1 -
City College 43 20 4 7 14 9 17 0 -
Hunter College 33 11 4 9 10 7 12 0 -
John Jay College 31 12 4 11 7 7 10 1 -
Lehman College 35 16 5 10 11 5 10 1 -
Medgar Evers College 30 15 7 16 14 13 16 2 -
NYC College of Technology 30 9 2 8 8 6 7 1 -
Queens College 36 9 4 7 9 5 8 1 -
College of Staten Island 33 16 2 9 10 5 8 1 -
York College 31 11 4 11 11 9 15 2 -
Graduate Center 109 50 50 26 2 16 31 - -
CUNY School of Law 84 5 8 37 5 57 46 - -
Newmark School of Journalism 57 7 7 32 - 140 7 - -
School of Professional Studies 12 15 - 20 2 12 19 - -
School of Public Health 118 11 16 30 8 74 30 - -
School of Labor 40 27 33 127 - 13 53 - -
Senior College Total 36 13 5 10 10 8 12 1 -
BMCC 30 9 2 9 7 4 8 0 -
Bronx CC 43 17 6 13 12 9 17 1 -
Guttman CC 53 5 5 42 3 30 22 - -
Hostos CC 39 18 5 19 13 11 18 1 -
Kingsborough CC 33 14 4 10 11 7 10 1 -
LaGuardia CC 26 8 8 14 4 6 13 0 -
Queensborough CC 40 17 3 11 9 5 11 1 -
Community College Total 33 12 5 12 8 6 12 1 -
University Total 35 13 5 12 9 9 13 1 -
Source: FY2017-18 Average Salary Report, FISM115 V&Z; FY2019 from CUNYFirst EPM
Senior College Staffing Spring 2019 from CUNYFirst as of 2/28/19, Fall 2017 from FIS, last payroll in November, Fall 2016 from FIS last payroll in October;
Community College Staffing Spring 2019 from CUNYFirst as of 2/28/19, Fall 2017 from FIS, last payroll in November, Fall 2016 from FIS last payroll in October;
Note: Other Staff includes institutes such as Calandra Institute, Puerto Rico Institute, Sophie Davis and Suspense at the Senior Colleges; for Community Colleges it i
The City University of New York
2018-2019 Third-Quarter Financial Report
35
UNIVERSITY
SUMMARIES
36

Resources
Current Budget 2,314,436 2,366,415 51,979 2.2%
Centrally Administered Resources 1,069,440 1,168,482 99,042 9.3% FY2014 FY2015 FY2016 FY FY2019
Technology Fee 51,918 57,569 5,651 10.9%
Total Budget 3,435,794 3,592,466 208,652 6.1% FTE % Change 0.0% 0.0% 2.0% 2.2% 2.9%
I&DR Teaching % Change 0.0% 2.6% 2.6% 3.6% 3.6%
Allocated Revenue Target 1,435,155
Macaulay Waiver (9,391)
Other Adjustments (599)
Adjusted Revenue Target 1,386,822 1,425,164 38,342 2.8%
Revenue Collected/Projected 1,413,826 1,457,733 43,907 3.1%
Collection Above/(Below) Target 27,004 32,569 5,564 20.6%
Total Resources 3,462,798 3,625,035 162,237 4.7%
Expenditures
PS Regular 1,640,570 1,664,288 23,718 1.4%
Adjuncts 269,930 280,623 10,692 4.0%
Temporary Service 137,243 142,238 4,995 3.6%
Total PS 2,047,743 2,087,148 39,405 1.9% Enrollment Fall 2016 Fall 2017 Fall 2018 1 Yr # Change 1 Yr % Change
OTPS 289,226 304,936 15,710 5.4% FTE Undergraduate 185,099 186,369 186,763 394 0.2%
Campus Based Expenditures 2,336,969 2,392,084 55,115 2.4% FTE Graduate 19,242 19,483 19,631 148 0.8%
Centrally Administered Expenditures 1,069,440 1,167,982 98,542 9.2% Total FTE 204,341 205,852 206,394 542 0.3%
Technology Fee 51,918 57,569 5,651 10.9%
Total Expenditures 3,458,327 3,617,635 159,308 4.6% Total Headcount 272,958 274,100 274,075 (25) 0.0%
(Over)/Under Expenditure 4,471 7,400 2,929 65.5% Staffing Fall 2016 Fall 2017 Spring 2019 1 Yr # Change 1 Yr % Change
Prior Year CUTRA & Reserves 59,018 62,578 3,560 6.0% I&DR Teaching 7,127 7,240 7,244 4 0.1%
Labor Reserve - 34,429 34,429 0.0% I&DR Support 2,493 2,555 2,688 133 5.2%
Year-End Balance 63,489 35,548 (27,941) -44.0% Academic Support 1,016 1,052 1,092 40 3.8%
Student Services 2,200 2,232 2,392 160 7.2%
Centrally Administered Funds ($000) FY2018 FY2019 $ Change % Change Maintenance & Operations 1,935 1,915 1,886 (29) -1.5%
Fringes Actual/Projected 881,125 962,903 81,777 9.3% General Administration 1,837 1,850 1,870 20 1.1%
Energy 98,295 104,315 6,019 6.1% General Institutional Services 2,593 2,573 2,665 92 3.6%
Building Rentals 62,702 73,033 10,330 16.5% SEEK/CD 120 128 135 7 5.5%
Financial Aid 27,317 27,731 415 1.5% Other 126 189 - (189) -100.0%
Total Centrally Administered Funds 1,069,440 1,167,982 98,542 9.2% Total Full-time 19,447 19,734 19,972 238 1.2%
Prior year end balance may not tie to current year CUTRA due to IFR Cost recoveries adjustment
FY2018 Energy includes water and sewer; FY2019 prorated based on FY18
FY2019 Macaulay Waiver are preliminary estimates
SC Staffing Spring 2019 from CUNYFirst as of 2/28/19, Fall 2017 from FIS, last payroll in November, Fall 2016 from FIS last payroll in October; ; CC Staffing Spring 2019 from CUNYFirst as of 2/28/19, Fall 2017 from FIS, last payroll in November, Fall
2016 from FIS last payroll in October;
FY2018
The City University of New York
2018-2019 Third-Quarter Financial Report
University wide
Comparison of Expenditures to
Resources (#000)FY2018 FY2019 $ Change % Change
FTE Enrollment and I&DR Teaching change since Fall 2013
-1%
0%
1%
1%
2%
2%
3%
3%
4%
4%
FY2014 FY2015 FY2016 FY2017 FY2018 FY2019
FTE % Change I&DR Teaching % Change
37
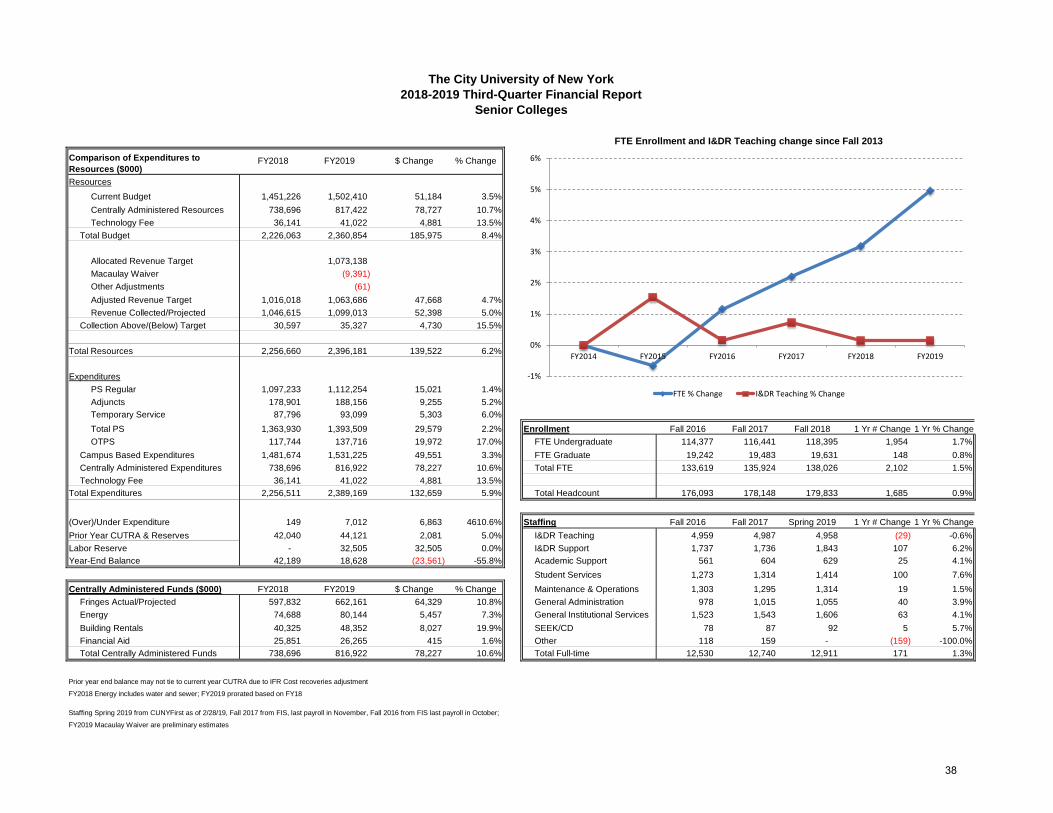
Resources
Current Budget 1,451,226 1,502,410 51,184 3.5%
Centrally Administered Resources 738,696 817,422 78,727 10.7% FY2014 FY2015 FY2016 FY
Technology Fee 36,141 41,022 4,881 13.5%
Total Budget 2,226,063 2,360,854 185,975 8.4% FTE % Change 0.0% -0.7% 1.2% 3.2% 5.0%
I&DR Teaching % Change 0.0% 1.5% 0.2% 0.1% 0.1%
Allocated Revenue Target 1,073,138
Macaulay Waiver (9,391)
Other Adjustments (61)
Adjusted Revenue Target 1,016,018 1,063,686 47,668 4.7%
Revenue Collected/Projected 1,046,615 1,099,013 52,398 5.0%
Collection Above/(Below) Target 30,597 35,327 4,730 15.5%
Total Resources 2,256,660 2,396,181 139,522 6.2%
Expenditures
PS Regular 1,097,233 1,112,254 15,021 1.4%
Adjuncts 178,901 188,156 9,255 5.2%
Temporary Service 87,796 93,099 5,303 6.0%
Total PS 1,363,930 1,393,509 29,579 2.2% Enrollment Fall 2016 Fall 2017 Fall 2018 1 Yr # Change 1 Yr % Change
OTPS 117,744 137,716 19,972 17.0% FTE Undergraduate 114,377 116,441 118,395 1,954 1.7%
Campus Based Expenditures 1,481,674 1,531,225 49,551 3.3% FTE Graduate 19,242 19,483 19,631 148 0.8%
Centrally Administered Expenditures 738,696 816,922 78,227 10.6% Total FTE 133,619 135,924 138,026 2,102 1.5%
Technology Fee 36,141 41,022 4,881 13.5%
Total Expenditures 2,256,511 2,389,169 132,659 5.9% Total Headcount 176,093 178,148 179,833 1,685 0.9%
(Over)/Under Expenditure 149 7,012 6,863 4610.6% Staffing Fall 2016 Fall 2017 Spring 2019 1 Yr # Change 1 Yr % Change
Prior Year CUTRA & Reserves 42,040 44,121 2,081 5.0% I&DR Teaching 4,959 4,987 4,958 (29) -0.6%
Labor Reserve - 32,505 32,505 0.0% I&DR Support 1,737 1,736 1,843 107 6.2%
Year-End Balance 42,189 18,628 (23,561) -55.8% Academic Support 561 604 629 25 4.1%
Student Services 1,273 1,314 1,414 100 7.6%
Centrally Administered Funds ($000) FY2018 FY2019 $ Change % Change Maintenance & Operations 1,303 1,295 1,314 19 1.5%
Fringes Actual/Projected 597,832 662,161 64,329 10.8% General Administration 978 1,015 1,055 40 3.9%
Energy 74,688 80,144 5,457 7.3% General Institutional Services 1,523 1,543 1,606 63 4.1%
Building Rentals 40,325 48,352 8,027 19.9% SEEK/CD 78 87 92 5 5.7%
Financial Aid 25,851 26,265 415 1.6% Other 118 159 - (159) -100.0%
Total Centrally Administered Funds 738,696 816,922 78,227 10.6% Total Full-time 12,530 12,740 12,911 171 1.3%
Prior year end balance may not tie to current year CUTRA due to IFR Cost recoveries adjustment
FY2018 Energy includes water and sewer; FY2019 prorated based on FY18
Staffing Spring 2019 from CUNYFirst as of 2/28/19, Fall 2017 from FIS, last payroll in November, Fall 2016 from FIS last payroll in October;
FY2019 Macaulay Waiver are preliminary estimates
FY2018 FY2019
The City University of New York
2018-2019 Third-Quarter Financial Report
Senior Colleges
Comparison of Expenditures to
Resources ($000)FY2018 FY2019 $ Change % Change
FTE Enrollment and I&DR Teaching change since Fall 2013
-1%
0%
1%
2%
3%
4%
5%
6%
FY2014 FY2015 FY2016 FY2017 FY2018 FY2019
FTE % Change I&DR Teaching % Change
38
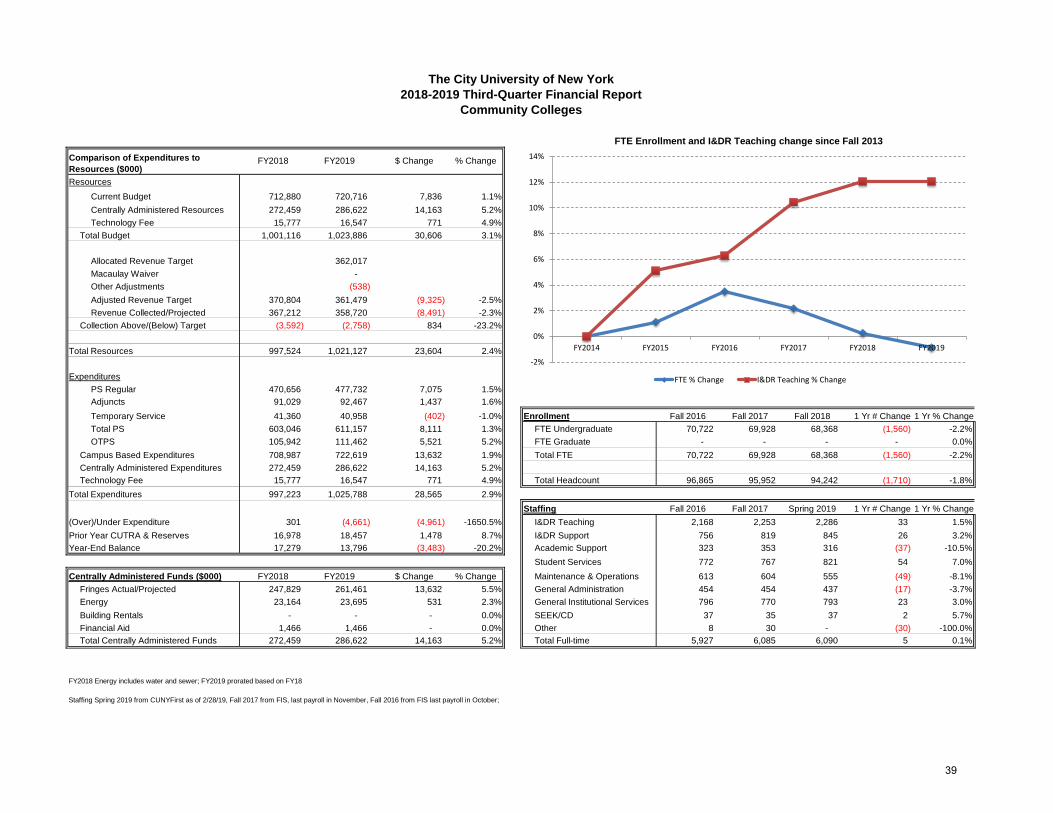
Resources
Current Budget 712,880 720,716 7,836 1.1%
Centrally Administered Resources 272,459 286,622 14,163 5.2% FY2014 FY2015 FY2016 FY
Technology Fee 15,777 16,547 771 4.9%
Total Budget 1,001,116 1,023,886 30,606 3.1% FTE % Change 0.0% 1.1% 3.5% 0.3% -0.9%
I&DR Teaching % Change 0.0% 5.1% 6.3% 12.1% 12.1%
Allocated Revenue Target 362,017
Macaulay Waiver -
Other Adjustments (538)
Adjusted Revenue Target 370,804 361,479 (9,325) -2.5%
Revenue Collected/Projected 367,212 358,720 (8,491) -2.3%
Collection Above/(Below) Target (3,592) (2,758) 834 -23.2%
Total Resources 997,524 1,021,127 23,604 2.4%
Expenditures
PS Regular 470,656 477,732 7,075 1.5%
Adjuncts 91,029 92,467 1,437 1.6%
Temporary Service 41,360 40,958 (402) -1.0% Enrollment Fall 2016 Fall 2017 Fall 2018 1 Yr # Change 1 Yr % Change
Total PS 603,046 611,157 8,111 1.3% FTE Undergraduate 70,722 69,928 68,368 (1,560) -2.2%
OTPS 105,942 111,462 5,521 5.2% FTE Graduate - - - - 0.0%
Campus Based Expenditures 708,987 722,619 13,632 1.9% Total FTE 70,722 69,928 68,368 (1,560) -2.2%
Centrally Administered Expenditures 272,459 286,622 14,163 5.2%
Technology Fee 15,777 16,547 771 4.9% Total Headcount 96,865 95,952 94,242 (1,710) -1.8%
Total Expenditures 997,223 1,025,788 28,565 2.9%
Staffing Fall 2016 Fall 2017 Spring 2019 1 Yr # Change 1 Yr % Change
(Over)/Under Expenditure 301 (4,661) (4,961) -1650.5% I&DR Teaching 2,168 2,253 2,286 33 1.5%
Prior Year CUTRA & Reserves 16,978 18,457 1,478 8.7% I&DR Support 756 819 845 26 3.2%
Year-End Balance 17,279 13,796 (3,483) -20.2% Academic Support 323 353 316 (37) -10.5%
Student Services 772 767 821 54 7.0%
Centrally Administered Funds ($000) FY2018 FY2019 $ Change % Change Maintenance & Operations 613 604 555 (49) -8.1%
Fringes Actual/Projected 247,829 261,461 13,632 5.5% General Administration 454 454 437 (17) -3.7%
Energy 23,164 23,695 531 2.3% General Institutional Services 796 770 793 23 3.0%
Building Rentals - - - 0.0% SEEK/CD 37 35 37 2 5.7%
Financial Aid 1,466 1,466 - 0.0% Other 8 30 - (30) -100.0%
Total Centrally Administered Funds 272,459 286,622 14,163 5.2% Total Full-time 5,927 6,085 6,090 5 0.1%
FY2018 Energy includes water and sewer; FY2019 prorated based on FY18
Staffing Spring 2019 from CUNYFirst as of 2/28/19, Fall 2017 from FIS, last payroll in November, Fall 2016 from FIS last payroll in October;
FY2018 FY2019
The City University of New York
2018-2019 Third-Quarter Financial Report
Community Colleges
Comparison of Expenditures to
Resources ($000)FY2018 FY2019 $ Change % Change
FTE Enrollment and I&DR Teaching change since Fall 2013
-2%
0%
2%
4%
6%
8%
10%
12%
14%
FY2014 FY2015 FY2016 FY2017 FY2018 FY2019
FTE % Change I&DR Teaching % Change
39

Resources
Current Budget 86,458 95,854 9,396 10.9%
Centrally Administered Resources 40,339 44,267 3,928 9.7% FY2019Technology Fee - - - 0.0% FY2014 FY2015 FY2016 FY
Total Resources 126,797 140,121 13,324 10.5%
Expenditures Enrollment Fall 2016 Fall 2017 Fall 2018 1 Yr $ Change 1 Yr % Change
PS Regular 50,302 51,041 739 1.5% FTE Undergraduate - 0.0%
Adjuncts - - - 0.0% FTE Graduate - 0.0%
Temporary Service 5,293 6,446 1,153 21.8% Total FTE - - - - 0.0%
Total PS 55,595 57,487 1,892 3.4%
OTPS 27,716 35,307 7,591 27.4% Total Headcount - 0.0%
Campus Based Expenditures 83,312 92,794 9,483 11.4%
Centrally Administered Expenditures 40,339 44,267 3,928 9.7%
Technology Fee - - - 0.0%
Total Expenditures 123,651 137,061 13,411 10.8%
(Over)/Under Expenditure 3,146 3,060 (86) -2.7% Staffing Fall 2016 Fall 2017 Spring 2019 1 Yr $ Change 1 Yr % Change
Prior Year CUTRA & Reserves - - - 0.0% I&DR Teaching - - - - 0.0%
Labor Reserve - 1,341 1,341 0.0% I&DR Support - - - - 0.0%
Year-End Balance 3,146 1,719 (1,427) -45.4% Academic Support 29 31 34 3 9.7%
Student Services 130 125 130 5 4.0%
Centrally Administered Funds ($000) FY2018 FY2019 $ Change % Change Maintenance & Operations - - - - 0.0%
Fringes Actual/Projected 24,545 26,983 2,439 9.9% General Administration 330 295 313 18 6.1%
Energy 307 329 22 7.3% General Institutional Services 252 241 246 5 2.1%
Building Rentals 15,487 16,954 1,467 9.5% SEEK/CD - - - - 0.0%
Financial Aid - - - 0.0% Other - - - - 0.0%
Total Centrally Administered Funds 40,339 44,267 3,928 9.7% Total Full-time 741 692 723 31 4.5%
Other Metrics ($) FY2018 FY2019 1 Yr # Change 1 Yr% Change
Staffing Spring 2019 from CUNYFirst as of 2/28/19, Fall 2017 from FIS, last payroll in November, Fall 2016 from FIS last payroll in October; Revenue per FTE ((Tuition+Tech Fee)/Total FTE) - - - 0.0%
FY2018 Energy includes water and sewer; FY2019 prorated based on FY18 Expenditures per FTE (Total Exp/Total FTE) - - - 0.0%
FY2018 FY2019
The City University of New York
2018-2019 Third-Quarter Financial Report
Shared Services
I&DR Teaching change since Fall 2016
Comparison of Expenditures to
Resources ($000)FY2018 FY2019 $ Change % Change
0
50
100
150
200
250
300
350
Fall 2016 Fall 2017 Spring 2019
Academic Support
Student Services
General Administration
General Institutional Services
40
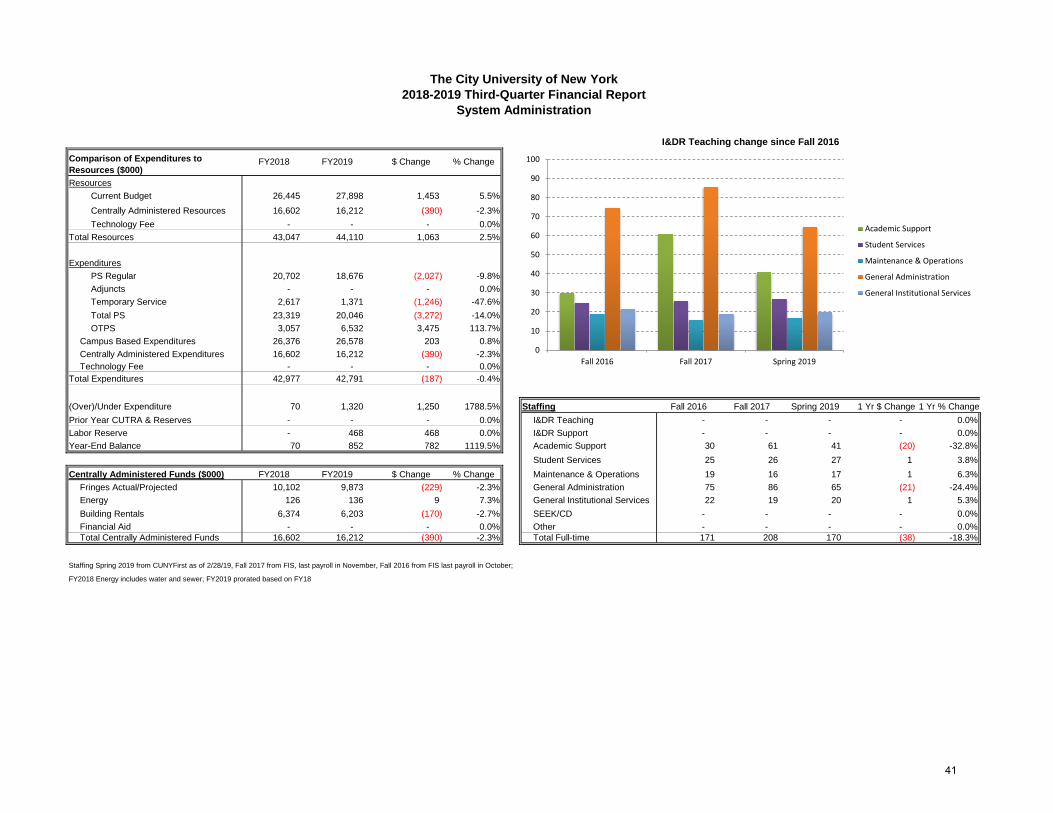
Resources
Current Budget 26,445 27,898 1,453 5.5%
Centrally Administered Resources 16,602 16,212 (390) -2.3% FY2019Technology Fee - - - 0.0% FY2014 FY2015 FY2016 FY
Total Resources 43,047 44,110 1,063 2.5%
Expenditures Enrollment Fall 2016 Fall 2017 Fall 2018 1 Yr $ Change 1 Yr % Change
PS Regular 20,702 18,676 (2,027) -9.8% FTE Undergraduate - 0.0%
Adjuncts - - - 0.0% FTE Graduate - 0.0%
Temporary Service 2,617 1,371 (1,246) -47.6% Total FTE - - - - 0.0%
Total PS 23,319 20,046 (3,272) -14.0%
OTPS 3,057 6,532 3,475 113.7% Total Headcount - 0.0%
Campus Based Expenditures 26,376 26,578 203 0.8%
Centrally Administered Expenditures 16,602 16,212 (390) -2.3%
Technology Fee - - - 0.0%
Total Expenditures 42,977 42,791 (187) -0.4%
(Over)/Under Expenditure 70 1,320 1,250 1788.5% Staffing Fall 2016 Fall 2017 Spring 2019 1 Yr $ Change 1 Yr % Change
Prior Year CUTRA & Reserves - - - 0.0% I&DR Teaching - - - - 0.0%
Labor Reserve - 468 468 0.0% I&DR Support - - - - 0.0%
Year-End Balance 70 852 782 1119.5% Academic Support 30 61 41 (20) -32.8%
Student Services 25 26 27 1 3.8%
Centrally Administered Funds ($000) FY2018 FY2019 $ Change % Change Maintenance & Operations 19 16 17 1 6.3%
Fringes Actual/Projected 10,102 9,873 (229) -2.3% General Administration 75 86 65 (21) -24.4%
Energy 126 136 9 7.3% General Institutional Services 22 19 20 1 5.3%
Building Rentals 6,374 6,203 (170) -2.7% SEEK/CD - - - - 0.0%
Financial Aid - - - 0.0% Other - - - - 0.0%
Total Centrally Administered Funds 16,602 16,212 (390) -2.3% Total Full-time 171 208 170 (38) -18.3%
Other Metrics ($) FY2018 FY2019 1 Yr # Change 1 Yr% Change
Staffing Spring 2019 from CUNYFirst as of 2/28/19, Fall 2017 from FIS, last payroll in November, Fall 2016 from FIS last payroll in October; Revenue per FTE ((Tuition+Tech Fee)/Total FTE) - - - 0.0%
FY2018 Energy includes water and sewer; FY2019 prorated based on FY18 Expenditures per FTE (Total Exp/Total FTE) - - - 0.0%
FY2018 FY2019
The City University of New York
2018-2019 Third-Quarter Financial Report
System Administration
I&DR Teaching change since Fall 2016
Comparison of Expenditures to
Resources ($000)FY2018 FY2019 $ Change % Change
0
10
20
30
40
50
60
70
80
90
100
Fall 2016 Fall 2017 Spring 2019
Academic Support
Student Services
Maintenance & Operations
General Administration
General Institutional Services
41

Resources
Current Budget 37,427 19,537 (17,890) -47.8%
Centrally Administered Resources 1,344 3,958 2,614 194.4% FY2019Technology Fee - - - 0.0% FY2014 FY2015 FY2016 FY
Total Resources 38,771 23,495 (15,276) -39.4%
Expenditures Enrollment Fall 2016 Fall 2017 Fall 2018 1 Yr $ Change 1 Yr % Change
PS Regular 1,676 4,585 2,909 173.5% FTE Undergraduate - 0.0%
Adjuncts - - - 0.0% FTE Graduate - 0.0%
Temporary Service 177 364 187 105.1% Total FTE - - - - 0.0%
Total PS 1,854 4,949 3,096 167.0%
OTPS 34,767 13,918 (20,849) -60.0% Total Headcount - 0.0%
Campus Based Expenditures 36,621 18,868 (17,753) -48.5%
Centrally Administered Expenditures 1,344 3,958 2,614 194.4%
Technology Fee - - - 0.0%
Total Expenditures 37,965 22,826 (15,140) -39.9% #N/A
(Over)/Under Expenditure 806 669 (136) -16.9% Staffing Fall 2016 Fall 2017 Spring 2019 1 Yr $ Change 1 Yr % Change
Prior Year CUTRA & Reserves - - - 0.0% I&DR Teaching - - - - 0.0%
Labor Reserve - 115 115 0.0% I&DR Support - - - - 0.0%
Year-End Balance 806 554 (252) -31.3% Academic Support 73 3 72 69 2300.0%
Student Services - - - - 0.0%
Centrally Administered Funds ($000) FY2018 FY2019 $ Change % Change Maintenance & Operations - - - - 0.0%
Fringes Actual/Projected 818 2,424 1,606 196.4% General Administration - - - - 0.0%
Energy 10 11 1 7.3% General Institutional Services - - - - 0.0%
Building Rentals 516 1,523 1,007 195.1% SEEK/CD 5 6 6 - 0.0%
Financial Aid - - - 0.0% Other - - - - 0.0%
Total Centrally Administered Funds 1,344 3,958 2,614 194.4% Total Full-time 78 9 78 69 766.7%
Other Metrics ($) FY2018 FY2019 1 Yr # Change 1 Yr% Change
Staffing Spring 2019 from CUNYFirst as of 2/28/19, Fall 2017 from FIS, last payroll in November, Fall 2016 from FIS last payroll in October; Revenue per FTE ((Tuition+Tech Fee)/Total FTE) - - - 0.0%
FY2018 Energy includes water and sewer; FY2019 prorated based on FY18 Expenditures per FTE (Total Exp/Total FTE) - - - 0.0%
FY2018 FY2019
The City University of New York
2018-2019 Third-Quarter Financial Report
University Programs
I&DR Teaching change since Fall 2016
Comparison of Expenditures to
Resources ($000)FY2018 FY2019 $ Change % Change
0
10
20
30
40
50
60
70
80
Fall 2016 Fall 2017 Spring 2019
Academic Support
SEEK/CD
42
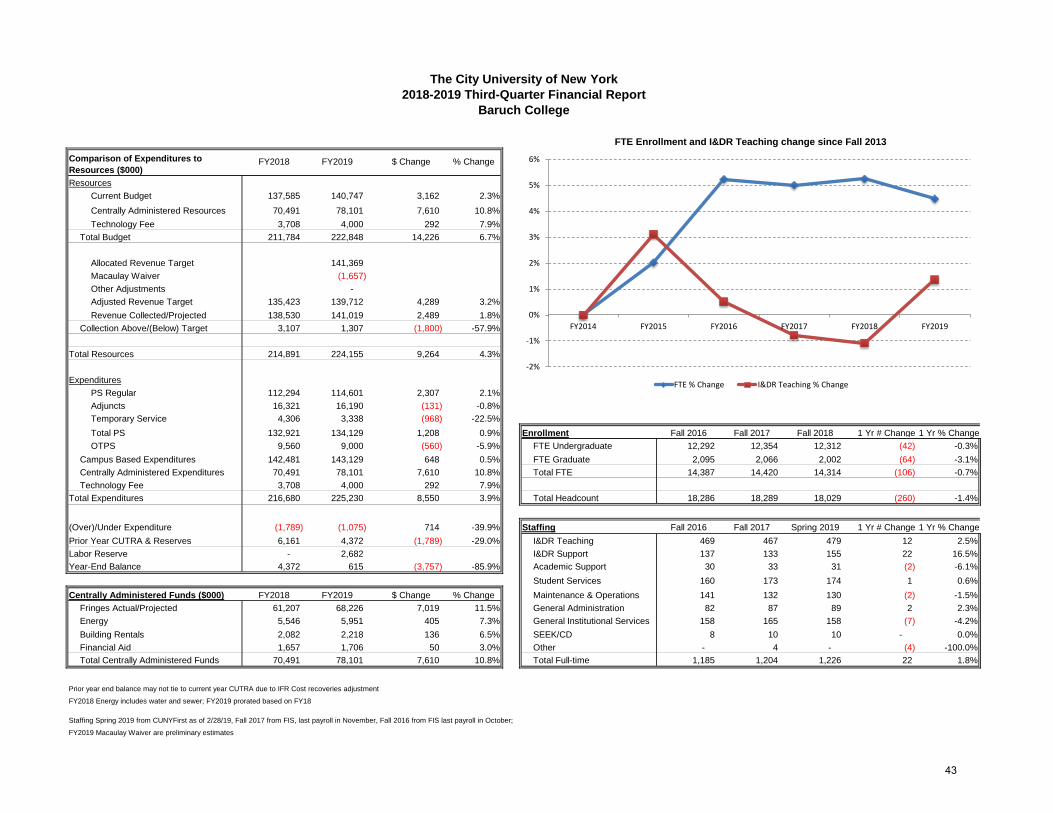
Resources
Current Budget 137,585 140,747 3,162 2.3%
Centrally Administered Resources 70,491 78,101 7,610 10.8% FY2019Technology Fee 3,708 4,000 292 7.9% FY2014 FY2015 FY2016 FY
Total Budget 211,784 222,848 14,226 6.7% FTE % Change
FTE % Change 0.0% 2.0% 5.2% # 5.2% 4.5%
Allocated Revenue Target 141,369 I&DR Teaching % Change 0.0% 3.1% 0.5% # -1.1% 1.4%
Macaulay Waiver (1,657)
Other Adjustments -
Adjusted Revenue Target 135,423 139,712 4,289 3.2%
Revenue Collected/Projected 138,530 141,019 2,489 1.8%
Collection Above/(Below) Target 3,107 1,307 (1,800) -57.9%
Total Resources 214,891 224,155 9,264 4.3%
Expenditures
PS Regular 112,294 114,601 2,307 2.1%
Adjuncts 16,321 16,190 (131) -0.8%
Temporary Service 4,306 3,338 (968) -22.5% Fall 2017
Total PS 132,921 134,129 1,208 0.9% Enrollment Fall 2016 Fall 2017 Fall 2018 1 Yr # Change 1 Yr % Change
OTPS 9,560 9,000 (560) -5.9% FTE Undergraduate 12,292 12,354 12,312 (42) -0.3%
Campus Based Expenditures 142,481 143,129 648 0.5% FTE Graduate 2,095 2,066 2,002 (64) -3.1%
Centrally Administered Expenditures 70,491 78,101 7,610 10.8% Total FTE 14,387 14,420 14,314 (106) -0.7%
Technology Fee 3,708 4,000 292 7.9%
Total Expenditures 216,680 225,230 8,550 3.9% Total Headcount 18,286 18,289 18,029 (260) -1.4%
(Over)/Under Expenditure (1,789) (1,075) 714 -39.9% Staffing Fall 2016 Fall 2017 Spring 2019 1 Yr # Change 1 Yr % Change
Prior Year CUTRA & Reserves 6,161 4,372 (1,789) -29.0% I&DR Teaching 469 467 479 12 2.5%
Labor Reserve - 2,682 I&DR Support 137 133 155 22 16.5%
Year-End Balance 4,372 615 (3,757) -85.9% Academic Support 30 33 31 (2) -6.1%
Student Services 160 173 174 1 0.6%
Centrally Administered Funds ($000) FY2018 FY2019 $ Change % Change Maintenance & Operations 141 132 130 (2) -1.5%
Fringes Actual/Projected 61,207 68,226 7,019 11.5% General Administration 82 87 89 2 2.3%
Energy 5,546 5,951 405 7.3% General Institutional Services 158 165 158 (7) -4.2%
Building Rentals 2,082 2,218 136 6.5% SEEK/CD 8 10 10 - 0.0%
Financial Aid 1,657 1,706 50 3.0% Other - 4 - (4) -100.0%
Total Centrally Administered Funds 70,491 78,101 7,610 10.8% Total Full-time 1,185 1,204 1,226 22 1.8%
Prior year end balance may not tie to current year CUTRA due to IFR Cost recoveries adjustment
FY2018 Energy includes water and sewer; FY2019 prorated based on FY18
Staffing Spring 2019 from CUNYFirst as of 2/28/19, Fall 2017 from FIS, last payroll in November, Fall 2016 from FIS last payroll in October;
FY2019 Macaulay Waiver are preliminary estimates
The City University of New York
Comparison of Expenditures to
Resources ($000)FY2018 FY2019 $ Change % Change
FY2018 FY2019
FTE Enrollment and I&DR Teaching change since Fall 2013
Baruch College
2018-2019 Third-Quarter Financial Report
-2%
-1%
0%
1%
2%
3%
4%
5%
6%
FY2014 FY2015 FY2016 FY2017 FY2018 FY2019
FTE % Change I&DR Teaching % Change
43
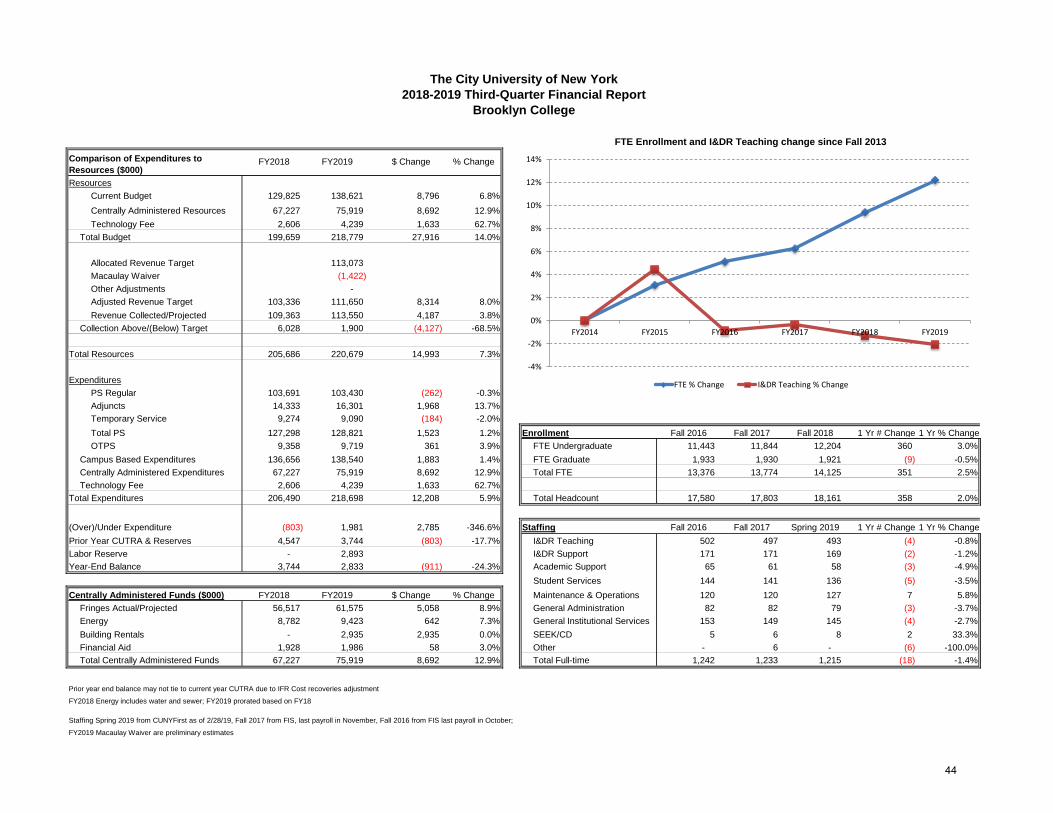
Resources
Current Budget 129,825 138,621 8,796 6.8%
Centrally Administered Resources 67,227 75,919 8,692 12.9% FY2019Technology Fee 2,606 4,239 1,633 62.7% FY2014 FY2015 FY2016 FY
Total Budget 199,659 218,779 27,916 14.0% FTE % Change
FTE % Change 0.0% 3.1% 5.1% # 9.4% 12.2%
Allocated Revenue Target 113,073 I&DR Teaching % Change 0.0% 4.4% -0.9% # -1.3% -2.1%
Macaulay Waiver (1,422)
Other Adjustments -
Adjusted Revenue Target 103,336 111,650 8,314 8.0%
Revenue Collected/Projected 109,363 113,550 4,187 3.8%
Collection Above/(Below) Target 6,028 1,900 (4,127) -68.5%
Total Resources 205,686 220,679 14,993 7.3%
Expenditures
PS Regular 103,691 103,430 (262) -0.3%
Adjuncts 14,333 16,301 1,968 13.7%
Temporary Service 9,274 9,090 (184) -2.0% Fall 2017
Total PS 127,298 128,821 1,523 1.2% Enrollment Fall 2016 Fall 2017 Fall 2018 1 Yr # Change 1 Yr % Change
OTPS 9,358 9,719 361 3.9% FTE Undergraduate 11,443 11,844 12,204 360 3.0%
Campus Based Expenditures 136,656 138,540 1,883 1.4% FTE Graduate 1,933 1,930 1,921 (9) -0.5%
Centrally Administered Expenditures 67,227 75,919 8,692 12.9% Total FTE 13,376 13,774 14,125 351 2.5%
Technology Fee 2,606 4,239 1,633 62.7%
Total Expenditures 206,490 218,698 12,208 5.9% Total Headcount 17,580 17,803 18,161 358 2.0%
(Over)/Under Expenditure (803) 1,981 2,785 -346.6% Staffing Fall 2016 Fall 2017 Spring 2019 1 Yr # Change 1 Yr % Change
Prior Year CUTRA & Reserves 4,547 3,744 (803) -17.7% I&DR Teaching 502 497 493 (4) -0.8%
Labor Reserve - 2,893 I&DR Support 171 171 169 (2) -1.2%
Year-End Balance 3,744 2,833 (911) -24.3% Academic Support 65 61 58 (3) -4.9%
Student Services 144 141 136 (5) -3.5%
Centrally Administered Funds ($000) FY2018 FY2019 $ Change % Change Maintenance & Operations 120 120 127 7 5.8%
Fringes Actual/Projected 56,517 61,575 5,058 8.9% General Administration 82 82 79 (3) -3.7%
Energy 8,782 9,423 642 7.3% General Institutional Services 153 149 145 (4) -2.7%
Building Rentals - 2,935 2,935 0.0% SEEK/CD 5 6 8 2 33.3%
Financial Aid 1,928 1,986 58 3.0% Other - 6 - (6) -100.0%
Total Centrally Administered Funds 67,227 75,919 8,692 12.9% Total Full-time 1,242 1,233 1,215 (18) -1.4%
Prior year end balance may not tie to current year CUTRA due to IFR Cost recoveries adjustment
FY2018 Energy includes water and sewer; FY2019 prorated based on FY18
Staffing Spring 2019 from CUNYFirst as of 2/28/19, Fall 2017 from FIS, last payroll in November, Fall 2016 from FIS last payroll in October;
FY2019 Macaulay Waiver are preliminary estimates
FY2018 FY2019
The City University of New York
2018-2019 Third-Quarter Financial Report
Brooklyn College
Comparison of Expenditures to
Resources ($000)FY2018 FY2019 $ Change % Change
FTE Enrollment and I&DR Teaching change since Fall 2013
-4%
-2%
0%
2%
4%
6%
8%
10%
12%
14%
FY2014 FY2015 FY2016 FY2017 FY2018 FY2019
FTE % Change I&DR Teaching % Change
44
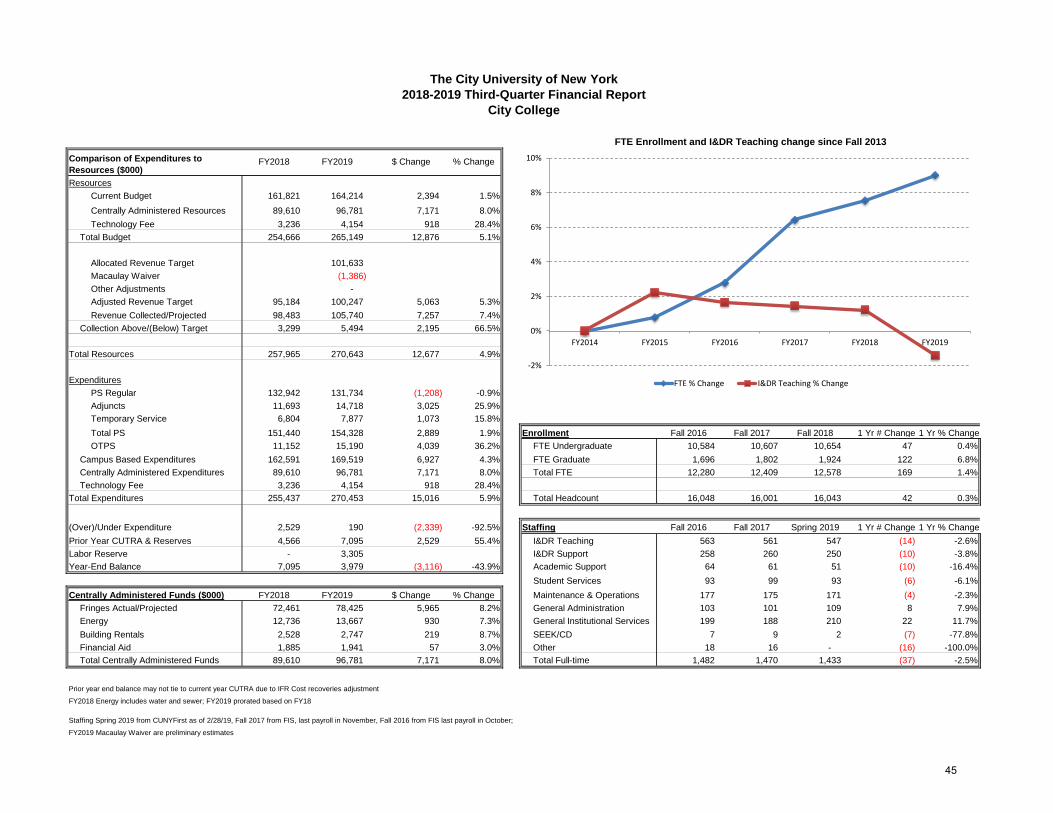
Resources
Current Budget 161,821 164,214 2,394 1.5%
Centrally Administered Resources 89,610 96,781 7,171 8.0% FY2019Technology Fee 3,236 4,154 918 28.4% FY2014 FY2015 FY2016 FY
Total Budget 254,666 265,149 12,876 5.1% FTE % Change
FTE % Change 0.0% 0.8% 2.8% # 7.5% 9.0%
Allocated Revenue Target 101,633 I&DR Teaching % Change 0.0% 2.2% 1.7% # 1.2% -1.4%
Macaulay Waiver (1,386)
Other Adjustments -
Adjusted Revenue Target 95,184 100,247 5,063 5.3%
Revenue Collected/Projected 98,483 105,740 7,257 7.4%
Collection Above/(Below) Target 3,299 5,494 2,195 66.5%
Total Resources 257,965 270,643 12,677 4.9%
Expenditures
PS Regular 132,942 131,734 (1,208) -0.9%
Adjuncts 11,693 14,718 3,025 25.9%
Temporary Service 6,804 7,877 1,073 15.8% Fall 2017
Total PS 151,440 154,328 2,889 1.9% Enrollment Fall 2016 Fall 2017 Fall 2018 1 Yr # Change 1 Yr % Change
OTPS 11,152 15,190 4,039 36.2% FTE Undergraduate 10,584 10,607 10,654 47 0.4%
Campus Based Expenditures 162,591 169,519 6,927 4.3% FTE Graduate 1,696 1,802 1,924 122 6.8%
Centrally Administered Expenditures 89,610 96,781 7,171 8.0% Total FTE 12,280 12,409 12,578 169 1.4%
Technology Fee 3,236 4,154 918 28.4%
Total Expenditures 255,437 270,453 15,016 5.9% Total Headcount 16,048 16,001 16,043 42 0.3%
(Over)/Under Expenditure 2,529 190 (2,339) -92.5% Staffing Fall 2016 Fall 2017 Spring 2019 1 Yr # Change 1 Yr % Change
Prior Year CUTRA & Reserves 4,566 7,095 2,529 55.4% I&DR Teaching 563 561 547 (14) -2.6%
Labor Reserve - 3,305 I&DR Support 258 260 250 (10) -3.8%
Year-End Balance 7,095 3,979 (3,116) -43.9% Academic Support 64 61 51 (10) -16.4%
Student Services 93 99 93 (6) -6.1%
Centrally Administered Funds ($000) FY2018 FY2019 $ Change % Change Maintenance & Operations 177 175 171 (4) -2.3%
Fringes Actual/Projected 72,461 78,425 5,965 8.2% General Administration 103 101 109 8 7.9%
Energy 12,736 13,667 930 7.3% General Institutional Services 199 188 210 22 11.7%
Building Rentals 2,528 2,747 219 8.7% SEEK/CD 7 9 2 (7) -77.8%
Financial Aid 1,885 1,941 57 3.0% Other 18 16 - (16) -100.0%
Total Centrally Administered Funds 89,610 96,781 7,171 8.0% Total Full-time 1,482 1,470 1,433 (37) -2.5%
Prior year end balance may not tie to current year CUTRA due to IFR Cost recoveries adjustment
FY2018 Energy includes water and sewer; FY2019 prorated based on FY18
Staffing Spring 2019 from CUNYFirst as of 2/28/19, Fall 2017 from FIS, last payroll in November, Fall 2016 from FIS last payroll in October;
FY2019 Macaulay Waiver are preliminary estimates
FY2018 FY2019
The City University of New York
2018-2019 Third-Quarter Financial Report
City College
Comparison of Expenditures to
Resources ($000)FY2018 FY2019 $ Change % Change
FTE Enrollment and I&DR Teaching change since Fall 2013
-2%
0%
2%
4%
6%
8%
10%
FY2014 FY2015 FY2016 FY2017 FY2018 FY2019
FTE % Change I&DR Teaching % Change
45
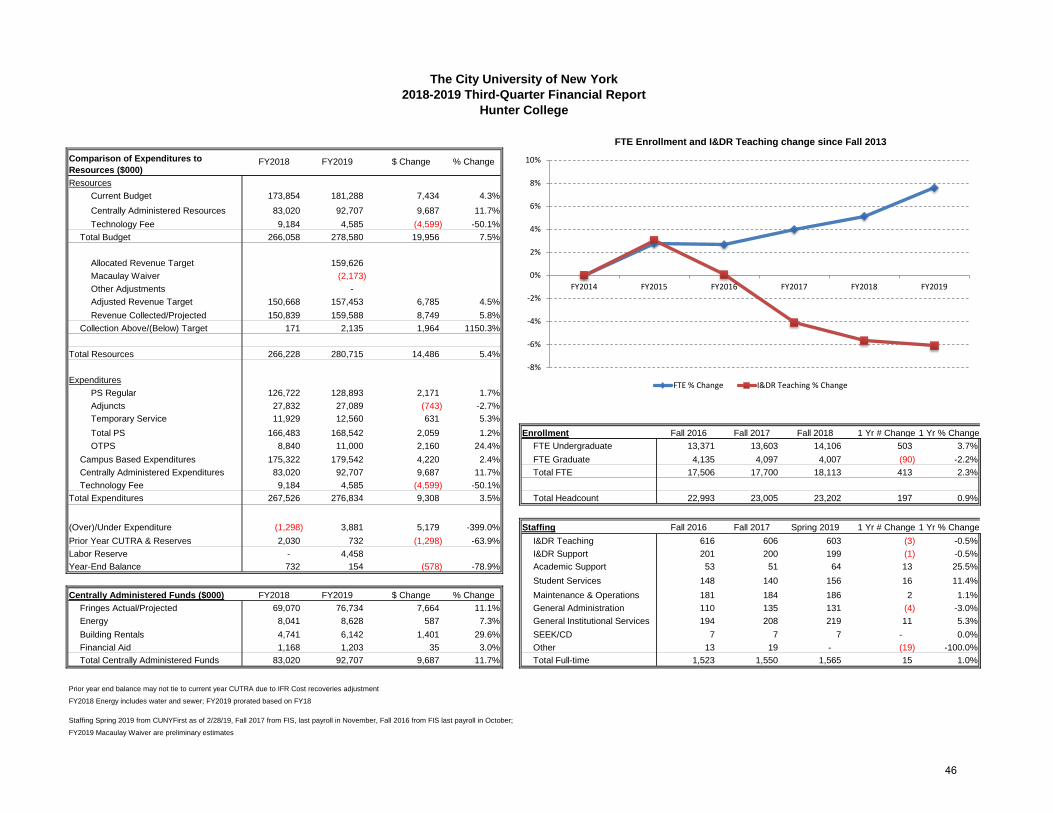
Resources
Current Budget 173,854 181,288 7,434 4.3%
Centrally Administered Resources 83,020 92,707 9,687 11.7% FY2019Technology Fee 9,184 4,585 (4,599) -50.1% FY2014 FY2015 FY2016 FY
Total Budget 266,058 278,580 19,956 7.5% FTE % Change
FTE % Change 0.0% 2.8% 2.7% # 5.1% 7.6%
Allocated Revenue Target 159,626 I&DR Teaching % Change 0.0% 3.0% 0.0% # -5.7% -6.1%
Macaulay Waiver (2,173)
Other Adjustments -
Adjusted Revenue Target 150,668 157,453 6,785 4.5%
Revenue Collected/Projected 150,839 159,588 8,749 5.8%
Collection Above/(Below) Target 171 2,135 1,964 1150.3%
Total Resources 266,228 280,715 14,486 5.4%
Expenditures
PS Regular 126,722 128,893 2,171 1.7%
Adjuncts 27,832 27,089 (743) -2.7%
Temporary Service 11,929 12,560 631 5.3% Fall 2017
Total PS 166,483 168,542 2,059 1.2% Enrollment Fall 2016 Fall 2017 Fall 2018 1 Yr # Change 1 Yr % Change
OTPS 8,840 11,000 2,160 24.4% FTE Undergraduate 13,371 13,603 14,106 503 3.7%
Campus Based Expenditures 175,322 179,542 4,220 2.4% FTE Graduate 4,135 4,097 4,007 (90) -2.2%
Centrally Administered Expenditures 83,020 92,707 9,687 11.7% Total FTE 17,506 17,700 18,113 413 2.3%
Technology Fee 9,184 4,585 (4,599) -50.1%
Total Expenditures 267,526 276,834 9,308 3.5% Total Headcount 22,993 23,005 23,202 197 0.9%
(Over)/Under Expenditure (1,298) 3,881 5,179 -399.0% Staffing Fall 2016 Fall 2017 Spring 2019 1 Yr # Change 1 Yr % Change
Prior Year CUTRA & Reserves 2,030 732 (1,298) -63.9% I&DR Teaching 616 606 603 (3) -0.5%
Labor Reserve - 4,458 I&DR Support 201 200 199 (1) -0.5%
Year-End Balance 732 154 (578) -78.9% Academic Support 53 51 64 13 25.5%
Student Services 148 140 156 16 11.4%
Centrally Administered Funds ($000) FY2018 FY2019 $ Change % Change Maintenance & Operations 181 184 186 2 1.1%
Fringes Actual/Projected 69,070 76,734 7,664 11.1% General Administration 110 135 131 (4) -3.0%
Energy 8,041 8,628 587 7.3% General Institutional Services 194 208 219 11 5.3%
Building Rentals 4,741 6,142 1,401 29.6% SEEK/CD 7 7 7 - 0.0%
Financial Aid 1,168 1,203 35 3.0% Other 13 19 - (19) -100.0%
Total Centrally Administered Funds 83,020 92,707 9,687 11.7% Total Full-time 1,523 1,550 1,565 15 1.0%
Prior year end balance may not tie to current year CUTRA due to IFR Cost recoveries adjustment
FY2018 Energy includes water and sewer; FY2019 prorated based on FY18
Staffing Spring 2019 from CUNYFirst as of 2/28/19, Fall 2017 from FIS, last payroll in November, Fall 2016 from FIS last payroll in October;
FY2019 Macaulay Waiver are preliminary estimates
FY2018 FY2019
The City University of New York
2018-2019 Third-Quarter Financial Report
Hunter College
Comparison of Expenditures to
Resources ($000)FY2018 FY2019 $ Change % Change
FTE Enrollment and I&DR Teaching change since Fall 2013
-8%
-6%
-4%
-2%
0%
2%
4%
6%
8%
10%
FY2014 FY2015 FY2016 FY2017 FY2018 FY2019
FTE % Change I&DR Teaching % Change
46

Resources
Current Budget 108,140 115,477 7,337 6.8%
Centrally Administered Resources 60,903 66,879 5,976 9.8% FY2019Technology Fee 2,587 3,824 1,237 47.8% FY2014 FY2015 FY2016 FY
Total Budget 171,630 186,180 21,887 12.8% FTE % Change
FTE % Change 0.0% -1.7% -2.0% # -1.2% 3.9%
Allocated Revenue Target 92,555 I&DR Teaching % Change 0.0% 0.2% 0.6% # 0.8% 2.1%
Macaulay Waiver (289)
Other Adjustments -
Adjusted Revenue Target 88,423 92,266 3,842 4.3%
Revenue Collected/Projected 90,521 95,789 5,268 5.8%
Collection Above/(Below) Target 2,098 3,523 1,426 68.0%
Total Resources 173,728 189,703 15,975 9.2%
Expenditures
PS Regular 83,357 85,160 1,803 2.2%
Adjuncts 15,494 17,818 2,324 15.0%
Temporary Service 5,372 6,057 685 12.7% Fall 2017
Total PS 104,224 109,035 4,811 4.6% Enrollment Fall 2016 Fall 2017 Fall 2018 1 Yr # Change 1 Yr % Change
OTPS 6,656 8,254 1,598 24.0% FTE Undergraduate 10,180 10,528 11,044 516 4.9%
Campus Based Expenditures 110,880 117,289 6,409 5.8% FTE Graduate 1,062 1,161 1,252 91 7.8%
Centrally Administered Expenditures 60,903 66,879 5,976 9.8% Total FTE 11,242 11,689 12,296 607 5.2%
Technology Fee 2,587 3,824 1,237 47.8%
Total Expenditures 174,370 187,992 13,622 7.8% Total Headcount 14,430 14,834 15,394 560 3.8%
(Over)/Under Expenditure (643) 1,711 2,353 -366.2% Staffing Fall 2016 Fall 2017 Spring 2019 1 Yr # Change 1 Yr % Change
Prior Year CUTRA & Reserves 1,576 933 (643) -40.8% I&DR Teaching 361 376 381 5 1.2%
Labor Reserve - 2,497 I&DR Support 141 153 144 (9) -5.9%
Year-End Balance 933 147 (786) -84.2% Academic Support 22 23 44 21 91.3%
Student Services 122 126 134 8 6.3%
Centrally Administered Funds ($000) FY2018 FY2019 $ Change % Change Maintenance & Operations 85 90 89 (1) -1.1%
Fringes Actual/Projected 45,434 50,699 5,264 11.6% General Administration 84 88 92 4 4.5%
Energy 5,782 6,204 422 7.3% General Institutional Services 113 117 127 10 8.5%
Building Rentals 7,748 7,978 231 3.0% SEEK/CD 9 10 10 - 0.0%
Financial Aid 1,940 1,998 58 3.0% Other - 2 - (2) -100.0%
Total Centrally Administered Funds 60,903 66,879 5,976 9.8% Total Full-time 937 985 1,021 36 3.6%
Prior year end balance may not tie to current year CUTRA due to IFR Cost recoveries adjustment
FY2018 Energy includes water and sewer; FY2019 prorated based on FY18
Staffing Spring 2019 from CUNYFirst as of 2/28/19, Fall 2017 from FIS, last payroll in November, Fall 2016 from FIS last payroll in October;
FY2019 Macaulay Waiver are preliminary estimates
FY2018 FY2019
The City University of New York
2018-2019 Third-Quarter Financial Report
John Jay College
Comparison of Expenditures to
Resources ($000)FY2018 FY2019 $ Change % Change
FTE Enrollment and I&DR Teaching change since Fall 2013
-6%
-5%
-4%
-3%
-2%
-1%
0%
1%
2%
3%
4%
5%
FY2014 FY2015 FY2016 FY2017 FY2018 FY2019
FTE % Change I&DR Teaching % Change
47

Resources
Current Budget 97,204 102,905 5,701 5.9%
Centrally Administered Resources 50,077 55,370 5,293 10.6% FY2019Technology Fee 2,360 3,718 1,357 57.5% FY2014 FY2015 FY2016 FY
Total Budget 149,641 161,993 18,053 12.1% FTE % Change
FTE % Change 0.0% 2.2% 6.1% # 18.9% 26.8%
Allocated Revenue Target 77,346 I&DR Teaching % Change 0.0% 1.2% -0.2% # -0.5% 2.9%
Macaulay Waiver (264)
Other Adjustments -
Adjusted Revenue Target 70,688 77,082 6,394 9.0%
Revenue Collected/Projected 77,068 81,694 4,626 6.0%
Collection Above/(Below) Target 6,379 4,612 (1,768) -27.7%
Total Resources 156,020 166,604 10,584 6.8%
Expenditures
PS Regular 77,296 78,947 1,651 2.1%
Adjuncts 14,624 15,785 1,161 7.9%
Temporary Service 4,032 4,731 699 17.3% Fall 2017
Total PS 95,952 99,463 3,511 3.7% Enrollment Fall 2016 Fall 2017 Fall 2018 1 Yr # Change 1 Yr % Change
OTPS 6,314 7,701 1,387 22.0% FTE Undergraduate 7,908 8,505 9,156 651 7.7%
Campus Based Expenditures 102,266 107,164 4,898 4.8% FTE Graduate 1,171 1,249 1,244 (5) -0.4%
Centrally Administered Expenditures 50,077 55,370 5,293 10.6% Total FTE 9,079 9,754 10,400 646 6.6%
Technology Fee 2,360 3,718 1,357 57.5%
Total Expenditures 154,703 166,252 11,549 7.5% Total Headcount 13,329 14,130 14,787 657 4.6%
(Over)/Under Expenditure 1,317 352 (964) -73.2% Staffing Fall 2016 Fall 2017 Spring 2019 1 Yr # Change 1 Yr % Change
Prior Year CUTRA & Reserves 6,129 7,445 1,317 21.5% I&DR Teaching 349 348 360 12 3.5%
Labor Reserve - 2,114 I&DR Support 151 151 168 17 11.3%
Year-End Balance 7,445 5,684 (1,762) -23.7% Academic Support 51 49 51 2 4.1%
Student Services 92 94 99 5 5.3%
Centrally Administered Funds ($000) FY2018 FY2019 $ Change % Change Maintenance & Operations 116 119 115 (4) -3.4%
Fringes Actual/Projected 42,130 47,000 4,869 11.6% General Administration 59 57 55 (2) -3.5%
Energy 5,257 5,641 384 7.3% General Institutional Services 105 112 99 (13) -11.6%
Building Rentals 891 877 (14) -1.6% SEEK/CD 9 9 10 1 11.1%
Financial Aid 1,799 1,852 54 3.0% Other - - - - 0.0%
Total Centrally Administered Funds 50,077 55,370 5,293 10.6% Total Full-time 932 939 957 18 1.9%
Prior year end balance may not tie to current year CUTRA due to IFR Cost recoveries adjustment
FY2018 Energy includes water and sewer; FY2019 prorated based on FY18
Staffing Spring 2019 from CUNYFirst as of 2/28/19, Fall 2017 from FIS, last payroll in November, Fall 2016 from FIS last payroll in October;
FY2019 Macaulay Waiver are preliminary estimates
FY2018 FY2019
The City University of New York
2018-2019 Third-Quarter Financial Report
Lehman College
Comparison of Expenditures to
Resources ($000)FY2018 FY2019 $ Change % Change
FTE Enrollment and I&DR Teaching change since Fall 2013
-5%
0%
5%
10%
15%
20%
25%
30%
FY2014 FY2015 FY2016 FY2017 FY2018 FY2019
FTE % Change I&DR Teaching % Change
48
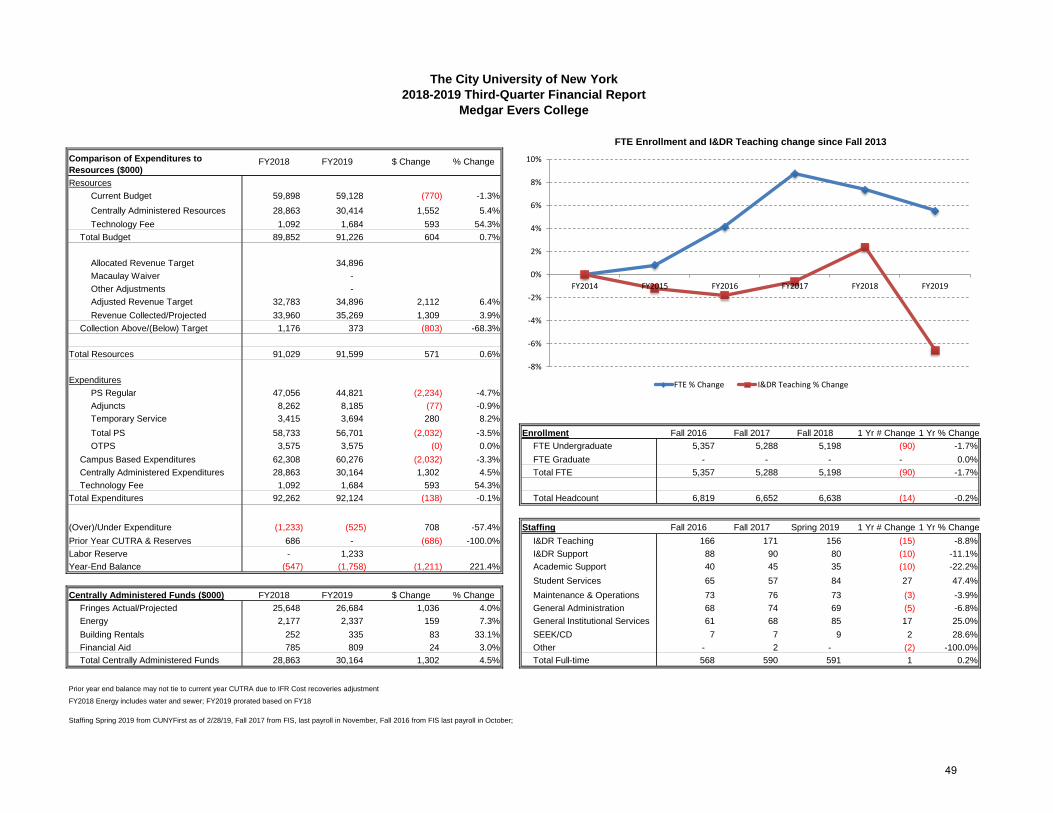
Resources
Current Budget 59,898 59,128 (770) -1.3%
Centrally Administered Resources 28,863 30,414 1,552 5.4% FY2019Technology Fee 1,092 1,684 593 54.3% FY2014 FY2015 FY2016 FY
Total Budget 89,852 91,226 604 0.7% FTE % Change
FTE % Change 0.0% 0.8% 4.1% # 7.3% 5.5%
Allocated Revenue Target 34,896 I&DR Teaching % Change 0.0% -1.2% -1.8% # 2.4% -6.6%
Macaulay Waiver -
Other Adjustments -
Adjusted Revenue Target 32,783 34,896 2,112 6.4%
Revenue Collected/Projected 33,960 35,269 1,309 3.9%
Collection Above/(Below) Target 1,176 373 (803) -68.3%
Total Resources 91,029 91,599 571 0.6%
Expenditures
PS Regular 47,056 44,821 (2,234) -4.7%
Adjuncts 8,262 8,185 (77) -0.9%
Temporary Service 3,415 3,694 280 8.2% Fall 2017
Total PS 58,733 56,701 (2,032) -3.5% Enrollment Fall 2016 Fall 2017 Fall 2018 1 Yr # Change 1 Yr % Change
OTPS 3,575 3,575 (0) 0.0% FTE Undergraduate 5,357 5,288 5,198 (90) -1.7%
Campus Based Expenditures 62,308 60,276 (2,032) -3.3% FTE Graduate - - - - 0.0%
Centrally Administered Expenditures 28,863 30,164 1,302 4.5% Total FTE 5,357 5,288 5,198 (90) -1.7%
Technology Fee 1,092 1,684 593 54.3%
Total Expenditures 92,262 92,124 (138) -0.1% Total Headcount 6,819 6,652 6,638 (14) -0.2%
(Over)/Under Expenditure (1,233) (525) 708 -57.4% Staffing Fall 2016 Fall 2017 Spring 2019 1 Yr # Change 1 Yr % Change
Prior Year CUTRA & Reserves 686 - (686) -100.0% I&DR Teaching 166 171 156 (15) -8.8%
Labor Reserve - 1,233 I&DR Support 88 90 80 (10) -11.1%
Year-End Balance (547) (1,758) (1,211) 221.4% Academic Support 40 45 35 (10) -22.2%
Student Services 65 57 84 27 47.4%
Centrally Administered Funds ($000) FY2018 FY2019 $ Change % Change Maintenance & Operations 73 76 73 (3) -3.9%
Fringes Actual/Projected 25,648 26,684 1,036 4.0% General Administration 68 74 69 (5) -6.8%
Energy 2,177 2,337 159 7.3% General Institutional Services 61 68 85 17 25.0%
Building Rentals 252 335 83 33.1% SEEK/CD 7 7 9 2 28.6%
Financial Aid 785 809 24 3.0% Other - 2 - (2) -100.0%
Total Centrally Administered Funds 28,863 30,164 1,302 4.5% Total Full-time 568 590 591 1 0.2%
Prior year end balance may not tie to current year CUTRA due to IFR Cost recoveries adjustment
FY2018 Energy includes water and sewer; FY2019 prorated based on FY18
Staffing Spring 2019 from CUNYFirst as of 2/28/19, Fall 2017 from FIS, last payroll in November, Fall 2016 from FIS last payroll in October;
FY2018 FY2019
The City University of New York
2018-2019 Third-Quarter Financial Report
Medgar Evers College
Comparison of Expenditures to
Resources ($000)FY2018 FY2019 $ Change % Change
FTE Enrollment and I&DR Teaching change since Fall 2013
-8%
-6%
-4%
-2%
0%
2%
4%
6%
8%
10%
FY2014 FY2015 FY2016 FY2017 FY2018 FY2019
FTE % Change I&DR Teaching % Change
49
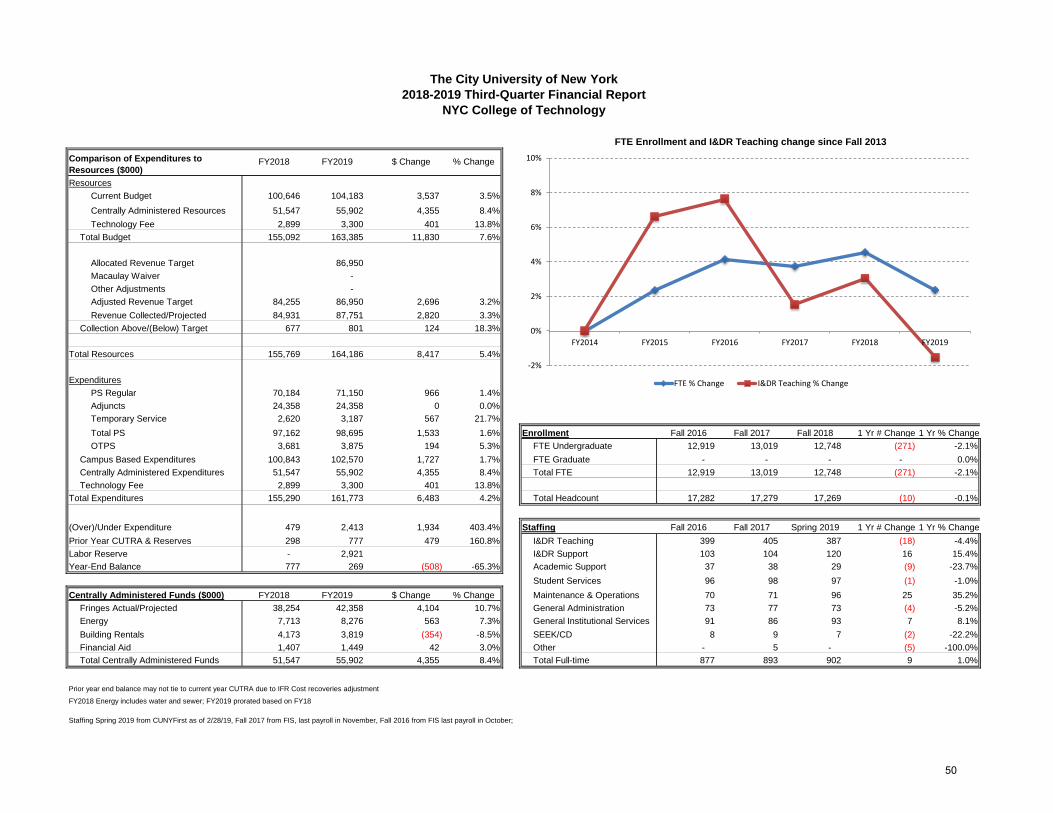
Resources
Current Budget 100,646 104,183 3,537 3.5%
Centrally Administered Resources 51,547 55,902 4,355 8.4% FY2019Technology Fee 2,899 3,300 401 13.8% FY2014 FY2015 FY2016 FY
Total Budget 155,092 163,385 11,830 7.6% FTE % Change
FTE % Change 0.0% 2.4% 4.1% # 4.5% 2.4%
Allocated Revenue Target 86,950 I&DR Teaching % Change 0.0% 6.6% 7.6% # 3.1% -1.5%
Macaulay Waiver -
Other Adjustments -
Adjusted Revenue Target 84,255 86,950 2,696 3.2%
Revenue Collected/Projected 84,931 87,751 2,820 3.3%
Collection Above/(Below) Target 677 801 124 18.3%
Total Resources 155,769 164,186 8,417 5.4%
Expenditures
PS Regular 70,184 71,150 966 1.4%
Adjuncts 24,358 24,358 0 0.0%
Temporary Service 2,620 3,187 567 21.7% Fall 2017
Total PS 97,162 98,695 1,533 1.6% Enrollment Fall 2016 Fall 2017 Fall 2018 1 Yr # Change 1 Yr % Change
OTPS 3,681 3,875 194 5.3% FTE Undergraduate 12,919 13,019 12,748 (271) -2.1%
Campus Based Expenditures 100,843 102,570 1,727 1.7% FTE Graduate - - - - 0.0%
Centrally Administered Expenditures 51,547 55,902 4,355 8.4% Total FTE 12,919 13,019 12,748 (271) -2.1%
Technology Fee 2,899 3,300 401 13.8%
Total Expenditures 155,290 161,773 6,483 4.2% Total Headcount 17,282 17,279 17,269 (10) -0.1%
(Over)/Under Expenditure 479 2,413 1,934 403.4% Staffing Fall 2016 Fall 2017 Spring 2019 1 Yr # Change 1 Yr % Change
Prior Year CUTRA & Reserves 298 777 479 160.8% I&DR Teaching 399 405 387 (18) -4.4%
Labor Reserve - 2,921 I&DR Support 103 104 120 16 15.4%
Year-End Balance 777 269 (508) -65.3% Academic Support 37 38 29 (9) -23.7%
Student Services 96 98 97 (1) -1.0%
Centrally Administered Funds ($000) FY2018 FY2019 $ Change % Change Maintenance & Operations 70 71 96 25 35.2%
Fringes Actual/Projected 38,254 42,358 4,104 10.7% General Administration 73 77 73 (4) -5.2%
Energy 7,713 8,276 563 7.3% General Institutional Services 91 86 93 7 8.1%
Building Rentals 4,173 3,819 (354) -8.5% SEEK/CD 8 9 7 (2) -22.2%
Financial Aid 1,407 1,449 42 3.0% Other - 5 - (5) -100.0%
Total Centrally Administered Funds 51,547 55,902 4,355 8.4% Total Full-time 877 893 902 9 1.0%
Prior year end balance may not tie to current year CUTRA due to IFR Cost recoveries adjustment
FY2018 Energy includes water and sewer; FY2019 prorated based on FY18
Staffing Spring 2019 from CUNYFirst as of 2/28/19, Fall 2017 from FIS, last payroll in November, Fall 2016 from FIS last payroll in October;
FY2018 FY2019
The City University of New York
2018-2019 Third-Quarter Financial Report
NYC College of Technology
Comparison of Expenditures to
Resources ($000)FY2018 FY2019 $ Change % Change
FTE Enrollment and I&DR Teaching change since Fall 2013
-2%
0%
2%
4%
6%
8%
10%
FY2014 FY2015 FY2016 FY2017 FY2018 FY2019
FTE % Change I&DR Teaching % Change
50

Resources
Current Budget 133,604 136,829 3,225 2.4%
Centrally Administered Resources 70,512 77,276 6,764 9.6% FY2019Technology Fee 3,597 5,840 2,243 62.3% FY2014 FY2015 FY2016 FY
Total Budget 207,713 219,945 15,456 7.4% FTE % Change
FTE % Change 0.0% 3.3% 4.7% # 7.7% 8.6%
Allocated Revenue Target 120,273 I&DR Teaching % Change 0.0% 1.1% 2.1% # 0.0% 2.2%
Macaulay Waiver (1,360)
Other Adjustments -
Adjusted Revenue Target 114,956 118,913 3,956 3.4%
Revenue Collected/Projected 117,154 120,413 3,259 2.8%
Collection Above/(Below) Target 2,197 1,500 (697) -31.7%
Total Resources 209,911 221,445 11,534 5.5%
Expenditures
PS Regular 103,676 104,989 1,313 1.3%
Adjuncts 17,522 18,078 556 3.2%
Temporary Service 7,523 8,144 621 8.3% Fall 2017
Total PS 128,722 131,211 2,489 1.9% Enrollment Fall 2016 Fall 2017 Fall 2018 1 Yr # Change 1 Yr % Change
OTPS 8,488 8,684 196 2.3% FTE Undergraduate 13,211 13,451 13,615 164 1.2%
Campus Based Expenditures 137,210 139,895 2,685 2.0% FTE Graduate 1,910 1,858 1,809 (49) -2.6%
Centrally Administered Expenditures 70,512 77,276 6,764 9.6% Total FTE 15,121 15,309 15,424 115 0.8%
Technology Fee 3,597 5,840 2,243 62.3%
Total Expenditures 211,319 223,011 11,692 5.5% Total Headcount 19,632 19,866 19,746 (120) -0.6%
(Over)/Under Expenditure (1,408) (1,566) (158) 11.2% Staffing Fall 2016 Fall 2017 Spring 2019 1 Yr # Change 1 Yr % Change
Prior Year CUTRA & Reserves 6,141 4,733 (1,408) -22.9% I&DR Teaching 562 547 559 12 2.2%
Labor Reserve - 3,121 I&DR Support 143 141 143 2 1.4%
Year-End Balance 4,733 47 (4,686) -99.0% Academic Support 70 65 62 (3) -4.6%
Student Services 113 116 112 (4) -3.4%
Centrally Administered Funds ($000) FY2018 FY2019 $ Change % Change Maintenance & Operations 148 141 139 (2) -1.4%
Fringes Actual/Projected 56,509 62,503 5,994 10.6% General Administration 74 73 78 5 6.8%
Energy 7,284 7,816 532 7.3% General Institutional Services 118 109 121 12 11.0%
Building Rentals 4,930 5,114 184 3.7% SEEK/CD 6 7 10 3 42.9%
Financial Aid 1,789 1,843 54 3.0% Other - - - - 0.0%
Total Centrally Administered Funds 70,512 77,276 6,764 9.6% Total Full-time 1,234 1,199 1,224 25 2.1%
Prior year end balance may not tie to current year CUTRA due to IFR Cost recoveries adjustment
FY2018 Energy includes water and sewer; FY2019 prorated based on FY18
Staffing Spring 2019 from CUNYFirst as of 2/28/19, Fall 2017 from FIS, last payroll in November, Fall 2016 from FIS last payroll in October;
FY2019 Macaulay Waiver are preliminary estimates
FY2018 FY2019
The City University of New York
2018-2019 Third-Quarter Financial Report
Queens College
Comparison of Expenditures to
Resources ($000)FY2018 FY2019 $ Change % Change
FTE Enrollment and I&DR Teaching change since Fall 2013
-1%
0%
1%
2%
3%
4%
5%
6%
7%
8%
9%
FY2014 FY2015 FY2016 FY2017 FY2018 FY2019
FTE % Change I&DR Teaching % Change
51
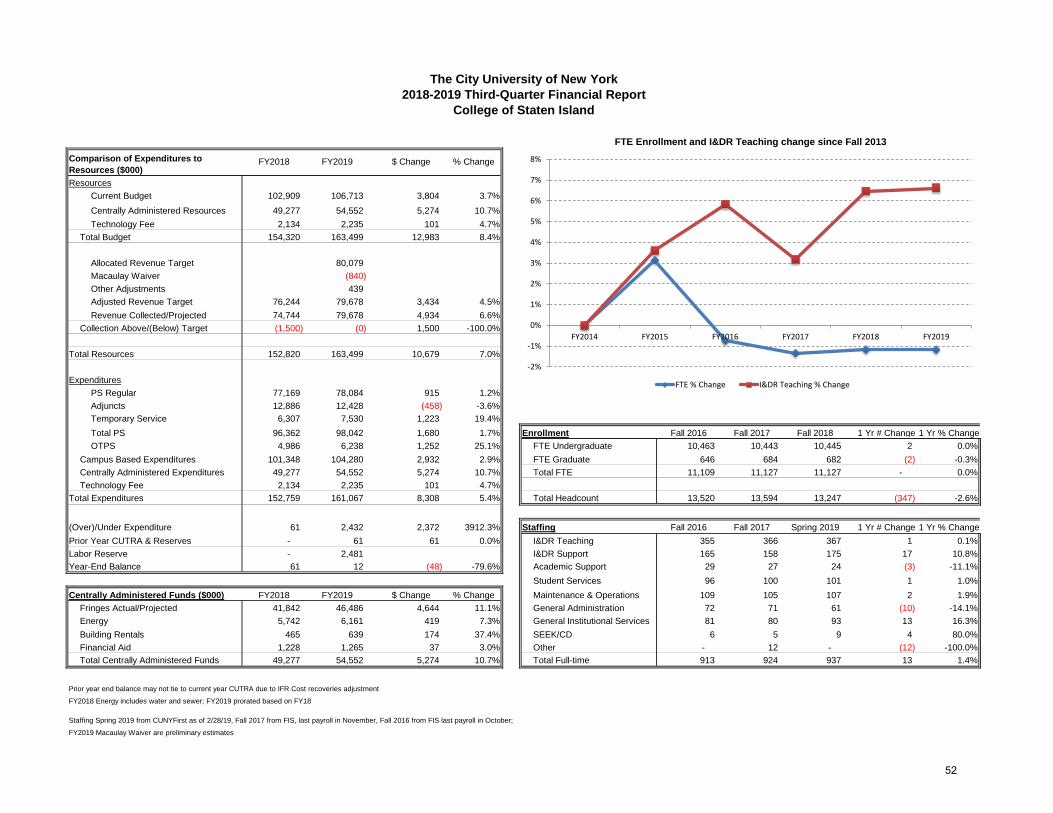
Resources
Current Budget 102,909 106,713 3,804 3.7%
Centrally Administered Resources 49,277 54,552 5,274 10.7% FY2019Technology Fee 2,134 2,235 101 4.7% FY2014 FY2015 FY2016 FY
Total Budget 154,320 163,499 12,983 8.4% FTE % Change
FTE % Change 0.0% 3.1% -0.7% # -1.2% -1.2%
Allocated Revenue Target 80,079 I&DR Teaching % Change 0.0% 3.6% 5.8% # 6.5% 6.6%
Macaulay Waiver (840)
Other Adjustments 439
Adjusted Revenue Target 76,244 79,678 3,434 4.5%
Revenue Collected/Projected 74,744 79,678 4,934 6.6%
Collection Above/(Below) Target (1,500) (0) 1,500 -100.0%
Total Resources 152,820 163,499 10,679 7.0%
Expenditures
PS Regular 77,169 78,084 915 1.2%
Adjuncts 12,886 12,428 (458) -3.6%
Temporary Service 6,307 7,530 1,223 19.4% Fall 2017
Total PS 96,362 98,042 1,680 1.7% Enrollment Fall 2016 Fall 2017 Fall 2018 1 Yr # Change 1 Yr % Change
OTPS 4,986 6,238 1,252 25.1% FTE Undergraduate 10,463 10,443 10,445 2 0.0%
Campus Based Expenditures 101,348 104,280 2,932 2.9% FTE Graduate 646 684 682 (2) -0.3%
Centrally Administered Expenditures 49,277 54,552 5,274 10.7% Total FTE 11,109 11,127 11,127 - 0.0%
Technology Fee 2,134 2,235 101 4.7%
Total Expenditures 152,759 161,067 8,308 5.4% Total Headcount 13,520 13,594 13,247 (347) -2.6%
(Over)/Under Expenditure 61 2,432 2,372 3912.3% Staffing Fall 2016 Fall 2017 Spring 2019 1 Yr # Change 1 Yr % Change
Prior Year CUTRA & Reserves - 61 61 0.0% I&DR Teaching 355 366 367 1 0.1%
Labor Reserve - 2,481 I&DR Support 165 158 175 17 10.8%
Year-End Balance 61 12 (48) -79.6% Academic Support 29 27 24 (3) -11.1%
Student Services 96 100 101 1 1.0%
Centrally Administered Funds ($000) FY2018 FY2019 $ Change % Change Maintenance & Operations 109 105 107 2 1.9%
Fringes Actual/Projected 41,842 46,486 4,644 11.1% General Administration 72 71 61 (10) -14.1%
Energy 5,742 6,161 419 7.3% General Institutional Services 81 80 93 13 16.3%
Building Rentals 465 639 174 37.4% SEEK/CD 6 5 9 4 80.0%
Financial Aid 1,228 1,265 37 3.0% Other - 12 - (12) -100.0%
Total Centrally Administered Funds 49,277 54,552 5,274 10.7% Total Full-time 913 924 937 13 1.4%
Prior year end balance may not tie to current year CUTRA due to IFR Cost recoveries adjustment
FY2018 Energy includes water and sewer; FY2019 prorated based on FY18
Staffing Spring 2019 from CUNYFirst as of 2/28/19, Fall 2017 from FIS, last payroll in November, Fall 2016 from FIS last payroll in October;
FY2019 Macaulay Waiver are preliminary estimates
FY2018 FY2019
The City University of New York
2018-2019 Third-Quarter Financial Report
College of Staten Island
Comparison of Expenditures to
Resources ($000)FY2018 FY2019 $ Change % Change
FTE Enrollment and I&DR Teaching change since Fall 2013
-2%
-1%
0%
1%
2%
3%
4%
5%
6%
7%
8%
FY2014 FY2015 FY2016 FY2017 FY2018 FY2019
FTE % Change I&DR Teaching % Change
52
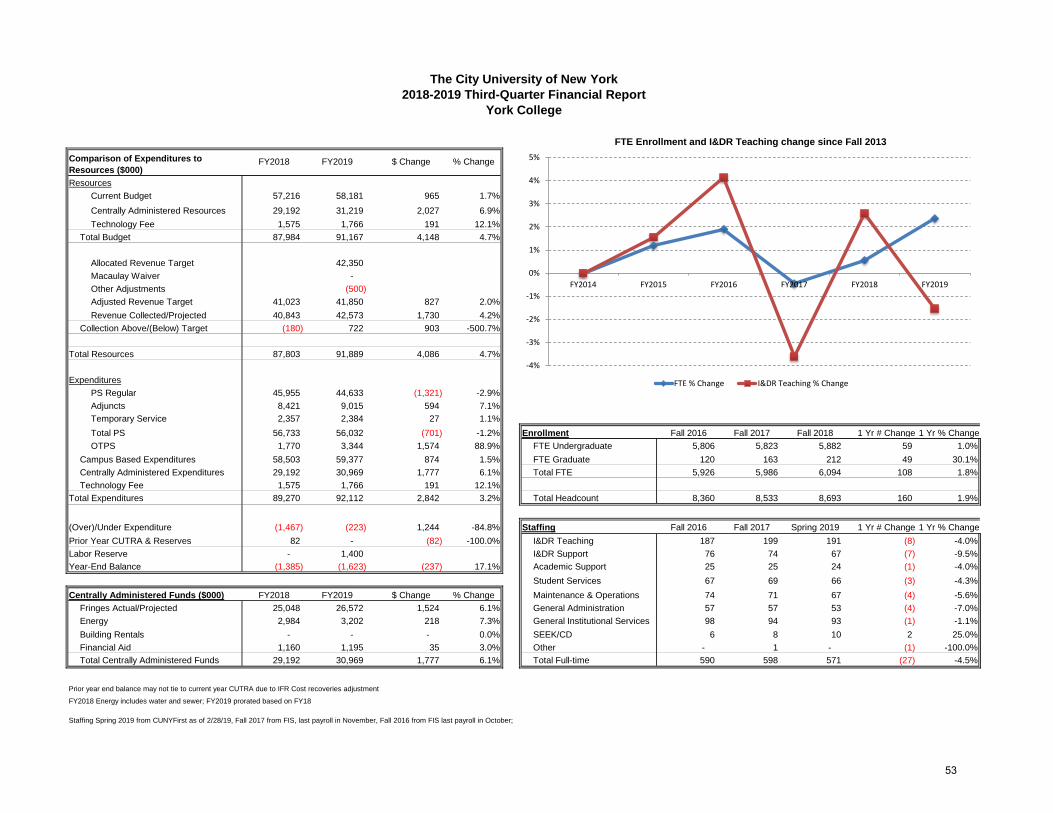
Resources
Current Budget 57,216 58,181 965 1.7%
Centrally Administered Resources 29,192 31,219 2,027 6.9% FY2019Technology Fee 1,575 1,766 191 12.1% FY2014 FY2015 FY2016 FY
Total Budget 87,984 91,167 4,148 4.7% FTE % Change
FTE % Change 0.0% 1.2% 1.9% # 0.6% 2.4%
Allocated Revenue Target 42,350 I&DR Teaching % Change 0.0% 1.5% 4.1% # 2.6% -1.5%
Macaulay Waiver -
Other Adjustments (500)
Adjusted Revenue Target 41,023 41,850 827 2.0%
Revenue Collected/Projected 40,843 42,573 1,730 4.2%
Collection Above/(Below) Target (180) 722 903 -500.7%
Total Resources 87,803 91,889 4,086 4.7%
Expenditures
PS Regular 45,955 44,633 (1,321) -2.9%
Adjuncts 8,421 9,015 594 7.1%
Temporary Service 2,357 2,384 27 1.1% Fall 2017
Total PS 56,733 56,032 (701) -1.2% Enrollment Fall 2016 Fall 2017 Fall 2018 1 Yr # Change 1 Yr % Change
OTPS 1,770 3,344 1,574 88.9% FTE Undergraduate 5,806 5,823 5,882 59 1.0%
Campus Based Expenditures 58,503 59,377 874 1.5% FTE Graduate 120 163 212 49 30.1%
Centrally Administered Expenditures 29,192 30,969 1,777 6.1% Total FTE 5,926 5,986 6,094 108 1.8%
Technology Fee 1,575 1,766 191 12.1%
Total Expenditures 89,270 92,112 2,842 3.2% Total Headcount 8,360 8,533 8,693 160 1.9%
(Over)/Under Expenditure (1,467) (223) 1,244 -84.8% Staffing Fall 2016 Fall 2017 Spring 2019 1 Yr # Change 1 Yr % Change
Prior Year CUTRA & Reserves 82 - (82) -100.0% I&DR Teaching 187 199 191 (8) -4.0%
Labor Reserve - 1,400 I&DR Support 76 74 67 (7) -9.5%
Year-End Balance (1,385) (1,623) (237) 17.1% Academic Support 25 25 24 (1) -4.0%
Student Services 67 69 66 (3) -4.3%
Centrally Administered Funds ($000) FY2018 FY2019 $ Change % Change Maintenance & Operations 74 71 67 (4) -5.6%
Fringes Actual/Projected 25,048 26,572 1,524 6.1% General Administration 57 57 53 (4) -7.0%
Energy 2,984 3,202 218 7.3% General Institutional Services 98 94 93 (1) -1.1%
Building Rentals - - - 0.0% SEEK/CD 6 8 10 2 25.0%
Financial Aid 1,160 1,195 35 3.0% Other - 1 - (1) -100.0%
Total Centrally Administered Funds 29,192 30,969 1,777 6.1% Total Full-time 590 598 571 (27) -4.5%
Prior year end balance may not tie to current year CUTRA due to IFR Cost recoveries adjustment
FY2018 Energy includes water and sewer; FY2019 prorated based on FY18
Staffing Spring 2019 from CUNYFirst as of 2/28/19, Fall 2017 from FIS, last payroll in November, Fall 2016 from FIS last payroll in October;
FY2018 FY2019
The City University of New York
2018-2019 Third-Quarter Financial Report
York College
Comparison of Expenditures to
Resources ($000)FY2018 FY2019 $ Change % Change
FTE Enrollment and I&DR Teaching change since Fall 2013
-4%
-3%
-2%
-1%
0%
1%
2%
3%
4%
5%
FY2014 FY2015 FY2016 FY2017 FY2018 FY2019
FTE % Change I&DR Teaching % Change
53

Resources
Current Budget 131,632 136,692 5,059 3.8%
Centrally Administered Resources 51,884 58,079 6,195 11.9% FY2019Technology Fee 711 890 179 25.2% FY2014 FY2015 FY2016 FY
Total Budget 184,227 195,661 16,492 9.0% FTE % Change
FTE % Change 0.0% -3.8% -7.8% # -17.3% -21.8%
Allocated Revenue Target 1,941 I&DR Teaching % Change 0.0% 1.4% 3.2% # -4.9% -8.4%
Macaulay Waiver -
Other Adjustments -
Adjusted Revenue Target 1,884 1,941 58 3.1%
Revenue Collected/Projected 2,885 3,385 500 17.3%
Collection Above/(Below) Target 1,001 1,444 443 44.2%
Total Resources 185,228 197,104 11,876 6.4%
Expenditures
PS Regular 74,088 78,088 4,000 5.4%
Adjuncts 889 930 41 4.7%
Temporary Service 19,605 19,958 353 1.8% Fall 2018
Total PS 94,581 98,976 4,395 4.6% Enrollment Fall 2016 Fall 2017 Fall 2018 1 Yr # Change 1 Yr % Change
OTPS 36,114 40,837 4,723 13.1% FTE Undergraduate - - - - 0.0%
Campus Based Expenditures 130,695 139,813 9,118 7.0% FTE Graduate 2,981 2,902 2,747 (155) -5.3%
Centrally Administered Expenditures 51,884 58,079 6,195 11.9% Total FTE 2,981 2,902 2,747 (155) -5.3%
Technology Fee 711 890 179 25.2%
Total Expenditures 183,290 198,782 15,492 8.5% Total Headcount 3,864 3,783 3,607 (176) -4.7%
(Over)/Under Expenditure 1,939 (1,678) (3,617) -186.5% Staffing Fall 2016 Fall 2017 Spring 2019 1 Yr # Change 1 Yr % Change
Prior Year CUTRA & Reserves 2,614 4,553 1,939 74.2% I&DR Teaching 312 311 300 (11) -3.7%
Labor Reserve - 2,339 I&DR Support 69 65 138 73 112.3%
Year-End Balance 4,553 536 (4,016) -88.2% Academic Support 66 113 138 25 22.1%
Student Services 38 38 71 33 86.8%
Centrally Administered Funds ($000) FY2018 FY2019 $ Change % Change Maintenance & Operations 4 4 5 1 25.0%
Fringes Actual/Projected 40,382 46,488 6,107 15.1% General Administration 43 45 45 - 0.0%
Energy 2,414 2,591 176 7.3% General Institutional Services 86 90 86 (4) -4.4%
Building Rentals - - - 0.0% SEEK/CD - - - - 0.0%
Financial Aid 9,088 9,000 (88) -1.0% Other 47 53 - (53) -100.0%
Total Centrally Administered Funds 51,884 58,079 6,195 11.9% Total Full-time 665 719 783 64 8.8%
Prior year end balance may not tie to current year CUTRA due to IFR Cost recoveries adjustment
FY2018 Energy includes water and sewer; FY2019 prorated based on FY18
Staffing Spring 2019 from CUNYFirst as of 2/28/19, Fall 2017 from FIS, last payroll in November, Fall 2016 from FIS last payroll in October;
FY2018 FY2019
The City University of New York
2018-2019 Third-Quarter Financial Report
Graduate Center
Comparison of Expenditures to
Resources ($000)FY2018 FY2019 $ Change % Change
FTE Enrollment and I&DR Teaching change since Fall 2013
-25%
-20%
-15%
-10%
-5%
0%
5%
FY2014 FY2015 FY2016 FY2017 FY2018 FY2019
FTE % Change I&DR Teaching % Change
54
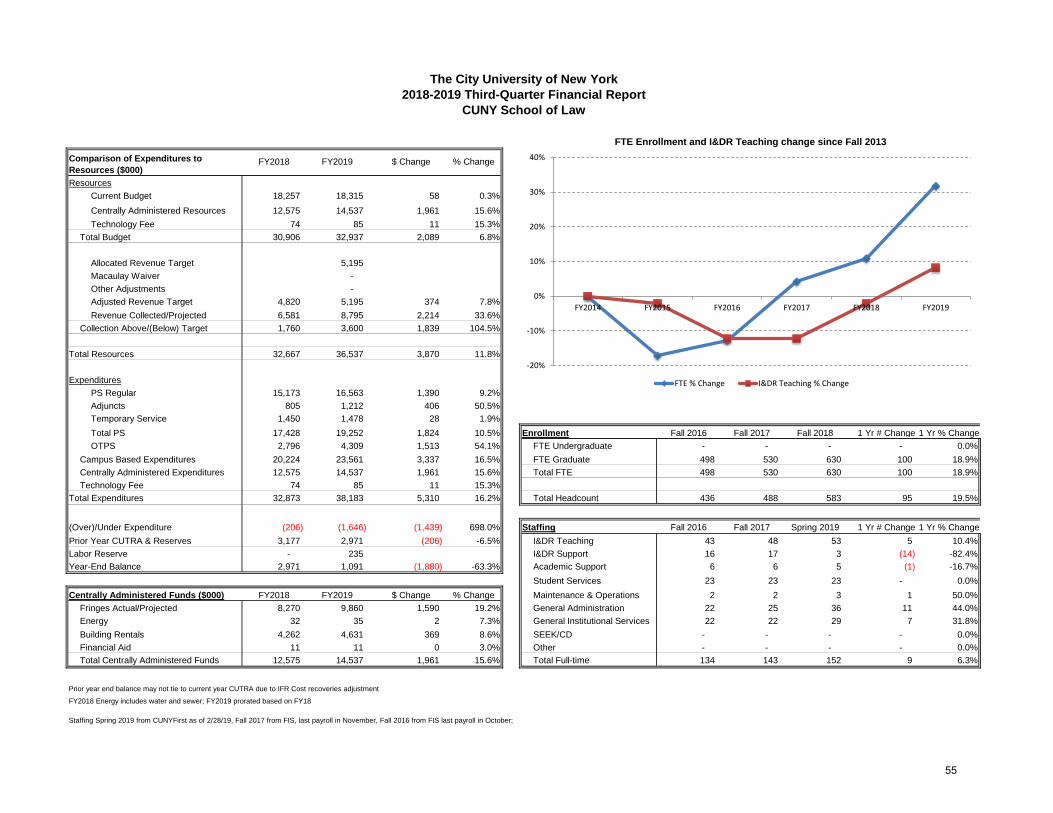
Resources
Current Budget 18,257 18,315 58 0.3%
Centrally Administered Resources 12,575 14,537 1,961 15.6% FY2019Technology Fee 74 85 11 15.3% FY2014 FY2015 FY2016 FY
Total Budget 30,906 32,937 2,089 6.8% FTE % Change
FTE % Change 0.0% -17.2% -12.8% # 10.9% 31.8%
Allocated Revenue Target 5,195 I&DR Teaching % Change 0.0% -2.0% -12.2% # -2.0% 8.2%
Macaulay Waiver -
Other Adjustments -
Adjusted Revenue Target 4,820 5,195 374 7.8%
Revenue Collected/Projected 6,581 8,795 2,214 33.6%
Collection Above/(Below) Target 1,760 3,600 1,839 104.5%
Total Resources 32,667 36,537 3,870 11.8%
Expenditures
PS Regular 15,173 16,563 1,390 9.2%
Adjuncts 805 1,212 406 50.5%
Temporary Service 1,450 1,478 28 1.9% Fall 2017
Total PS 17,428 19,252 1,824 10.5% Enrollment Fall 2016 Fall 2017 Fall 2018 1 Yr # Change 1 Yr % Change
OTPS 2,796 4,309 1,513 54.1% FTE Undergraduate - - - - 0.0%
Campus Based Expenditures 20,224 23,561 3,337 16.5% FTE Graduate 498 530 630 100 18.9%
Centrally Administered Expenditures 12,575 14,537 1,961 15.6% Total FTE 498 530 630 100 18.9%
Technology Fee 74 85 11 15.3%
Total Expenditures 32,873 38,183 5,310 16.2% Total Headcount 436 488 583 95 19.5%
(Over)/Under Expenditure (206) (1,646) (1,439) 698.0% Staffing Fall 2016 Fall 2017 Spring 2019 1 Yr # Change 1 Yr % Change
Prior Year CUTRA & Reserves 3,177 2,971 (206) -6.5% I&DR Teaching 43 48 53 5 10.4%
Labor Reserve - 235 I&DR Support 16 17 3 (14) -82.4%
Year-End Balance 2,971 1,091 (1,880) -63.3% Academic Support 6 6 5 (1) -16.7%
Student Services 23 23 23 - 0.0%
Centrally Administered Funds ($000) FY2018 FY2019 $ Change % Change Maintenance & Operations 2 2 3 1 50.0%
Fringes Actual/Projected 8,270 9,860 1,590 19.2% General Administration 22 25 36 11 44.0%
Energy 32 35 2 7.3% General Institutional Services 22 22 29 7 31.8%
Building Rentals 4,262 4,631 369 8.6% SEEK/CD - - - - 0.0%
Financial Aid 11 11 0 3.0% Other - - - - 0.0%
Total Centrally Administered Funds 12,575 14,537 1,961 15.6% Total Full-time 134 143 152 9 6.3%
Prior year end balance may not tie to current year CUTRA due to IFR Cost recoveries adjustment
FY2018 Energy includes water and sewer; FY2019 prorated based on FY18
Staffing Spring 2019 from CUNYFirst as of 2/28/19, Fall 2017 from FIS, last payroll in November, Fall 2016 from FIS last payroll in October;
FY2018 FY2019
The City University of New York
2018-2019 Third-Quarter Financial Report
CUNY School of Law
Comparison of Expenditures to
Resources ($000)FY2018 FY2019 $ Change % Change
FTE Enrollment and I&DR Teaching change since Fall 2013
-20%
-10%
0%
10%
20%
30%
40%
FY2014 FY2015 FY2016 FY2017 FY2018 FY2019
FTE % Change I&DR Teaching % Change
55

Resources
Current Budget 8,163 8,055 (108) -1.3%
Centrally Administered Resources 5,920 6,621 700 11.8% FY2019Technology Fee 8 78 70 868.2% FY2014 FY2015 FY2016 FY
Total Budget 14,091 14,753 554 3.9% FTE % Change
FTE % Change 0.0% -4.6% 4.6% # 5.9% 17.7%
Allocated Revenue Target 1,885 I&DR Teaching % Change 0.0% -11.1% -29.6% # -25.9% -40.7%
Macaulay Waiver -
Other Adjustments -
Adjusted Revenue Target 1,829 1,885 56 3.1%
Revenue Collected/Projected 2,410 2,909 499 20.7%
Collection Above/(Below) Target 582 1,024 443 76.1%
Total Resources 14,673 15,777 1,105 7.5%
Expenditures
PS Regular 5,887 6,368 481 8.2%
Adjuncts 1,008 1,038 30 3.0%
Temporary Service 570 567 (3) -0.5% Fall 2018
Total PS 7,465 7,973 508 6.8% Enrollment Fall 2016 Fall 2017 Fall 2018 1 Yr # Change 1 Yr % Change
OTPS 906 1,287 381 42.0% FTE Undergraduate - - - - 0.0%
Campus Based Expenditures 8,371 9,260 889 10.6% FTE Graduate 258 251 279 28 11.2%
Centrally Administered Expenditures 5,920 6,621 700 11.8% Total FTE 258 251 279 28 11.2%
Technology Fee 8 78 70 868.2%
Total Expenditures 14,300 15,958 1,659 11.6% Total Headcount 216 208 230 22 10.6%
(Over)/Under Expenditure 373 (181) (554) -148.6% Staffing Fall 2016 Fall 2017 Spring 2019 1 Yr # Change 1 Yr % Change
Prior Year CUTRA & Reserves 728 1,101 373 51.3% I&DR Teaching 17 20 16 (4) -20.0%
Labor Reserve - 170 I&DR Support - - 2 2 0.0%
Year-End Balance 1,101 750 (351) -31.9% Academic Support 2 2 2 - 0.0%
Student Services 8 8 9 1 12.5%
Centrally Administered Funds ($000) FY2018 FY2019 $ Change % Change Maintenance & Operations - - - - 0.0%
Fringes Actual/Projected 3,209 3,791 582 18.1% General Administration 8 9 39 30 333.3%
Energy 4 4 0 7.3% General Institutional Services 22 26 2 (24) -92.3%
Building Rentals 2,704 2,822 118 4.4% SEEK/CD - - - - 0.0%
Financial Aid 3 3 0 3.0% Other - - - - 0.0%
Total Centrally Administered Funds 5,920 6,621 700 11.8% Total Full-time 57 65 70 5 7.7%
Prior year end balance may not tie to current year CUTRA due to IFR Cost recoveries adjustment
FY2018 Energy includes water and sewer; FY2019 prorated based on FY18
Staffing Spring 2019 from CUNYFirst as of 2/28/19, Fall 2017 from FIS, last payroll in November, Fall 2016 from FIS last payroll in October;
FY2018 FY2019
The City University of New York
2018-2019 Third-Quarter Financial Report
Newmark School of Journalism
Comparison of Expenditures to
Resources ($000)FY2018 FY2019 $ Change % Change
FTE Enrollment and I&DR Teaching change since Fall 2013
-50%
-40%
-30%
-20%
-10%
0%
10%
20%
30%
FY2014 FY2015 FY2016 FY2017 FY2018 FY2019
FTE % Change I&DR Teaching % Change
56
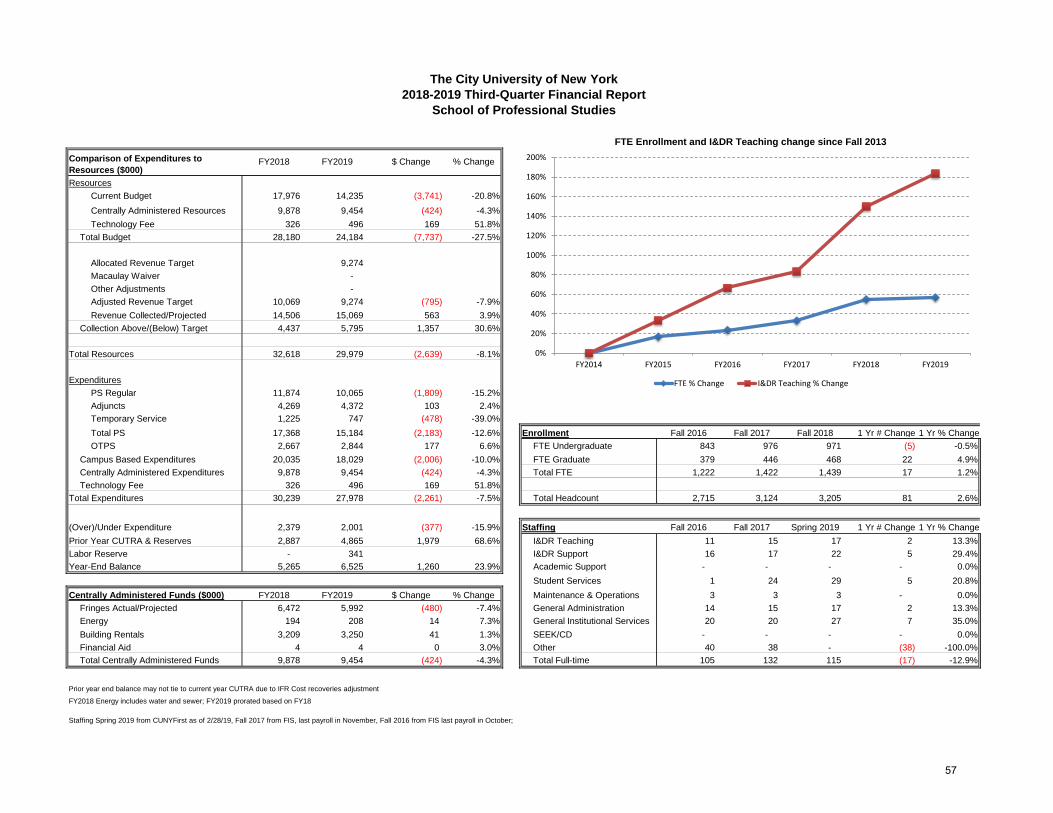
Resources
Current Budget 17,976 14,235 (3,741) -20.8%
Centrally Administered Resources 9,878 9,454 (424) -4.3% FY2019Technology Fee 326 496 169 51.8% FY2014 FY2015 FY2016 FY
Total Budget 28,180 24,184 (7,737) -27.5% FTE % Change
FTE % Change 0.0% 16.9% 23.7% # 55.1% 56.9%
Allocated Revenue Target 9,274 I&DR Teaching % Change 0.0% 33.3% 66.7% # 150.0% 183.3%
Macaulay Waiver -
Other Adjustments -
Adjusted Revenue Target 10,069 9,274 (795) -7.9%
Revenue Collected/Projected 14,506 15,069 563 3.9%
Collection Above/(Below) Target 4,437 5,795 1,357 30.6%
Total Resources 32,618 29,979 (2,639) -8.1%
Expenditures
PS Regular 11,874 10,065 (1,809) -15.2%
Adjuncts 4,269 4,372 103 2.4%
Temporary Service 1,225 747 (478) -39.0% Fall 2017
Total PS 17,368 15,184 (2,183) -12.6% Enrollment Fall 2016 Fall 2017 Fall 2018 1 Yr # Change 1 Yr % Change
OTPS 2,667 2,844 177 6.6% FTE Undergraduate 843 976 971 (5) -0.5%
Campus Based Expenditures 20,035 18,029 (2,006) -10.0% FTE Graduate 379 446 468 22 4.9%
Centrally Administered Expenditures 9,878 9,454 (424) -4.3% Total FTE 1,222 1,422 1,439 17 1.2%
Technology Fee 326 496 169 51.8%
Total Expenditures 30,239 27,978 (2,261) -7.5% Total Headcount 2,715 3,124 3,205 81 2.6%
(Over)/Under Expenditure 2,379 2,001 (377) -15.9% Staffing Fall 2016 Fall 2017 Spring 2019 1 Yr # Change 1 Yr % Change
Prior Year CUTRA & Reserves 2,887 4,865 1,979 68.6% I&DR Teaching 11 15 17 2 13.3%
Labor Reserve - 341 I&DR Support 16 17 22 5 29.4%
Year-End Balance 5,265 6,525 1,260 23.9% Academic Support - - - - 0.0%
Student Services 1 24 29 5 20.8%
Centrally Administered Funds ($000) FY2018 FY2019 $ Change % Change Maintenance & Operations 3 3 3 - 0.0%
Fringes Actual/Projected 6,472 5,992 (480) -7.4% General Administration 14 15 17 2 13.3%
Energy 194 208 14 7.3% General Institutional Services 20 20 27 7 35.0%
Building Rentals 3,209 3,250 41 1.3% SEEK/CD - - - - 0.0%
Financial Aid 4 4 0 3.0% Other 40 38 - (38) -100.0%
Total Centrally Administered Funds 9,878 9,454 (424) -4.3% Total Full-time 105 132 115 (17) -12.9%
Prior year end balance may not tie to current year CUTRA due to IFR Cost recoveries adjustment
FY2018 Energy includes water and sewer; FY2019 prorated based on FY18
Staffing Spring 2019 from CUNYFirst as of 2/28/19, Fall 2017 from FIS, last payroll in November, Fall 2016 from FIS last payroll in October;
FY2018 FY2019
The City University of New York
2018-2019 Third-Quarter Financial Report
School of Professional Studies
Comparison of Expenditures to
Resources ($000)FY2018 FY2019 $ Change % Change
FTE Enrollment and I&DR Teaching change since Fall 2013
0%
20%
40%
60%
80%
100%
120%
140%
160%
180%
200%
FY2014 FY2015 FY2016 FY2017 FY2018 FY2019
FTE % Change I&DR Teaching % Change
57

Resources
Current Budget 12,496 11,150 (1,346) -10.8%
Centrally Administered Resources 7,719 9,750 2,032 26.3% FY2019Technology Fee 44 128 84 193.5% FY2014 FY2015 FY2016 FY
Total Budget 20,259 21,028 (577) -2.8% FTE % Change
FTE % Change 0.0% 0.0% 0.0% # -3.9% 1.7%
Allocated Revenue Target 3,568 I&DR Teaching % Change 0.0% 0.0% 0.0% # -2.0% -12.2%
Macaulay Waiver -
Other Adjustments -
Adjusted Revenue Target 4,432 3,568 (864) -19.5%
Revenue Collected/Projected 3,797 4,230 433 11.4%
Collection Above/(Below) Target (635) 662 1,298 -204.3%
Total Resources 19,623 21,691 2,067 10.5%
Expenditures
PS Regular 9,868 11,228 1,360 13.8%
Adjuncts 184 256 72 38.8%
Temporary Service 1,008 581 (428) -42.4% Fall 2017
Total PS 11,061 12,065 1,004 9.1% Enrollment Fall 2016 Fall 2017 Fall 2018 1 Yr # Change 1 Yr % Change
OTPS 880 958 78 8.8% FTE Undergraduate - - - - 0.0%
Campus Based Expenditures 11,941 13,022 1,081 9.1% FTE Graduate 358 344 364 20 5.8%
Centrally Administered Expenditures 7,719 9,750 2,032 26.3% Total FTE 358 344 364 20 5.8%
Technology Fee 44 128 84 193.5%
Total Expenditures 19,704 22,901 3,197 16.2% Total Headcount 583 559 589 30 5.4%
(Over)/Under Expenditure (80) (1,210) (1,130) 1409.2% Staffing Fall 2016 Fall 2017 Spring 2019 1 Yr # Change 1 Yr % Change
Prior Year CUTRA & Reserves 419 339 (80) -19.1% I&DR Teaching 49 48 43 (5) -10.4%
Labor Reserve - 144 I&DR Support 2 2 4 2 100.0%
Year-End Balance 339 (1,016) (1,355) -400.0% Academic Support 1 5 6 1 20.0%
Student Services 7 8 11 3 37.5%
Centrally Administered Funds ($000) FY2018 FY2019 $ Change % Change Maintenance & Operations - 2 3 1 50.0%
Fringes Actual/Projected 5,379 6,684 1,306 24.3% General Administration 27 19 27 8 42.1%
Energy - - - 0.0% General Institutional Services 2 9 11 2 22.2%
Building Rentals 2,340 3,066 726 31.0% SEEK/CD - - - - 0.0%
Financial Aid - - - 0.0% Other - 1 - (1) -100.0%
Total Centrally Administered Funds 7,719 9,750 2,032 26.3% Total Full-time 88 94 105 11 11.7%
Prior year end balance may not tie to current year CUTRA due to IFR Cost recoveries adjustment
FY2018 Energy includes water and sewer; FY2019 prorated based on FY18
Staffing Spring 2019 from CUNYFirst as of 2/28/19, Fall 2017 from FIS, last payroll in November, Fall 2016 from FIS last payroll in October;
FY2018 FY2019
The City University of New York
2018-2019 Third-Quarter Financial Report
School of Public Health
Comparison of Expenditures to
Resources ($000)FY2018 FY2019 $ Change % Change
FTE Enrollment and I&DR Teaching change since Fall 2016
-14%
-12%
-10%
-8%
-6%
-4%
-2%
0%
2%
4%
FY2017 FY2018 FY2019
FTE % Change I&DR Teaching % Change
58

Resources
Current Budget - 5,678 5,678 0.0%
Centrally Administered Resources - 3,862 3,862 0.0% FY2019Technology Fee - - - 0.0% FY2014 FY2015 FY2016 FY
Total Budget - 9,541 15,219 0.0% FTE % Change
FTE % Change #N/A #N/A #N/A # #N/A #N/A
Allocated Revenue Target 1,126 I&DR Teaching % Change #N/A #N/A #N/A # #N/A #N/A
Macaulay Waiver -
Other Adjustments -
Adjusted Revenue Target - 1,126 1,126 0.0%
Revenue Collected/Projected - 1,561 1,561 0.0%
Collection Above/(Below) Target - 435 435 0.0%
Total Resources - 9,976 9,976 0.0%
Expenditures
PS Regular - 3,499 3,499 0.0%
Adjuncts - 383 383 0.0%
Temporary Service - 1,177 1,177 0.0% Fall 2017
Total PS - 5,060 5,060 0.0% Enrollment Fall 2016 Fall 2017 Fall 2018 1 Yr # Change 1 Yr % Change
OTPS - 900 900 0.0% FTE Undergraduate - - 60 60 0.0%
Campus Based Expenditures - 5,960 5,960 0.0% FTE Graduate - - 90 90 0.0%
Centrally Administered Expenditures - 3,862 3,862 0.0% Total FTE - - 150 150 0.0%
Technology Fee - - - 0.0%
Total Expenditures - 9,822 9,822 0.0% Total Headcount - - 410 410 0.0%
(Over)/Under Expenditure - 154 154 0.0% Staffing Fall 2016 Fall 2017 Spring 2019 1 Yr # Change 1 Yr % Change
Prior Year CUTRA & Reserves - 400 400 0.0% I&DR Teaching - - 6 6 0.0%
Labor Reserve - 173 I&DR Support - - 4 4 0.0%
Year-End Balance - 381 381 0.0% Academic Support - - 5 5 0.0%
Student Services - - 19 19 0.0%
Centrally Administered Funds ($000) FY2018 FY2019 $ Change % Change Maintenance & Operations - - - - 0.0%
Fringes Actual/Projected - 2,083 2,083 0.0% General Administration - - 2 2 0.0%
Energy - - - 0.0% General Institutional Services - - 8 8 0.0%
Building Rentals - 1,779 1,779 0.0% SEEK/CD - - - - 0.0%
Financial Aid - - - 0.0% Other - - - - 0.0%
Total Centrally Administered Funds - 3,862 3,862 0.0% Total Full-time - - 44 44 0.0%
Prior year end balance may not tie to current year CUTRA due to IFR Cost recoveries adjustment
FY2018 Energy includes water and sewer; FY2019 prorated based on FY18
Staffing Spring 2019 from CUNYFirst as of 2/28/19, Fall 2017 from FIS, last payroll in November, Fall 2016 from FIS last payroll in October;
FY2018 FY2019
The City University of New York
2018-2019 Third-Quarter Financial Report
School of Labor and Urban Studies
FTE Enrollment and I&DR Teaching change since Fall 2018
Comparison of Expenditures to
Resources ($000)FY2018 FY2019 $ Change % Change
0%
20%
40%
60%
80%
100%
120%
FY2019
FTE % Change I&DR Teaching % Change
59
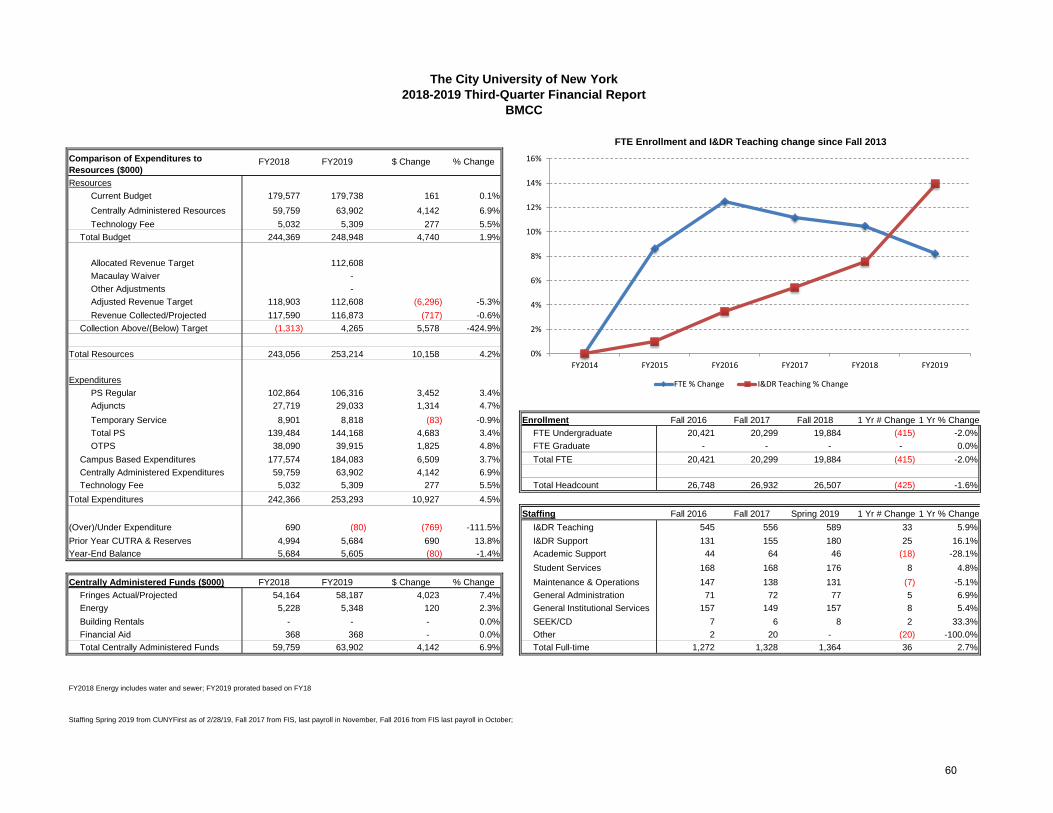
Resources
Current Budget 179,577 179,738 161 0.1%
Centrally Administered Resources 59,759 63,902 4,142 6.9% FY2019Technology Fee 5,032 5,309 277 5.5% FY2014 FY2015 FY2016 FY
Total Budget 244,369 248,948 4,740 1.9% FTE % Change
FTE % Change 0.0% 8.6% 12.5% # 10.5% 8.2%
Allocated Revenue Target 112,608 I&DR Teaching % Change 0.0% 1.0% 3.5% # 7.5% 13.9%
Macaulay Waiver -
Other Adjustments -
Adjusted Revenue Target 118,903 112,608 (6,296) -5.3%
Revenue Collected/Projected 117,590 116,873 (717) -0.6%
Collection Above/(Below) Target (1,313) 4,265 5,578 -424.9%
Total Resources 243,056 253,214 10,158 4.2%
Expenditures
PS Regular 102,864 106,316 3,452 3.4%
Adjuncts 27,719 29,033 1,314 4.7% Fall 2017
Temporary Service 8,901 8,818 (83) -0.9% Enrollment Fall 2016 Fall 2017 Fall 2018 1 Yr # Change 1 Yr % Change
Total PS 139,484 144,168 4,683 3.4% FTE Undergraduate 20,421 20,299 19,884 (415) -2.0%
OTPS 38,090 39,915 1,825 4.8% FTE Graduate - - - - 0.0%
Campus Based Expenditures 177,574 184,083 6,509 3.7% Total FTE 20,421 20,299 19,884 (415) -2.0%
Centrally Administered Expenditures 59,759 63,902 4,142 6.9%
Technology Fee 5,032 5,309 277 5.5% Total Headcount 26,748 26,932 26,507 (425) -1.6%
Total Expenditures 242,366 253,293 10,927 4.5%
Staffing Fall 2016 Fall 2017 Spring 2019 1 Yr # Change 1 Yr % Change
(Over)/Under Expenditure 690 (80) (769) -111.5% I&DR Teaching 545 556 589 33 5.9%
Prior Year CUTRA & Reserves 4,994 5,684 690 13.8% I&DR Support 131 155 180 25 16.1%
Year-End Balance 5,684 5,605 (80) -1.4% Academic Support 44 64 46 (18) -28.1%
Student Services 168 168 176 8 4.8%
Centrally Administered Funds ($000) FY2018 FY2019 $ Change % Change Maintenance & Operations 147 138 131 (7) -5.1%
Fringes Actual/Projected 54,164 58,187 4,023 7.4% General Administration 71 72 77 5 6.9%
Energy 5,228 5,348 120 2.3% General Institutional Services 157 149 157 8 5.4%
Building Rentals - - - 0.0% SEEK/CD 7 6 8 2 33.3%
Financial Aid 368 368 - 0.0% Other 2 20 - (20) -100.0%
Total Centrally Administered Funds 59,759 63,902 4,142 6.9% Total Full-time 1,272 1,328 1,364 36 2.7%
FY2018 Energy includes water and sewer; FY2019 prorated based on FY18
Staffing Spring 2019 from CUNYFirst as of 2/28/19, Fall 2017 from FIS, last payroll in November, Fall 2016 from FIS last payroll in October;
FY2018 FY2019
The City University of New York
2018-2019 Third-Quarter Financial Report
BMCC
Comparison of Expenditures to
Resources ($000)FY2018 FY2019 $ Change % Change
FTE Enrollment and I&DR Teaching change since Fall 2013
0%
2%
4%
6%
8%
10%
12%
14%
16%
FY2014 FY2015 FY2016 FY2017 FY2018 FY2019
FTE % Change I&DR Teaching % Change
60

Resources
Current Budget 94,303 95,946 1,643 1.7%
Centrally Administered Resources 39,833 41,140 1,307 3.3% FY2019Technology Fee 1,916 2,300 384 20.0% FY2014 FY2015 FY2016 FY
Total Budget 136,052 139,386 4,977 3.7% FTE % Change
FTE % Change 0.0% 0.8% -0.1% # -1.5% -6.8%
Allocated Revenue Target 44,190 I&DR Teaching % Change 0.0% 4.6% 7.1% # 14.2% 15.7%
Macaulay Waiver -
Other Adjustments -
Adjusted Revenue Target 44,047 44,190 143 0.3%
Revenue Collected/Projected 43,684 42,255 (1,429) -3.3%
Collection Above/(Below) Target (363) (1,935) (1,572) 433.0%
Total Resources 135,689 137,451 1,761 1.3%
Expenditures
PS Regular 69,110 68,748 (362) -0.5%
Adjuncts 11,137 10,737 (400) -3.6% Fall 2017
Temporary Service 5,288 5,127 (161) -3.1% Enrollment Fall 2016 Fall 2017 Fall 2018 1 Yr # Change 1 Yr % Change
Total PS 85,535 84,612 (923) -1.1% FTE Undergraduate 7,936 7,939 7,514 (425) -5.4%
OTPS 9,002 10,619 1,617 18.0% FTE Graduate - - - - 0.0%
Campus Based Expenditures 94,537 95,231 694 0.7% Total FTE 7,936 7,939 7,514 (425) -5.4%
Centrally Administered Expenditures 39,833 41,140 1,307 3.3%
Technology Fee 1,916 2,300 384 20.0% Total Headcount 10,919 10,935 10,519 (416) -3.8%
Total Expenditures 136,286 138,671 2,385 1.7%
Staffing Fall 2016 Fall 2017 Spring 2019 1 Yr # Change 1 Yr % Change
(Over)/Under Expenditure (597) (1,220) (623) 104.3% I&DR Teaching 300 321 325 4 1.2%
Prior Year CUTRA & Reserves 1,910 1,312 (597) -31.3% I&DR Support 129 141 127 (14) -9.9%
Year-End Balance 1,312 92 (1,220) -93.0% Academic Support 50 55 46 (9) -16.4%
Student Services 80 81 97 16 19.8%
Centrally Administered Funds ($000) FY2018 FY2019 $ Change % Change Maintenance & Operations 113 113 92 (21) -18.6%
Fringes Actual/Projected 36,390 37,625 1,235 3.4% General Administration 63 71 71 - 0.0%
Energy 3,145 3,217 72 2.3% General Institutional Services 127 124 126 2 1.6%
Building Rentals - - - 0.0% SEEK/CD 6 6 6 - 0.0%
Financial Aid 297 297 - 0.0% Other 1 5 - (5) -100.0%
Total Centrally Administered Funds 39,833 41,140 1,307 3.3% Total Full-time 869 917 890 (27) -2.9%
FY2018 Energy includes water and sewer; FY2019 prorated based on FY18
Staffing Spring 2019 from CUNYFirst as of 2/28/19, Fall 2017 from FIS, last payroll in November, Fall 2016 from FIS last payroll in October;
FY2018 FY2019
The City University of New York
2018-2019 Third-Quarter Financial Report
Bronx CC
Comparison of Expenditures to
Resources ($000)FY2018 FY2019 $ Change % Change
FTE Enrollment and I&DR Teaching change since Fall 2013
-10%
-5%
0%
5%
10%
15%
20%
FY2014 FY2015 FY2016 FY2017 FY2018 FY2019
FTE % Change I&DR Teaching % Change
61

Resources
Current Budget 23,873 25,758 1,885 7.9%
Centrally Administered Resources 7,869 8,139 270 3.4% FY2019Technology Fee 145 223 78 53.3% FY2014 FY2015 FY2016 FY
Total Budget 31,888 34,121 4,118 12.9% FTE % Change
FTE % Change 0.0% 25.6% 44.8% # 84.2% 60.2%
Allocated Revenue Target 4,800 I&DR Teaching % Change 0.0% 37.9% 51.7% # 86.2% 86.2%
Macaulay Waiver -
Other Adjustments (538)
Adjusted Revenue Target 4,241 4,262 21 0.5%
Revenue Collected/Projected 4,428 4,483 55 1.2%
Collection Above/(Below) Target 187 221 34 18.0%
Total Resources 32,076 34,342 2,266 7.1%
Expenditures
PS Regular 14,317 14,254 (63) -0.4%
Adjuncts 722 874 151 21.0% Fall 2017
Temporary Service 1,439 1,668 229 15.9% Enrollment Fall 2016 Fall 2017 Fall 2018 1 Yr # Change 1 Yr % Change
Total PS 16,478 16,795 317 1.9% FTE Undergraduate 1,060 1,179 1,025 (154) -13.1%
OTPS 9,177 9,150 (27) -0.3% FTE Graduate - - - - 0.0%
Campus Based Expenditures 25,655 25,945 290 1.1% Total FTE 1,060 1,179 1,025 (154) -13.1%
Centrally Administered Expenditures 7,869 8,139 270 3.4%
Technology Fee 145 223 78 53.3% Total Headcount 995 1,066 962 (104) -9.8%
Total Expenditures 33,670 34,307 637 1.9%
Staffing Fall 2016 Fall 2017 Spring 2019 1 Yr # Change 1 Yr % Change
(Over)/Under Expenditure (1,595) 35 1,629 -102.2% I&DR Teaching 46 54 54 - 0.0%
Prior Year CUTRA & Reserves 417 0 (417) -100.0% I&DR Support 1 1 5 4 400.0%
Year-End Balance (1,178) 35 1,212 -102.9% Academic Support 8 9 5 (4) -44.4%
Student Services 39 40 43 3 7.5%
Centrally Administered Funds ($000) FY2018 FY2019 $ Change % Change Maintenance & Operations 2 3 3 - 0.0%
Fringes Actual/Projected 7,539 7,801 262 3.5% General Administration 37 33 31 (2) -6.1%
Energy 331 338 8 2.3% General Institutional Services 22 23 23 - 0.0%
Building Rentals - - - 0.0% SEEK/CD - - - - 0.0%
Financial Aid - - - 0.0% Other - - - - 0.0%
Total Centrally Administered Funds 7,869 8,139 270 3.4% Total Full-time 155 163 164 1 0.6%
FY2018 Energy includes water and sewer; FY2019 prorated based on FY18
Staffing Spring 2019 from CUNYFirst as of 2/28/19, Fall 2017 from FIS, last payroll in November, Fall 2016 from FIS last payroll in October;
FY2018 FY2019
The City University of New York
2018-2019 Third-Quarter Financial Report
Guttman CC
Comparison of Expenditures to
Resources ($000)FY2018 FY2019 $ Change % Change
FTE Enrollment and I&DR Teaching change since Fall 2013
0%
10%
20%
30%
40%
50%
60%
70%
80%
90%
100%
FY2014 FY2015 FY2016 FY2017 FY2018 FY2019
FTE % Change I&DR Teaching % Change
62
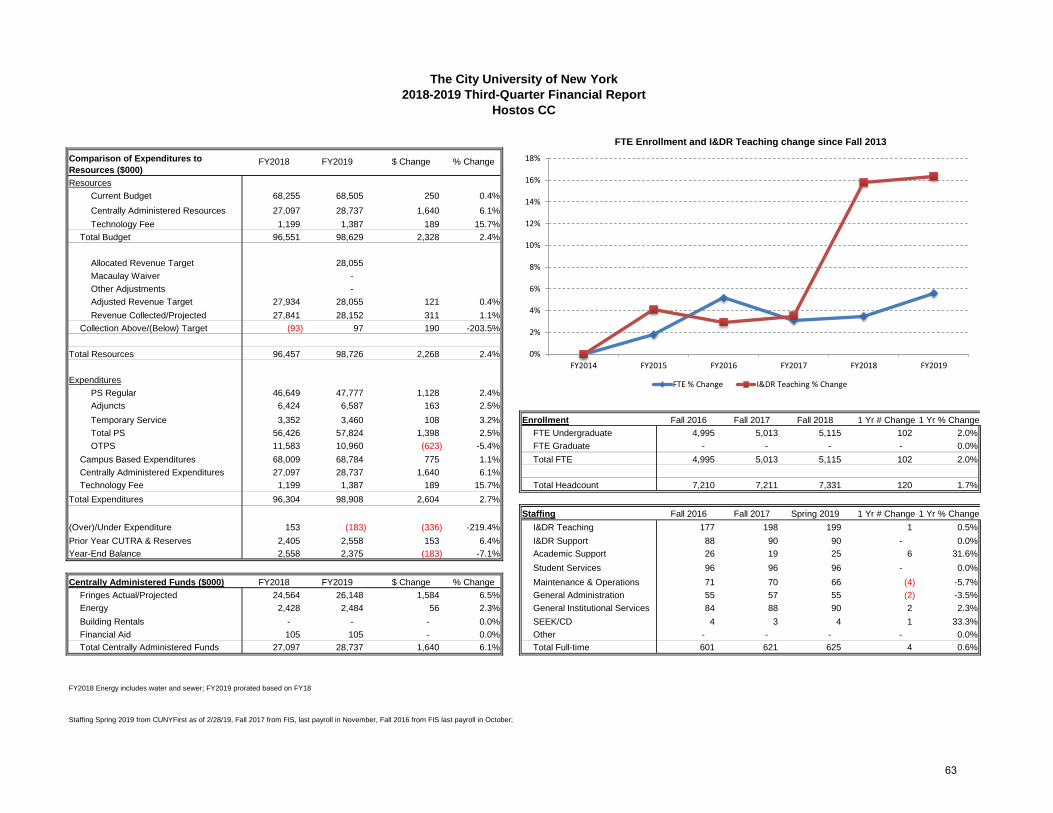
Resources
Current Budget 68,255 68,505 250 0.4%
Centrally Administered Resources 27,097 28,737 1,640 6.1% FY2019Technology Fee 1,199 1,387 189 15.7% FY2014 FY2015 FY2016 FY
Total Budget 96,551 98,629 2,328 2.4% FTE % Change
FTE % Change 0.0% 1.8% 5.2% # 3.5% 5.6%
Allocated Revenue Target 28,055 I&DR Teaching % Change 0.0% 4.1% 2.9% # 15.8% 16.4%
Macaulay Waiver -
Other Adjustments -
Adjusted Revenue Target 27,934 28,055 121 0.4%
Revenue Collected/Projected 27,841 28,152 311 1.1%
Collection Above/(Below) Target (93) 97 190 -203.5%
Total Resources 96,457 98,726 2,268 2.4%
Expenditures
PS Regular 46,649 47,777 1,128 2.4%
Adjuncts 6,424 6,587 163 2.5% Fall 2017
Temporary Service 3,352 3,460 108 3.2% Enrollment Fall 2016 Fall 2017 Fall 2018 1 Yr # Change 1 Yr % Change
Total PS 56,426 57,824 1,398 2.5% FTE Undergraduate 4,995 5,013 5,115 102 2.0%
OTPS 11,583 10,960 (623) -5.4% FTE Graduate - - - - 0.0%
Campus Based Expenditures 68,009 68,784 775 1.1% Total FTE 4,995 5,013 5,115 102 2.0%
Centrally Administered Expenditures 27,097 28,737 1,640 6.1%
Technology Fee 1,199 1,387 189 15.7% Total Headcount 7,210 7,211 7,331 120 1.7%
Total Expenditures 96,304 98,908 2,604 2.7%
Staffing Fall 2016 Fall 2017 Spring 2019 1 Yr # Change 1 Yr % Change
(Over)/Under Expenditure 153 (183) (336) -219.4% I&DR Teaching 177 198 199 1 0.5%
Prior Year CUTRA & Reserves 2,405 2,558 153 6.4% I&DR Support 88 90 90 - 0.0%
Year-End Balance 2,558 2,375 (183) -7.1% Academic Support 26 19 25 6 31.6%
Student Services 96 96 96 - 0.0%
Centrally Administered Funds ($000) FY2018 FY2019 $ Change % Change Maintenance & Operations 71 70 66 (4) -5.7%
Fringes Actual/Projected 24,564 26,148 1,584 6.5% General Administration 55 57 55 (2) -3.5%
Energy 2,428 2,484 56 2.3% General Institutional Services 84 88 90 2 2.3%
Building Rentals - - - 0.0% SEEK/CD 4 3 4 1 33.3%
Financial Aid 105 105 - 0.0% Other - - - - 0.0%
Total Centrally Administered Funds 27,097 28,737 1,640 6.1% Total Full-time 601 621 625 4 0.6%
FY2018 Energy includes water and sewer; FY2019 prorated based on FY18
Staffing Spring 2019 from CUNYFirst as of 2/28/19, Fall 2017 from FIS, last payroll in November, Fall 2016 from FIS last payroll in October;
FY2018 FY2019
The City University of New York
2018-2019 Third-Quarter Financial Report
Hostos CC
Comparison of Expenditures to
Resources ($000)FY2018 FY2019 $ Change % Change
FTE Enrollment and I&DR Teaching change since Fall 2013
0%
2%
4%
6%
8%
10%
12%
14%
16%
18%
FY2014 FY2015 FY2016 FY2017 FY2018 FY2019
FTE % Change I&DR Teaching % Change
63

Resources
Current Budget 100,959 101,700 741 0.7%
Centrally Administered Resources 42,380 44,495 2,115 5.0% FY2019Technology Fee 2,174 2,140 (34) -1.6% FY2014 FY2015 FY2016 FY
Total Budget 145,513 148,334 3,562 2.4% FTE % Change
FTE % Change 0.0% -4.2% -8.5% # -21.7% -25.1%
Allocated Revenue Target 45,659 I&DR Teaching % Change 0.0% -2.0% -2.6% # -1.7% -3.7%
Macaulay Waiver -
Other Adjustments -
Adjusted Revenue Target 47,066 45,659 (1,408) -3.0%
Revenue Collected/Projected 48,177 45,270 (2,907) -6.0%
Collection Above/(Below) Target 1,110 (389) (1,499) -135.0%
Total Resources 146,623 147,945 1,322 0.9%
Expenditures
PS Regular 70,736 71,715 979 1.4%
Adjuncts 12,388 12,467 79 0.6% Fall 2017
Temporary Service 9,097 9,150 53 0.6% Enrollment Fall 2016 Fall 2017 Fall 2018 1 Yr # Change 1 Yr % Change
Total PS 92,221 93,332 1,111 1.2% FTE Undergraduate 11,345 10,706 10,243 (463) -4.3%
OTPS 9,038 9,808 769 8.5% FTE Graduate - - - - 0.0%
Campus Based Expenditures 101,260 103,140 1,880 1.9% Total FTE 11,345 10,706 10,243 (463) -4.3%
Centrally Administered Expenditures 42,380 44,495 2,115 5.0%
Technology Fee 2,174 2,140 (34) -1.6% Total Headcount 15,968 15,035 14,951 (84) -0.6%
Total Expenditures 145,814 149,774 3,961 2.7%
Staffing Fall 2016 Fall 2017 Spring 2019 1 Yr # Change 1 Yr % Change
(Over)/Under Expenditure 809 (1,829) (2,639) -326.0% I&DR Teaching 346 342 335 (7) -2.0%
Prior Year CUTRA & Reserves 2,028 2,838 809 39.9% I&DR Support 120 121 143 22 18.2%
Year-End Balance 2,838 1,008 (1,829) -64.5% Academic Support 40 39 42 3 7.7%
Student Services 116 105 99 (6) -5.7%
Centrally Administered Funds ($000) FY2018 FY2019 $ Change % Change Maintenance & Operations 131 115 110 (5) -4.3%
Fringes Actual/Projected 37,247 39,249 2,003 5.4% General Administration 71 66 67 1 1.5%
Energy 4,890 5,002 112 2.3% General Institutional Services 117 115 105 (10) -8.7%
Building Rentals - - - 0.0% SEEK/CD 7 7 7 - 0.0%
Financial Aid 244 244 - 0.0% Other - 1 - (1) -100.0%
Total Centrally Administered Funds 42,380 44,495 2,115 5.0% Total Full-time 948 911 908 (3) -0.3%
FY2018 Energy includes water and sewer; FY2019 prorated based on FY18
Staffing Spring 2019 from CUNYFirst as of 2/28/19, Fall 2017 from FIS, last payroll in November, Fall 2016 from FIS last payroll in October;
FY2018 FY2019
The City University of New York
2018-2019 Third-Quarter Financial Report
Kingsborough CC
Comparison of Expenditures to
Resources ($000)FY2018 FY2019 $ Change % Change
FTE Enrollment and I&DR Teaching change since Fall 2013
-30%
-25%
-20%
-15%
-10%
-5%
0%FY2014 FY2015 FY2016 FY2017 FY2018 FY2019
FTE % Change I&DR Teaching % Change
64
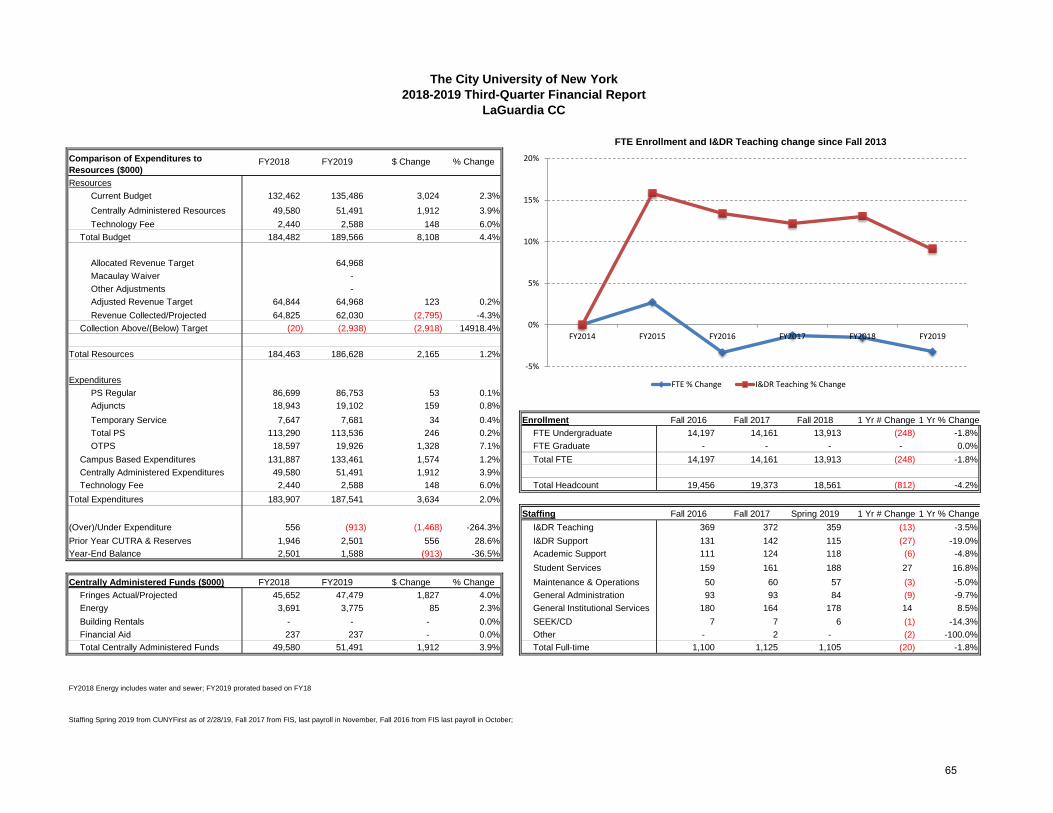
Resources
Current Budget 132,462 135,486 3,024 2.3%
Centrally Administered Resources 49,580 51,491 1,912 3.9% FY2019Technology Fee 2,440 2,588 148 6.0% FY2014 FY2015 FY2016 FY
Total Budget 184,482 189,566 8,108 4.4% FTE % Change
FTE % Change 0.0% 2.7% -3.3% # -1.5% -3.2%
Allocated Revenue Target 64,968 I&DR Teaching % Change 0.0% 15.8% 13.4% # 13.1% 9.1%
Macaulay Waiver -
Other Adjustments -
Adjusted Revenue Target 64,844 64,968 123 0.2%
Revenue Collected/Projected 64,825 62,030 (2,795) -4.3%
Collection Above/(Below) Target (20) (2,938) (2,918) 14918.4%
Total Resources 184,463 186,628 2,165 1.2%
Expenditures
PS Regular 86,699 86,753 53 0.1%
Adjuncts 18,943 19,102 159 0.8% Fall 2017
Temporary Service 7,647 7,681 34 0.4% Enrollment Fall 2016 Fall 2017 Fall 2018 1 Yr # Change 1 Yr % Change
Total PS 113,290 113,536 246 0.2% FTE Undergraduate 14,197 14,161 13,913 (248) -1.8%
OTPS 18,597 19,926 1,328 7.1% FTE Graduate - - - - 0.0%
Campus Based Expenditures 131,887 133,461 1,574 1.2% Total FTE 14,197 14,161 13,913 (248) -1.8%
Centrally Administered Expenditures 49,580 51,491 1,912 3.9%
Technology Fee 2,440 2,588 148 6.0% Total Headcount 19,456 19,373 18,561 (812) -4.2%
Total Expenditures 183,907 187,541 3,634 2.0%
Staffing Fall 2016 Fall 2017 Spring 2019 1 Yr # Change 1 Yr % Change
(Over)/Under Expenditure 556 (913) (1,468) -264.3% I&DR Teaching 369 372 359 (13) -3.5%
Prior Year CUTRA & Reserves 1,946 2,501 556 28.6% I&DR Support 131 142 115 (27) -19.0%
Year-End Balance 2,501 1,588 (913) -36.5% Academic Support 111 124 118 (6) -4.8%
Student Services 159 161 188 27 16.8%
Centrally Administered Funds ($000) FY2018 FY2019 $ Change % Change Maintenance & Operations 50 60 57 (3) -5.0%
Fringes Actual/Projected 45,652 47,479 1,827 4.0% General Administration 93 93 84 (9) -9.7%
Energy 3,691 3,775 85 2.3% General Institutional Services 180 164 178 14 8.5%
Building Rentals - - - 0.0% SEEK/CD 7 7 6 (1) -14.3%
Financial Aid 237 237 - 0.0% Other - 2 - (2) -100.0%
Total Centrally Administered Funds 49,580 51,491 1,912 3.9% Total Full-time 1,100 1,125 1,105 (20) -1.8%
FY2018 Energy includes water and sewer; FY2019 prorated based on FY18
Staffing Spring 2019 from CUNYFirst as of 2/28/19, Fall 2017 from FIS, last payroll in November, Fall 2016 from FIS last payroll in October;
FY2018 FY2019
The City University of New York
2018-2019 Third-Quarter Financial Report
LaGuardia CC
Comparison of Expenditures to
Resources ($000)FY2018 FY2019 $ Change % Change
FTE Enrollment and I&DR Teaching change since Fall 2013
-5%
0%
5%
10%
15%
20%
FY2014 FY2015 FY2016 FY2017 FY2018 FY2019
FTE % Change I&DR Teaching % Change
65
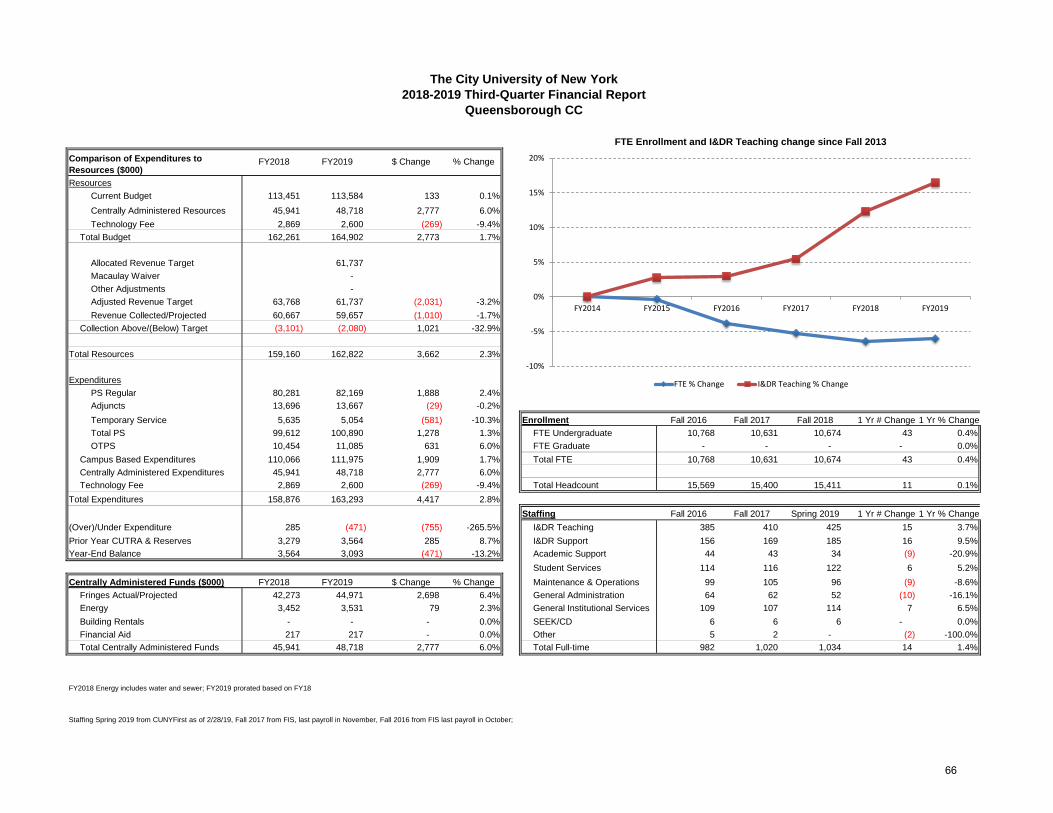
Resources
Current Budget 113,451 113,584 133 0.1%
Centrally Administered Resources 45,941 48,718 2,777 6.0% FY2019Technology Fee 2,869 2,600 (269) -9.4% FY2014 FY2015 FY2016 FY
Total Budget 162,261 164,902 2,773 1.7% FTE % Change
FTE % Change 0.0% -0.3% -3.8% # -6.4% -6.0%
Allocated Revenue Target 61,737 I&DR Teaching % Change 0.0% 2.7% 3.0% # 12.3% 16.4%
Macaulay Waiver -
Other Adjustments -
Adjusted Revenue Target 63,768 61,737 (2,031) -3.2%
Revenue Collected/Projected 60,667 59,657 (1,010) -1.7%
Collection Above/(Below) Target (3,101) (2,080) 1,021 -32.9%
Total Resources 159,160 162,822 3,662 2.3%
Expenditures
PS Regular 80,281 82,169 1,888 2.4%
Adjuncts 13,696 13,667 (29) -0.2% Fall 2017
Temporary Service 5,635 5,054 (581) -10.3% Enrollment Fall 2016 Fall 2017 Fall 2018 1 Yr # Change 1 Yr % Change
Total PS 99,612 100,890 1,278 1.3% FTE Undergraduate 10,768 10,631 10,674 43 0.4%
OTPS 10,454 11,085 631 6.0% FTE Graduate - - - - 0.0%
Campus Based Expenditures 110,066 111,975 1,909 1.7% Total FTE 10,768 10,631 10,674 43 0.4%
Centrally Administered Expenditures 45,941 48,718 2,777 6.0%
Technology Fee 2,869 2,600 (269) -9.4% Total Headcount 15,569 15,400 15,411 11 0.1%
Total Expenditures 158,876 163,293 4,417 2.8%
Staffing Fall 2016 Fall 2017 Spring 2019 1 Yr # Change 1 Yr % Change
(Over)/Under Expenditure 285 (471) (755) -265.5% I&DR Teaching 385 410 425 15 3.7%
Prior Year CUTRA & Reserves 3,279 3,564 285 8.7% I&DR Support 156 169 185 16 9.5%
Year-End Balance 3,564 3,093 (471) -13.2% Academic Support 44 43 34 (9) -20.9%
Student Services 114 116 122 6 5.2%
Centrally Administered Funds ($000) FY2018 FY2019 $ Change % Change Maintenance & Operations 99 105 96 (9) -8.6%
Fringes Actual/Projected 42,273 44,971 2,698 6.4% General Administration 64 62 52 (10) -16.1%
Energy 3,452 3,531 79 2.3% General Institutional Services 109 107 114 7 6.5%
Building Rentals - - - 0.0% SEEK/CD 6 6 6 - 0.0%
Financial Aid 217 217 - 0.0% Other 5 2 - (2) -100.0%
Total Centrally Administered Funds 45,941 48,718 2,777 6.0% Total Full-time 982 1,020 1,034 14 1.4%
FY2018 Energy includes water and sewer; FY2019 prorated based on FY18
Staffing Spring 2019 from CUNYFirst as of 2/28/19, Fall 2017 from FIS, last payroll in November, Fall 2016 from FIS last payroll in October;
FY2018 FY2019
The City University of New York
2018-2019 Third-Quarter Financial Report
Queensborough CC
Comparison of Expenditures to
Resources ($000)FY2018 FY2019 $ Change % Change
FTE Enrollment and I&DR Teaching change since Fall 2013
-10%
-5%
0%
5%
10%
15%
20%
FY2014 FY2015 FY2016 FY2017 FY2018 FY2019
FTE % Change I&DR Teaching % Change
66