Embed Size (px)
Citation preview

1
Preliminary, Please do not quote November 2009
Board Interlocks and Earnings Management Contagion
Peng-Chia Chiu
Merage School of Business, UC-Irvine
Siew Hong Teoh*
Merage School of Business, UC-Irvine
Feng Tian
School of Business, The University of Hong Kong
We examine whether earnings management spreads from firm to firm via board connections. We find that contagion of accounting quality occurs via directors in interlocking boards with other firms. A firm with director links to firms that restated earnings tends to have poorer accounting quality and higher likelihood of restating its own financial reports. A firm with director links to firms that did not restate earnings tends to have higher accounting quality. This evidence supports the idea that economic behavior such as accruals management spreads through social networks.
*Corresponding author
2
Board interlocks and earnings management contagion
By Peng-Chia Chiu, Siew Hong Teoh, Feng Tian
“Hee that lies with the dogs, riseth with fleas.”
- Outlandish Proverbs No. 343
1. Introduction
Theoretical research on social influence has examined how information and
behaviors are propagated from individual to individual (e.g., Banerjee 1992;
Bikhchandani et al. 1992). A growing body of research on social networks examines how
social linkages affect the spread of behaviors and social outcomes.
Behaviors can spread for several reasons. Rational observers may follow the
behavior of others based on either direct communication of the rationale for the chosen
action, or through observation of the action. In either case, rational Bayesian updating can
lead to similar behavior. Observers may also imitate because of a preference to conform,
or because of excessive deference to the judgment of a high-prestige model.
On the empirical side, recent research has documented that several types of
corporate behaviors such as compensation practices, poison pill adoption, and stock
exchange listing decisions spread through networks of interlocking boards (see
Hirshleifer and Teoh 2003, 2009; Bizjak et al. 2009; Rao et al. 2000; Davis 1991etc. ).
Hirshleifer and Teoh (2009) speculate that financial reporting practices (earnings
management included) are also likely to be infectious in social networks. Srinivasan
(2005) provide evidence that a restatement of earnings by one member firm in a network
of firms with interlocking boards contaminates the stock values of other firms in the
network.

3
In this paper we test empirically whether financial reporting behaviors,
specifically earnings management, are propagated through interlocking boards. To do so,
we examine the effects on firm behavior of sharing a director with another firm that was
involved with a financial restatement. We find that a firm has incrementally lower quality
earnings (measured variously as higher accruals quality or absolute value of discretionary
accruals) and a greater likelihood of restating its own financial statements if it has a board
member that also sits on the board of another firm that restated its financial statements
than otherwise. This contagion occurs regardless of whether the restatement-linked firms
are in the same industry or not. If that board member is an inside director of the
contaminated (i.e., restatement-linked) firm, the contagion is even stronger. On the other
hand, firms that are board-linked to high quality earnings firms also have higher quality
earnings. These findings are robust to various sensitivity checks.
These results contribute to the accounting and social network literature by
demonstrating that earnings management behavior propagates from one firm to another
through board interlocks. The majority of most previous studies on earnings management
treat earnings management behavior as a firm-specific behavior, while Granovetter (1985)
suggests that economic actions are embedded in social networks such as board interlocks.
Therefore, our study expands earnings management research into social network settings.
Our paper is also related to the accounting literature on the influence of geography on
accounting behavior (e.g., Kedia and Rajgopal 2008a; Defond et al. 2009). The key
difference is that we consider board interlocked members as a specific conduit for
behavior propagation in the network instead of geographic proximity to facilitate
contagion. Furthermore, our paper also contributes to the corporate governance literature

4
by evaluating whether firm monitoring is influenced by social networks within
interlocked boards. Our findings suggest that to improve financial reporting quality,
regulators also need to pay attention to the board connectivity of companies.
The remainder of the paper is organized as follows. Section II summarizes related
research and discusses our predictions on how board links to restating firms affect
earnings quality and the propensity of earnings management. Second III discusses the
research design and the sample. Section IV presents our results and Section V concludes
our paper.
2. Prior research and background
We use restatements to identify previous earnings management because
restatements are clear indicators of GAAP violations (Palmrose and Scholz 2004); other
earnings management proxies such as discretionary accruals are statistical measures and
remain controversial in the literature. Previous studies show that the disclosures of
earnings restatement are related to large market value losses. For example, Palmrose,
Richardson, and Scholz (2004) report a -9.2% of market return loss over a two-day (0,1)
of restatement announcement period, and Hribar and Jenkins (2004) find that the cost of
capital rises after restatements. Moreover, Gleason et al. (2008) explore the industry
contagion effect of earning restatements from the investor’s perspective, and find that
when a firm restates, the peer firms in the same industry also experience stock price
declines.
Existing studies on earnings management treat earnings management from a firm
specific perspective (e.g., Healy 1985; Jones 1991). However, corporate behaviors are
5
embedded in social networks, and executives’ corporate decisions are largely influenced
by other companies through these social network ties such as board interlocks
(Granovetter 1985). Several studies have provided evidence that firm’s investment,
financing or financial reporting decisions can be significantly affected by other
companies through social networks (as reviewed in Hirshleifer and Teoh (2009, 2003)).
Kedia and Rajgopal (2008a) find some evidence that neighboring firms’
accounting practices increases a firm’s tendency to misreport financial restatements.
They also document that a firm’s distance to the SEC offices is negatively associated
with the likelihood of misreporting. DeFond et al. (2009) find that the geography of SEC
enforcement is a key factor influencing auditor independence. Specifically, non-Big 4
auditors are less likely is issue going concern audit opinions when the auditor’s
engagement office is located farther away from the SEC offices, while Big 4 auditors
have the opposite tendency. According to Kedia and Rajgopal (2008a), firms located
farther away from the SEC enforcement office are more likely to misreport and Defond’s
result suggests that Big 4 auditors, with reputations to protect, do indeed call on the
misreporting. Kedia and Rajgopal (2008b) report that the stock option granting practices
of a firm are largely shaped by neighboring companies’ practices, possibly in response to
competitive pressure from a local labor market where the individuals in the social
network share information about compensation practices.
Previous studies document that various corporate behaviors spread through
director interlocks. Davis (1991) finds that a company is more likely to adopt poison pills,
one of the important anti-takeover methods, if the company is linked to the companies
that have adopted poison pills through board interlocks. Haunschild (1993) documents,

6
by analyzing firms in four industries during the 1980s, that companies linked to
acquisitive companies tend to imitate the corporate acquisition activities of these
acquisitive companies. Rao et al. (2000) find that the choice of being listed on the New
York Stock Exchange or the NASDAQ is significantly affected by board interlocks.
Specifically, firms listed on the NASDAQ in 1996 were more likely to migrate to the
NYSE later on when their directors served on the boards of prior migrating companies,
and this migrating effect was mitigated by board links to NASDAQ companies and
strengthened by board links to NYSE companies. In the accounting literature, there is
evidence of a labor market effect working through interlocking board networks.
Srinivasan (2005) documents that the outside directors of restating firms are more likely
to lose not just their board position in the restating firm but also their board positions in
other firms. Thus, directors associated with problem firms suffer a reputation penalty.
Among publicly traded companies, boards of directors supervise and monitor the
operation of the companies, and approve important management decisions. Board
directors in America commonly sit on more than one board, and each board meets several
times a year sometimes frequently as in the case of Citibank where the board met 16
times in 2002. These interlocking boards form a social network in which board members
can carry knowledge and corporate practices (good or bad) from one company to another.
Directors of interlocking boards, therefore, are much like agents carrying infectious
viruses from one firm to another.
Within the psychology literature, there is evidence of contagion of unethical
behaviors (Gino, Ayal, and Ariely. 2009). Sah (1991) points out that exposure to the
dishonesty of others could lead managers to change their subjective estimate of
7
manipulation costs and benefits. There is evidence that having board members who are
interlocked to a backdating company increases the chance that the firm also backdates
employee stock options (Bizjak et al. 2009). Fich and Shivdasani (2007) find that firms
are more likely to face a financial lawsuit if they have a board member who sits on the
board of another firm that has previously been sued for fraud.
Earnings management in firms is unlikely to publicize widely for obvious reasons.
However, it is possible that this behavior diffuses quietly from one firm to another
through board interlocks. Whether or not a company manages its earnings depends on the
subjective perceived cost and benefit of such management. For example, when a
company manipulates its earnings, directors linked to the manipulating firm observe such
behavior through board interlocks are likely to estimate a lower perceived cost of
manipulation and a higher perceived benefit. This can lead to rational herd behavior or
information cascades.
Furthermore, board connections to firms that manage earnings can change the
directors and managers’ view of whether managing earnings is a social norm, and
therefore can affect the preferences of directors and executives. The use of earnings
management at other firms can be viewed as a moral justification for its use by others. In
sum, direct communication of information signals, observation of actions and preference
interactions through social networks (e.g., board interlocks) can all cause behaviors such
as earnings management to spread from one firm to another.
Overall, based on the discussion above, we hypothesize that if a director, who is
also a board member of the firm that previously managed earnings, sits on the board of a
8
company, then the likelihood of earnings management for this company is greater. We
discuss the research design to test this hypothesis next.
3. Research design and data
To examine whether there are contagion effects in accounting reporting choices
amongst board-linked firms, we exploit a restatement sample because restating firms
have clearly violated generally accepted accounting principles (GAAP) in the period
leading up to the restatement date. We consider such firms as infectious agents for poor
accounting quality. We test whether the firms that are linked via common board members
with the infectious firms also have poor accounting quality.
Ideally, we would track a restatement back in time to the initial period when the
accounting rules were violated. In this earliest year when the bad accounting practice is
potentially infectious, we would check the names of its board of directors against the
board interlock database to select the sample of firms that are exposed to the bad
accounting virus for that year. We would then test the accounting quality of the exposed
firms for signs of infection. This sample selection method, however, is difficult to
implement because the earliest period of the bad accounting practice resulting in a
restatement is not readily available. There are also multiple possible connections of
restatements to firms which would make it difficult to figure out the initial period of
possible contagion.
As a feasible alternative, we use the following method to select a sample of
restatement-linked firms via board interlocks and to estimate the contagion period. In a
given year, we begin by identifying board linkages using information about board
interlocks from Risk Metrics (formerly the IRRC database). Following the board

9
members of these firms to the other firms where they also sit as directors, we check
whether any of these board-interlocked network firms had to restate their financial reports
anytime in the prior seven years. We use the General Accounting/Government
Accountability Office (GAO) database to identify whether a firm restated their financial
reports. If there was a restatement, the firm is deemed restatement-linked and we test the
accounting quality of the restatement-linked firm in the prior seven years when the bad
accounting was contagious.1
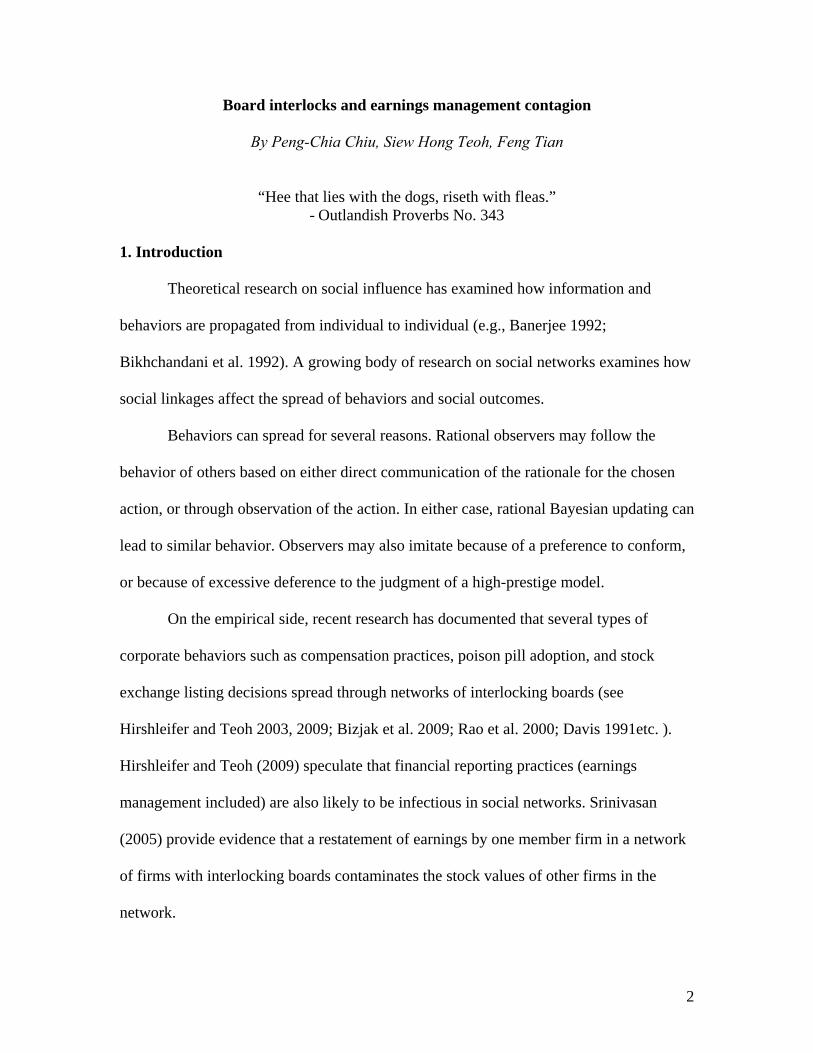
Figure 1: Time line to illustrate the contagion period
The restatements database begins in 1997. We choose 2002 as the end of our
sample period to avoid potential contaminating effects because of the passage of the
Sarbanes-Oxley Act (SOX) in 2002, whose goal was to improve corporate governance,
particularly in board structure, of American companies.
For robustness checks, we consider the following sample selection alternatives.
We extend the restatements period up to 2006, which is the post-SOX era. The time
1 Figure 1 shows that the contagion period is contemporaneous with the prior seven years over which a restatement in the infectious firm occurred. Thus, the contagion period possibly includes some post-restatenent years when the reporting improved for the restating firm. Therefore, the contagion period may include a bad reporting contagion pre-restatement as well as good reporting post-restatement contagion for the test firm. In this regard, our research design is conservative for picking up negative contagion effects from the restatement firm.
Bad accounting virus active
infectious firm
board link
Test Period for Contagion Up to yr -7 restatement-linked firm
time
restatement event
t

10
periods for past restatement infection varies from three to five years and the contagious
period for the restatement-linked firm correspondingly varies between three and five
years. We also limit restatements to just those that are identified as irregularities
(intentional misstatements) by Hennes, Leone and Miller (2008).
The accounting and stock return data are from COMPUSTAT and CRSP
respectively. We also use Risk Metrics and Thomson Financial databases to construct an
anti-takeover variable and an institutional holding variable, both of which are likely to be
related to board governance.
The contagion hypothesis is tested using a cross-sectional regression of a measure
of accounting quality of the test firm on the presence of a board link to a restatement firm
and other control variables. We use three different measures of accounting quality of the
restatement-linked test firms (described in detail in the appendices). Follow prior
literature on accounting quality, we use AQ, the standard deviation of the residuals in the
regression of working capital accruals on cash flows in the contemporaneous period, at
one lag period, and at one lead period (Dechow and Dichev 2002; McNichols 2002;
Krishnan et al. 2008.) As additional accounting quality measures, we also consider || DA ,
the average absolute discretionary accruals in the prior seven years and whether the
restatement-linked firm itself subsequently also restated its financial reports.
To calculate our key test variable, we measure the link between the test firm and
the restatement firm via a common board member in two ways. First, we consider a
binary variable for the presence or absence of a board member link between the test firm
and a restatement firm that restated financial reports in the past seven years, Restate-
link_0/1. Just as in epidemiological cases, there is a higher rate of infection if a person is

11
exposed to a greater number of infected people. Therefore, as a second measure, we
count the number of board interlocks in the test firm with firms that restated their
financial reports, #Restate_link. We use the natural logarithm measure, Log(#Restate_link)
= log (1 + #Restate_link) to reduce any potential extreme value effect on the overall
regression. We count board interlocks in two ways. First is the number of distinct
directors who are also on boards of firms that restate earnings. The other is the number of
distinct restating firms with board members who are also the firm’s board members. If
there is one director who sits on the boards of two other firms that restated earnings, the
first measure will count as one link but the second measure will count as two links. If
there are two board members who also sit on the same board of another firm that restated
earnings, the first measure will count as two links and the second measure will count as
one link.
Since some boards are very large and so are more likely to have board interlocks,
we also include a measure of the intensity of board links with other firms, #Board-link,
regardless of whether the linked firm has a restatement or not. The variable is measured
as Log(#Board_link) =log (1 + #Board_link). This measure will also pick up contagion
effects via board members. In contrast to the restatement link situation where the
contaminant is poor accounting quality, the contaminant now is the relatively good
accounting quality.
Turning next to the set of control variables, we control for various measures that
prior literature has found to be associated with accounting quality (e.g., Dechow and
Dichev 2002; Hribar and Nichols 2007; Francis et al. 2005; Krishnan et al. 2008). We
control for firm performance with return on total assets ROA, and the frequency of losses

12
in the past seven years #Loss. Size control variables include Log(TA), the natural
logarithm of total assets, and Log(SALES) , the natural logarithm of sales. Growth effects
are controlled using MB, the market-to-book ratio. The variable Leverage is measured as
the ratio total liabilities to total assets. Firm reporting quality is affected by the length of
the operating cycle, measured as the sum of the number of days that accounts receivables
and inventories are held. We use 360 days divided by the relevant turnover ratios to
measure days held, and the natural log of the operating cycle Log(Operating_Cycle) as
the control variable.
Since firms facing higher operating risks and likelihood of failure have greater
incentives to manage earnings, we control for these variables to isolate the specific effect
of board contagion that is incremental to these firm characteristics that might result in
poor accounting quality. We proxy for operating risk of the firm using σ_CFO and
σ_REV, which are measured as the standard deviation of the cash flows from operations
or revenues respectively in the past five years deflated by total assets. Following Dechow
et al. (2009), we also include the likelihood of restatement by the test firm that is
estimated using only from financial information characteristics of the firm and averaged
over the past five years. We refer to this as the R_score. (See Appendix D for details.)
Firms in some industries face greater costs if found to have managed earnings and we
control for these using indicator variables for regulated industries and for industries that
face higher litigation (Matsumoto 2002; Kasznik and Lev 1995); see Appendix A for
details.
To control for other governance-related variables that may separately affect
accounting quality, we include a binary variable for whether the firm is audited by a high
13
quality auditor Big_Auditor, which takes on value 1 if the company is audited by either a
Big 4 (or 5 or 6) auditors, and 0 otherwise. We also include a corporate governance score
(Gompers et al. (2003) Log(G-score) and the fraction of institutional holdings
HoldingInst _ .
To isolate solely the effect of contagion from board members from restatement
firms as conservatively as possible, we also control for other board characteristics that
prior literature has suggested is a proxy for the strength of monitoring by board. These
include CEO_Chair =1, if the CEO is also the chairman of the board, and 0 otherwise,
the size of the corporate board Board_Size and the percentage of independent board
members IndepBoard _ .
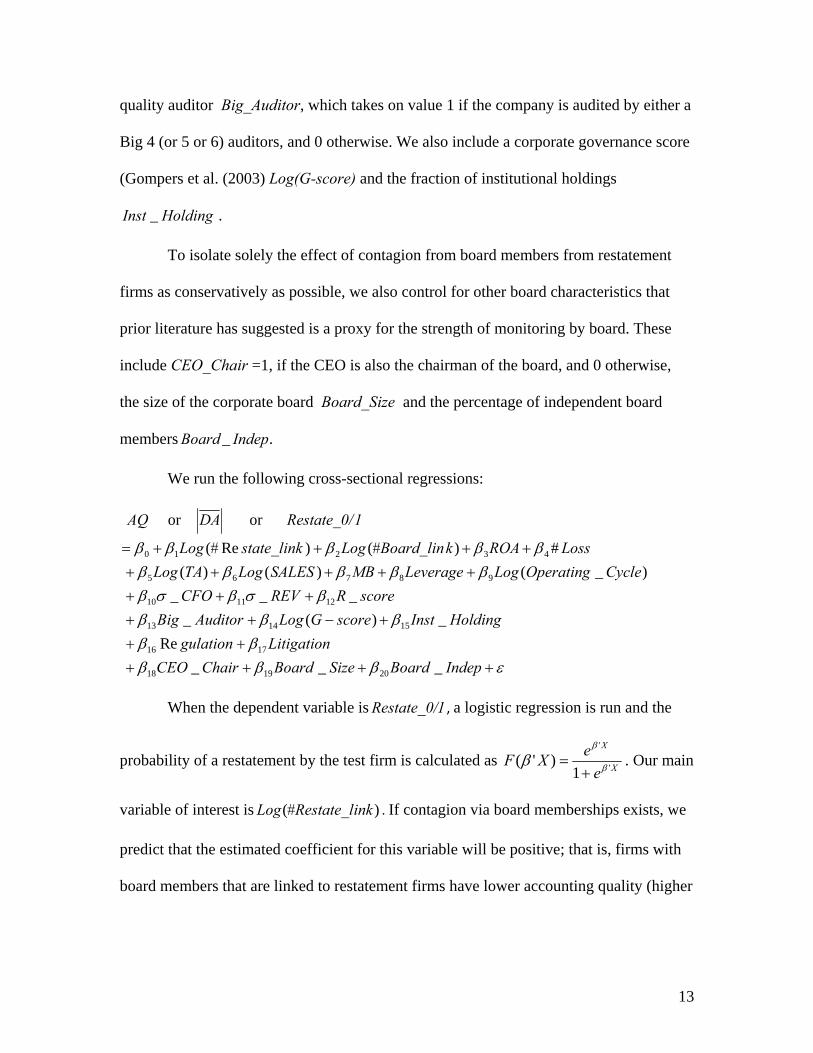
We run the following cross-sectional regressions:
εβββββ
ββββσβσβ
ββββββββββ
++++++
+−+++++
+++++++++=
IndepBoardSizeBoardChairCEOLitigationgulation
HoldingInstscoreGLogAuditorBigscoreRREVCFO
CycleOperatingLogLeverageMBSALESLogTALogLossROAk#Board_linLogstate_link#Log
1Restate_0/DAAQ
___Re
_)(____
)_()()(#)( )Re(
or or
201918
1716
151413
121110
98765
43210
When the dependent variable is 1Restate_0/ , a logistic regression is run and the
probability of a restatement by the test firm is calculated as X
X
eeXF '
'
1)'( β
β
β+
= . Our main
variable of interest is )( ink#Restate_lLog . If contagion via board memberships exists, we
predict that the estimated coefficient for this variable will be positive; that is, firms with
board members that are linked to restatement firms have lower accounting quality (higher

14
AQ, higher average absolute discretionary accruals, and a higher likelihood of
subsequently restating its own financial statements).
In addition to the main test variable, the estimated coefficient on the variable
)( k#Board_linLog carries as an interesting implication that is also new to the literature. It
picks up the effect of contagion effects on accounting quality from board interlocked
firms that did not restate their earnings. Relative to restatement firms, these firms are
likely to have higher accounting quality, so a significant negative coefficient (lower AQ
proxies for higher accounting quality) would imply that contagion can also trigger
positive imitations of financial reporting practices.
4. Empirical Results
4.1. Summary Statistics and correlations
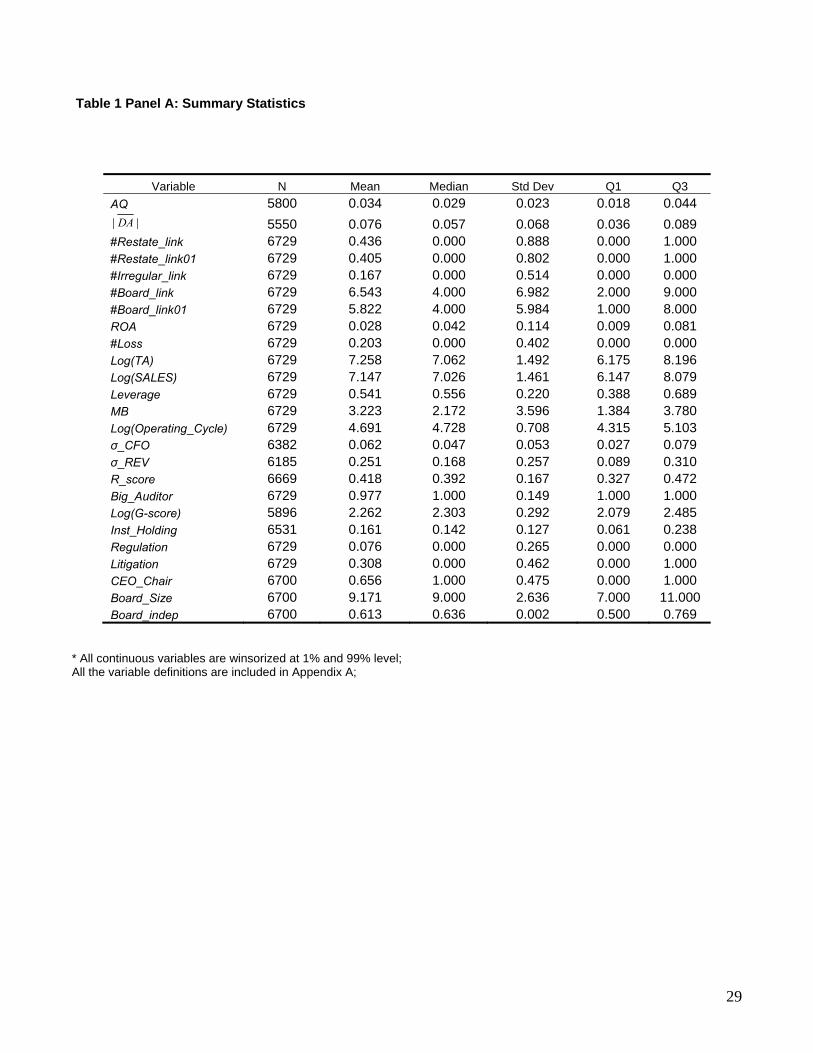
Table 1 Panel A presents the summary statistics for the variables used in our
analysis. The results show that the statistics for the accounting quality AQ and average
absolute value of discretionary accruals are comparable to other studies (e.g., Francis et al.
2005). On average, each firm observation in our sample, which covers S&P 1500 firms,
has 6.54 distinct board members who are also board members of other firms. If board
interlocks as counted as the number of distinct other companies with common board
members as the firm, the average number of links is 5.82. The median number of links is
4 for both measures of board interlocks.
Restatements are relatively infrequent in the population, so when the board links
are restricted to only restating firms, the mean and median numbers are drastically
reduced. The mean number of links is to 0.4 and the median is actually zero. Even at the

15
75th percentile, there is only one director linked to a restatement firm. Given the
difference between the mean and median numbers, the variable is likely skewed.
Therefore, the log measure may be more appropriate than the continuous measure of the
variable to use in the cross-sectional regression.
With regards to correlations reported in Panel B, R_score is highly correlated with
both cash flow volatility (σ_CFO) and revenue volatility (σ_REV) (0.458 and 0.485
respectively). Therefore, the coefficients of these variables should be interpreted with
care, and should be considered jointly rather than separately. (For robustness, we also
include these variables singly and then jointly in the regressions.)2
4.2. Board interlocks and earnings quality
The results for the cross-sectional regressions of accounting quality measure AQ
on contagion measures are reported in Table 2. In column (1), the coefficient on
Log(#Board_link) is –0.003 and highly statistically significant, implying that overall
board interlocks have a positive influence on accounting quality. When the board
members are linked to other restatement firms however the opposite is observed. The
coefficient on Log(#Restate_link) in Column (2) is 0.002, which is significantly positive
at less than 1% level. Thus, when a firm’s board is linked to firms with poor accounting
quality, the company’s accounting quality becomes contaminated as well. Column (3)
regression includes both Log(#Board_link) and Log(#Restate_link), and the results reveal
that the relations between board interlocks and accounting quality in columns (1) and (2)
separately are robust to inclusion of both variables.
2 For the brevity of the paper, these regression results are provided upon request.

16
The regression in column (4) further controls for an extensive set of firm
characteristics and corporate governance variables. The board interlock variable to
restating firms remains robust, but not the board interlock variable to the non-restating
firms. These results are shown to be robust in the column (5) regression where the
restatement board-link variable is binary instead of the log measure in column (4).
Together, this evidence suggests that among the governance variables, the firm-specific
board characteristics generally are more important in determining accounting quality
independent of whether its board members are linked to other boards unless the
association is to a restating firm. In this case, a board linkage to a restating firm results in
contamination of the accounting quality from the restating firm.
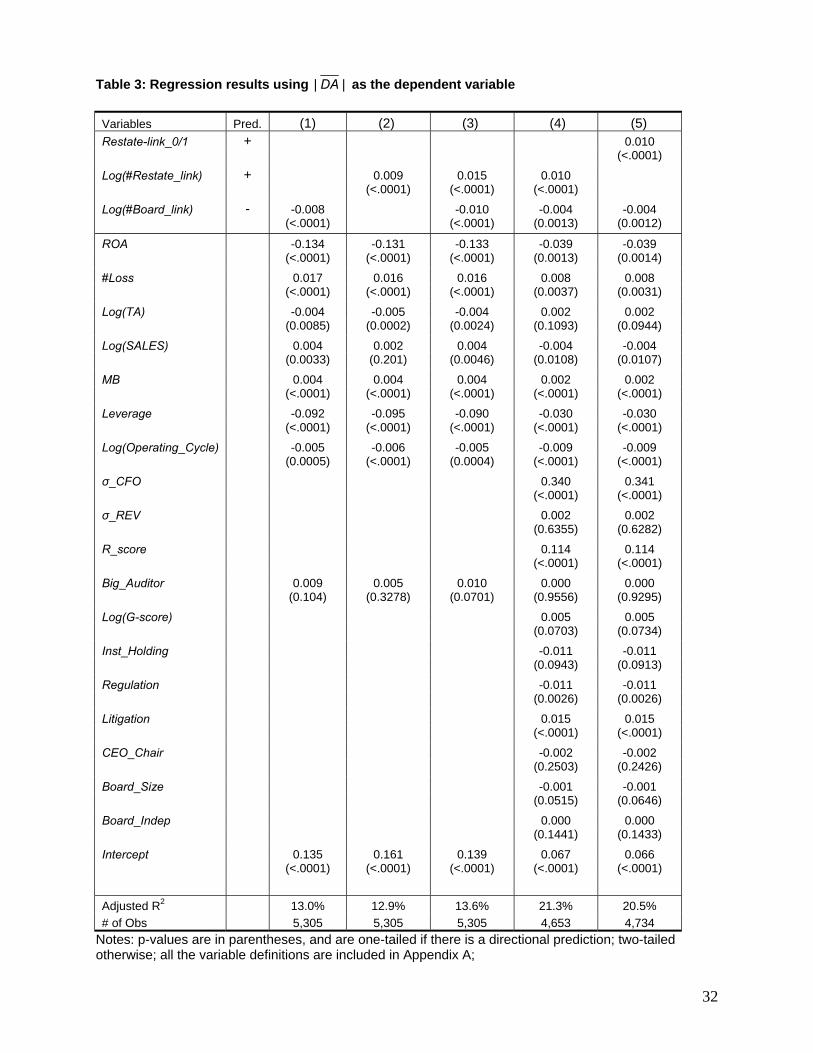
In Table 3, we report the results for the regression of accounting quality measured
as the absolute discretionary accruals on board interlock. All of the key results of Table 2
are shown to be robust, except that the board-linked variable to non-restating firms is also
significant when both board interlock variables and other board characteristics are
included in the regression. These results are highly statistically significant (less than 1%
p-values) and they suggest strong support for the presence of contagion – firms where the
board members are linked to poor accounting quality (restating) firms have more accruals
management whereas firms where the board members are linked to good accounting
quality (non-restating) firms seem to be deterred from accruals management. Comparing
the size of the coefficient of Log(#Restate_link) is much larger than the coefficient for
Log(#Board_link) suggesting that negative contagion effects may be stronger than
positive contagion effects.
17
In Table 4, we investigate the association between future restatements and board
interlocks. If the firm subsequently had to restate their financial statements, the
accounting quality in the period prior to the restatement is clearly poor. By isolating only
the most extreme cases in that only financial reporting that ultimately resulted in GAAP
violations as poor accounting quality, the regression is a more conservative test for
contagion effects. The contagion effects are strongly significant. A firm with boards
linked to restating firms experiences a much greater likelihood of ultimately restating
itself. On the other hand, a firm with boards linked to non-restating firms has a lower
likelihood of ultimately restating. For economic significance, the estimated coefficient in
column (5) suggests that the incremental probability of own firm future restatement from
the mere presence of having a board link to other restating firms is 2.24%. For
benchmark comparison, the unconditional probability of a restatement is 3.44%.
Therefore, the presence of a restatement-link alone explains 65.23% (2.24/3.44 = 65.23%)
of the unconditional likelihood of a restatement.
In sum, the evidence in Tables 2 through 4 supports a consistent message that
board contagion effects are present. When the board link is to poor accounting quality
firms, the firm also has poor accounting quality and when the board link is to a good
accounting quality firm, the firm also has good accounting quality.
4.3. Robustness Checks
We conduct several further robustness tests for the contagion effects reported
above. In Table 5, we limit the restatement link only to firms where the restatements were
the result of irregularities using the variable Log(#Irregular_link). These restatements are
18
cleaner examples of earnings manipulation than mere errors. Both the positive and
negative contagion results for board interlocks are robust for all three regressions using
different accounting quality measures for the dependent variable. In column (3)
regression, the dependent variable is the binary indicator of whether the firm itself
subsequently restated for reasons of irregularities.
In Table 6, we measure board interlocks by counting the number of links to
distinct restating companies regardless of the number of common board members shared
by the common firms. The conclusions are unchanged.
The main analysis determines the existence of infectious links (i.e., restate_link)
by investigating whether board members sat on any firm that restated financial reports in
the past 7 years. This implies that infectious agents affect board interlocked firms for a
considerable time. Therefore, we also consider a shorter history (3 years or 5 years) of
infectiousness. The results are robust for the shorter periods, and are not tabulated for
brevity.
Table 4 shows that a firm with board interlocks to other restating companies has
an increased propensity to restate its own financial statements down the road. Prior
studies show that firms that subsequently restated earnings have higher discretionary
accruals and poorer earnings quality in the periods leading up to the restatement (e.g.,
Richardson et al. 2002). Therefore skeptics might consider the results in Table 2 and 3 as
not entirely independent of the results in Table 4. To check whether board contagion also
exists for firms that did not ultimately restate its earnings, we eliminate these firms and
rerun the tests in Tables 2 and 3. Again, the results are robust (untabulated).

19
Finally, we investigate whether these results are period specific or extend to the
period subsequent to the passage of the Sarbanes-Oxley Act of 2002 when board
structures may have changed significantly. Extending our analysis to 2006, however, did
not change the results (untabulated). Therefore, our results do not appear to be time-
period sensitive.
4.4 Additional Analyses
We conduct several additional analyses to further our understanding of how board
interlocks affect the diffusion of accounting practice. As a member of the management
team, an inside director can be expected to have a greater influence on his fellow
management colleagues and the operations of his company. Therefore, we expect that an
inside director to be more likely to infect his firm with either good or bad accounting
practice from the other firms where he is also a board member.
We separate the #Restate_link related variables into two variables, one where the
board member is an inside director #Restate_Insider_link and the other where he is not.
For both the AQ and the probability of an ultimate restatement by own firm in column (1)
and column (3) respectively of Table 7, the previous results are robust. Of interest here is
that the new variable #Restate_Insider_link is also statistically significantly positive. When
accounting quality is measured using absolute discretionary accruals in column (2), the
results are similar but the statistical significance is weaker for the new insider variable.
Overall, the results imply that an insider director link to other restating firms strengthens
the infection.

20
Firms in similar industries tend to have similar accounting practices and face
common business conditions. The contamination that we document may be the result of
these common factors. However, one should not rule out contagion as a contributory
factor if contamination effects on accounting quality are seen in board links to firms in
similar industries. Firms in the same industry are competitors, and one firm’s advantage
from earnings management redounds to another firm’s disadvantage.3 In addition, there is
a concern for relative performance, as discussed by Hirshleifer and Teoh (2009), that may
create a strong incentive for a firm to manage earnings when directors observe that the
same industry peer firms are manipulating earnings.
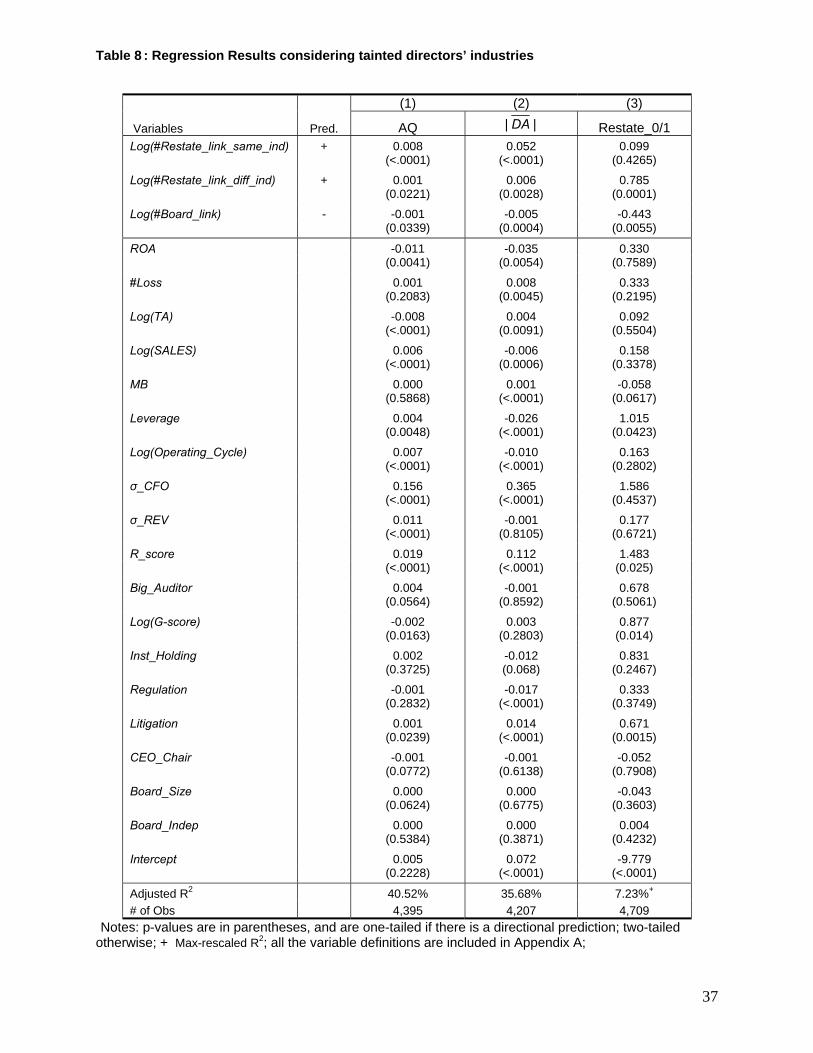
These effects together suggest that same industry contagion could indeed be
stronger than cross-industry contagion. To test this, we separate the restatement link
variable into a same industry (based on 2-digit SIC code) link variable versus a cross-
industry link variable. The results reported in columns (1) and (2) of Table 8 indeed
support this contention. Directors linked to the same industry restating firms are
associated with lower earnings quality. We test the coefficient differences for
Log(#Restate_link_same_ind) and Log(#Restate_link_diff_ind) in columns (1) and (2)
and find that the coefficients of Log(#Restate_link_same_ind) are significantly larger
than that of Log(#Restate_link_diff_ind) at the one percent level. The positive contagion
effect from links to firms without restatements remains the same. The result for column
(3) using the firm’s own restatement as the dependent variable seems contrary to the
above results. This may be because when a restating firm is required to restate, the
3 For instance, if a company is better financed with much more cash at a lower cost of capital than its competitor, it can afford expensive R&D investment and may dominate the market later on.

21
restatement-linked firm in the same industry may be put on notice to fix its accounting to
avert having to restate itself.
5. Conclusions
This paper studies the role of board interlocks in the propagation of corporate
practices, specifically financial reporting, by documenting that board interlocks to
restating firms reduce the earnings quality of a company and increase the likelihood of
the company to restate its financial reports. We provide evidence supportive of
Granovetter (1985)’s argument that economic actions are influenced by social networks
and contacts. More broadly, our findings suggest that social influence is important for
financial accounting practices.
Although our focus is on a particular type of social network, board interlocks,
other types of social networks may be important for financial reporting and business
decisions, such as social clubs for executives (e.g. golf clubs, or country clubs, and
school ties). Future studies might investigate the various types of social networks’
influence on financial reporting practices.
Our sample (which draws from the IRRC database) mainly focuses on the S&P
1500 companies. Earnings management contagion through boards of directors in small
companies and private firms are not considered. Social contacts may be even more
important in small businesses and private firms, so further empirical study of social
contagion across such firms is called for.
22
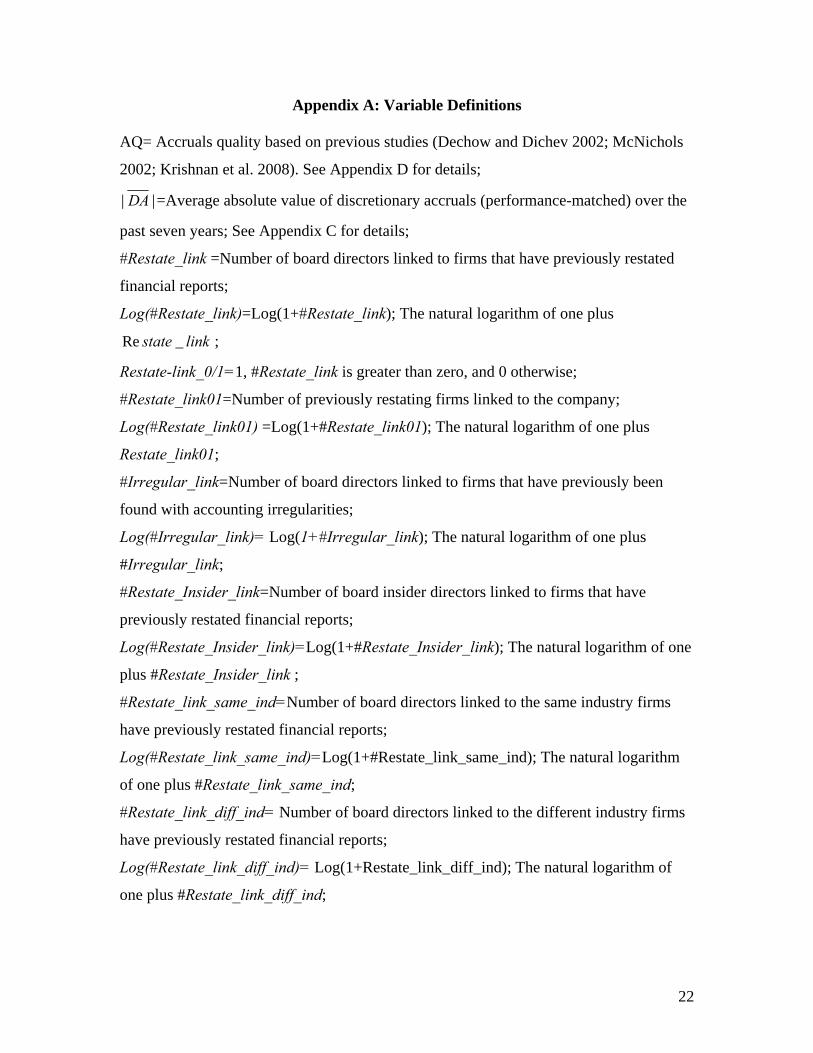
Appendix A: Variable Definitions
AQ= Accruals quality based on previous studies (Dechow and Dichev 2002; McNichols
2002; Krishnan et al. 2008). See Appendix D for details;
|| DA =Average absolute value of discretionary accruals (performance-matched) over the
past seven years; See Appendix C for details;
#Restate_link =Number of board directors linked to firms that have previously restated
financial reports;
Log(#Restate_link)=Log(1+#Restate_link); The natural logarithm of one plus
linkstate _Re ;
Restate-link_0/1=1, #Restate_link is greater than zero, and 0 otherwise;
#Restate_link01=Number of previously restating firms linked to the company;
Log(#Restate_link01) =Log(1+#Restate_link01); The natural logarithm of one plus
Restate_link01;
#Irregular_link=Number of board directors linked to firms that have previously been
found with accounting irregularities;
Log(#Irregular_link)= Log(1+#Irregular_link); The natural logarithm of one plus
#Irregular_link;
#Restate_Insider_link=Number of board insider directors linked to firms that have
previously restated financial reports;
Log(#Restate_Insider_link)=Log(1+#Restate_Insider_link); The natural logarithm of one
plus #Restate_Insider_link ;
#Restate_link_same_ind=Number of board directors linked to the same industry firms
have previously restated financial reports;
Log(#Restate_link_same_ind)=Log(1+#Restate_link_same_ind); The natural logarithm
of one plus #Restate_link_same_ind;
#Restate_link_diff_ind= Number of board directors linked to the different industry firms
have previously restated financial reports;
Log(#Restate_link_diff_ind)= Log(1+Restate_link_diff_ind); The natural logarithm of
one plus #Restate_link_diff_ind;
23
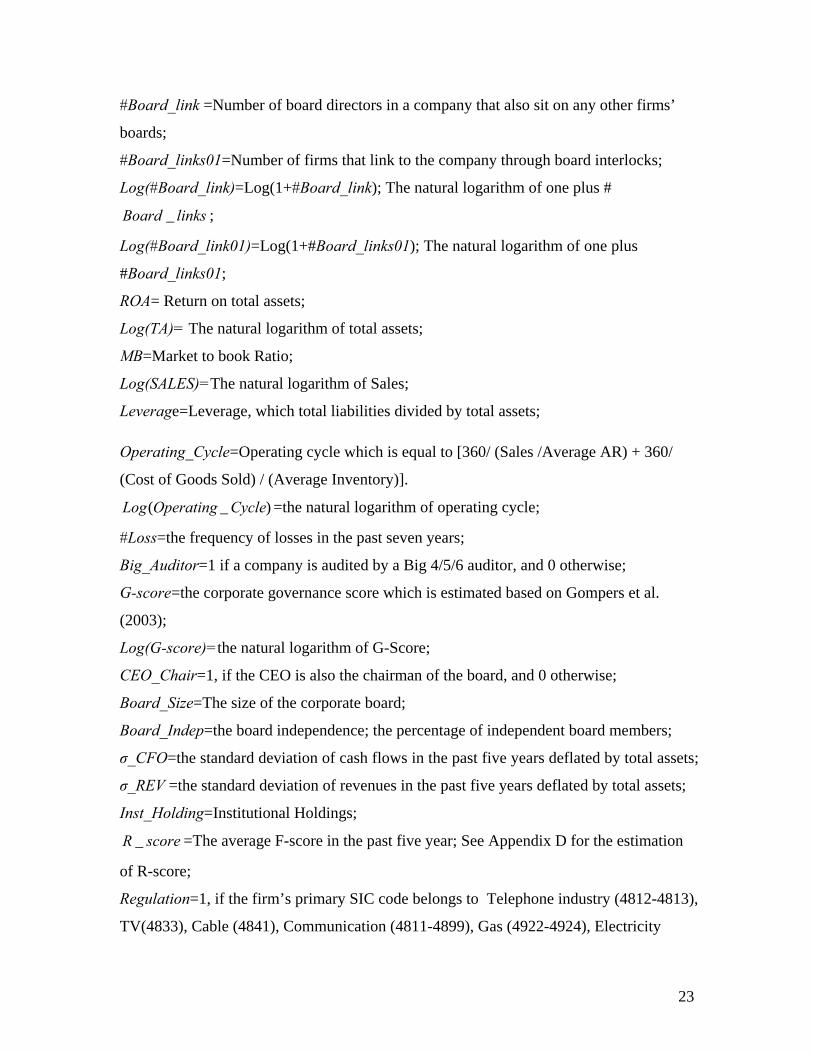
#Board_link =Number of board directors in a company that also sit on any other firms’
boards;
#Board_links01=Number of firms that link to the company through board interlocks;
Log(#Board_link)=Log(1+#Board_link); The natural logarithm of one plus #
linksBoard _ ;
Log(#Board_link01)=Log(1+#Board_links01); The natural logarithm of one plus
#Board_links01;
ROA= Return on total assets;
Log(TA)= The natural logarithm of total assets;
MB=Market to book Ratio;
Log(SALES)=The natural logarithm of Sales;
Leverage=Leverage, which total liabilities divided by total assets;
Operating_Cycle=Operating cycle which is equal to [360/ (Sales /Average AR) + 360/
(Cost of Goods Sold) / (Average Inventory)].
)_( CycleOperatingLog =the natural logarithm of operating cycle;
#Loss=the frequency of losses in the past seven years;
Big_Auditor=1 if a company is audited by a Big 4/5/6 auditor, and 0 otherwise;
G-score=the corporate governance score which is estimated based on Gompers et al.
(2003);
Log(G-score)=the natural logarithm of G-Score;
CEO_Chair=1, if the CEO is also the chairman of the board, and 0 otherwise;
Board_Size=The size of the corporate board;
Board_Indep=the board independence; the percentage of independent board members;
σ_CFO=the standard deviation of cash flows in the past five years deflated by total assets;
σ_REV =the standard deviation of revenues in the past five years deflated by total assets;
Inst_Holding=Institutional Holdings;
scoreR _ =The average F-score in the past five year; See Appendix D for the estimation
of R-score;
Regulation=1, if the firm’s primary SIC code belongs to Telephone industry (4812-4813),
TV(4833), Cable (4841), Communication (4811-4899), Gas (4922-4924), Electricity

24
(4931), Water (4941), Financial firms (6021-6023, 6035-6036,6141, 6311,6321,6331);
and 0 otherwise; See Kasznik and Lev (1995);
Litigation =1, if the firm’s primary SIC code belongs to Biotechnology (2833-2836),
Computers (7370-7374), Electronics (3600-3674), and Retailing (5200-5961); and 0
otherwise. See Matsumoto (2002).
Appendix B: Estimation of Accruals Quality (AQ)
We compute accruals quality according to prior studies (e.g.,Dechow and Dichev 2002;
McNichols 2002; Francis et al. 2005; Krishnan et al. 2008; Doyle et al. 2007).
Specifically, we run the following regressions by industry and year:
ttttttt PPEbSALEbCFObCFObCFObbWC ε++Δ++++=Δ +− 54132110 ****
Where WCΔ is the change in working capital accruals from year t-1 to year t. CFO is cash
flow from operations. The residuals from the regression measure the extent to which
current accruals ( WCΔ ) do not map into past, present or future cash flows. Following the
prior studies, we also include the change of sales ( SALEΔ ) and the property, plant and
equipment. We first estimate the above regression cross-sectionally by year within each
of the SIC 2 digit industry classifications. If an industry group has fewer than 16
observations in any given year, we exclude those observations in that industry-year
group. We then calculate the standard deviation of residuals (AQ) for the past seven years
that requires a minimum of five years of the data.
Appendix C: Estimation of abnormal (discretionary) accruals (DAPMMJ)
I estimate abnormal accruals by using the performance-matched modified-Jones (PMMJ)
model. The procedure is similar to that used in previous studies, such as Li et al. (2007)
and Kothari et al. (2005). I first compute total accruals using data from the statement of
cash flows (Hribar and Collins 2002):
TAccit = EBEIit - (CFOit – EIDOit), …………………………………………. (1)
where: TAccit = firm i’s total accruals in year t;

25
EBEIit = firm i’s income before extraordinary items in year t;
CFOit = firm i’s cash flows from operations in year t;
EIDOit = firm i’s extraordinary items and discontinued operations included in CFOit in
year t.
I then estimate discretionary accruals based on the modified-Jones model.
itititittiit PPEARSalesAssetsTAcc νδδδδ ++Δ−Δ++= − 321,10 )()/1( ……..(2)
where: Assetsi,t-1 = firm i’s total assets (in year t-1;
∆Salesit = change in firm i’s sales from year t-1 to t;
∆ARit = change in firm i’s accounts receivable from operating activities from year t-1 to t;
PPEit = firm i’s gross property, plant, and equipment in year t.
I include ∆ARit in the estimation since I have no prior knowledge to identify non-
earnings management firms and earnings management firms (e.g., Kothari et al., 2005).
In addition, I exclude all firm-year observations where there are fewer than 16
observations in any two digit SIC code in any given year.
I scale all variables by beginning-of-year total assets.
I define the normal accrual (NAMJit) and discretionary accrual (DAMJ
it) metrics as:
ititittiitMJ PPEARSalesAssetsNA 321,10
ˆ)(ˆ)/1(ˆˆ δδδδ +Δ−Δ++= − ….........(3)
itMJ
ititMJ NATAccDA −= ……………………………………………………(4)
Finally, for each year, I partition the sample into deciles by ranking firms within the two-
digit SIC industries by the current year’s return on assets (ROAit), which is defined as net
income before extraordinary items divided by beginning-of-year total assets. DAPMMJ is
the difference between firm i’s year t modified Jones model accruals and the median
value for its joint industry and ROA deciles, where the median calculation excludes firm
i.

26
Appendix D: Estimation of R-score
We compute the R-score according to the model developed by Dechow et al. (2009). The
estimation of a firm’s R-score each year consists of two steps. First, the predicted value is
obtained using the following model with the corresponding coefficients for each variable.
predit=-6.591 +1.019* rsst_accit + 2.173* ch_recit + 2.676* ch_invit +.097* ch_csit -
1.412* ch_earnit +.478* issue -.209* ch_empit +.516* leasedumit -.134* bmit + .068* retit-
1
where,
rsst_accit= firm i’s RSST accruals in year t (see Richardson et al. 2005);
ch_recit = firm i’s change in receivables in year t;
ch_invit = firm i’s change in inventory in year t;
ch_csit = firm i’s change in cash sales in year t;
ch_earnit = firm i’s change in earnings in year t;
issue= an indicator variable which equals 1 if firm I issued securities in year t;
ch_empit = firm i’s Abnormal change in employees in year t;
leasedumit = an indicator variable which equals 1 if firm i’s future operating lease
obligation are greater than zero in year t;
bmit= firm i’s book to market ratio in year t;
retit-1 = firm i’s market-adjusted stock return in year t-1;
Then the predicted probability of restatement is calculated as,
)1(Pr
it
it
pred
pred
it eeobability+
=
The R-score is the ratio of the predicted probability of restatement times 100.

27
References Banerjee, A. V. 1992. A Simple-Model of Herd Behavior. Quarterly Journal of
Economics 107 (3):797-817. Bikhchandani, S., D. Hirshleifer, and I. Welch. 1992. A theory of fads, fashion, custom,
and cultural-change as informational cascades. Journal of Political Economy 100 (5):992-1026.
Bizjak, J., M. Lemmon, and R. Whitby. 2009. Option Backdating and Board Interlocks. Rev. Financ. Stud.:hhn120.
Davis, G. F. 1991. Agents without Principles? The Spread of the Poison Pill through the Intercorporate Network. Administrative Science Quarterly 36 (4):583.
Dechow, P. M., and I. D. Dichev. 2002. The quality of accruals and earnings: The role of accrual estimation errors. Accounting Review 77:35-59.
Defond, M., J. R. Francis, and X. Hu. 2009. The Geography of Auditor Independence and SEC Enforcement: AAA.
Doyle, J., W. Ge, and S. McVay. 2007. Accruals quality and internal control over financial reporting. Accounting Review 82 (5):1141-1170.
Fich, E. M., and A. Shivdasani. 2007. Financial fraud, director reputation, and shareholder wealth. Journal of Financial Economics 86 (2):306-336.
Francis, J., R. LaFond, P. Olsson, and K. Schipper. 2005. The market pricing of accruals quality. Journal of Accounting & Economics 39 (2):295-327.
Gleason, C. A., N. T. Jenkins, and W. B. Johnson. 2008. The contagion effects of accounting restatements. Accounting Review 83 (1):83-110.
Gompers, P., J. Ishii, and A. Metrick. 2003. Corporate Governance and Equity Prices. Quarterly Journal of Economics 118 (1):107-155.
Granovetter, M. 1985. Economic-Action and Social-Structure - the Problem of Embeddedness. American Journal of Sociology 91 (3):481-510.
Haunschild, P. R. 1993. Interorganizational imitation - The impact of interlocks on corporate acquisition activity. Administrative Science Quarterly 38 (4):564-592.
Healy, P. M. 1985. The Effect of Bonus Schemes on Accounting Decisions. Journal of Accounting & Economics 7 (1-3):85-107.
Hennes, K. M., A. J. Leone, and B. P. Miller. 2008. The Importance of Distinguishing Errors from Irregularities in Restatement Research: The Case of Restatements and CEO/CFO. Accounting Review 83 (6):1487-1519.
Hirshleifer, D., and S. H. Teoh. 2003. Herd Behaviour and Cascading in Capital Markets: a Review and Synthesis. European Financial Management 9 (1):25-66.
———. 2009. Contagion in capital markets. In Handbook of Financial Markets: Dynamics and Evolution, edited by W. Ziemba: Elsevier/North-Holland.
Hribar, P., and D. W. Collins. 2002. Errors in estimating accruals: Implications for empirical research. Journal of Accounting Research 40 (1):105-134.
Hribar, P., and C. Nichols. 2007. The Use of Unsigned Earnings Quality Measures in Tests of Earnings Management. Journal of Accounting Research 45 (5):1017-1053.
Jones, J. J. 1991. Earnings Management During Import Relief Investigations. Journal of Accounting Research 29 (2):193-228.
28
Kasznik, R., and B. Lev. 1995. To warn or not to warn-management disclosures in the face of an earnings surprise. Accounting Review 70 (1):113-134.
Kedia, K., and S. Rajgopal. 2008a. Geography and the incidence of financial misreporting: University of Washington
Kedia, S., and S. Rajgopal. 2008b. Neighborhood Matters: The Impact of Location on Broad Based Option Plans. Journal of Financial Economics Forthcoming.
Kothari, S. P., A. J. Leone, and C. E. Wasley. 2005. Performance matched discretionary accrual measures. Journal of Accounting and Economics 39 (1):163-197.
Krishnan, G. V., B. Srinidhi, and L. Su. 2008. Inventory policy, accruals quality and information risk. Review of Accounting Studies 13 (2-3):369-410.
Li, H., M. P. Pincus, and S. O. Rego. 2007. Market reaction to events surrounding the Sarbanes-Oxley Act of 2002 and earnings management. Journal of Law & Economics Forthcoming.
Matsumoto, D. A. 2002. Management's incentives to avoid negative earnings surprises. Accounting Review 77 (3):483-514.
McNichols, M. F. 2002. Discussion of the quality of accruals and earnings: The role of accrual estimation errors. Accounting Review 77:61-69.
Palmrose, Z. V., V. J. Richardson, and S. Scholz. 2004. Determinants of market reactions to restatement announcements. Journal of Accounting & Economics 37 (1):59-89.
Palmrose, Z. V., and S. Scholz. 2004. The circumstances and legal consequences of non-GAAP reporting: Evidence from restatements. Contemporary Accounting Research 21 (1):139-180.
Rao, H., G. F. Davis, and A. Ward. 2000. Embeddedness, social identity and mobility: Why firms leave the NASDAQ and join the New York Stock Exchange. Administrative Science Quarterly 45 (2):268-292.
Richardson, S. A., A. I. Tuna, and M. Wu. 2002. Predicting Earnings Management: The Case of Earnings Restatements: SSRN.
Sah, R. K. 1991. Social Osmosis and Patterns of Crime. Journal of Political Economy 99 (6):1272-1295.
29
Table 1 Panel A: Summary Statistics
* All continuous variables are winsorized at 1% and 99% level; All the variable definitions are included in Appendix A;
Variable N Mean Median Std Dev Q1 Q3
AQ 5800 0.034 0.029 0.023 0.018 0.044 || DA 5550 0.076 0.057 0.068 0.036 0.089
#Restate_link 6729 0.436 0.000 0.888 0.000 1.000 #Restate_link01 6729 0.405 0.000 0.802 0.000 1.000 #Irregular_link 6729 0.167 0.000 0.514 0.000 0.000 #Board_link 6729 6.543 4.000 6.982 2.000 9.000 #Board_link01 6729 5.822 4.000 5.984 1.000 8.000 ROA 6729 0.028 0.042 0.114 0.009 0.081 #Loss 6729 0.203 0.000 0.402 0.000 0.000 Log(TA) 6729 7.258 7.062 1.492 6.175 8.196 Log(SALES) 6729 7.147 7.026 1.461 6.147 8.079 Leverage 6729 0.541 0.556 0.220 0.388 0.689 MB 6729 3.223 2.172 3.596 1.384 3.780 Log(Operating_Cycle) 6729 4.691 4.728 0.708 4.315 5.103 σ_CFO 6382 0.062 0.047 0.053 0.027 0.079 σ_REV 6185 0.251 0.168 0.257 0.089 0.310 R_score 6669 0.418 0.392 0.167 0.327 0.472 Big_Auditor 6729 0.977 1.000 0.149 1.000 1.000 Log(G-score) 5896 2.262 2.303 0.292 2.079 2.485 Inst_Holding 6531 0.161 0.142 0.127 0.061 0.238 Regulation 6729 0.076 0.000 0.265 0.000 0.000 Litigation 6729 0.308 0.000 0.462 0.000 1.000 CEO_Chair 6700 0.656 1.000 0.475 0.000 1.000 Board_Size 6700 9.171 9.000 2.636 7.000 11.000 Board_indep 6700 0.613 0.636 0.002 0.500 0.769

30
Table 1 Panel B Pearson Correlation Table
Log(#restate_link) A A B C D E F G H I J K L M N O P Q R S
Log(#Board_Link) B 0.421 <.0001 ROA C -0.008 0.076 0.500 <.0001 #Loss D 0.012 -0.098 -0.689 0.326 <.0001 <.0001 Log(TA) E 0.321 0.579 0.115 -0.159 <.0001 <.0001 <.0001 <.0001 Log(SALES) F 0.316 0.592 0.235 -0.245 0.884 <.0001 <.0001 <.0001 <.0001 <.0001 Leverage G 0.138 0.327 -0.166 0.035 0.446 0.422 <.0001 <.0001 <.0001 0.004 <.0001 <.0001 MB H 0.054 0.131 0.210 -0.129 0.095 0.100 -0.044 <.0001 <.0001 <.0001 <.0001 <.0001 <.0001 0.000 Log(Operating Cycle) I 0.033 0.040 -0.049 0.037 0.054 -0.088 0.001 -0.001 0.007 0.001 <.0001 0.002 <.0001 <.0001 0.903 0.940 σ_CFO J -0.071 -0.248 -0.254 0.260 -0.314 -0.317 -0.225 0.074 -0.043 <.0001 <.0001 <.0001 <.0001 <.0001 <.0001 <.0001 <.0001 0.001 σ_REV K -0.036 -0.161 -0.155 0.158 -0.153 -0.043 -0.070 -0.021 -0.166 0.490 0.004 <.0001 <.0001 <.0001 <.0001 0.001 <.0001 0.101 <.0001 <.0001 R_score L -0.057 -0.180 -0.186 0.174 -0.132 -0.144 -0.249 0.128 0.097 0.458 0.485 <.0001 <.0001 <.0001 <.0001 <.0001 <.0001 <.0001 <.0001 <.0001 <.0001 <.0001 Big_Auditor M 0.036 0.127 -0.027 0.022 0.084 0.070 0.090 0.046 -0.045 -0.025 0.008 0.004 0.004 <.0001 0.029 0.070 <.0001 <.0001 <.0001 0.000 0.000 0.046 0.522 0.756 Log(G-score) N 0.103 0.279 0.058 -0.072 0.153 0.187 0.150 -0.046 0.012 -0.194 -0.079 -0.188 0.042 <.0001 <.0001 <.0001 <.0001 <.0001 <.0001 <.0001 0.001 0.356 <.0001 <.0001 <.0001 0.001 Inst_Holding O -0.026 -0.105 -0.050 0.091 -0.188 -0.162 0.001 -0.124 0.025 0.042 0.075 0.005 -0.014 -0.062 0.039 <.0001 <.0001 <.0001 <.0001 <.0001 0.918 <.0001 0.042 0.001 <.0001 0.684 0.269 <.0001 Regulation P -0.018 0.017 -0.043 -0.024 0.233 0.068 0.211 -0.085 -0.051 -0.143 -0.119 -0.192 0.036 0.024 -0.104 0.133 0.166 0.000 0.054 <.0001 <.0001 <.0001 <.0001 <.0001 <.0001 <.0001 <.0001 0.003 0.060 <.0001 Litigation Q -0.014 -0.154 -0.106 0.136 -0.141 -0.107 -0.332 0.157 -0.034 0.303 0.113 0.306 0.011 -0.143 -0.012 -0.191 0.252 <.0001 <.0001 <.0001 <.0001 <.0001 <.0001 <.0001 0.005 <.0001 <.0001 <.0001 0.389 <.0001 0.318 <.0001 CEO_Chair R 0.067 0.124 0.023 -0.038 0.145 0.149 0.101 0.028 0.001 -0.060 -0.027 -0.026 0.029 0.105 -0.018 0.030 -0.047 <.0001 <.0001 0.063 0.002 <.0001 <.0001 <.0001 0.023 0.962 <.0001 0.037 0.036 0.018 <.0001 0.152 0.014 0.000 Board_Size S 0.223 0.545 0.126 -0.165 0.563 0.548 0.327 0.043 0.015 -0.332 -0.189 -0.245 0.040 0.238 -0.165 0.130 -0.228 0.040 <.0001 <.0001 <.0001 <.0001 <.0001 <.0001 <.0001 0.001 0.234 <.0001 <.0001 <.0001 0.001 <.0001 <.0001 <.0001 <.0001 0.001 Board_Indep T 0.197 0.330 -0.019 -0.009 0.168 0.153 0.140 0.000 0.011 -0.082 -0.061 -0.141 0.086 0.294 0.026 0.015 -0.061 0.158 0.086 <.0001 <.0001 0.125 0.470 <.0001 <.0001 <.0001 0.994 0.356 <.0001 <.0001 <.0001 <.0001 <.0001 0.036 0.215 <.0001 <.0001 <.0001

31
Table 2: Regression Results using Accruals Quality (AQ) as the dependent Variable
Variables Pred. (1) (2) (3) (4) (5) Restate-link_0/1 + 0.002
(0.0034)
Log(#Restate-link) + 0.002 0.003 0.002 (0.0018) (<.0001) (0.0014)
Log(#Board-link) - -0.003 -0.003 -0.000 -0.000 (<.0001) (<.0001) (0.2059) (0.2314)
ROA -0.038 -0.037 -0.038 -0.010 -0.010 (<.0001) (<.0001) (<.0001) (0.0063) (0.0064)
#Loss 0.005 0.005 0.005 0.001 0.001 (<.0001) (<.0001) (<.0001) (0.2598) (0.2413) Log(TA) -0.010 -0.011 -0.010 -0.008 -0.008
(<.0001) (<.0001) (<.0001) (<.0001) (<.0001)
Log(SALES) 0.008 0.007 0.008 0.006 0.006 (<.0001) (<.0001) (<.0001) (<.0001) (<.0001)
Leverage -0.011 -0.011 -0.010 0.003 0.003 (<.0001) (<.0001) (<.0001) (0.0501) (0.0541)
MB 0.001 0.001 0.001 0.000 0.000 (<.0001) (<.0001) (<.0001) (0.1012) (0.1)
Log(Operating_Cycle) 0.007 0.006 0.007 0.007 0.007 (<.0001) (<.0001) (<.0001) (<.0001) (<.0001)
σ_CFO 0.158 0.158 (<.0001) (<.0001)
σ_REV 0.012 0.012 (<.0001) (<.0001)
R_score 0.016 0.016 (<.0001) (<.0001)
Big_Auditor 0.001 0.000 0.001 -0.002 -0.002 (0.5434) (0.9660) (0.4606) (0.3465) (0.3468)
Log(G-score) -0.001 -0.001 (0.1221) (0.1203)
Inst_Holding 0.003 0.003 (0.1523) (0.157)
Regulation -0.000 -0.000 (0.6997) (0.6934)
Litigation 0.002 0.002 (0.0005) (0.0005)
CEO_Chair -0.001 -0.001 (0.2457) (0.2403)
Board_Size -0.000 -0.000 (0.0029) (0.0032)
Board_Indep -0.000 -0.000 (0.0586) (0.0633)
Intercept 0.0289 0.036 0.030 0.007 0.007 (<.0001) (<.0001) (<.0001) (0.0557) (0.0649)
Adjusted R2 22.50% 21.99% 22.83% 39.78% 39.76% # of Obs 5,800 5,800 5,800 5,023 5,023
Notes: p-values are in parentheses, and are one-tailed if there is a directional prediction; two-tailed otherwise; all the variable definitions are included in Appendix A;
32
Table 3: Regression results using || DA as the dependent variable Variables Pred. (1) (2) (3) (4) (5) Restate-link_0/1 + 0.010
(<.0001)
Log(#Restate_link) + 0.009 0.015 0.010 (<.0001) (<.0001) (<.0001)
Log(#Board_link) - -0.008 -0.010 -0.004 -0.004 (<.0001) (<.0001) (0.0013) (0.0012)
ROA -0.134 -0.131 -0.133 -0.039 -0.039 (<.0001) (<.0001) (<.0001) (0.0013) (0.0014)
#Loss 0.017 0.016 0.016 0.008 0.008 (<.0001) (<.0001) (<.0001) (0.0037) (0.0031)
Log(TA) -0.004 -0.005 -0.004 0.002 0.002 (0.0085) (0.0002) (0.0024) (0.1093) (0.0944)
Log(SALES) 0.004 0.002 0.004 -0.004 -0.004 (0.0033) (0.201) (0.0046) (0.0108) (0.0107)
MB 0.004 0.004 0.004 0.002 0.002 (<.0001) (<.0001) (<.0001) (<.0001) (<.0001)
Leverage -0.092 -0.095 -0.090 -0.030 -0.030 (<.0001) (<.0001) (<.0001) (<.0001) (<.0001)
Log(Operating_Cycle) -0.005 -0.006 -0.005 -0.009 -0.009 (0.0005) (<.0001) (0.0004) (<.0001) (<.0001)
σ_CFO 0.340 0.341 (<.0001) (<.0001)
σ_REV 0.002 0.002 (0.6355) (0.6282)
R_score 0.114 0.114 (<.0001) (<.0001)
Big_Auditor 0.009 0.005 0.010 0.000 0.000 (0.104) (0.3278) (0.0701) (0.9556) (0.9295)
Log(G-score) 0.005 0.005 (0.0703) (0.0734)
Inst_Holding -0.011 -0.011 (0.0943) (0.0913)
Regulation -0.011 -0.011 (0.0026) (0.0026)
Litigation 0.015 0.015 (<.0001) (<.0001)
CEO_Chair -0.002 -0.002 (0.2503) (0.2426)
Board_Size -0.001 -0.001 (0.0515) (0.0646)
Board_Indep 0.000 0.000 (0.1441) (0.1433)
Intercept 0.135 0.161 0.139 0.067 0.066 (<.0001) (<.0001) (<.0001) (<.0001) (<.0001)
Adjusted R2 13.0% 12.9% 13.6% 21.3% 20.5% # of Obs 5,305 5,305 5,305 4,653 4,734
Notes: p-values are in parentheses, and are one-tailed if there is a directional prediction; two-tailed otherwise; all the variable definitions are included in Appendix A;

33
Table 4: Logistic Regression (Dependable Variable is Restate_0/1) Variables Pred. (1) (2) (3) (4) (5) Restate-link_0/1 + 0.718
(0.0001)
Log(#Restate_link) + 0.506 0.753 0.817 (0.0007) (<.0001) (<.0001)
Log(#Board_link) - -0.265 -0.424 -0.426 -0.396 (0.0039) (<.0001) (0.0009) (0.0018)
ROA -2.087 -1.900 -1.958 -0.469 -0.479 (0.0044) (0.0095) (0.0076) (0.6374) (0.6318)
#Loss 0.298 0.248 0.246 0.216 0.233 (0.1842) (0.2709) (0.2732) (0.3979) (0.3637)
Log(TA) -0.021 -0.070 -0.041 0.030 0.048 (0.8476) (0.5371) (0.7122) (0.84) (0.7428)
Log(SALES) 0.297 0.176 0.272 0.186 0.189 (0.0149) (0.149) (0.0271) (0.2318) (0.2211)
MB -0.030 -0.038 -0.030 -0.053 -0.053 (0.2114) (0.1129) (0.2122) (0.0815) (0.0793)
Leverage 0.322 0.311 0.426 0.707 0.677 (0.3952) (0.4088) (0.2583) (0.1344) (0.1534)
Log(Operating_Cycle) 0.260 0.227 0.250 0.240 0.239 (0.0215) (0.0483) (0.028) (0.0847) (0.0862)
σ_CFO 1.872 1.907 (0.3457) (0.337)
σ_REV 0.145 0.149 (0.715) (0.7068)
R_score 1.100 1.083 (0.0814) (0.0845)
Big_Auditor 0.796 0.642 0.847 0.498 0.493 (0.2701) (0.372) (0.2407) (0.4942) (0.4991)
Log(G-score) 0.959 0.955 (0.0038) (0.0039)
Inst_Holding 0.691 0.688 (0.2999) (0.3001)
Regulation 0.715 0.711 (0.0268) (0.0272)
Litigation 0.574 0.579 (0.0039) (0.0038)
CEO_Chair -0.131 -0.135 (0.4634) (0.4488)
Board_Size -0.026 -0.022 (0.5388) (0.6027)
Board_Indep 0.004 0.005 (0.3902) (0.3176)
Intercept -7.278 -6.275 -6.977 -9.718 -9.951 (<.0001) (<.0001) (<.0001) (<.0001) (<.0001)
Max-rescaled R2 3.15% 3.33% 4.32% 6.79% 6.46% # of Obs 6,729 6,729 6,729 5,399 5,399
Notes: p-values are in parentheses, and are one-tailed if there is a directional prediction; two-tailed otherwise; all the variable definitions are included in Appendix A;

34
Table 5 Regressions using Accounting Irregularities (1997-2002): (1) (2) (3)
Variables Pred. AQ || DA Irregularities_0/1 Log(#Irregular_link) + 0.002 0.009 0.760
(0.0068) (0.0003) (0.0008)
Log(#Board_link) - -0.000 -0.003 -0.332 (0.0068) (0.0107) (0.0059)
ROA -0.010 -0.040 -0.503 (0.0066) (0.0011) (0.6136)
#Loss 0.001 0.009 0.252 (0.2194) (0.0021) (0.3246)
Log(TA) -0.008 0.003 0.040 (<.0001) (0.0833) (0.784)
Log(SALES) 0.006 -0.004 0.207 (<.0001) (0.0148) (0.1821)
MB 0.000 0.002 -0.053 (0.1009) (<.0001) (0.0835)
Leverage 0.003 -0.031 0.622 (0.0606) (<.0001) (0.1884)
Log(Operating_Cycle) 0.007 -0.009 0.256 (<.0001) (<.0001) (0.0678)
σ_CFO 0.158 0.342 2.026 (<.0001) (<.0001) (0.3031)
σ_REV 0.012 0.002 0.143 (<.0001) (0.6323) (0.7169)
R_score 0.016 0.113 1.066 (<.0001) (<.0001) (0.09)
Big_Auditor -0.002 0.000 0.471 (0.3261) (0.9752) (0.5181)
Log(G-score) -0.001 0.005 0.959 (0.1243) (0.0709) (0.0037)
Inst_Holding 0.003 -0.010 0.840 (0.1231) (0.134) (0.2043)
Regulation 0.000 -0.012 0.712 (0.6602) (0.0016) (0.0275)
Litigation 0.002 0.015 0.613 (0.0003) (<.0001) (0.0021)
CEO_Chair -0.001 -0.002 -0.139 (0.2138) (0.2146) (0.4367)
Board_Size 0.000 -0.001 -0.019 (0.0037) (0.0565) (0.648)
Board_Indep 0.000 0.000 0.005 (0.0717) (0.0995) (0.3077)
Intercept 0.006 0.064 -10.087 (0.076) (<.0001) (<.0001)
Adjusted R2 39.75% 32.18% 6.1%+
# of Obs 5,023 4,838 5,399 Notes: p-values are in parentheses, and are one-tailed if there is a directional prediction; two-tailed otherwise; + Max-rescaled R2; all the variable definitions are included in Appendix A;

35
Table 6: Regression results using an alternative way to measure board interlocks
Variables Pred.
(1) (2) (3)
AQ || DA Restate_0/1 Log(#Restate_link 01) + 0.002 0.011 0.790
(0.001) (<.0001) (<.0001)
Log(#Board_links01) - -0.000 -0.004 -0.399 (0.1579) (0.0041) (0.0029)
ROA -0.010 -0.039 -0.451 (0.0062) (0.0014) (0.6496)
#Loss 0.001 0.008 0.218 (0.2589) (0.0038) (0.3933)
Log(Operating_Cycle) 0.007 -0.009 0.241 (<.0001) (<.0001) (0.0848)
Log(TA) -0.008 0.002 0.033 (<.0001) (0.1155) (0.8245)
Log(SALES) 0.006 -0.004 0.182 (<.0001) (0.0093) (0.244)
MB 0.000 0.002 -0.053 (0.0928) (<.0001) (0.0822)
Leverage 0.003 -0.030 0.698 (0.0491) (<.0001) (0.1394)
σ_CFO 0.158 0.340 1.839 (<.0001) (<.0001) (0.3532)
σ_REV 0.012 0.002 0.157 (<.0001) (0.6062) (0.6923)
R_score 0.016 0.114 1.092 (<.0001) (<.0001) (0.0832)
Big_Auditor -0.001 0.000 0.475 (0.3552) (0.9917) (0.5144)
Log(G-score) -0.001 0.005 0.954 (0.1275) (0.078) (0.004)
Inst_Holding 0.003 -0.011 0.698 (0.1528) (0.0917) (0.2945)
Regulation 0.000 -0.012 0.695 (0.6689) (0.0025) (0.0316)
Litigation 0.002 0.015 0.576 (0.0006) (<.0001) (0.0038)
CEO_Chair -0.001 -0.002 -0.128 (0.2486) (0.2581) (0.4745)
Board_Size 0.000 -0.001 -0.031 (0.0033) (0.0361) (0.471)
Board_Indep 0.000 0.000 0.004 (0.0653) (0.1799) (0.3931)
Intercept 0.007 0.068 -9.674 (0.0628) (<.0001) (<.0001)
Adjusted R2 39.79% 32.41% 6.48%+
# of Obs 5,023 4,838 5,399 Notes: p-values are in parentheses, and are one-tailed if there is a directional prediction; two-tailed otherwise; + Max-rescaled R2; all the variable definitions are included in Appendix A;

36
Table 7 : Regression Results considering Insiders
Variables Pred.
(1) (2) (3)
AQ || DA Restate_0/1 Log(#Restate_Insider_link) + 0.004 0.006 0.710
(0.0081) (0.1165) (0.0423)
Log(#Restate_link) + 0.001 0.009 0.683 (0.0205) (<.0001) (0.0006)
Log(#Board_link) - -0.001 -0.006 -0.528 (0.0466) (0.0001) (0.0012)
ROA -0.011 -0.039 0.279 (0.0035) (0.0021) (0.796)
#Loss 0.001 0.009 0.318 (0.1493) (0.0015) (0.2395)
Log(TA) -0.008 0.004 0.061 (<.0001) (0.0152) (0.6923)
Log(SALES) 0.006 -0.005 0.183 (<.0001) (0.0018) (0.2616)
MB 0.000 0.001 -0.056 (0.5128) (<.0001) (0.0744)
Leverage 0.004 -0.029 0.966 (0.0065) (<.0001) (0.0522)
Log(Operating_Cycle) 0.007 -0.010 0.191 (<.0001) (<.0001) (0.1986)
σ_CFO 0.157 0.365 1.700 (<.0001) (<.0001) (0.4183)
σ_REV 0.011 0.000 0.195 (<.0001) (0.9946) (0.6371)
R_score 0.019 0.114 1.325 (<.0001) (<.0001) (0.0467)
Big_Auditor 0.004 0.000 0.690 (0.0583) (0.9774) (0.4983)
Log(G-score) -0.002 0.005 0.873 (0.0256) (0.1102) (0.0136)
Inst_Holding 0.002 -0.012 0.746 (0.2885) (0.079) (0.2983)
Regulation -0.001 -0.015 0.481 (0.4008) (0.0001) (0.1796)
Litigation 0.002 0.014 0.640 (0.0084) (<.0001) (0.0024)
CEO_Chair -0.001 -0.001 -0.057 (0.1302) (0.4103) (0.7673)
Board_Size 0.000 0.000 -0.027 (0.0612) (0.3582) (0.5492)
Board_Indep 0.000 0.000 0.006 (0.5861) (0.4233) (0.2736)
Intercept 0.004 0.071 -9.916 (0.3192) (<.0001) (<.0001)
Adjusted R2 40.50% 34.39% 7.65%+
# of Obs 4,485 4,296 4,806
Notes: p-values are in parentheses, and are one-tailed if there is a directional prediction; two-tailed otherwise; + Max-rescaled R2; all the variable definitions are included in Appendix A;
37
Table 8 : Regression Results considering tainted directors’ industries
(1) (2) (3)
Variables Pred. AQ || DA Restate_0/1 Log(#Restate_link_same_ind) + 0.008 0.052 0.099
(<.0001) (<.0001) (0.4265)
Log(#Restate_link_diff_ind) + 0.001 0.006 0.785 (0.0221) (0.0028) (0.0001)
Log(#Board_link) - -0.001 -0.005 -0.443 (0.0339) (0.0004) (0.0055)
ROA -0.011 -0.035 0.330 (0.0041) (0.0054) (0.7589)
#Loss 0.001 0.008 0.333 (0.2083) (0.0045) (0.2195)
Log(TA) -0.008 0.004 0.092 (<.0001) (0.0091) (0.5504)
Log(SALES) 0.006 -0.006 0.158 (<.0001) (0.0006) (0.3378)
MB 0.000 0.001 -0.058 (0.5868) (<.0001) (0.0617)
Leverage 0.004 -0.026 1.015 (0.0048) (<.0001) (0.0423)
Log(Operating_Cycle) 0.007 -0.010 0.163 (<.0001) (<.0001) (0.2802)
σ_CFO 0.156 0.365 1.586 (<.0001) (<.0001) (0.4537)
σ_REV 0.011 -0.001 0.177 (<.0001) (0.8105) (0.6721)
R_score 0.019 0.112 1.483 (<.0001) (<.0001) (0.025)
Big_Auditor 0.004 -0.001 0.678 (0.0564) (0.8592) (0.5061)
Log(G-score) -0.002 0.003 0.877 (0.0163) (0.2803) (0.014)
Inst_Holding 0.002 -0.012 0.831 (0.3725) (0.068) (0.2467)
Regulation -0.001 -0.017 0.333 (0.2832) (<.0001) (0.3749)
Litigation 0.001 0.014 0.671 (0.0239) (<.0001) (0.0015)
CEO_Chair -0.001 -0.001 -0.052 (0.0772) (0.6138) (0.7908)
Board_Size 0.000 0.000 -0.043 (0.0624) (0.6775) (0.3603)
Board_Indep 0.000 0.000 0.004 (0.5384) (0.3871) (0.4232)
Intercept 0.005 0.072 -9.779 (0.2228) (<.0001) (<.0001)
Adjusted R2 40.52% 35.68% 7.23%+
# of Obs 4,395 4,207 4,709 Notes: p-values are in parentheses, and are one-tailed if there is a directional prediction; two-tailed otherwise; + Max-rescaled R2; all the variable definitions are included in Appendix A;