Embed Size (px)
Citation preview

2012I 13
MAYIBUYE TRANSPORT CORPORATIONHEAD OFFICE
Corner of Mdantsane Access Road and Drummond Road
East London Reeston 5257
Phone: 043 745 2582
Fax: 043 745 2152
www.mayibuyetransport.co.za
MAYIBUYE TRANSPORT CORPORATIONREGIONAL DEPOTS
REESTON( HEAD OFFICE)Phone: 043 745 2582Fax: 043 745 [email protected]
ZWELITSHAPhone: 040 654 1351Fax: 040 655 [email protected]
ALICEPhone: 040 653 1371Fax: 040 653 [email protected]
QUEENSTOWN Phone: 045 858 8826Fax: 045 858 [email protected]
PR213/2013 ISBN: 978-0-621-42032-6
2012I 13

Acronyms and Abbreviations 03Presentation of the Mayibuye Transport Corporation Annual Report for 2012/2013 04
CORPORATE PROFILE 06Vision of MTC 07Mission of MTC 07Core Values 08MTC’s Legislative and Regulatory Framework 08Policy Themes that inform Transport 09Constitutional Mandate 10Legislative Mandates 10
BUSINESS REPORTS 14Message from the Chairperson 15Overview by the Chief Executive officer 17Overview of the Service Delivery Environment for 2012/2013 19Areas of Operation 21Revenue 21Bus allocation per Depot for the financial year 22Operating Grant-in-Aid 23Financial Statistics for the five years Ending March 2013 23
PROGRAMME PERFORMANCE 26Overall Performance 28Programme 1: Office of the CEO 29Programme 2: Office of Strategic Management 31Programme 3: Finance 39Programme 4: Human Resources 45Programme 5: Engineering 49Programme 6: Operations 53
ANNUAL FINANCIAL STATEMENTS 60Statement of Responsibility by the Accounting Authority For the 12 months ended 31 March 2013 61Report of the Accounting Authority For the 12 months ended 31 March 2013 62Corporate Governance Statement 65Report of the Audit Committee 67Report of the Auditor General 69Report of Financial Position 73Statement of Financial Performance 74Statement of Changes in Equity 75Cash Flow Statement 76Accounting Policies For the 12 months ended 31 March 2013 79Notes on the Annual Financial Statement For the 12 months ended 31 March 2013 83
HUMAN RESOURCES MANAGEMENT 94Report by the Executive Manager: Human Resources 95
TABLE OF
CONTENTS

2012I 13
PAGE
01

DOCUMENT
WAYFINDER
01PAGE 06
CORPORATEPROFILEVIS IONMISS IONVALUES
02PAGE 14
BUSINESSREPORTSMESSAGEFROM THECHAIRPERSON
OVERVIEWBY THE CH IEF EXECUTIVEOFF ICER
03PAGE 26
PROGRAMMEPERFORMANCE
05PAGE 94
HR MANAGEMENTREPORT
04PAGE 60
ANNUALFINANCIALSTATEMENTS
TABLE OF
CONTENTS
PAGE
02

AFS Annual Financial StatementsAG Auditor-GeneralAO Accounting OfficerAPP Annual Performance PlanASGISA Accelerated and Shared Growth Initiative for SABEE Black Economic EmpowermentCCA Ciskei Corporations Act of 1990CEO Chief Executive OfficerCFO Chief Financial OfficerCOS Certificate of FitnessCSI Corporate Social InvestmentCSO Chief Strategy OfficerDoRA Division of Revenue ActDOT Department of TransportECPA Eastern Cape Provincial AdministrationEWP Employee Wellness PolicyEXCO Executive CouncilFMS Fleet Management SystemGRAP Generally Recognised Accounting PracticesGSDE Guide to Service Delivery ExcellenceHDI Historically Disadvantaged IndividualsHoD Head of DepartmentHRD Human Resource DevelopmentHRM Human Resource ManagementIA Internal AuditIBAC Interim Bid Advisory CommitteeIFMS Integrated Financial Management SystemsIT Information TechnologyIYM In-Year-MonitoringMEC Member of the Executive CouncilMTC Mayibuye Transport CorporationMTEF Medium Term Expenditure FrameworkMTSF Medium Term Strategic FrameworkNTR National Treasury RegulationsOD Organisational DevelopmentOHSA Occupational Health and Safety Act
PFMA Public Finance Management ActPGDP Provincial Growth and Development PlanPMDS Performance Management Development SystemSABEA South African Bus Employer’s AssociationSABOA South African Bus Operator’s SystemSARPBAC South African Road Passenger Bargaining CouncilSCM Supply Chain ManagementSCOPA Standing Committee on Public AccountsSLA Service Level AgreementSM Senior ManagementSMME Small Medium Micro Enterprise
LIST OFACCRONYMS
PAGE
03

PRESENTATION OF THE MAYIBUYE TRANSPORT CORPORATIONANNUAL REPORT FOR 2012/2013
Percival LusapoCamagu MasetiChairperson
Jonga SydneyNyenganeDeputy-Chairperson
Luthando Richmond MbindaCEO of MTC Ex-Officio Board Member
Pumelele Pazima BalfourBoard Member
Angela Margaret ChurchBoard member
André Joubert De Vries Board Member, Department ofTransportRepresentative
Sindiswa Griselda GombaAlternate Board Member
Portia NdilekaEumera LoyilaneBoard Member
Ruth NalumagaLuzukaBoard member
Agreement Sizwe MandlaBoard Member andOrganised Labour Representative
DominicLebohang QhaliBoard Member and Provincial Treasury Representative
Mzwandile Vaaiboom Board Member
In terms of the requirements of section 55(1) of the Public Finance Management Act, Act 1 of 1999, the Accounting Authority herewith presents the Annual Report of the Mayibuye Transport Corporation (MTC), for the period1 April 2012 to 31 March 2013, to the Executive Authority,
Department of Transport of the Eastern Cape. We declare that the Annual Report fairly presents the state of affairs of MTC, its business, financial results, performance against predetermined objectives and financial position as at the end of the financial period under review.
PAGE
04

2012I 13
PAGE
05

01CORPORATEPROFILEVIS IONMISS IONVALUES
PAGE
06

VISION OF MTCMTC’S VISION IS TO BE A LEADING QUALITY PUBLIC TRANSPORT SERVICE PROVIDER.
MISSION OF MTCTHE MISSION OF MTC, TOGETHER WITH STRATEGIC PARTNERS, WILL ENABLE POOR COMMUNITIES TO ACCESS RESOURCES AND CONTINUOUSLY IMPROVE THEIR QUALITY OF LIFE.
MTC endeavours to maintain the highest possible standards in the provision of an effective and efficient transport service to communities in the Province on selected routes by:
Providing an enabling environment conducive to the provision of an affordable, convenient and safe mode of public transport
Keeping abreast of trends and developments in the sector to meet changing customer and stakeholder needs; and
Creating strategies that lendsupport to socio-economic growth in the Eastern Cape in all MTC’s areasof operation.
CORPORATE
PROFILE
VISION &MISSION STATEMENTS
Mayibuye Transport Corporation is a registered entity in terms of the Ciskei Act 16 of 1981 by Government Decree number 89 of 1990. MTC is a schedule 3D public entity in terms of the Public Finance Management Act. MTC is currently considered a public entity and its shareholder is the Eastern Cape Department of Transport.
Detailed below are the Vision, Mission and Values of Mayibuye Transport Corporation. It is these key components that fuel our commitment to the people of the Eastern Cape.
ABOUTMAYIBUYE
TRANSPORT
PAGE
07

These values are the cornerstone of MTC’s organisational culture and its way of doing the business of public transport.
MTC’S LEGISLATIVE AND REGULATORY FRAMEWORK
COREVALUES
MTC IS GUIDED BY AND COMMITTEDTO THE FOLLOWING VALUES:
IntegrityWork ethically, honestly and transparently.
ConsultationCreate an enabling environment for community and stakeholder participation.
InnovationStrive towards radical and revolutionary changes in thinking, services, processes or organisation.
AccountabilityAct honourably and take ownership of our actions and the outcomes thereof.
Government has approved a “Protocol on Corporate Governance in the Public Sector”, which is to be read in conjunction with the King Report. The protocol is applicable to all public entities listed in Schedule 2, 3B and D of the PFMA. It is intended to provide guidance on how to achieve the socio-politico-economic objectives of government; good governance in the public sector; freedom to manage and effective accountability of both financial and non-financial matters.
MTC regards good corporate governance as integral to good performance. It is critical for MTC to fulfil its mandate in a manner that is consistent with best practices and with regard to accountability, transparency,
fairness and responsibility. For this reason, MTC subscribes to the principles of good governance on an on-going basis as laid down by the King Report and the Protocol on Good Governance in the Public Sector. MTC undertakes to maintain effective governance and the highest standard of ethics business operations.
MTC executes its mandate in accordance with its constitutive documents and any applicable legislation as reflected in the Corporate Plan. Its Board exercises its fiduciary duties in pursuance of strategic objectives asset out in the Corporate Plan. Furthermore, the Board ensures that targets are met, monitored and reported ona regular basis.
PAGE
08

National Land Transport Policy “The Policy focuses on subsidised
marginalised public transport users, especially those with poor access to socio-economic activities.”
National Land Transport Strategic Framework “Integration of land transport
functions with land use and economic planning and development. To ensure that transport demand is managed and investments are used effectively.”
The framework provides for rural transport and as such MTC is committed to ensuring adequate access of transport to rural areas within its regions of operations.
Final Draft National Scholar Transport Policy, 2009 The policy provides a single
framework and an enabling environment for government and other stakeholders to address scholar transport challenges. It also outlines the implementation framework for scholar transport which
will assist government and relevant stakeholders to effectively render an improved scholar transport service throughout the country.
Moving South Africa: A Transport Strategy for 2020 (1999)
“By 2020, transport in South Africa will meet the needs of freight and passenger customers for accessible, affordable, safe, frequent, high quality, reliable, efficient and seamless transport operations and infrastructure. It will do so in a constantly upgrading, innovative, flexible and economically and environmentally
sustainable manner. In doing so, transport will support and enable government strategies, particularly those for growth, development, redistribution, employment creation and social integration, both in South
Africa and the Southern Africa region.”
The Moving South Africa project (MSA) provides a transport strategy for the country over the next 20 years. It informs of the strategic action that extends the short to medium-term policy formulation documented in the Transport White Paper into a long-term strategic formulation embodying the sets of trade-offs and choices necessary to realise the vision as set out in the White Paper which is “provide safe, reliable, effective, efficient and fully integrated transport operations and infrastructure which will best meet the needs of freight and passenger customers at improving levels of service and cost in a fashion which supports government strategies for economic and social development whilst being environmentally and economically sustainable.”
Provincial Growth and Development Plan (PGDP), 2005
The aims of the PGDP are to:• Develop a framework for the future
direction of policy and strategy development;
• Outline strategic interventions, goals and targets to direct development and planning initiatives; and;
• The PGDP provides strategic direction based on key provincial priorities that address the social needs of the people and the realisation of the economic growth potential of the province.
Rural Transport Strategy for South Africa 2007 The rural transport strategy is
seen as a stimulant to social development and economic growth of rural areas, which would in turn grow the economic resource of district municipalities. The strategy calls for the Rural Transport Service; this includes services provided by users themselves (e.g. head loading, private vehicular transport) and by operators of all modes of motorised and non-motorised transport, and the promotion of non-motorised and intermediate modes of transport.
The Medium Term Strategic Framework (2009-2014) The MTSF is a statement of intent
identifying the development challenges facing South Africa and outlining the medium-term strategy for improvements in the conditions of life of South Africans and for our enhanced contribution to the cause of building a better world.
Road Infrastructure Strategic Framework for South Africa (RISFSA), 2005 by the National Department of Transport.
“Good roads play a significant role in economic development. Classic economic theory suggests that productive infrastructure, including road and transport assets, is one of several key preconditions for national economic growth. The theory holds that, by investing in assets like bridges, roads ports, or even telephone lines, a nation can structure development by reducing transport and communications costs, thereby facilitating further trade and creation of wealth. Indeed, transport is generally seen
POLICYTHEMES THAT INFORM TRANSPORT
PAGE
09

as an engine of growth and a guarantor of national integration, both internally and with the external global economy”
White Paper on National Transport (1996) The policy document provides a
basis for transport to play a more
strategic role in social development and economic growth. It outlines six broad goals which seek to achieve the
vision for transport in South Africa: “Provide safe, reliable, effective,
efficient, and fully integrated transport operations and infrastructure which will best meet
the needs of freight and passenger customers at proving levels of service and cost in a fashion which supports government strategies for economic and social development whilst being environmentally and economically sustainable.”
The Corporation derives its existence and operations from the following legislative mandates:
The Bill of Rights in the Constitution of the Republic of South Africa (Act No 108 of 1995) is the cornerstone of democracy and enshrines the rights of all people in our country and affirms the democratic values of human dignity, equality and freedom.
The Mayibuye Transport Corporation, through its provision of public transportation, in addition to advancing the values of human dignity, equality and freedom, ensures the realisation of economic and social advancement of the citizens of the Eastern Cape whilst contributing to the overall economic growth of the Province.
CONSTITUTIONAL MANDATE
LEGISLATIVEMANDATE
• Constitution of the Republic of South Africa Act, 1996 (No. 108 of 1996)• Ciskei Corporations Act (1990).• White Paper on National Transport Policy (1996)• National Road Traffic Act (Act No. 93 of 1996)• Urban Transport Act (No 78 of 1977)• National Land Transport Transition Act (No. 22 of 2000)• Eastern Cape Roads Act (No. 3 of 2003)• Passenger Transportation (Interim Provisions) Act (No 11 of 1999)• Road Transportation Act (No. 74 of 1977)
• Public Finance Management Act (No 1 of 1999 and 29 of 1999)• Public Service Act (No.103 of 1994)• Skills Development Act (No. 97 of 1998)• Skills Development Levy Act (No. 9 of 1999)• Preferential Procurement Policy Framework Act (No. 5 of 2000)• Employment Equity Act (No. 55 of 1998)• Occupational Health and Safety Act • Regulations emanating from the above legislation
PAGE
10

BUT ITWAS A
SYDNEYPOITIER
SO IT’S BEEN KIND OF A
LONG ROAD,GOOD
JOURNEY ALTOGETHER.
PAGE
11

PAGE
12

2012I 13
PAGE
13

02BUSINESSREPORTSMESSAGE FROMTHE CHAIRPERSON
OVERVIEW BY THECHIEF EXECUTIVE OFF ICER
PAGE
14

TRANSPORT IS NOT ONLY AN ESSENTIAL BUT ALSO ONE OF THE SINGLEMOST VISIBLE ELEMENTS OF CONTEMPORARY SOCIETY.
To this end Mayibuye Transport Corporation has continued to be visible and to showcase its resilience under very challenging conditions.
MESSAGEFROM THE
CHAIRPERSON
PERCY L. C. MASETIChairperson of the Board of Directors
The Corporation has continued to reap the benefits of its services and it is worthy to note that the Corporation performs admirably under tough economic conditions. As we endeavour to ensure that we continue to serve the rural communicates of our Province, proper financial management, compliance and good governance shall remain key to the Corporation.
I wish to echo the sentiments expressed by the Board in congratulating the management team of Mayibuye Transport Corporation on the transportation of over two million passengers during the period under review. We furthermore welcome the clean audit on performance information – a first in the history of the Corporation. Considering the history of the entity, it is now no longer unrealistic to
talk about a soon-to-be completed metamorphosis from the Corporation of the past to the premier public transport service provider of the future.
Our strategic partners, namely, the Provincial Department of Transport and the Portfolio Committee on Transport, have been absolutely critical to our operational success. The transport experience of our passengers and commuters has improved over the years primarily because our partners have come along with us on the journey of continuously intensifying our efforts to improve customer service. We proudly reflect on the 83% Customer Satisfaction rate achieved.
Serving as the Chairperson of the Board of Mayibuye Transport Corporation has been very rewarding and enriching experience for me
and this particularly so through the continued interaction with our management team, so competently led by Luthando Mbinda, our Chief Executive Officer.
To my colleagues on the Board, a heartfelt appreciation for your commitment in executing the oversight role you play and the considered guidance provided to the management team. I wish to take this opportunity to recognise and thank you for the diligent manner in which you discharged your responsibilities.
Finally, I would like to thank the Honourable MEC Marawu for her support. We look forward to carry on working with her for the continued benefit of the people of our Province that we serve.
PAGE
15

WE’RESHAPINGYOUR TOMORROW
TODAYPAGE
16

Throughout every year since itbegan in 1990, the Mayibuye Transport Corporation (MTC) haskept the Eastern Cape moving.
I am pleased to share this annual report titled “Steadfast growth, unlimited possibilities”.
The past year presented many challenges in transporting our deserving clients and our buses running. Like you, we had to find ways to do more with less. And we did. Despite lack of sufficient grant funding, Mayibuye provided more than 2.2 million people with a rideon our buses.
As the Chief Executive Officer of the Mayibuye Transport Corporation I am pleased and honoured to share the 2012/13 MTC Annual Report with you.
As you are aware, 2012 was a challenging year for transportation funding. We faced obstacles
that we never had before, and hopefully, never will again. But more importantly, you will see how MTC used these challenges as opportunities to improve mobilityand the quality of life for Eastern Cape residents.
With the continued under funding and marginal sales revenue increase, it was an extremely challenging year for our bus system. Throughout the extensive planning and implementation of cost reductions, MTC staff worked diligently to minimize the impact on our customers and to keep them engaged every step of the way.
Hard work coupled with focused strategies is the essence of what we do here at Mayibuye Transport. Our employees are driven to achieve specific goals which are measured so that MTC can attain its vision of being a leading quality public transport service provider.
Throughout this past year we have safely navigated the improving, but still difficult, economic times and successfully completed numerous fleet projects and efficiently delivered our many services and programs.
Whether it is through our tirelessly maintaining our ageing fleet to improve the number of vehicles available; the advanced and defensive training being offered to our drivers in support of passenger safety; or our on-going strategic analysis and augmentation of the best practice management systems; we are driven to perform at the highest level so that the residents of the Eastern Cape can see the return on their investment. To this end we are proud to announce that we have now achieved a clean audit for performance information, a first for the entity and a massive achievement in terms of credible and transparent service delivery reporting.
This year’s annual report centres on the following quote:
“STRIVING FOR SUCCESS WITHOUT HARD WORKIS LIKE TRYING TO HARVEST WHERE YOU HAVEN’T PLANTED.”
- David Bly
OVERVIEWBY THE
CHIEF EXECUTIVEOFFICER
LUTHANDO RICHMOND MBINDACEO of MTC Ex-Officio Board Member
PAGE
17

Detailed below are the highlights as well as challenges identified by the core functions:
a) Achieve 82% of our annual targets - a performance which was achieved under very strenuous and unfavourable conditions as the Corporations is operating with inadequate resources.
b) Maximise our revenue by collecting R27 606 895 and in so doing exceeding our target by 9.6%
The core function of the programme is to transport people of the Eastern Cape in all our designated routes. The department however remains hamstrung due to ageing buses in our system which regularly break down and are removed from the road due to defects.
The misconduct of the bus drivers who are entrusted with the responsibility of collecting cash from the
customers has manifested in many negative ways as we have seen experienced and skilled drivers being dismissed for theft of revenue leaving MTC with inexperienced and unskilled bus drivers who should still be upskilled by MTC. This has also frustrated Engineering as their maintenance costs escalated due to buses that were constantly breaking down due inexperienced drivers.
Working with aged manpower in critical management positions where change management was imminent has also posed a major challenge as training such people in new methods is not always received with enthusiasm and therefore not absorbed at all.
ENGINEERINGIn spite of conditions that are not conducive to proper training and development within our facilities, the corporationis proud to report that two automotive electrician apprentices acquired artisanship during the period under review.The Corporation absorbed both of them as permanent employees in two different depots in positions that existed before they qualified.
The lack of capital funding did not preclude the Corporation from improvising to ensure that two used buses were acquired from the operating revenue at a total cost of R1m. In addition to this achievement, we managed to erect proper fencing in Reeston which is encroached by an informal settlement with a history of high incidents of break-ins.
The refurbishment of Bus 22 from Queenstown was also made possible through the transfer of funds from our operating budget to that of our capital expenditure budget.
The Engineering Department had numerous challenges to deal which due to the fleet recapitalisation plan which is yet to be approved. This was coupled with:
OPERATIONSThe Operations Department took advantage of the Performance Management System implemented by the Office of Strategic Management and through effective control of staff Performance we were able to:
In spite of conditions that are not conducive to proper training and development within our facilities, the corporation is proud to report that two automotive electricians apprentices acquired artisanship during the period under review. The Corporation absorbed both of them as permanent employees in two different depots in positions that existed before they qualified.The lack of capital funding did
not preclude the corporation from improvising to ensure that two used buses were acquired from the operating revenue at a total cost of R1m. In addition to this achievement, we managed to erect proper fencing in Reeston which is encroached by informal settlement with high incidents of break-ins before such a project was implemented. This is an obligation on the Accounting authority to ensure that risk
management and protection of assets is enhanced in the spirit ofthe PFMA.
The refurbishment of Bus 22 from Queenstown was also made possible through the operating expenses.
PAGE
18

ROUTE AND PRIVATE HIRE REVENUE COLLECTIONYear Budget Actual Variance
2010 21,171,560 18,513,578 (2,657,982)
2011 18,650,942 18,633,508 (17,434)
2012 20,447,636 23,835,306 3,387,670
2013 25,229,258 27,606,895 2,377,637
EXPENDITUREItem 2013 Actual 2012 Actual 2011 Actual 2010 Actual
Profit / (Loss)from operations
(2,970,318) (440,451) 164,385 5,009,206
Personnel 46,506,195 41,314,771 35,165,181 31,021,556
Audit fees(including internal audit fees for current year)
3,537,849 2,693,371 1,763,700 1,793,083
Operating expenses 29,565,572 34,859,052 25,861,552 24,871,027
Depreciation 14,947,105 11,614,771 7,207,526 11,492,104
2012/2013 Funding Source Budget Expenditure Variance
Leasing of Buses DOT Grant 5,000,000 6 028 176 (1,028,176)
New Buses & Refurbishment Own Revenue 1,559,703 1,559,703 0
Ancillary Vehicles Own Revenue 0 0 0
Operating Equipment Own Revenue 4,445 4,445 0
Workshop Equipment Own Revenue 130,032 130,032 0
Office Furniture & Equipment, IT Infrastructure Own Revenue 1,073,340 1,073,340 0
Depot Upgrading Own Revenue 260,926 260,926 0
Spare Parts & Units Own Revenue 5,025,231 5,025,231 0
Total 13,053,677 (14,081,853) (1,028,176)
2011/2012 Budget Expenditure Variance
New Buses & Refurbishment 5,250,000 10,429,115 (5,179,115)
Ancillary Vehicles 1,820,000 1,291,159 528,841
Operating Equipment 190,000 426,501 (236,501)
Workshop Equipment 600,000 383,715 216,285
Office Furniture & Equipment, IT Infrastructure
1,110,000 830,467 279,533
Depot Upgrading 1,030,000 278,575 751,425
Spare Parts & Units - 6,548,033 (6,548,033)
Total 10,000,000 20,187,565 (10,187,565)
OVERVIEW OFTHE SERVICEDELIVERYENVIRONMENTFOR 2012/2013
CAPITAL EXPENDITUREThe Corporation has received a capital grant from the Department of Transport which has been spent as follows:
PAGE
19

2011/2012 Budget Expenditure Variance
New Buses & Refurbishment 5,800,000 8,115,333 (2,315,333)
Ancillary Vehicles 300,000 351,678 (51,678)
Operating Equipment 2,770,000 3,295,872 (525,872)
Workshop Equipment 400,000 13,660 386,340
Office Furniture & Equipment, IT Infrastructure
150,000 533,284 (383,284)
Depot Upgrading 440,000 175,512 264,488
Spare Parts & Units - 4,428,499 (4,428,499)
Total 9,860,000 16,913,834 (7,053,838)
Busses - Body
12.5%
Ancillary Vehicles
25%
Busses - Chassis,Engine, etc
8.33%
Workshop Equipment
25%
OfficeEquipment
20%
Spare Parts& Units
50%
OfficeFurniture
10%
OperatingEquipment
20%
Buildings
2%
DEPRECIATIONRATES FOR
ASSETS
PAGE
20

AREAS OFOPERATIONMTC operates predominantly in the former Ciskei Region
QUEENSTOWNDEPOTThe Queenstown Depot covers the areas of Ntabethemba, Whittleseaand Swartwater.A total of 629 818 passengers were conveyed with 691 040 kilometres travelled.
ZWELITSHADEPOTThe Zwelitsha Depot coversthe areas of King William’sTown and Keiskammahoek.A total of 749 894 passengers were conveyed with 867 315 kilometres travelled.
REESTONDEPOTThe Reeston Depot coversthe areas of East London.A total of 592 800 passengers were conveyed with 538 873 kilometres travelled.
ALICEDEPOTThe Alice Depot covers theareas of Alice and Middledrift.A total of 288 841 passengers were conveyed with 252 171 kilometres travelled.
Republic ofSOUTH AFRICA
EASTERNCAPE
EASTLONDON
REVENUE GENERATION BY DEPOT WAS AS FOLLOWS:-Depot 2013 2012 2011
Zwelitsha 10,465,251 9,743,285 7,196,358
Reeston 6,412,940 4,956,850 4,161,776
Queenstown 7,985,357 7,032,149 5,713,287
Alice 2,743,346 2,103,022 1,562,087
TOTAL 27,606,895 23,835,306 18,633,508
The own-revenue has been achieved by an average number of 48 operating buses (2012:50, 2011:51) with a total number of 2 519 661 kilometres travelled. Private hire kilometres amounted to 169 716 (2012: 215 387, 2011:137 765) while route kilometres stood at 2 349 945 (2012: 2 239 345, 2011: 2 203 745) for the financial year.
REVENUE Total own-revenue generation for the financial period under reviewamounted to R 27,606,895
A grand total of 2,261,353 passengersWere carried with 2,349,945 route kilometersTravelled during the year under review.
2,261,353PASSENGERS
PAGE
21

COMBINED REVENUE HAS BEEN GENERATED BY EACH DEPOT AS FOLLOWS:Depot 2013 2012
Route Private Hire Route Private Hire
Zwelitsha 8,410,782 2,054,470 7,697,496 2,045,789
Reeston 4,811,029 1,601,911 3,632,929 1,323,921
Queenstown 7,361,547 623,810 6,451,039 581,111
Alice 2,397,076 346,270 1,855,562 247,460
TOTAL 22,980,434 4,626,461 19,637,025 4,198,281
BUS ALLOCATION PER DEPOT FOR THE FINANCIAL YEAR WAS AS FOLLOWS:Depot 2013 2012 2011
Zwelitsha 17 19 18
Reeston 13 12 12
Queenstown 13 13 15
Alice 5 6 6
Total Operating Buses 48 50 51
BUS ALLOCATIONPER DEPOTFor the Financial Year
AVERAGE ROUTE REVENUE per bus was as follows:-
EASTERNCAPE
EAST LONDON
QUEENSTOWNDEPOT {2013}
566,2732012: 496,234, 2011: 344,882
ALICE DEPOT{2013}
474,4152012: 309,260, 2011: 229,801
REESTON DEPOT {2013}
370,0792012: 302,744, 2011: 272,611
ZWELITSHA DEPOT {2013}
494,7512012: 405,131, 2011: 359,915
PAGE
22

The Corporation receives a grant-in-aid from the Eastern Cape Department of Transport.The grant serves to subsidize bus fares and partly fund the Corporation’s operating activities.
Allocation for the financial year under review was as follows:-
Details 2013 2012 2011 2010 2009
Revenue 27,606,895 23,835,306 18,629,433 18,513,578 19,426,462
Grant-in-Aid 63,773,000 51,429,000 41,809,000 43,000,000 31,895,000
Capital Grant-in-Aid 5,000,000 10,000,000 9,860,000 8,500,000 5,000,000
Route Passengers 2 261 353 2,223 040 1,790,793 1,808,717 2,053,531
Route Kilometres 2 349 945 2,239,345 2,203,745 2,231,356 2,432,486
Buses at Year end 63 63 63 65 62
Revenue Cents per Km 1174 1064 845 830 799
OPERATING GRANT-IN-AID
{2013}
63,773,000
{2012}
51,429,000
{2011}
41,809,000
FINANCIALSTATISTICSfor the five years ending March 2013
IN CLOSING
Mayibuye will continue to capitalise on its close working relations with Government Departments; District and Local Municipalities and other state owned enterprises in order to enhance its capacity to service its customers. We will also continue to monitor the findings of the Legislature and actively work towards the implementation of its resolutions.
We have developed and submitted a strong business case by way our recapitalisation plan which we will continue to lobby capital funding for with the relevant stakeholders. An approved recapitalisation plan will see
to sizable improvements in passenger numbers due to a complete revamping or our depot infrastructure, a substantially increased fleet and the acquisition of much needed workshop equipment. The Corporation’s strategic objectives and mandate will be unattainable should the recapitalisation plan remain unfunded.
We will continue to accomplish great feats due to our commitment and continued efforts to develop and deliver transportation solutions to enhance the quality of life and facilitate Eastern Cape mobility.
PAGE
23

We look forward to continuing to do our part to keep theEastern Cape moving towards economic opportunity for all.
Sincerely,
LUTHANDO RICHMOND MBINDACEO of MTC Ex-Officio Board Member
DEDICATIONTO OUR
CLIENTSIN EVERYTHING WE
IMAGINE
PLEASE KNOW THAT WE COULD NOT HAVEACHIEVED THESE RESULTS WITHOUT YOUR SUPPORT.
PAGE
24

2012I 13
PAGE
25

03PROGRAMMEPERFORMANCE
PAGE
26

WE
TRANSPORT THE
HEARTOF YOUR
COMMUNITIES
PAGE
27

STRATEGIC GOALS AND OBJECTIVESMayibuye Transport Corporation has streamlined its performance management objectives and increased its strategic focus by reducing the number of strategic goals to three main outcomes namely:
Ensure an efficient, effective and service oriented organisation
1.1. Provide Strategic direction through effective leadership and good governance
1.2. Develop and implement stakeholder relationship management strategy
1.3. Implementation of organisation wide Performance Management System
1.4. Design and implement an effective Business Performance Improvement Strategy
1.5. Establish and implement an organisation wide Business Excellence Model
1.6. Maintain reliable and sustainable Financial Management practices
1.7. Provide a reliable and integrated ICT platform
1.8. Establish a world class and compliant Procurement Management System
1.9. Implement an individual Performance Management and Development System (PMDS)
1.10. Develop and implement an Integrated Human Resource Plan
1.11. Implement an effective and efficient inspectorate and safe operating environment
Render a safe, affordable and reliable service
2.1. Enhance vehicle availability
2.2. Implement fleet maintenance and refurbishment program
2.3. Enhance passenger safety
2.4. Ensure adequate and conducive infrastructure for productive operations
Institutionalise operations best practices
3.1. Improve driver performance
3.2. Increase ridership
3.3. Maximise Revenue
OVERALLPERFORMANCE
PAGE
28

PERFORMANCE AGAINST PREDETERMINED OBJECTIVES: MEC approved Annual Performance Plan 2012/2013
Strategic Objective Measurable Objective Service Delivery Indicators Target Actual Deviation Challenges/Reasons for non-performance Plans to address challenges/Non-performance
1.1. Provide Strategic direction through effective leadership and good governance
1.1.1.1 Compliance with the approved Board Charter monitored
0001 Number of quarterly reports on compliance
4 4 0 Not applicable. Target Achieved. Not required
1.1. Provide Strategic direction through effective leadership and good governance
1.1.1.2 Annual Board Programme completed
0002 % Approved Board Programme Completed
100 150 -50 Additional Board Meeting processed in support of urgent motivations and the Audit Action Plan
The Board Plan for 2013/2014 has been updated to allow for additional meetings
1.1. Provide Strategic direction through effective leadership and good governance
1.1.1.3 Annual Board Development Programme completed.
0003 % Annual Board Development Programme Completed
100 100 0 Not applicable. Target Achieved. Not required
STRATEGIC GOALEnsure an efficient, effective and service oriented organisation.
PURPOSEThe Office of the Chief Executive Officer (CEO) facilitates the coordination between the Board of Directors, Shareholder, Heads of Department and Stakeholders. The Board of Directors serves as the Accounting Authority for MTC in terms of the Public Finance Management Act. The CEO is responsible for the formulation of policy as a non-officio member of the Board of Directors and accountable for the implementation of policy and strategy as the most senior executive in the organisation. The Office of the CEO ensures that effective planning and reporting systems are established based on internal management co-operation and communications, and that external partnership networks are developed and managed for the benefit of the Mayibuye Transport Corporation.
PROGRAMME STRUCTUREChief Executive • Compliance Management • Board Secretarial Services
PERFORMANCE AGAINST PREDETERMINED OBJECTIVES: Board approved Annual Operational Plan 2012/2013
Strategic Objective Measurable Objective Service Delivery Indicators Target Actual Deviation Challenges/Reasons for non-performance Plans to address challenges/Non-performance
1.1. Provide Strategic direction through effective leadership and good governance
1.1.1.4 100% Legal Cases Managed 0004 % of Legal Cases Managed 100 - - No cases for the year were reported The indicator was set to cater for legal cases as an emerging risk. No further action is required
2.3. Enhance passenger safety 2.3.2.1 Zero accidents caused by MTC 0115 Number of accidents caused by MTC
0 3 -3 Text Text
SERVICE DELIVERY OBJECTIVES, INDICATORS AND ACHIEVEMENTSThe Office of the CEO has been able to demonstrate results against its predetermined objectives as indicated below:
PROGRAMME 1Office of the CEO
PAGE
29

“STRIVING FOR SUCCESS WITHOUT
HARD WORK IS LIKE TRYING TO HARVEST
WHERE YOUHAVEN’T PLANTED.”
- David Bly
PERFORMANCE AGAINST PREDETERMINED OBJECTIVES: MEC approved Annual Performance Plan 2012/2013
Strategic Objective Measurable Objective Service Delivery Indicators Target Actual Deviation Challenges/Reasons for non-performance Plans to address challenges/Non-performance
1.1. Provide Strategic direction through effective leadership and good governance
1.1.1.1 Compliance with the approved Board Charter monitored
0001 Number of quarterly reports on compliance
4 4 0 Not applicable. Target Achieved. Not required
1.1. Provide Strategic direction through effective leadership and good governance
1.1.1.2 Annual Board Programme completed
0002 % Approved Board Programme Completed
100 150 -50 Additional Board Meeting processed in support of urgent motivations and the Audit Action Plan
The Board Plan for 2013/2014 has been updated to allow for additional meetings
1.1. Provide Strategic direction through effective leadership and good governance
1.1.1.3 Annual Board Development Programme completed.
0003 % Annual Board Development Programme Completed
100 100 0 Not applicable. Target Achieved. Not required
PERFORMANCE AGAINST PREDETERMINED OBJECTIVES: Board approved Annual Operational Plan 2012/2013
Strategic Objective Measurable Objective Service Delivery Indicators Target Actual Deviation Challenges/Reasons for non-performance Plans to address challenges/Non-performance
1.1. Provide Strategic direction through effective leadership and good governance
1.1.1.4 100% Legal Cases Managed 0004 % of Legal Cases Managed 100 - - No cases for the year were reported The indicator was set to cater for legal cases as an emerging risk. No further action is required
2.3. Enhance passenger safety 2.3.2.1 Zero accidents caused by MTC 0115 Number of accidents caused by MTC
0 3 -3 Text Text
PAGE
30
STRATEGIC GOALEnsure an efficient, effective and service oriented organisation.
PURPOSEThe Office of Strategic Management exists to orchestrate the connection between strategy and execution. It oversees alignment of all management processes with strategy and is responsible for the coordination and preparation of the strategic plan, planning processes, reporting and organizational performance improvement. MTC is engaged in an on-going planning process designed to facilitate strategic conversations to improve organizational results. The Office of Strategic Management provides strategic leadership and management in accordance with legislation, policies and furthermore ensured support to the Office of the CEO, the Board and all programmes within the Corporation.
PROGRAMME STRUCTUREStrategic Management • Corporate Performance Management • Employee Performance Management • Marketing
PROGRAMME 2Office of Strategic Management
OVERVIEW OF DEPARTMENTAL PERFORMANCE
The Corporate Performance Strategy: The strategy aims to optimise organisational performance by enhancing project selection criteria, design integrated development solutions, and to enhance learning and innovation. Corporate Performance Management aims to narrow the gap between strategy and execution. As an integrated, evidence-based management practice, it involves planning, forecasting, budgeting. It utilises business intelligence; systematically to monitor, analyse and measure strategic and operational activities against targets in performance indicators. The framework is structured around six core elements: Analyse, Plan, Allocate Resources, Implement and monitor, Evaluate and Report.
A comprehensive Employee Performance Management System
– ground breaking in its approach of alignment, accountability and calculability; the EPMS provides the golden thread between strategy and execution. Due to its intricacies, the detailed system is yet to be rolled out to staff below junior management. It allows for the objective setting of standards and review of performance completely aligned to the corporate performance of the entity. The entire organisation has been subjected to performance management training and for the first time in its history, all levels of MTC staff members have concluded performance agreements and assessments.
The Excellence Framework Project: MTC previously had no scientific means of self-assessing its continuous business improvement processes. Furthermore, there was no feedback data available
to the performance management system. Triggers for breaks in controls were not set – therefore many key risks remain unidentified and early detection not benefited from. The Corporation also has no means to benchmark against other likeminded organisations nor did it have a scientific means to support an organisational culture of excellence. With the adoption of the South African Excellence Framework, MTC has now geared itself to introduce organisational performance excellence by way of a comprehensive and integrated practical model. Quality minded companies show great performance improvement trends after the application of total quality management programmes due to the strong correlation between business excellence and quality.
The 2012/2013 financial year has proven extremely exciting as from 1 April 2012, the Corporation found itself with a dedicated Strategic Management Department. Tasked with translating policies and priorities into strategies for effective service delivery, managing, monitoring and controlling the Corporation’s Performance as well as providing Strategic Direction, the Office of Strategic Management drove the design and delivery of numerous organisational development initiatives.
MTC’s Strategic Vision of becoming a leading quality public transport service provider is grounded in the belief that chronic transport deficiencies can only be successfully eradicated through a targeted, integrated, comprehensive long term strategy and programmes. This position is supported by the fact that while there have been substantial investments in social transport development and significant achievements since 1994, poverty has proven intractable and inequality has deepened.
Hence, through its Office of Strategic Management, the entity embarked on a wide-scale performance improvement project which resulted in several changes being implemented including:
PAGE
31

An eGovernance Initiative:MTC have seen considerable savings in time spent on administration since the implementation of its eGovernance Initiative. Communications and logistics have dramatically improved as the Board spans a wide geographic area where board papers were couriered at great expense. With the eGovernance solution, last minute inclusions and corrections can be easily updated without the need to reprint and distribute packs; this has reduced both time and cost. The Board has all of its governance information available at their fingertips, and can review, annotate and make decisions on the move, maximising the use of their time and running a more effective board.
An Annual Operational Plan and Budget Model:A detailed Annual Operational Plan had been created within each department which culminated in a tactical strategy document which seeks to fully support the implementation of the Annual Performance Plan. The AOP explains how MTC will deliver the goals and other high level targets set out in the Annual Performance Plan and how the Corporation will modernise and reform itself to get better value for money in achieving them. In broad terms the Plan demonstrates how performance will be improved within the Corporation and the Departments; how performance will be proved in support of providing assurance to stakeholders; how the Departments will focus more closely on the needs of customers of its services; and how the Corporation’s Human and IT resources will be managed to achieve change, to include diversity and equality issues. The plan centres on delivering key results and sets out how Departments will deliver their targets. A critical success factor to the rollout of the AOP was the development of a budget model. Again a first in the history of the Corporation, budgets have been allocated per project allowing for critical analysis of performance against cost.
Risk Management Methodology EnhancementsThe management of risk is critically important to the on-going success of Mayibuye Transport Corporation (MTC). MTC regards risk as the impact of uncertainty on objectives that could be related to projects and project execution, health and safety, the environment, the economy, and talent management, among others. The effective management of risk is closely interwoven into MTC’s business strategy. A comprehensive risk register tool has been developed in which all risks are now directly linked to measurable objectives and are weighted in terms of financial implications. Root causes are identified in support of better fit-for-purpose mitigation strategies and controls. The Risk Register tool also forms the basis of documenting the Corporations tolerance level for each risk (acceptable level) as well as monitoring the percentage of risks which have been reduced to an acceptable level. MTC now faces 9 strategic risks of which two strategic risks are set to be reduced to an acceptable level by 31 March 2014.
Stakeholder Management Strategy: This stakeholder engagement strategy outlines our approach to communicating and working with our stakeholders and seeks to provide and a clear focus in the management of stakeholder relationships by MTC. Engagement is an integral part of developing our understanding of the public transport industry along with the risks and opportunities it presents. This helps us to shape asubstantial socio-economic contribution and our future plansand priorities.
However, like all other organisations, MTC was required to strike the correct balance between meeting theorganisation’s mandate and programmeobligations whilst maintaining optimum efficiency levels.
The introduction of performance information standards, monitoring and control, proved challenging to many of the existing staff members. This has negatively impacted on departmental
performance as implementation of OSM recommendations were not timeously concluded. Furthermore, the organisational climate was not accustomed to the high speed of innovation and adoption required in order to secure the desired outcomes. Despite these challenges and related set-backs, the Office of Strategic Management is proud to report that MTC has for the first time in its history obtained a clean audit for performance information. This result is staggering considering the short period of 1 year in which the turnaround strategy and various related initiatives had to be developed and implemented. We take this opportunity to thank each and every staff member committed to this performance drive as well as to the CEO and Board of Directors for their continued support and leadership.
A hurdle which remained throughout the 2012/2013 fiscal year was the non-implementation of OSM’s recommendation for alignment of the budget in the finance system to the approved AOP. A new finance system has been procured and additional finance staff sourced in order to ensure that from the 2013/2014 financial year, complete alignment and control is realised.
Going forward, the Office of StrategicManagement remains committed to ensuring that all the projects withinthe Corporation are fully implemented within the set parameters.
Furthermore, as the Corporate Performance System develops, so too will MTC’s ability to provide credible business intelligence and foresight. OSM will continue to focus on the implementation and value add of the Strategic Management Framework, the knowledge base development, the continual review of the strategic risks that could impact the entity and any areas that will improve the focus on total quality management and the business excellence culture within MTC. United as a Corporation we will deliver best-practice service delivery models and results.
PAGE
32

PERFORMANCE AGAINST PREDETERMINED OBJECTIVES: MEC approved Annual Performance Plan 2012/2013
Strategic Objective Measurable Objective Service Delivery Indicators Target Actual Deviation Challenges/Reasons for non-performance Plans to address challenges/Non-performance
1.2. Develop and implement stakeholder relationship management strategy
1.2.1.5 Four reports on the relationship between MTC and its identified stakeholders
0014 Number of reports on the stakeholder relationships.
4 4 0 Not applicable. Target Achieved. Not required
1.3. Implementation of organisation wide Performance Management System
1.3.1.7 Annual report consolidated and submitted 31 August.
0023 Number of Annual Reports consolidated and submitted by 31 August 2012
1 1 0 Not applicable. Target Achieved. Not required
1.3. Implementation of organisation wide Performance Management System
1.3.1.8 Performance Reports approved and submitted for each quarter
0024 Number of quarterly performance reports approved and submitted.
4 4 0 Not applicable. Target Achieved. Not required
1.3. Implementation of organisation wide Performance Management System
1.3.1.9 One Annual Performance Plan (APP) and Corporate Plan aligned to Treasury guidelines.
0025 Number of Annual Performance Plans approved by the Accounting Authority
1 1 0 Not applicable. Target Achieved. Not required
1.3. Implementation of organisation wide Performance Management System
1.3.1.9 One Annual performance Plan (APP) and Corporate Plan aligned to Treasury guidelines.
0026 Number of Corporate Plans approved by the Accounting Officer
1 1 0 Not applicable. Target Achieved. Not required
1.4. Design and implement an effective Business Performance Improvement Strategy
1.4.1.1 Comprehensive organisation wide excellence model established
0031 South African Excellence Framework model adopted
1 1 0 Not applicable. Target Achieved. Not required
1.4. Design and implement an effective Business Performance Improvement Strategy
1.4.1.2 Three business processes refined for organisational performance improvement
0032 Number of business processes refined for organisational performance improvement
3 3 0 Not applicable. Target Achieved. Not required
1.5. Establish and implement an organisation wide Business Excellence Model
1.5.1.2 Integrated communication strategy developed
0034 Integrated communication strategy developed
1 1 0 Not applicable. Target Achieved. Not required
1.5. Establish and implement an organisation wide Business Excellence Model
1.5.1.3 Corporate branding strategy developed
0035 Corporate branding strategy developed
1 1 0 Not applicable. Target Achieved. Not required
1.5. Establish and implement an organisation wide Business Excellence Model
1.5.1.6 4 Workshops with key stakeholders facilitated
0038 Number of workshops with key stakeholders facilitated
4 4 0 Not applicable. Target Achieved. Not required
1.5. Establish and implement an organisation wide Business Excellence Model
1.5.1.7 4 Quarterly reports on engagements with stakeholders
0039 Number of quarterly reports on engagements with stakeholders
4 4 0 Not applicable. Target Achieved. Not required
1.5. Establish and implement an organisation wide Business Excellence Model
1.5.2.1 Social Media Optimisation Options researched
0040 Report on social media optimisation options
1 1 0 Not applicable. Target Achieved. Not required
1.5. Establish and implement an organisation wide Business Excellence Model
1.5.2.2 50% of Approved Social Media Optimisation Platform implemented
0041 % of Approved Social Media Optimisation Platform implemented
50 50 0 Not applicable. Target Achieved. Not required
1.5. Establish and implement an organisation wide Business Excellence Model
1.5.2.3 50% of Approved Social Media Optimisation Platform implemented
0042 Number of reports on implementation of selected social media optimisation platform submitted
3 3 0 Not applicable. Target Achieved. Not required
1.7. Provide a reliable and integrated ICT platform
1.7.2.1 45% of Master Systems Plan Implemented
0064 % of Master Systems Plan Implemented
45 35 10 CCSIT have started an SQL class. There will be a delay in certificates due to this action taken by the ICT Manage because this course is only run on an adhoc basis when enough students are available to attend
There are 3 courses that still need to be run, the LAN and ITS technician need only to write the exam. The ICT Manager needs to complete the course. Exams will be written on a monthly basis starting from 15 05 2013
1.7. Provide a reliable and integrated ICT platform
1.7.2.2 Disaster Recovery Plan 2013/2014 costed and approved
0065 % of Disaster Recovery Plan costed and approved
50 50 0 Not applicable. Target Achieved. Not required
1.7. Provide a reliable and integrated ICT platform
1.7.2.4 70 Staff Members using the Company Intranet
0067 Number of Intranet Users 70 70 0 Not applicable. Target Achieved. Not required
1.7. Provide a reliable and integrated ICT platform
1.7.3.1 75% of Enterprise Resource Planning System Implemented
0069 % of Enterprise Resource Planning System Implemented
75 75 0 Not applicable. Target Achieved. Not required
1.9. Implement an individual Performance Management and Development System (PMDS)
1.9.1.1 100% Compliance with the approved Performance Management Policy
0083 % Approved Performance Agreements submitted by prescribed deadline.
100 29.41 71 This is the entry year for the new PMDS system and substantial levels of assistance and review has been required. A number of employees are not office bound resulting in logistical challenges in developing and concluding performance agreements.
The shortfall in agreements will be completed in time for the Annual Assessments. Additional human resources will be appointed to assist with the system admin in addition to training and development in support of timeous PMDS outcomes
1.9. Implement an individual Performance Management and Development System (PMDS)
1.9.1.1 100% Compliance with the approved Performance Management Policy
0084 % Approved Performance Assessments submitted by prescribed deadline.
100 0.42 100 This is the entry year for the new PMDS system and substantial levels of assistance and review was required. A number of employees are not office bound resulting in logistical challenges in developing and concluding performance agreements and performance assessments.
The shortfall in annual assessments will be concluded prior to the external audit on predetermined objectives
SERVICE DELIVERY OBJECTIVES, INDICATORS AND ACHIEVEMENTSThe Strategic Management Department has been able to demonstrate results against its predetermined objectivesas indicated below:
PAGE
33

PERFORMANCE AGAINST PREDETERMINED OBJECTIVES: MEC approved Annual Performance Plan 2012/2013
Strategic Objective Measurable Objective Service Delivery Indicators Target Actual Deviation Challenges/Reasons for non-performance Plans to address challenges/Non-performance
1.2. Develop and implement stakeholder relationship management strategy
1.2.1.5 Four reports on the relationship between MTC and its identified stakeholders
0014 Number of reports on the stakeholder relationships.
4 4 0 Not applicable. Target Achieved. Not required
1.3. Implementation of organisation wide Performance Management System
1.3.1.7 Annual report consolidated and submitted 31 August.
0023 Number of Annual Reports consolidated and submitted by 31 August 2012
1 1 0 Not applicable. Target Achieved. Not required
1.3. Implementation of organisation wide Performance Management System
1.3.1.8 Performance Reports approved and submitted for each quarter
0024 Number of quarterly performance reports approved and submitted.
4 4 0 Not applicable. Target Achieved. Not required
1.3. Implementation of organisation wide Performance Management System
1.3.1.9 One Annual Performance Plan (APP) and Corporate Plan aligned to Treasury guidelines.
0025 Number of Annual Performance Plans approved by the Accounting Authority
1 1 0 Not applicable. Target Achieved. Not required
1.3. Implementation of organisation wide Performance Management System
1.3.1.9 One Annual performance Plan (APP) and Corporate Plan aligned to Treasury guidelines.
0026 Number of Corporate Plans approved by the Accounting Officer
1 1 0 Not applicable. Target Achieved. Not required
1.4. Design and implement an effective Business Performance Improvement Strategy
1.4.1.1 Comprehensive organisation wide excellence model established
0031 South African Excellence Framework model adopted
1 1 0 Not applicable. Target Achieved. Not required
1.4. Design and implement an effective Business Performance Improvement Strategy
1.4.1.2 Three business processes refined for organisational performance improvement
0032 Number of business processes refined for organisational performance improvement
3 3 0 Not applicable. Target Achieved. Not required
1.5. Establish and implement an organisation wide Business Excellence Model
1.5.1.2 Integrated communication strategy developed
0034 Integrated communication strategy developed
1 1 0 Not applicable. Target Achieved. Not required
1.5. Establish and implement an organisation wide Business Excellence Model
1.5.1.3 Corporate branding strategy developed
0035 Corporate branding strategy developed
1 1 0 Not applicable. Target Achieved. Not required
1.5. Establish and implement an organisation wide Business Excellence Model
1.5.1.6 4 Workshops with key stakeholders facilitated
0038 Number of workshops with key stakeholders facilitated
4 4 0 Not applicable. Target Achieved. Not required
1.5. Establish and implement an organisation wide Business Excellence Model
1.5.1.7 4 Quarterly reports on engagements with stakeholders
0039 Number of quarterly reports on engagements with stakeholders
4 4 0 Not applicable. Target Achieved. Not required
1.5. Establish and implement an organisation wide Business Excellence Model
1.5.2.1 Social Media Optimisation Options researched
0040 Report on social media optimisation options
1 1 0 Not applicable. Target Achieved. Not required
1.5. Establish and implement an organisation wide Business Excellence Model
1.5.2.2 50% of Approved Social Media Optimisation Platform implemented
0041 % of Approved Social Media Optimisation Platform implemented
50 50 0 Not applicable. Target Achieved. Not required
1.5. Establish and implement an organisation wide Business Excellence Model
1.5.2.3 50% of Approved Social Media Optimisation Platform implemented
0042 Number of reports on implementation of selected social media optimisation platform submitted
3 3 0 Not applicable. Target Achieved. Not required
1.7. Provide a reliable and integrated ICT platform
1.7.2.1 45% of Master Systems Plan Implemented
0064 % of Master Systems Plan Implemented
45 35 10 CCSIT have started an SQL class. There will be a delay in certificates due to this action taken by the ICT Manage because this course is only run on an adhoc basis when enough students are available to attend
There are 3 courses that still need to be run, the LAN and ITS technician need only to write the exam. The ICT Manager needs to complete the course. Exams will be written on a monthly basis starting from 15 05 2013
1.7. Provide a reliable and integrated ICT platform
1.7.2.2 Disaster Recovery Plan 2013/2014 costed and approved
0065 % of Disaster Recovery Plan costed and approved
50 50 0 Not applicable. Target Achieved. Not required
1.7. Provide a reliable and integrated ICT platform
1.7.2.4 70 Staff Members using the Company Intranet
0067 Number of Intranet Users 70 70 0 Not applicable. Target Achieved. Not required
1.7. Provide a reliable and integrated ICT platform
1.7.3.1 75% of Enterprise Resource Planning System Implemented
0069 % of Enterprise Resource Planning System Implemented
75 75 0 Not applicable. Target Achieved. Not required
1.9. Implement an individual Performance Management and Development System (PMDS)
1.9.1.1 100% Compliance with the approved Performance Management Policy
0083 % Approved Performance Agreements submitted by prescribed deadline.
100 29.41 71 This is the entry year for the new PMDS system and substantial levels of assistance and review has been required. A number of employees are not office bound resulting in logistical challenges in developing and concluding performance agreements.
The shortfall in agreements will be completed in time for the Annual Assessments. Additional human resources will be appointed to assist with the system admin in addition to training and development in support of timeous PMDS outcomes
1.9. Implement an individual Performance Management and Development System (PMDS)
1.9.1.1 100% Compliance with the approved Performance Management Policy
0084 % Approved Performance Assessments submitted by prescribed deadline.
100 0.42 100 This is the entry year for the new PMDS system and substantial levels of assistance and review was required. A number of employees are not office bound resulting in logistical challenges in developing and concluding performance agreements and performance assessments.
The shortfall in annual assessments will be concluded prior to the external audit on predetermined objectives
PAGE
34

PERFORMANCE AGAINST PREDETERMINED OBJECTIVES: Board approved Annual Operational Plan 2012/2013
Strategic Objective Measurable Objective Service Delivery Indicators Target Actual Deviation Challenges/Reasons for non-performance Plans to address challenges/Non-performance
1.1. Provide Strategic direction through effective leadership and good governance
1.1.1.5 3 Strategic Risks reduced to an acceptable level
0005 Number of Strategic Risks reduced to an acceptable level
3 1 2 Due to the delayed approval of the recapitalisation plan, the mitigation systems in support of Operations and Engineering risks could not be implemented.
The recapitalisation plan has been resubmitted to Treasury and the Corporation is awaiting feedback.
1.1. Provide Strategic direction through effective leadership and good governance
1.1.1.9 100% Compliance with the approved Risk Management and Fraud Prevention Policy
0009 % Compliance with the approved Risk Management and Fraud Prevention Policy
100 70.60 29.40 Due to time and human resource constraints, certain policy revisions and workshops have not taken place.
The policy revisions, workshops and remaining strategy developments will take place during the new financial year
1.2. Develop and implement stakeholder relationship management strategy
1.2.1.1 25% of the Board Approved Stakeholder Relationship Management Strategy Implemented
0010 % Approved Stakeholder Relationship Management Strategy Implemented
25 25 0 Not applicable. Target Achieved. Not required
1.2. Develop and implement stakeholder relationship management strategy
1.2.1.2 Stakeholder Relationship Management Strategy Developed and Approved
0011 % of Stakeholder Relationship Management Strategy Developed and Approved
100 100 0 Not applicable. Target Achieved. Not required
1.2. Develop and implement stakeholder relationship management strategy
1.2.1.3 25% Stakeholder Management System Implemented
0012 % of Stakeholder Management System Implemented
25 25 0 Not applicable. Target Achieved. Not required
1.2. Develop and implement stakeholder relationship management strategy
1.2.1.4 Satisfaction Survey Conducted on identified stakeholders
0013 Number of Stakeholder Satisfaction Surveys Conducted
1 1 0 Not applicable. Target Achieved. Not required
1.2. Develop and implement stakeholder relationship management strategy
1.2.1.6 100% Compliance with the Shareholder's Compact
0015 % Compliance with the Shareholder's Compact
100 100 0 Not applicable. Target Achieved. Not required
1.2. Develop and implement stakeholder relationship management strategy
1.2.1.7 50% Board Portal Implemented 0016 % Board Portal Implemented 50 50 0 Not applicable. Target Achieved. Not required
1.3. Implementation of organisation wide Performance Management System
1.3.1.1 100% Compliance with identified legislation
0017 % Compliance with identified legislation
100 100.00 0.00 Not applicable. Target Achieved. Not required
1.3. Implementation of organisation wide Performance Management System
1.3.1.10 75% Compliance with the approved Corporate Performance Framework
0027 % Compliance with the approved Corporate Performance Framework
100 100 0 Not applicable. Target Achieved. Not required
1.3. Implementation of organisation wide Performance Management System
1.3.1.11 75% of Corporate Performance Management System Implemented
0028 % of Organisational Performance Management System Implemented
75 75 0 Not applicable. Target Achieved. Not required
1.3. Implementation of organisation wide Performance Management System
1.3.1.12 75% of Employee Performance Management System Implemented
0029 % of Employee Performance Management System Implemented
75 75 0 Not applicable. Target Achieved. Not required
1.3. Implementation of organisation wide Performance Management System
1.3.1.13 5 Workshops held on Performance Management and Development
0030 Number of Workshops held on Performance Management and Development
5 5 0 Not applicable. Target Achieved. Not required
PERFORMANCE AGAINST PREDETERMINED OBJECTIVES: MEC approved Annual Performance Plan 2012/2013
Strategic Objective Measurable Objective Service Delivery Indicators Target Actual Deviation Challenges/Reasons for non-performance Plans to address challenges/Non-performance
1.9. Implement an individual Performance Management and Development System (PMDS)
1.9.2.1 Skills development plan fully implemented to address employee development needs
0085 %Workplace Skills Plan Implemented
100 77.62 22 Training has to be provided by accredited service providers with valid Tax Clearance Certificates and they are not always available
Training scheduled for April 2013
1.9. Implement an individual Performance Management and Development System (PMDS)
1.9.2.2 Skills Development Plan developed to build capacity and improve organisational performance; identify skills gaps and promote employees development needs.
0086 Number of Workplace Skills Plans developed.
1 1 0 Not applicable. Target Achieved. Not required
1.9. Implement an individual Performance Management and Development System (PMDS)
1.9.3.1 100% Employee Wellness Management Plan Implemented
0087 % Employee Wellness Management Plan Implemented
100 100 0 Not applicable. Target Achieved. Not required
1.9. Implement an individual Performance Management and Development System (PMDS)
1.9.3.2 Conduct an Annual Health and Safety Risk Assessment
0088 Report on annual Health and Safety risk assessment.
1 1 0 Not applicable. Target Achieved. Not required
1.11. Implement an effective and efficient inspectorate and safe operating environment
1.11.1.5 4 Health and Safety Act Compliance Reports submitted to the CEO
0103 Reports on Compliance with Health and Safety standards.
4 4 0 Not applicable. Target Achieved. Not required
PAGE
35

PERFORMANCE AGAINST PREDETERMINED OBJECTIVES: Board approved Annual Operational Plan 2012/2013
Strategic Objective Measurable Objective Service Delivery Indicators Target Actual Deviation Challenges/Reasons for non-performance Plans to address challenges/Non-performance
1.1. Provide Strategic direction through effective leadership and good governance
1.1.1.5 3 Strategic Risks reduced to an acceptable level
0005 Number of Strategic Risks reduced to an acceptable level
3 1 2 Due to the delayed approval of the recapitalisation plan, the mitigation systems in support of Operations and Engineering risks could not be implemented.
The recapitalisation plan has been resubmitted to Treasury and the Corporation is awaiting feedback.
1.1. Provide Strategic direction through effective leadership and good governance
1.1.1.9 100% Compliance with the approved Risk Management and Fraud Prevention Policy
0009 % Compliance with the approved Risk Management and Fraud Prevention Policy
100 70.60 29.40 Due to time and human resource constraints, certain policy revisions and workshops have not taken place.
The policy revisions, workshops and remaining strategy developments will take place during the new financial year
1.2. Develop and implement stakeholder relationship management strategy
1.2.1.1 25% of the Board Approved Stakeholder Relationship Management Strategy Implemented
0010 % Approved Stakeholder Relationship Management Strategy Implemented
25 25 0 Not applicable. Target Achieved. Not required
1.2. Develop and implement stakeholder relationship management strategy
1.2.1.2 Stakeholder Relationship Management Strategy Developed and Approved
0011 % of Stakeholder Relationship Management Strategy Developed and Approved
100 100 0 Not applicable. Target Achieved. Not required
1.2. Develop and implement stakeholder relationship management strategy
1.2.1.3 25% Stakeholder Management System Implemented
0012 % of Stakeholder Management System Implemented
25 25 0 Not applicable. Target Achieved. Not required
1.2. Develop and implement stakeholder relationship management strategy
1.2.1.4 Satisfaction Survey Conducted on identified stakeholders
0013 Number of Stakeholder Satisfaction Surveys Conducted
1 1 0 Not applicable. Target Achieved. Not required
1.2. Develop and implement stakeholder relationship management strategy
1.2.1.6 100% Compliance with the Shareholder's Compact
0015 % Compliance with the Shareholder's Compact
100 100 0 Not applicable. Target Achieved. Not required
1.2. Develop and implement stakeholder relationship management strategy
1.2.1.7 50% Board Portal Implemented 0016 % Board Portal Implemented 50 50 0 Not applicable. Target Achieved. Not required
1.3. Implementation of organisation wide Performance Management System
1.3.1.1 100% Compliance with identified legislation
0017 % Compliance with identified legislation
100 100.00 0.00 Not applicable. Target Achieved. Not required
1.3. Implementation of organisation wide Performance Management System
1.3.1.10 75% Compliance with the approved Corporate Performance Framework
0027 % Compliance with the approved Corporate Performance Framework
100 100 0 Not applicable. Target Achieved. Not required
1.3. Implementation of organisation wide Performance Management System
1.3.1.11 75% of Corporate Performance Management System Implemented
0028 % of Organisational Performance Management System Implemented
75 75 0 Not applicable. Target Achieved. Not required
1.3. Implementation of organisation wide Performance Management System
1.3.1.12 75% of Employee Performance Management System Implemented
0029 % of Employee Performance Management System Implemented
75 75 0 Not applicable. Target Achieved. Not required
1.3. Implementation of organisation wide Performance Management System
1.3.1.13 5 Workshops held on Performance Management and Development
0030 Number of Workshops held on Performance Management and Development
5 5 0 Not applicable. Target Achieved. Not required
PERFORMANCE AGAINST PREDETERMINED OBJECTIVES: MEC approved Annual Performance Plan 2012/2013
Strategic Objective Measurable Objective Service Delivery Indicators Target Actual Deviation Challenges/Reasons for non-performance Plans to address challenges/Non-performance
1.9. Implement an individual Performance Management and Development System (PMDS)
1.9.2.1 Skills development plan fully implemented to address employee development needs
0085 %Workplace Skills Plan Implemented
100 77.62 22 Training has to be provided by accredited service providers with valid Tax Clearance Certificates and they are not always available
Training scheduled for April 2013
1.9. Implement an individual Performance Management and Development System (PMDS)
1.9.2.2 Skills Development Plan developed to build capacity and improve organisational performance; identify skills gaps and promote employees development needs.
0086 Number of Workplace Skills Plans developed.
1 1 0 Not applicable. Target Achieved. Not required
1.9. Implement an individual Performance Management and Development System (PMDS)
1.9.3.1 100% Employee Wellness Management Plan Implemented
0087 % Employee Wellness Management Plan Implemented
100 100 0 Not applicable. Target Achieved. Not required
1.9. Implement an individual Performance Management and Development System (PMDS)
1.9.3.2 Conduct an Annual Health and Safety Risk Assessment
0088 Report on annual Health and Safety risk assessment.
1 1 0 Not applicable. Target Achieved. Not required
1.11. Implement an effective and efficient inspectorate and safe operating environment
1.11.1.5 4 Health and Safety Act Compliance Reports submitted to the CEO
0103 Reports on Compliance with Health and Safety standards.
4 4 0 Not applicable. Target Achieved. Not required
PAGE
36

PERFORMANCE AGAINST PREDETERMINED OBJECTIVES: MEC approved Annual Performance Plan 2012/2013
Strategic Objective Measurable Objective Service Delivery Indicators Target Actual Deviation Challenges/Reasons for non-performance Plans to address challenges/Non-performance
1.5. Establish and implement an organisation wide Business Excellence Model
1.5.1.1 100% of approved Marketing Plan implemented
0033 % of Approved Marketing Plan Implemented
100 100 0 Not applicable. Target Achieved. Not required
1.5. Establish and implement an organisation wide Business Excellence Model
1.5.1.4 3 Marketing Tools Developed 0036 Number of Marketing Tools Developed
3 3 0 Not applicable. Target Achieved. Not required
1.5. Establish and implement an organisation wide Business Excellence Model
1.5.1.5 2 Quarterly Internal Newsletters Circulated
0037 Number of quarterly internal newsletters circulated
2 2 0 Not applicable. Target Achieved. Not required
1.6. Maintain reliable and sustainable Financial Management practices
1.6.1.3 Unqualified strategic management audit report
0045 Number of strategic management qualifications
0 0 0 Not applicable. Target Achieved. Not required
1.6. Maintain reliable and sustainable Financial Management practices
1.6.5.4 Strategic Management maximum budget variance of 5 percent maintained
0056 % Budget Variance Maintained 5 - - The actual performance cannot be determined as expenditure against budget for the Strategic Management Department is not yet being tracked by the Financial Management System.
Finance Division to ensure that the Strategic Management Budget is loaded onto the Financial Management System (Pastel Evolution)
1.7. Provide a reliable and integrated ICT platform
1.7.1.1 The servers have a maximum downtime of 8 hours throughout the year.
0063 Hours of server downtime within the year
8 0 8 Target Exceeded due to back-up systems in place Not required
1.7. Provide a reliable and integrated ICT platform
1.7.2.3 100% of Admin Systems Software licensed
0066 % of Admin Systems Software licensed
100 100 0 Not applicable. Target Achieved. Not required
1.7. Provide a reliable and integrated ICT platform
1.7.2.5 3 ICT Policies approved by the Board
0068 Number of policies approved 3 3 0 Not applicable. Target Achieved. Not required
1.10. Develop and implement an Integrated Human Resource Plan
1.10.3.2 100% Compliance with Study Loan Agreements
0097 % Compliance with Study Loan Agreements
100 100 0 Not applicable. Target Achieved. Not required
3.2. Increase ridership 3.2.1.2 Conduct a bi-annual customer satisfaction survey on each route
0125 Number of Bi-Annual Customer Satisfaction Surveys Conducted
43 43 0 Not applicable. Target Achieved. Not required
PAGE
37

PERFORMANCE AGAINST PREDETERMINED OBJECTIVES: MEC approved Annual Performance Plan 2012/2013
Strategic Objective Measurable Objective Service Delivery Indicators Target Actual Deviation Challenges/Reasons for non-performance Plans to address challenges/Non-performance
1.5. Establish and implement an organisation wide Business Excellence Model
1.5.1.1 100% of approved Marketing Plan implemented
0033 % of Approved Marketing Plan Implemented
100 100 0 Not applicable. Target Achieved. Not required
1.5. Establish and implement an organisation wide Business Excellence Model
1.5.1.4 3 Marketing Tools Developed 0036 Number of Marketing Tools Developed
3 3 0 Not applicable. Target Achieved. Not required
1.5. Establish and implement an organisation wide Business Excellence Model
1.5.1.5 2 Quarterly Internal Newsletters Circulated
0037 Number of quarterly internal newsletters circulated
2 2 0 Not applicable. Target Achieved. Not required
1.6. Maintain reliable and sustainable Financial Management practices
1.6.1.3 Unqualified strategic management audit report
0045 Number of strategic management qualifications
0 0 0 Not applicable. Target Achieved. Not required
1.6. Maintain reliable and sustainable Financial Management practices
1.6.5.4 Strategic Management maximum budget variance of 5 percent maintained
0056 % Budget Variance Maintained 5 - - The actual performance cannot be determined as expenditure against budget for the Strategic Management Department is not yet being tracked by the Financial Management System.
Finance Division to ensure that the Strategic Management Budget is loaded onto the Financial Management System (Pastel Evolution)
1.7. Provide a reliable and integrated ICT platform
1.7.1.1 The servers have a maximum downtime of 8 hours throughout the year.
0063 Hours of server downtime within the year
8 0 8 Target Exceeded due to back-up systems in place Not required
1.7. Provide a reliable and integrated ICT platform
1.7.2.3 100% of Admin Systems Software licensed
0066 % of Admin Systems Software licensed
100 100 0 Not applicable. Target Achieved. Not required
1.7. Provide a reliable and integrated ICT platform
1.7.2.5 3 ICT Policies approved by the Board
0068 Number of policies approved 3 3 0 Not applicable. Target Achieved. Not required
1.10. Develop and implement an Integrated Human Resource Plan
1.10.3.2 100% Compliance with Study Loan Agreements
0097 % Compliance with Study Loan Agreements
100 100 0 Not applicable. Target Achieved. Not required
3.2. Increase ridership 3.2.1.2 Conduct a bi-annual customer satisfaction survey on each route
0125 Number of Bi-Annual Customer Satisfaction Surveys Conducted
43 43 0 Not applicable. Target Achieved. Not required
PAGE
38

STRATEGIC GOALEnsure an efficient, effective and service oriented organisation.
PURPOSEThis programme also ensures the provision of systematic financial management systems designed to co-ordinate the organisation’s budget and resource requirements. Such activities include ensuring compliance with regulatory provisions required to facilitate the funding of the MTC as well as to take appropriate steps to ensure that expenditure occurs within the approved budget and to prevent overspending of the budget. Systematic financial management systems also entail the maintenance of a procurement system that is fair, equitable, transparent and cost-effective; and alsoensures that effective and appropriate steps are taken to prevent unauthorised, irregular or fruitless and wasteful expenditure.
PROGRAMME STRUCTUREFinancial Management • Supply Chain Management • Creditors Payments and ReconciliationsRevenue Management • Salaries Administration
PROGRAMME 3Finance
OVERVIEW OF DEPARTMENTAL PERFORMANCE
The Finance Department has for the major part of the financial year under review operated without a Chief Financial Officer and this has resulted in some performance targets not being achieved. The annual performance report for the period reflects an overall score off 67% for the division which compares positively to the overall 63 % achievement by the entity against its Annual Operational Plan.
These positive results are due to additional efforts implemented in the 4th quarter which has resulted in noteworthy achievements such as:
• 75% of the Pastel Evolution System has been implemented,
• 100% of the fixed asset registers being compliant with GAAP,
• 88% of the internal audit intervention plan implemented.
In order to support continuity of service delivery, the Finance Department has within the limited financial resources at its disposal continued meeting its financial obligations with its service providers. This includes among other things the setting aside of R5
million for the servicing of bus finance lease obligations.
In order to enhance service delivery, the entity has for the 2014 financial year set aside R12,2 million for the purchase of additional buses while a further R1 million has been set aside for the refurbishment of the current fleet of buses.
In order to enhance the skills within the Finance Department, the entity
will in the 2014 financial year appoint a permanent Chief Financial Officer.
PAGE
39

PUSHING FOR
TOTALPERFORMANCE
PAGE
40

PERFORMANCE AGAINST PREDETERMINED OBJECTIVES: MEC approved Annual Performance Plan 2012/2013
Strategic Objective Measurable Objective Service Delivery Indicators Target Actual Deviation Challenges/Reasons for non-performance Plans to address challenges/Non-performance
1.6. Maintain reliable and sustainable Financial Management practices
1.6.1.7 Unqualified financial management audit report
0049 Number of financial management qualifications
0 1 -1 Non-cash items have failed tests for completeness of revenue
Q Merit Reports to be reconciled will include non-cash and emergency ticket items
1.6. Maintain reliable and sustainable Financial Management practices
1.6.2.1 AFS approved by the Accounting authority and submitted to the AG by 31 May 2012
0050 Submission of Annual Financial Statements by 31 May.
1 1 0 Not applicable. Target Achieved. Not required
1.6. Maintain reliable and sustainable Financial Management practices
1.6.3.1 100% of Internal and External Audit Recommendations Implemented
0051 % of internal and external audit recommendations implemented.
100 88 12 The unresolved findings relate to the format of the AFS as well as certain reconciliations which remain due
The unresolved findings will be resolved in preparation for the 2012/2013 AFS
1.6. Maintain reliable and sustainable Financial Management practices
1.6.4.1 100% Fixed Asset Registers compliant with SA GAAP
0052 % of fixed asset registers compliant to SA GAAP
100 100 0 Not applicable. Target Achieved. Not required
1.6. Maintain reliable and sustainable Financial Management practices
1.6.6.1 Approved break even operational budget by 31 March 2013
0062 Approved operational budget 1 1 0 Not applicable. Target Achieved. Not required
1.8. Establish a world class and compliant Procurement Management System
1.8.1.1 All approved Supply Chain Management policies reviewed
0070 % of approved of policies reviewed
100 0 100 Review not complete as there are new changes and updates from Treasury to be included.
All SCM policy reviewed will be concluded during Q1 of 2013.2014. In addition, SCM regularly checks the Treasury website for new SCM updates and apply such to our SCM Policy.
1.8. Establish a world class and compliant Procurement Management System
1.8.2.1 Report on the implementation of procurement plan
0071 Number of reports on implementation of approved procurement plan
2 0 2 The Procurement Plan was only recently finalised and therefore no implementation thereof has taken place.
The Procurement Plan will be updated in accordance with 2013/14 requirements and implemented accordingly
1.8. Establish a world class and compliant Procurement Management System
1.8.1.1 Approved corporation procurement plan.
0072 Corporation procurement plan developed and approved
1 0 1 Procurement plans are in draft format and not yet refined for Board approval
Submit the procurement plan for Board approval.
1.8. Establish a world class and compliant Procurement Management System
1.8.2.1 Tenders Awards Report submitted to the Board on a quarterly basis
0073 Number of reports to Board on tenders awarded
4 2 2 The compliance report has not yet been developed due to Human Resource constraints
Additional resources have been allocated to the SCM division. The compliance report will be developed during Q1 of 2013.2014
1.8. Establish a world class and compliant Procurement Management System
1.8.4.2 Provide SCM compliance reports to the Audit Committee
0074 Number of Supply Chain Management compliance reports submitted.
1 0 1 The compliance report has not yet been developed due to Human Resource constraints
Additional resources have been allocated to the SCM division. The compliance report will be developed during Q1 of 2013.2014
1.8. Establish a world class and compliant Procurement Management System
1.8.4.3 Report on disposal of corporate assets
0075 Number of reports on disposal of corporate assets
4 1 3 The compliance report has not yet been developed due to Human Resource constraints
Additional resources have been allocated to the SCM division. The compliance report will be developed during Q1 of 2013.2014
1.8. Establish a world class and compliant Procurement Management System
1.8.5.1 60% of Project Funding spent with HDIs and SMMEs
0076 % of Project Funding spent with HDIs and SMMEs
60 0 60 The compliance report has not yet been developed due to Human Resource constraints
Additional resources have been allocated to the SCM division. The compliance report will be developed during Q1 of 2013.2014
1.8. Establish a world class and compliant Procurement Management System
1.8.6.1 Report on Business Process Optimiser (BPO).
0077 Number of monthly Inventory reports generated from the Business Process Optimiser (BPO) system.
12 12 0 Not applicable. Target Achieved. Not required
1.8. Establish a world class and compliant Procurement Management System
1.8.7.1 Report on Supplier performance 0078 Number of Reports on Supplier performance.
1 0 1 The compliance report has not yet been developed due to Human Resource constraints
Additional resources have been allocated to the SCM division. The compliance report will be developed during Q1 of 2013.2014
1.8. Establish a world class and compliant Procurement Management System
1.8.8.1 Conduct quarterly stock counts 0080 Number of stock counts conducted on all stock
4 4 0 Not applicable. Target Achieved. Not required
1.8. Establish a world class and compliant Procurement Management System
1.8.9.1 Conduct quarterly asset verifications
0081 Number of verifications conducted on all assets
4 4 0 Not applicable. Target Achieved. Not required
SERVICE DELIVERY OBJECTIVES, INDICATORS AND ACHIEVEMENTSThe Finance Department has been able to demonstrate results against its predetermined objectives as indicated below:
PAGE
41

PERFORMANCE AGAINST PREDETERMINED OBJECTIVES: MEC approved Annual Performance Plan 2012/2013
Strategic Objective Measurable Objective Service Delivery Indicators Target Actual Deviation Challenges/Reasons for non-performance Plans to address challenges/Non-performance
1.6. Maintain reliable and sustainable Financial Management practices
1.6.1.7 Unqualified financial management audit report
0049 Number of financial management qualifications
0 1 -1 Non-cash items have failed tests for completeness of revenue
Q Merit Reports to be reconciled will include non-cash and emergency ticket items
1.6. Maintain reliable and sustainable Financial Management practices
1.6.2.1 AFS approved by the Accounting authority and submitted to the AG by 31 May 2012
0050 Submission of Annual Financial Statements by 31 May.
1 1 0 Not applicable. Target Achieved. Not required
1.6. Maintain reliable and sustainable Financial Management practices
1.6.3.1 100% of Internal and External Audit Recommendations Implemented
0051 % of internal and external audit recommendations implemented.
100 88 12 The unresolved findings relate to the format of the AFS as well as certain reconciliations which remain due
The unresolved findings will be resolved in preparation for the 2012/2013 AFS
1.6. Maintain reliable and sustainable Financial Management practices
1.6.4.1 100% Fixed Asset Registers compliant with SA GAAP
0052 % of fixed asset registers compliant to SA GAAP
100 100 0 Not applicable. Target Achieved. Not required
1.6. Maintain reliable and sustainable Financial Management practices
1.6.6.1 Approved break even operational budget by 31 March 2013
0062 Approved operational budget 1 1 0 Not applicable. Target Achieved. Not required
1.8. Establish a world class and compliant Procurement Management System
1.8.1.1 All approved Supply Chain Management policies reviewed
0070 % of approved of policies reviewed
100 0 100 Review not complete as there are new changes and updates from Treasury to be included.
All SCM policy reviewed will be concluded during Q1 of 2013.2014. In addition, SCM regularly checks the Treasury website for new SCM updates and apply such to our SCM Policy.
1.8. Establish a world class and compliant Procurement Management System
1.8.2.1 Report on the implementation of procurement plan
0071 Number of reports on implementation of approved procurement plan
2 0 2 The Procurement Plan was only recently finalised and therefore no implementation thereof has taken place.
The Procurement Plan will be updated in accordance with 2013/14 requirements and implemented accordingly
1.8. Establish a world class and compliant Procurement Management System
1.8.1.1 Approved corporation procurement plan.
0072 Corporation procurement plan developed and approved
1 0 1 Procurement plans are in draft format and not yet refined for Board approval
Submit the procurement plan for Board approval.
1.8. Establish a world class and compliant Procurement Management System
1.8.2.1 Tenders Awards Report submitted to the Board on a quarterly basis
0073 Number of reports to Board on tenders awarded
4 2 2 The compliance report has not yet been developed due to Human Resource constraints
Additional resources have been allocated to the SCM division. The compliance report will be developed during Q1 of 2013.2014
1.8. Establish a world class and compliant Procurement Management System
1.8.4.2 Provide SCM compliance reports to the Audit Committee
0074 Number of Supply Chain Management compliance reports submitted.
1 0 1 The compliance report has not yet been developed due to Human Resource constraints
Additional resources have been allocated to the SCM division. The compliance report will be developed during Q1 of 2013.2014
1.8. Establish a world class and compliant Procurement Management System
1.8.4.3 Report on disposal of corporate assets
0075 Number of reports on disposal of corporate assets
4 1 3 The compliance report has not yet been developed due to Human Resource constraints
Additional resources have been allocated to the SCM division. The compliance report will be developed during Q1 of 2013.2014
1.8. Establish a world class and compliant Procurement Management System
1.8.5.1 60% of Project Funding spent with HDIs and SMMEs
0076 % of Project Funding spent with HDIs and SMMEs
60 0 60 The compliance report has not yet been developed due to Human Resource constraints
Additional resources have been allocated to the SCM division. The compliance report will be developed during Q1 of 2013.2014
1.8. Establish a world class and compliant Procurement Management System
1.8.6.1 Report on Business Process Optimiser (BPO).
0077 Number of monthly Inventory reports generated from the Business Process Optimiser (BPO) system.
12 12 0 Not applicable. Target Achieved. Not required
1.8. Establish a world class and compliant Procurement Management System
1.8.7.1 Report on Supplier performance 0078 Number of Reports on Supplier performance.
1 0 1 The compliance report has not yet been developed due to Human Resource constraints
Additional resources have been allocated to the SCM division. The compliance report will be developed during Q1 of 2013.2014
1.8. Establish a world class and compliant Procurement Management System
1.8.8.1 Conduct quarterly stock counts 0080 Number of stock counts conducted on all stock
4 4 0 Not applicable. Target Achieved. Not required
1.8. Establish a world class and compliant Procurement Management System
1.8.9.1 Conduct quarterly asset verifications
0081 Number of verifications conducted on all assets
4 4 0 Not applicable. Target Achieved. Not required
PAGE
42

PERFORMANCE AGAINST PREDETERMINED OBJECTIVES: Board approved Annual Operational Plan 2012/2013
Strategic Objective Measurable Objective Service Delivery Indicators Target Actual Deviation Challenges/Reasons for non-performance Plans to address challenges/Non-performance
1.1. Provide Strategic direction through effective leadership and good governance
1.1.1.6 1 Finance (Admin Programme) strategic risk reduced to an acceptable level
0006 Number of Finance strategic risks reduced to an acceptable level
- 0 - Not applicable. No target for the period under review
Not required
1.3. Implementation of organisation wide Performance Management System
1.3.1.5 100% Compliance with identified Finance related legislation
0021 % Compliance with identified Finance related legislation
100 84 16 The Corporation did not obtain approval from the MEC when committing to bus lease obligations.
The corporation has motivated to DoT to utilise the 2013/14 capital grant to settle part of the long-term lease liabilities.
1.3. Implementation of organisation wide Performance Management System
1.3.1.6 100% Compliance with identified Supply Chain related legislation
0022 % Compliance with identified Supply Chain related legislation
100 96 4 Training in terms of the Framework for Minimum Training and Deployment has not taken place.
The necessary training will be included in the 2013.214 Workplace Skills Plan and implementing by the end of the new financial year
1.6. Maintain reliable and sustainable Financial Management practices
1.6.1.1 Unqualified Audit Opinion 0043 % Audit report Unqualified 100 90.91 9.09 2 Qualifications were obtained due to R1.6 m non-cash items having failed tests on completeness of revenue and asset impairment
Q Merit Reports to be reconciled will include non-cash and emergency ticket items
1.6. Maintain reliable and sustainable Financial Management practices
1.6.1.4 Unqualified supply chain management audit report
0046 Number of supply chain management qualifications
0 1 -1 Only one stock count was done in the previous year and BPO has not been set correctly hence there were misallocation of stock issues
A request to CO3 was sent to correct the usage settings for all categories per depot.
1.6. Maintain reliable and sustainable Financial Management practices
1.6.5.1 100% Compliance with approved Audit Committee Charter
0053 % Compliance with approved Audit Committee Charter
100 100 0 Not applicable. Target Achieved. Not required
1.6. Maintain reliable and sustainable Financial Management practices
1.6.5.2 Maximum Budget variance of 5 percent maintained
0054 % Budget Variance Maintained 5 1 4 Target exceeded due to compliance with internal controls and procedures
Not required. Target partially exceeded
1.6. Maintain reliable and sustainable Financial Management practices
1.6.5.3 Executive Office maximum budget variance of 5 percent maintained
0055 % Budget Variance Maintained 5 1 4 Target exceeded due to compliance with internal controls and procedures
Not required. Target partially exceeded
1.6. Maintain reliable and sustainable Financial Management practices
1.6.5.5 Finance maximum budget variance of 5 percent maintained
0057 % Budget Variance Maintained 5 1 4 Target exceeded due to compliance with internal controls and procedures
Not required. Target partially exceeded
1.6. Maintain reliable and sustainable Financial Management practices
1.6.5.6 Supply Chain Management maximum budget variance of 5 percent maintained
0058 % Budget Variance Maintained 5 1 4 Target exceeded due to compliance with internal controls and procedures
Not required. Target partially exceeded
1.8. Establish a world class and compliant Procurement Management System
1.8.7.2 100% Compliance with Lease Agreements
0079 % Compliance with Lease Agreements
100 0 100 The compliance report has not yet been developed due to Human Resource constraints
Additional resources have been allocated to the SCM division. The compliance report will be devloped during Q1 of 2013.2014
1.8. Establish a world class and compliant Procurement Management System
1.8.9.2 Conduct quarterly asset verification.
0082 Number of approved asset register versions
4 4 0 Not applicable. Target Achieved. Not required
PAGE
43

PERFORMANCE AGAINST PREDETERMINED OBJECTIVES: Board approved Annual Operational Plan 2012/2013
Strategic Objective Measurable Objective Service Delivery Indicators Target Actual Deviation Challenges/Reasons for non-performance Plans to address challenges/Non-performance
1.1. Provide Strategic direction through effective leadership and good governance
1.1.1.6 1 Finance (Admin Programme) strategic risk reduced to an acceptable level
0006 Number of Finance strategic risks reduced to an acceptable level
- 0 - Not applicable. No target for the period under review
Not required
1.3. Implementation of organisation wide Performance Management System
1.3.1.5 100% Compliance with identified Finance related legislation
0021 % Compliance with identified Finance related legislation
100 84 16 The Corporation did not obtain approval from the MEC when committing to bus lease obligations.
The corporation has motivated to DoT to utilise the 2013/14 capital grant to settle part of the long-term lease liabilities.
1.3. Implementation of organisation wide Performance Management System
1.3.1.6 100% Compliance with identified Supply Chain related legislation
0022 % Compliance with identified Supply Chain related legislation
100 96 4 Training in terms of the Framework for Minimum Training and Deployment has not taken place.
The necessary training will be included in the 2013.214 Workplace Skills Plan and implementing by the end of the new financial year
1.6. Maintain reliable and sustainable Financial Management practices
1.6.1.1 Unqualified Audit Opinion 0043 % Audit report Unqualified 100 90.91 9.09 2 Qualifications were obtained due to R1.6 m non-cash items having failed tests on completeness of revenue and asset impairment
Q Merit Reports to be reconciled will include non-cash and emergency ticket items
1.6. Maintain reliable and sustainable Financial Management practices
1.6.1.4 Unqualified supply chain management audit report
0046 Number of supply chain management qualifications
0 1 -1 Only one stock count was done in the previous year and BPO has not been set correctly hence there were misallocation of stock issues
A request to CO3 was sent to correct the usage settings for all categories per depot.
1.6. Maintain reliable and sustainable Financial Management practices
1.6.5.1 100% Compliance with approved Audit Committee Charter
0053 % Compliance with approved Audit Committee Charter
100 100 0 Not applicable. Target Achieved. Not required
1.6. Maintain reliable and sustainable Financial Management practices
1.6.5.2 Maximum Budget variance of 5 percent maintained
0054 % Budget Variance Maintained 5 1 4 Target exceeded due to compliance with internal controls and procedures
Not required. Target partially exceeded
1.6. Maintain reliable and sustainable Financial Management practices
1.6.5.3 Executive Office maximum budget variance of 5 percent maintained
0055 % Budget Variance Maintained 5 1 4 Target exceeded due to compliance with internal controls and procedures
Not required. Target partially exceeded
1.6. Maintain reliable and sustainable Financial Management practices
1.6.5.5 Finance maximum budget variance of 5 percent maintained
0057 % Budget Variance Maintained 5 1 4 Target exceeded due to compliance with internal controls and procedures
Not required. Target partially exceeded
1.6. Maintain reliable and sustainable Financial Management practices
1.6.5.6 Supply Chain Management maximum budget variance of 5 percent maintained
0058 % Budget Variance Maintained 5 1 4 Target exceeded due to compliance with internal controls and procedures
Not required. Target partially exceeded
1.8. Establish a world class and compliant Procurement Management System
1.8.7.2 100% Compliance with Lease Agreements
0079 % Compliance with Lease Agreements
100 0 100 The compliance report has not yet been developed due to Human Resource constraints
Additional resources have been allocated to the SCM division. The compliance report will be devloped during Q1 of 2013.2014
1.8. Establish a world class and compliant Procurement Management System
1.8.9.2 Conduct quarterly asset verification.
0082 Number of approved asset register versions
4 4 0 Not applicable. Target Achieved. Not required
PAGE
44

STRATEGIC GOALEnsure an efficient, effective and service oriented organisation.
PURPOSEProvides an internal enabling function and support service to the other programmes with regard to Human Resource Management and Development.
PROGRAMME STRUCTUREHR Management Services • Security and Inspectorate • Training and DevelopmentEmployment Relations and Integrated Wellness
PROGRAMME 4Human Resources
OVERVIEW OF DEPARTMENTAL PERFORMANCE
Human Resource Management (HRM) is anchored on the four core values of the Corporation: integrity, consultation, innovativeness and accountability as it implements Corporation Polices. Core functions include Compensation of Employees, Staffing, Integrated Wellness, Industrial Relations, Employment Equity, Training and Development.
HRM also forms strategic partnerships in a collaborative approach with other divisions in managing people and the workplace culture and environment. This is done in order to enable employees to contribute effectively and productively to the overall corporation direction that will result in the accomplishment of the organization’s
goals and objectives.When the Corporation was established in 1990, former Ciskei Transport Corporation (CTC) employees were employed in the Operations and EngineeringDivisions to kick-start MTC. Natural attrition is now catching up with these employees and management is seizing this opportunity by building younger talent into the organization. The flipside of this occurrence is that experienced staff are exiting and in some cases leaving a void within the institutional memory of MTC.
The HRM Division did not do well in achieving performance targets. Performance management was implemented for the first time and it is hoped that many lessons that
were learnt will be put into good use moving into the future. Positive changes include the hiringof the Wellness Manager whom has had a positive influence on Employment Relations. Several workshops were conducted culminating in Voluntary Counseling and Testing of a significant numberof employees. The Employment Equitytargets set out in the Employment Equity Plan were also achieved.
One of the biggest challenges is the high bus driver turnover. This is exacerbated by the zero tolerance long adopted by the Corporation on pilfering. In spite of various interventions initiated by management to mitigate this risk,it has not abated.
PAGE
45

PAGE
46

PERFORMANCE AGAINST PREDETERMINED OBJECTIVES: MEC approved Annual Performance Plan 2012/2013
Strategic Objective Measurable Objective Service Delivery Indicators Target Actual Deviation Challenges/Reasons for non-performance Plans to address challenges/Non-performance
1.9. Implement an individual Performance Management and Development System (PMDS)
1.9.4.1 Conclude all enquiry's and appeals within 30 days from start of case under normal circumstances
0089 Maximum number of days to finalise disciplinary hearings.
30 12.74 17 Target exceeded Presiding officers expediting enquiries
Not required
1.9. Implement an individual Performance Management and Development System (PMDS)
1.9.4.2 Unresolved grievances promote toxic conversation amongst the workforce; this may lead to instability. Grievances shall be resolved within 10 days
0090 Average number of days to resolve internal disputes.
10 4 6 Target exceeded Presiding officers expediting enquiries
Not required
1.9. Implement an individual Performance Management and Development System (PMDS)
1.9.4.3 2 Workshops held on dealing with Industrial Relations matters for Managers at all levels
0091 Number of workshops on Grievance Management, Work Ethics and Chairing Disciplinary enquiries.
2 2 0 Not applicable. Target Achieved. Not required
1.10. Develop and implement an Integrated Human Resource Plan
1.10.1.1 Maximum Vacancy Rate of 5% for all Funded Positions
0092 Average vacancy % rate in the Corporation
5 3.22 1.78 Target exceeded due to consistent monitoring by HR and sending notices to programmes re vacant positions
Not applicable. Target partially exceeded
1.10. Develop and implement an Integrated Human Resource Plan
1.10.1.2 Vacant positions filled within six weeks of approved request
0093 Average number of days to complete the recruitment process.
45 24 21 Overachievement due to HR interviewing bus drivers and keeping those recommended for employment in the data base
Target for 2013/2014 to be increased to 30 days
1.10. Develop and implement an Integrated Human Resource Plan
1.10.2.1 Improve employment equity levels by ensuring that 22% of all Funded Positions are held by Women
0094 % of funded positions held by Women
22 19 3 HR not getting enough female applicants in core programmes that constitute bigger number of Corporation employees
HR will initiate skills development programmes targeting females
1.10. Develop and implement an Integrated Human Resource Plan
1.10.2.2 Improve employment equity levels of MTC by employing a physically challenged person annually
0095 Number of Persons with disabilities Employed.
1 1 0 Not applicable. Target Achieved. Not required
1.10. Develop and implement an Integrated Human Resource Plan
1.10.3.1 Approved HR Plan in place by 31 March 2013
0096 % approved HR Plan developed and reviewed.
100 25 75 Not achieved due to time constraints and the amount of work needed to be done
A consultant will be engaged to assist in finalising the document
1.10. Develop and implement an Integrated Human Resource Plan
1.10.3.3 28 Women selected for Management and Development Programmes
0098 Number of women selected for Management Development Programmes.
14 0 14 Positions that were filled by males in Q3 were for two diesel mechanics and three bus drivers. There were no female applicants for these positions.
Recruitment targeting women applicants
1.11. Implement an effective and efficient inspectorate and safe operating environment
1.11.1.1 100% Compliance with Minimum Physical Security Standards Compliance Checklist
0099 % Compliance with set Minimum Physical Security Standards.
100 0 100 Policy was approved late Q4 only Compliance will be monitored as from the new financial year
1.11. Implement an effective and efficient inspectorate and safe operating environment
1.11.1.2 Approved Corporation security policy with sets standards for personnel, vehicles, information, facilities and environment.
0100 Corporation Security Policy Approved
1 1 0 Not applicable. Target Achieved. Not required
1.11. Implement an effective and efficient inspectorate and safe operating environment
1.11.1.3 2 Reports on implementation of the Approved Security Policy submitted to Management and the Board
0101 Approved quarterly reports on the implementation of the Security Policy.
2 0 2 Policy was approved late Q4 only Compliance will be monitored as from the new financial year
1.11. Implement an effective and efficient inspectorate and safe operating environment
1.11.2.1 100% of short-listed candidates vetted before employment.
0104 % of personnel suitability check reports issued on individual short-listed candidates before employment.
100 0 100 Policy not approved Policy will be resubmitted to the Board in May 2013
PERFORMANCE AGAINST PREDETERMINED OBJECTIVES: Board approved Annual Operational Plan 2012/2013
Strategic Objective Measurable Objective Service Delivery Indicators Target Actual Deviation Challenges/Reasons for non-performance Plans to address challenges/Non-performance
1.3. Implementation of organisation wide Performance Management System
1.3.1.4 100% Compliance with identified Human Resources legislation
0020 % Compliance with identified Human Resources related legislation
100 100 0 Not applicable. Target Achieved. Not required
1.6. Maintain reliable and sustainable Financial Management practices
1.6.1.2 Unqualified human resource management audit report
0044 Number of Human Resource Management qualifications
0 0 0 Not applicable. Target Achieved. Not required
1.6. Maintain reliable and sustainable Financial Management practices
1.6.5.7 Human Resources maximum budget variance of 5 percent maintained
0059 % Budget Variance Maintained 5 - - The actual performance cannot be determined as expenditure against budget for the HR Management Department is not yet being tracked by the Financial Management System.
Finance Division to ensure that the HR Management Budget is loaded onto the Financial Management System (Pastel Evolution)
1.11. Implement an effective and efficient inspectorate and safe operating environment
1.11.1.4 75% Compliance with the approved Security Compliance Policy
0102 % Compliance with the approved Security Compliance Policy
75 0 75 Policy was approved late Q4 only Compliance will be monitored as from the new financial year
SERVICE DELIVERY OBJECTIVES, INDICATORS AND ACHIEVEMENTSThe Human Resource Management Department has been able to demonstrate results against its predetermined objectives as indicated below:
PAGE
47

PERFORMANCE AGAINST PREDETERMINED OBJECTIVES: MEC approved Annual Performance Plan 2012/2013
Strategic Objective Measurable Objective Service Delivery Indicators Target Actual Deviation Challenges/Reasons for non-performance Plans to address challenges/Non-performance
1.9. Implement an individual Performance Management and Development System (PMDS)
1.9.4.1 Conclude all enquiry's and appeals within 30 days from start of case under normal circumstances
0089 Maximum number of days to finalise disciplinary hearings.
30 12.74 17 Target exceeded Presiding officers expediting enquiries
Not required
1.9. Implement an individual Performance Management and Development System (PMDS)
1.9.4.2 Unresolved grievances promote toxic conversation amongst the workforce; this may lead to instability. Grievances shall be resolved within 10 days
0090 Average number of days to resolve internal disputes.
10 4 6 Target exceeded Presiding officers expediting enquiries
Not required
1.9. Implement an individual Performance Management and Development System (PMDS)
1.9.4.3 2 Workshops held on dealing with Industrial Relations matters for Managers at all levels
0091 Number of workshops on Grievance Management, Work Ethics and Chairing Disciplinary enquiries.
2 2 0 Not applicable. Target Achieved. Not required
1.10. Develop and implement an Integrated Human Resource Plan
1.10.1.1 Maximum Vacancy Rate of 5% for all Funded Positions
0092 Average vacancy % rate in the Corporation
5 3.22 1.78 Target exceeded due to consistent monitoring by HR and sending notices to programmes re vacant positions
Not applicable. Target partially exceeded
1.10. Develop and implement an Integrated Human Resource Plan
1.10.1.2 Vacant positions filled within six weeks of approved request
0093 Average number of days to complete the recruitment process.
45 24 21 Overachievement due to HR interviewing bus drivers and keeping those recommended for employment in the data base
Target for 2013/2014 to be increased to 30 days
1.10. Develop and implement an Integrated Human Resource Plan
1.10.2.1 Improve employment equity levels by ensuring that 22% of all Funded Positions are held by Women
0094 % of funded positions held by Women
22 19 3 HR not getting enough female applicants in core programmes that constitute bigger number of Corporation employees
HR will initiate skills development programmes targeting females
1.10. Develop and implement an Integrated Human Resource Plan
1.10.2.2 Improve employment equity levels of MTC by employing a physically challenged person annually
0095 Number of Persons with disabilities Employed.
1 1 0 Not applicable. Target Achieved. Not required
1.10. Develop and implement an Integrated Human Resource Plan
1.10.3.1 Approved HR Plan in place by 31 March 2013
0096 % approved HR Plan developed and reviewed.
100 25 75 Not achieved due to time constraints and the amount of work needed to be done
A consultant will be engaged to assist in finalising the document
1.10. Develop and implement an Integrated Human Resource Plan
1.10.3.3 28 Women selected for Management and Development Programmes
0098 Number of women selected for Management Development Programmes.
14 0 14 Positions that were filled by males in Q3 were for two diesel mechanics and three bus drivers. There were no female applicants for these positions.
Recruitment targeting women applicants
1.11. Implement an effective and efficient inspectorate and safe operating environment
1.11.1.1 100% Compliance with Minimum Physical Security Standards Compliance Checklist
0099 % Compliance with set Minimum Physical Security Standards.
100 0 100 Policy was approved late Q4 only Compliance will be monitored as from the new financial year
1.11. Implement an effective and efficient inspectorate and safe operating environment
1.11.1.2 Approved Corporation security policy with sets standards for personnel, vehicles, information, facilities and environment.
0100 Corporation Security Policy Approved
1 1 0 Not applicable. Target Achieved. Not required
1.11. Implement an effective and efficient inspectorate and safe operating environment
1.11.1.3 2 Reports on implementation of the Approved Security Policy submitted to Management and the Board
0101 Approved quarterly reports on the implementation of the Security Policy.
2 0 2 Policy was approved late Q4 only Compliance will be monitored as from the new financial year
1.11. Implement an effective and efficient inspectorate and safe operating environment
1.11.2.1 100% of short-listed candidates vetted before employment.
0104 % of personnel suitability check reports issued on individual short-listed candidates before employment.
100 0 100 Policy not approved Policy will be resubmitted to the Board in May 2013
PERFORMANCE AGAINST PREDETERMINED OBJECTIVES: Board approved Annual Operational Plan 2012/2013
Strategic Objective Measurable Objective Service Delivery Indicators Target Actual Deviation Challenges/Reasons for non-performance Plans to address challenges/Non-performance
1.3. Implementation of organisation wide Performance Management System
1.3.1.4 100% Compliance with identified Human Resources legislation
0020 % Compliance with identified Human Resources related legislation
100 100 0 Not applicable. Target Achieved. Not required
1.6. Maintain reliable and sustainable Financial Management practices
1.6.1.2 Unqualified human resource management audit report
0044 Number of Human Resource Management qualifications
0 0 0 Not applicable. Target Achieved. Not required
1.6. Maintain reliable and sustainable Financial Management practices
1.6.5.7 Human Resources maximum budget variance of 5 percent maintained
0059 % Budget Variance Maintained 5 - - The actual performance cannot be determined as expenditure against budget for the HR Management Department is not yet being tracked by the Financial Management System.
Finance Division to ensure that the HR Management Budget is loaded onto the Financial Management System (Pastel Evolution)
1.11. Implement an effective and efficient inspectorate and safe operating environment
1.11.1.4 75% Compliance with the approved Security Compliance Policy
0102 % Compliance with the approved Security Compliance Policy
75 0 75 Policy was approved late Q4 only Compliance will be monitored as from the new financial year
PAGE
48

STRATEGIC GOALRender a safe, affordable and reliable service.
PURPOSEThe purpose of the Engineering Programme is to ensure the efficient and effective provision of public transport services through a safe and reliable fleet at all depots of the MTC. The Programme is responsible for all the corporations’ fleet related activities, the management of inventory as well as facilities and infrastructure management.
PROGRAMME STRUCTURETyre Section • Warehouse function • Maintenance Section • Facility planning
PROGRAMME 5Engineering
OVERVIEW OF DEPARTMENTAL PERFORMANCE
The Engineering Department operates within the provisions of the statutes that are applicable to the transport industry; which includes, but not limited to, the provisions of the National Road Traffic Act and the Occupational Health and Safety Act. We continuously have to adapt to changes in such statutes and the recent highlight is the introduction of half-yearly roadworthy tests on buses in order to enhance road safety. It has become a norm to undertake major body repairs as part of preparing the old buses for roadworthy tests. More than half of our fleet is older than 15 years into the operation and this affects maintenance costs and service reliability.
The introduction of Corporate Performance Management and the Employee Performance Management and Development System, which was adopted by the Board, has been quite challenging for departments. It seeks to instill a culture of planning for a medium term period, setting of predetermined objectives, monitoring performance against such objectives, managing risks of non-performance by introducing remedial actions in the interest of service delivery. It is also meant to remove the subjectivity in performance management of staff which should inherently boost the staff morale. Admittedly, the department did not perform well during the period under review. At the time of compiling the report,
the department had already had an all-inclusive workshop of staff in order to continue to educate them on the systems and its objectives. We strongly believe that the worst is over in this area. The division managed to engage a qualified mechanical engineer within the reporting period as part of capacitating the department. Other measures that were aimed at equipping staff on modern technology through requisite skills did not yield results due to non-availability of training providers in the province. We find ourselves having to send employees to provinces like Gauteng for the relevant skills programs and this will come at a cost.
PAGE
49

It is this challenge that resulted in 54% performance on identified training interventions.
In spite of conditions that are not conducive to proper training and development within our facilities, the corporation is proud to report that two automotive electrician apprentices acquired artisanship during the period under review. The Corporation absorbed both of them as permanent employees in two different depots in positions that existed before they qualified. We are proud of our contribution towards opening opportunities and empowering the youth to be absorbed by the market.
A 96% performance score in the area of providing fit for duty buses impacted negatively on service reliability. We have identified gaps within the spares demand management which will be addressed through institutionalized engagement with the SCM unit inorder to address some of the inefficiencies that have impacted negatively on the department’s performance. Within the department, we shall continue to instill the“Batho Pele” principle within our divisional staff. The entity is in the process of acquiring an electronic fleet management system which will
be a management tool to monitor and track vehicle movements as well as driver performance. It is through the system that exceptions will be automatically reported on for management to take corrective action. Some benefits will include monitoring of service punctuality, vehicle misuse, and some vehicle defects that may lead to major breakdowns as well as safety of passengers and other road users.Lastly, the refurbishment project proved to be one of important investments that continually contributes to the sustenance of the operations by rebuilding the old buses in order to return them to their original condition.
PAGE
50

PERFORMANCE AGAINST PREDETERMINED OBJECTIVES: MEC approved Annual Performance Plan 2012/2013
Strategic Objective Measurable Objective Service Delivery Indicators Target Actual Deviation Challenges/Reasons for non-performance Plans to address challenges/Non-performance
2.1. Enhance vehicle availability 2.1.1.1 To transport 1 900 000 passengers by running 52 registered public transport vehicles
0105 Number of registered Public Transport Vehicles.
52 47.92 4 Two buses were involved in major accidents during quarter 2; one was being refurbished, one as a cracked chassis and the rest had major unit failures from gearboxes to engines and diffs.
A strategy incorporating back-up levels of major units, oil analysis to inform predictive maintenance and training interventions to capacitate staff on identified challenges ito WSP is being developed.
2.1. Enhance vehicle availability 2.1.3.1 Make available 25 pool vehicles for use by employees in the support functions
0109 Number of pool vehicles made available at any given time.
25 0 25 Required evidence in support of performance claims could not be generated
A system to monitor pool vehicles will be costed for the 2013/2014 budget and utilised as from the new financial year
2.2. Implement fleet maintenance and refurbishment program
2.2.1.2 Carry out 462 major services in order to achieve at least 650,000 kilometres of useful life on all buses.
0110 Number of major services carried out as per service plan.
300 259 41 The number of buses that are pulled out of operations when being prepared for COFs reduced the mileage resulting in fewer services carried out during the quarter.
Backlog in COFs will persist for the next three months. As buses are not operational while being prepared for COF, they don't accumulate kilometres hence the number is below the target.
2.2. Implement fleet maintenance and refurbishment program
2.2.1.3 Adherence to the provisions of Section 42 of the National Road Traffic Act, Act No. 93 of 1996 as amended
0111 Number of roadworthy tests conducted on all operational buses.
100 86 14 The suspension of service providers that were non-compliant to SCM policy resulted in longer turn-around as services were not readily available. This was exacerbated by BPO system glitches that affected stock demand management.
With more controls within SCM, constant monitoring of supplier compliance will be achieved resulting in smooth operation. Pastel evolution implementation, integrating inventory module shall go a long way in stock management
2.3. Enhance passenger safety 2.3.1.1 To achieve a ratio of 1 accident to 75,000 kilometres travelled by pool vehicles and 1: 200,000 for buses.
0112 Number of safety checks carried out
5,200 3,824 1,376 The suspension of service providers that were non-compliant to SCM policy resulted in longer turn-around as services were not readily available. This was exacerbated by BPO system glitches that affected stock demand management.
With more controls within SCM, constant monitoring of supplier compliance will be achieved resulting in smooth operation. Pastel evolution implementation, integrating inventory module shall go a long way in stock management
2.3. Enhance passenger safety 2.3.1.2 26 Fortnightly Safety Audits Conducted by Foreman
0113 Number of Safety Audits conducted on a fortnight basis by the Foreman.
26 27 -1 Not applicable. Target partially exceeded Not applicable. Target partially exceeded
2.3. Enhance passenger safety 2.3.1.2 26 Fortnightly Safety Audits Conducted by Foreman
0114 Number of safety audit forms reviewed by HOD
12 12 0 Not applicable. Target Achieved. Not required
2.4. Ensure adequate and conducive infrastructure for productive operations
2.4.2.1 To give effect to the provisions of Employment Equity Act and Paragraph 7,3 of its code of good practice
0121 Condition and accessibility assessment conducted per annum.
1 1 0 Not applicable. Target Achieved. Not required
PERFORMANCE AGAINST PREDETERMINED OBJECTIVES: Board approved Annual Operational Plan 2012/2013
Strategic Objective Measurable Objective Service Delivery Indicators Target Actual Deviation Challenges/Reasons for non-performance Plans to address challenges/Non-performance
1.1. Provide Strategic direction through effective leadership and good governance
1.1.1.8 2 Engineering (Engineering Programme) strategic risk reduced to an acceptable level
0008 Number of Engineering strategic risks reduced to an acceptable level
2 0 2 The recapitalisation plan remains unfunded resulting in the Corporation no being able to recapitalise its fleet
MTC's efforts include a request that was submitted for R89,4 m from the National department for the implementation of MTC's Business Model for which no response has been received as at the end of January 2013. Application to change MTC's status in order to access certain loans is also being pursued.
1.3. Implementation of organisation wide Performance Management System
1.3.1.2 100% Compliance with identified Engineering related legislation
0018 % Compliance with identified Engineering related legislation
100 0 100 Due to operational reasons the evidence in support of calculating the performance could not be submitted
An Analyst will be recruited in the new financial year to assist the department in availing its performance evidence
1.6. Maintain reliable and sustainable Financial Management practices
1.6.1.6 Unqualified engineering management audit report
0048 Number of engineering management qualifications
0 0 0 Not applicable. Target Achieved. Not required
1.6. Maintain reliable and sustainable Financial Management practices
1.6.5.9 Engineering maximum budget variance of 5 percent maintained
0061 % Budget Variance Maintained 5 - - The actual performance cannot be determined as expenditure against budget for the Engineering Department is not yet being tracked by the Financial Management System.
Finance Division to ensure that the Engineering Budget is loaded onto the Financial Management System (Pastel Evolution)
2.1. Enhance vehicle availability 2.1.1.2 Fully utilise the R5m grant in aid from the MEC policy speech by leasing 11 buses
0106 Number of busses leased 11 11 0 Not applicable. Target Achieved. Not required
2.1. Enhance vehicle availability 2.1.1.3 Secure a funded recapitalisation plan to the value R36.8 million
0107 Million ZAR value of approved Recapitalisation Plan
37 0 37 The entity did not succeed in securing therequired funding.
The entity will further pursue the initiatives with the National Department of Transport. Other measures include consideration of changing the status of the entity to enable it to access loans.
2.1. Enhance vehicle availability 2.1.1.4 Fully adhere to Maintenance and Service Schedule
0108 % of Maintenance and Service Schedule Adhered to
100 0 100 The target was duplicated in that Performance Indicator 000110 also talks to the services
All duplicate indicators have been removed
2.3. Enhance passenger safety 2.3.2.2 Zero accidents caused by MTC as a result of mechanical defects
0116 Number of accidents caused by MTC due to mechanical defects
0 0 0 Not applicable. Target Achieved. Not required
2.4. Ensure adequate and conducive infrastructure for productive operations
2.4.1.1 100% Average compliance with Building Maintenance Policy
0120 % Compliance with Building Maintenance Policy
100 0 100 Due to capacity constraints, the policy was not concluded in time for adoption by the Board
The policy is being formulated with the target deadline being the end of the first quarter.
SERVICE DELIVERY OBJECTIVES, INDICATORS AND ACHIEVEMENTSThe Engineering Department has been able to demonstrate results against its measurable objectives as indicated below:
PAGE
51

PERFORMANCE AGAINST PREDETERMINED OBJECTIVES: MEC approved Annual Performance Plan 2012/2013
Strategic Objective Measurable Objective Service Delivery Indicators Target Actual Deviation Challenges/Reasons for non-performance Plans to address challenges/Non-performance
2.1. Enhance vehicle availability 2.1.1.1 To transport 1 900 000 passengers by running 52 registered public transport vehicles
0105 Number of registered Public Transport Vehicles.
52 47.92 4 Two buses were involved in major accidents during quarter 2; one was being refurbished, one as a cracked chassis and the rest had major unit failures from gearboxes to engines and diffs.
A strategy incorporating back-up levels of major units, oil analysis to inform predictive maintenance and training interventions to capacitate staff on identified challenges ito WSP is being developed.
2.1. Enhance vehicle availability 2.1.3.1 Make available 25 pool vehicles for use by employees in the support functions
0109 Number of pool vehicles made available at any given time.
25 0 25 Required evidence in support of performance claims could not be generated
A system to monitor pool vehicles will be costed for the 2013/2014 budget and utilised as from the new financial year
2.2. Implement fleet maintenance and refurbishment program
2.2.1.2 Carry out 462 major services in order to achieve at least 650,000 kilometres of useful life on all buses.
0110 Number of major services carried out as per service plan.
300 259 41 The number of buses that are pulled out of operations when being prepared for COFs reduced the mileage resulting in fewer services carried out during the quarter.
Backlog in COFs will persist for the next three months. As buses are not operational while being prepared for COF, they don't accumulate kilometres hence the number is below the target.
2.2. Implement fleet maintenance and refurbishment program
2.2.1.3 Adherence to the provisions of Section 42 of the National Road Traffic Act, Act No. 93 of 1996 as amended
0111 Number of roadworthy tests conducted on all operational buses.
100 86 14 The suspension of service providers that were non-compliant to SCM policy resulted in longer turn-around as services were not readily available. This was exacerbated by BPO system glitches that affected stock demand management.
With more controls within SCM, constant monitoring of supplier compliance will be achieved resulting in smooth operation. Pastel evolution implementation, integrating inventory module shall go a long way in stock management
2.3. Enhance passenger safety 2.3.1.1 To achieve a ratio of 1 accident to 75,000 kilometres travelled by pool vehicles and 1: 200,000 for buses.
0112 Number of safety checks carried out
5,200 3,824 1,376 The suspension of service providers that were non-compliant to SCM policy resulted in longer turn-around as services were not readily available. This was exacerbated by BPO system glitches that affected stock demand management.
With more controls within SCM, constant monitoring of supplier compliance will be achieved resulting in smooth operation. Pastel evolution implementation, integrating inventory module shall go a long way in stock management
2.3. Enhance passenger safety 2.3.1.2 26 Fortnightly Safety Audits Conducted by Foreman
0113 Number of Safety Audits conducted on a fortnight basis by the Foreman.
26 27 -1 Not applicable. Target partially exceeded Not applicable. Target partially exceeded
2.3. Enhance passenger safety 2.3.1.2 26 Fortnightly Safety Audits Conducted by Foreman
0114 Number of safety audit forms reviewed by HOD
12 12 0 Not applicable. Target Achieved. Not required
2.4. Ensure adequate and conducive infrastructure for productive operations
2.4.2.1 To give effect to the provisions of Employment Equity Act and Paragraph 7,3 of its code of good practice
0121 Condition and accessibility assessment conducted per annum.
1 1 0 Not applicable. Target Achieved. Not required
PERFORMANCE AGAINST PREDETERMINED OBJECTIVES: Board approved Annual Operational Plan 2012/2013
Strategic Objective Measurable Objective Service Delivery Indicators Target Actual Deviation Challenges/Reasons for non-performance Plans to address challenges/Non-performance
1.1. Provide Strategic direction through effective leadership and good governance
1.1.1.8 2 Engineering (Engineering Programme) strategic risk reduced to an acceptable level
0008 Number of Engineering strategic risks reduced to an acceptable level
2 0 2 The recapitalisation plan remains unfunded resulting in the Corporation no being able to recapitalise its fleet
MTC's efforts include a request that was submitted for R89,4 m from the National department for the implementation of MTC's Business Model for which no response has been received as at the end of January 2013. Application to change MTC's status in order to access certain loans is also being pursued.
1.3. Implementation of organisation wide Performance Management System
1.3.1.2 100% Compliance with identified Engineering related legislation
0018 % Compliance with identified Engineering related legislation
100 0 100 Due to operational reasons the evidence in support of calculating the performance could not be submitted
An Analyst will be recruited in the new financial year to assist the department in availing its performance evidence
1.6. Maintain reliable and sustainable Financial Management practices
1.6.1.6 Unqualified engineering management audit report
0048 Number of engineering management qualifications
0 0 0 Not applicable. Target Achieved. Not required
1.6. Maintain reliable and sustainable Financial Management practices
1.6.5.9 Engineering maximum budget variance of 5 percent maintained
0061 % Budget Variance Maintained 5 - - The actual performance cannot be determined as expenditure against budget for the Engineering Department is not yet being tracked by the Financial Management System.
Finance Division to ensure that the Engineering Budget is loaded onto the Financial Management System (Pastel Evolution)
2.1. Enhance vehicle availability 2.1.1.2 Fully utilise the R5m grant in aid from the MEC policy speech by leasing 11 buses
0106 Number of busses leased 11 11 0 Not applicable. Target Achieved. Not required
2.1. Enhance vehicle availability 2.1.1.3 Secure a funded recapitalisation plan to the value R36.8 million
0107 Million ZAR value of approved Recapitalisation Plan
37 0 37 The entity did not succeed in securing therequired funding.
The entity will further pursue the initiatives with the National Department of Transport. Other measures include consideration of changing the status of the entity to enable it to access loans.
2.1. Enhance vehicle availability 2.1.1.4 Fully adhere to Maintenance and Service Schedule
0108 % of Maintenance and Service Schedule Adhered to
100 0 100 The target was duplicated in that Performance Indicator 000110 also talks to the services
All duplicate indicators have been removed
2.3. Enhance passenger safety 2.3.2.2 Zero accidents caused by MTC as a result of mechanical defects
0116 Number of accidents caused by MTC due to mechanical defects
0 0 0 Not applicable. Target Achieved. Not required
2.4. Ensure adequate and conducive infrastructure for productive operations
2.4.1.1 100% Average compliance with Building Maintenance Policy
0120 % Compliance with Building Maintenance Policy
100 0 100 Due to capacity constraints, the policy was not concluded in time for adoption by the Board
The policy is being formulated with the target deadline being the end of the first quarter.
PAGE
52

STRATEGIC GOALInstitutionalise operations best practices.
PURPOSEThe purpose of the Operations Programme is to ensure the efficient and effective management all the operational activities of the MTC. The Programme is responsible for coordination of bus services on all routes, the enhancing of revenue streams and the coordination of capital fund expenditure.
PROGRAMME STRUCTUREOperations Management • Route Supervision • Traffic Management
PROGRAMME 6Operations
OVERVIEW OF DEPARTMENTAL PERFORMANCE
Operations took advantage of the newly implemented Corporate and Employee Performance Management Systems implemented by the Office of Strategic Management and through effective management of staff performance we were able to:
a) Achieve 82% of our annual targets; a performance which was achieved under very strenuous and unfavourable conditions as the Corporations is operating with insufficient resources.
b) We managed to maximise our revenue by collecting R27 606 895 total revenue exceeding our target
by 9.6%.
We have also managed to improve on service delivery as our targets have for the first since the implementation of the Performance Information System passed the SMART (Specific, Measurable, Achievable, Realistic, Time bound) test. We take this opportunity to thank the Office of Strategic Management for their support and guidance in this regard.
Non-implementation of the approved Annual Operational Plan into the financial system has cost us in some aspects as we could not monitor our budget and spending pattern throughout the year and this has negatively impacted our performance as we could not produce credible evidence from the system regarding our expenditure.
PAGE
53

PAGE
54

PERFORMANCE AGAINST PREDETERMINED OBJECTIVES: MEC approved Annual Performance Plan 2012/2013
Strategic Objective Measurable Objective Service Delivery Indicators Target Actual Deviation Challenges/Reasons for non-performance Plans to address challenges/Non-performance
2.3. Enhance passenger safety 2.3.3.2 Improve passenger safety by training 30 drivers on professional and defensive driving techniques
0118 Number of drivers who have completed training on professional and defensive driving.
30 45 -15 Provision was made in the 2012/2013 budget for training of drivers over and above the WSP training budget. We were therefore able to train more drivers.
The 2013/2014 target will be aligned to the total available budget.
2.3. Enhance passenger safety 2.3.3.3 All drivers to be medically assessed and declared fit bi-annually
0119 Number of bi-annual medical examinations on all drivers conducted.
2 2 0 Not applicable. Target Achieved. Not required
3.1. Improve driver performance 3.1.1.1 Increase efficiency and safety in driving by assessing driver performance bi-annually
0122 Number of driver performance assessments conducted
2 2 0 Not applicable. Target Achieved. Not required
3.1. Improve driver performance 3.1.1.2 Increase awareness on relevant legislation.
0123 Number of workshops provided to drivers on legislative requirements
2 3 -1 Target exceeded. A free session was hosted by the Department of Transport
Not required
3.2. Increase ridership 3.2.2.1 Ensure that the service rendered is in line with the customer needs by conducting 4 commuter meetings
0126 Number of commuter meetings conducted
4 11 -7 More meetings were arranged due to requests from communities and to discuss the bus fare increase
Upward performance is desirable as it strengthens relations between MTC and its commuters.
3.2. Increase ridership 3.2.2.2 Render a reliable service that will attract more customers by ensuring that a minimum of 80% of all buses adhere to published or official time schedules
0127 % of buses that adhere to published or official time schedules.
80 98.93 -18.93 Monitoring systems implemented between Operations and Engineering in terms of the AOP have assisted in the early dispatching of buses.
Increase the target for 2013/2014
3.2. Increase ridership 3.2.2.5 Provide services at affordable rates to the poor communities by ensuring that the fee increase does not exceed 10%
0130 % of Fares not increased by more than 10%
100 100 0 Not applicable. Target Achieved. Not required
3.2. Increase ridership 3.2.2.7 Ensure that MTC is responsive to the socio-economic challenges facing the Province by implementing a minimum of 10% discounted fares on all pensioners, scholars; multi-journey’s and Stored value tickets.
0132 % of all pensioners, scholars; multi-journey’s and Stored value tickets discounted by 10% or more.
100 0 100 The report generated by Questek does not back the performance claims made
Further research and development has been requested from Questek so that a credible report will be available as from Q1 2013/2014
3.2. Increase ridership 3.2.2.8 To ensure MTC customer service excellence by training 40 drivers on customer care
0133 Number of drivers trained on customer care
40 48 -8 Due to operational reasons additional drivers were available for the training. It is MTC's desire to train more drivers on customer care as we believe that customer services orientated staff will enhance the reputation of the company.
Not applicable. Target partially exceeded
3.3. Maximise Revenue 3.3.2.1 19503 Spot Checks conducted by inspectors to ensure that all tickets are issued in support of completeness of revenue
0137 Number of Spot Checks conducted by inspectors
19,503 22,265 -2,762 The target was partially exceeded due to the availability of vehicles
The target for 2013/2014 has been increased
3.3. Maximise Revenue 3.3.4.1 To maximise revenue by achieving 100% of set targets
0140 % of set route targets achieved. 100 100 0 Not applicable. Target Achieved. Not required
3.3. Maximise Revenue 3.3.4.2 Revenue collection is accurate, complete and accounted for by reconciling variances identified in Q-merit reports.
0141 % of Q-merit reports monitored and reconciled
100 100 0 Not applicable. Target Achieved. Not required
3.3. Maximise Revenue 3.3.4.3 To operate optimally by covering 50 duties
0142 Number of duties to be operated. 50 51 -1 MTC operated special trips on granting days as per requests from pensioners.
Not required. Target partially exceeded
3.3. Maximise Revenue 3.3.4.4 Scheduled maintenance of TGX Machines to avoid irregular usage of emergency tickets
0143 Number of scheduled maintenance for TGX Machines conducted
4 4 0 Not applicable. Target Achieved. Not required
SERVICE DELIVERY OBJECTIVES, INDICATORS AND ACHIEVEMENTSThe Operations Department has been able to demonstrate results against its measurable objectives as indicated below:
PAGE
55
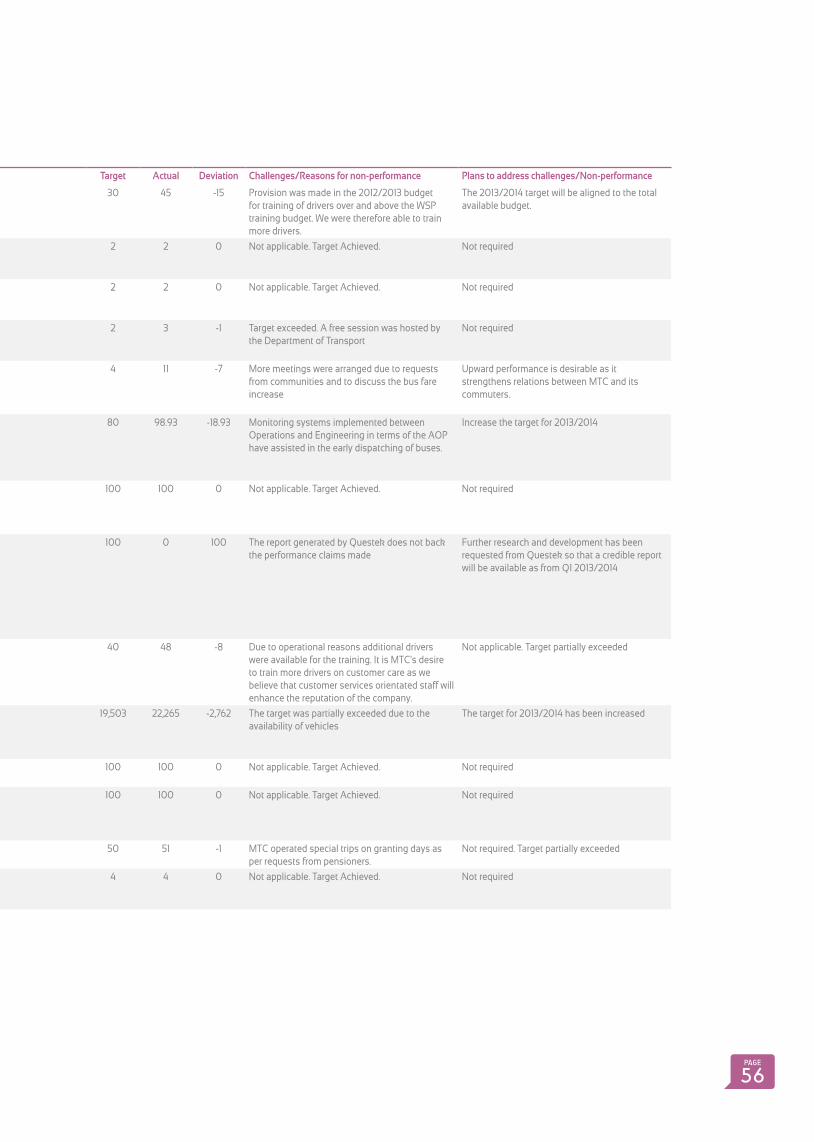
PERFORMANCE AGAINST PREDETERMINED OBJECTIVES: MEC approved Annual Performance Plan 2012/2013
Strategic Objective Measurable Objective Service Delivery Indicators Target Actual Deviation Challenges/Reasons for non-performance Plans to address challenges/Non-performance
2.3. Enhance passenger safety 2.3.3.2 Improve passenger safety by training 30 drivers on professional and defensive driving techniques
0118 Number of drivers who have completed training on professional and defensive driving.
30 45 -15 Provision was made in the 2012/2013 budget for training of drivers over and above the WSP training budget. We were therefore able to train more drivers.
The 2013/2014 target will be aligned to the total available budget.
2.3. Enhance passenger safety 2.3.3.3 All drivers to be medically assessed and declared fit bi-annually
0119 Number of bi-annual medical examinations on all drivers conducted.
2 2 0 Not applicable. Target Achieved. Not required
3.1. Improve driver performance 3.1.1.1 Increase efficiency and safety in driving by assessing driver performance bi-annually
0122 Number of driver performance assessments conducted
2 2 0 Not applicable. Target Achieved. Not required
3.1. Improve driver performance 3.1.1.2 Increase awareness on relevant legislation.
0123 Number of workshops provided to drivers on legislative requirements
2 3 -1 Target exceeded. A free session was hosted by the Department of Transport
Not required
3.2. Increase ridership 3.2.2.1 Ensure that the service rendered is in line with the customer needs by conducting 4 commuter meetings
0126 Number of commuter meetings conducted
4 11 -7 More meetings were arranged due to requests from communities and to discuss the bus fare increase
Upward performance is desirable as it strengthens relations between MTC and its commuters.
3.2. Increase ridership 3.2.2.2 Render a reliable service that will attract more customers by ensuring that a minimum of 80% of all buses adhere to published or official time schedules
0127 % of buses that adhere to published or official time schedules.
80 98.93 -18.93 Monitoring systems implemented between Operations and Engineering in terms of the AOP have assisted in the early dispatching of buses.
Increase the target for 2013/2014
3.2. Increase ridership 3.2.2.5 Provide services at affordable rates to the poor communities by ensuring that the fee increase does not exceed 10%
0130 % of Fares not increased by more than 10%
100 100 0 Not applicable. Target Achieved. Not required
3.2. Increase ridership 3.2.2.7 Ensure that MTC is responsive to the socio-economic challenges facing the Province by implementing a minimum of 10% discounted fares on all pensioners, scholars; multi-journey’s and Stored value tickets.
0132 % of all pensioners, scholars; multi-journey’s and Stored value tickets discounted by 10% or more.
100 0 100 The report generated by Questek does not back the performance claims made
Further research and development has been requested from Questek so that a credible report will be available as from Q1 2013/2014
3.2. Increase ridership 3.2.2.8 To ensure MTC customer service excellence by training 40 drivers on customer care
0133 Number of drivers trained on customer care
40 48 -8 Due to operational reasons additional drivers were available for the training. It is MTC's desire to train more drivers on customer care as we believe that customer services orientated staff will enhance the reputation of the company.
Not applicable. Target partially exceeded
3.3. Maximise Revenue 3.3.2.1 19503 Spot Checks conducted by inspectors to ensure that all tickets are issued in support of completeness of revenue
0137 Number of Spot Checks conducted by inspectors
19,503 22,265 -2,762 The target was partially exceeded due to the availability of vehicles
The target for 2013/2014 has been increased
3.3. Maximise Revenue 3.3.4.1 To maximise revenue by achieving 100% of set targets
0140 % of set route targets achieved. 100 100 0 Not applicable. Target Achieved. Not required
3.3. Maximise Revenue 3.3.4.2 Revenue collection is accurate, complete and accounted for by reconciling variances identified in Q-merit reports.
0141 % of Q-merit reports monitored and reconciled
100 100 0 Not applicable. Target Achieved. Not required
3.3. Maximise Revenue 3.3.4.3 To operate optimally by covering 50 duties
0142 Number of duties to be operated. 50 51 -1 MTC operated special trips on granting days as per requests from pensioners.
Not required. Target partially exceeded
3.3. Maximise Revenue 3.3.4.4 Scheduled maintenance of TGX Machines to avoid irregular usage of emergency tickets
0143 Number of scheduled maintenance for TGX Machines conducted
4 4 0 Not applicable. Target Achieved. Not required
PAGE
56

PERFORMANCE AGAINST PREDETERMINED OBJECTIVES: Board approved Annual Operational Plan 2012/2013
Strategic Objective Measurable Objective Service Delivery Indicators Target Actual Deviation Challenges/Reasons for non-performance Plans to address challenges/Non-performance
1.1. Provide Strategic direction through effective leadership and good governance
1.1.1.7 1 Operations (Operations Programme) strategic risk reduced to an acceptable level
0007 Number of Operations strategic risks reduced to an acceptable level
1 0 1 Due to the delayed approval of the recapitalisation plan, the mitigation systems in support of Operations and Engineering risks could not be implemented.
The recapitalisation plan has been resubmitted to Treasury and the Corporation is awaiting feedback.
1.3. Implementation of organisation wide Performance Management System
1.3.1.3 100% Compliance with identified Operations related legislation
0019 % Compliance with identified Operations related legislation
100 100 0 Not applicable. Target Achieved. Not required
1.6. Maintain reliable and sustainable Financial Management practices
1.6.1.5 Unqualified operations management audit report
0047 Number of operations management qualifications
0 0 0 Not applicable. Target Achieved. Not required
1.6. Maintain reliable and sustainable Financial Management practices
1.6.5.8 Operations maximum budget variance of 5 percent maintained
0060 % Budget Variance Maintained 5 - - The actual performance cannot be determined as expenditure against budget for the Operations Department is not yet being tracked by the Financial Management System.
Finance Division to ensure that the Operations Budget is loaded onto the Financial Management System (Pastel Evolution)
2.3. Enhance passenger safety 2.3.3.1 Zero accidents caused by MTC drivers
0117 Number of accidents caused by MTC drivers
0 3 -3 The indicator was not realistic as one has minimal control over driver behaviour once they are on the road.
The indicator was improved in the 2013/2014 AOP to read as follows: “Number of accidents caused by MTC due to mechanical defects”
3.2. Increase ridership 3.2.1.1 Ensure an average customer satisfaction rate of 70%
0124 Average Customer Satisfaction Rate
70 88 -18 We did not have a baseline for this indicator. We have increased our target for 2013/2014 based on the actual results for 2012/2013.
3.2. Increase ridership 3.2.2.3 All drivers appropriately dressed by ensuring that 100% of drivers are issued with the complete uniform allocation
0128 % of Drivers issued with uniform allocation
100 0 100 The purchasing of uniform coincided with the review of the policy which resulted in magagement not being able to buy uniform in the 2012/2013 financial year as planned.
The target has been included in the 2013/2014 AOP
3.2. Increase ridership 3.2.2.4 100% Compliance with Driver of the Year Policy
0129 % Compliance with Driver of the Year Policy
100 100 0 Not applicable. Target Achieved. Not required
3.2. Increase ridership 3.2.2.6 Tarriff guide developed and aproved by the Board to support fare increases for the 2013/2014 financial year.
0131 Number of approved tariff guides 1 1 0 Not applicable. Target Achieved. Not required
3.3. Maximise Revenue 3.3.1.1 Generate own revenue to the value of R25 360 764
0134 ZAR value of own revenue generated
25,036,764 27,519,232 -2,482,468 Describe the reason for the deviation Enter your corrective measures to rectify the variance and prevent future variances
3.3. Maximise Revenue 3.3.1.2 Generate on-route revenue to the value of R20 515 522
0135 ZAR value of on-route revenue generated
20,515,522 22,915,890 -2,400,368 Describe the reason for the deviation Enter your corrective measures to rectify the variance and prevent future variances
3.3. Maximise Revenue 3.3.1.3 Generate private hire revenue to the value of R4 521 242
0136 ZAR value of private-hire revenue generated
4,521,242 4,603,342 -82,100 Describe the reason for the deviation Enter your corrective measures to rectify the variance and prevent future variances
3.3. Maximise Revenue 3.3.3.1 Transport 2,339, 400 passengers in the current financial year
0138 Number of passengers transported by MTC
2,339,400 2,261,353 78,047 Describe the reason for the deviation Enter your corrective measures to rectify the variance and prevent future variances
3.3. Maximise Revenue 3.3.3.2 Ensure accessibility of MTC services in all designated routes by travelling 2,203 100 kilometres during the year
0139 Number of kilometres travelled in all designated routes
2,203,088 2,349,945 -146,857 Describe the reason for the deviation Enter your corrective measures to rectify the variance and prevent future variances
PAGE
57

PERFORMANCE AGAINST PREDETERMINED OBJECTIVES: Board approved Annual Operational Plan 2012/2013
Strategic Objective Measurable Objective Service Delivery Indicators Target Actual Deviation Challenges/Reasons for non-performance Plans to address challenges/Non-performance
1.1. Provide Strategic direction through effective leadership and good governance
1.1.1.7 1 Operations (Operations Programme) strategic risk reduced to an acceptable level
0007 Number of Operations strategic risks reduced to an acceptable level
1 0 1 Due to the delayed approval of the recapitalisation plan, the mitigation systems in support of Operations and Engineering risks could not be implemented.
The recapitalisation plan has been resubmitted to Treasury and the Corporation is awaiting feedback.
1.3. Implementation of organisation wide Performance Management System
1.3.1.3 100% Compliance with identified Operations related legislation
0019 % Compliance with identified Operations related legislation
100 100 0 Not applicable. Target Achieved. Not required
1.6. Maintain reliable and sustainable Financial Management practices
1.6.1.5 Unqualified operations management audit report
0047 Number of operations management qualifications
0 0 0 Not applicable. Target Achieved. Not required
1.6. Maintain reliable and sustainable Financial Management practices
1.6.5.8 Operations maximum budget variance of 5 percent maintained
0060 % Budget Variance Maintained 5 - - The actual performance cannot be determined as expenditure against budget for the Operations Department is not yet being tracked by the Financial Management System.
Finance Division to ensure that the Operations Budget is loaded onto the Financial Management System (Pastel Evolution)
2.3. Enhance passenger safety 2.3.3.1 Zero accidents caused by MTC drivers
0117 Number of accidents caused by MTC drivers
0 3 -3 The indicator was not realistic as one has minimal control over driver behaviour once they are on the road.
The indicator was improved in the 2013/2014 AOP to read as follows: “Number of accidents caused by MTC due to mechanical defects”
3.2. Increase ridership 3.2.1.1 Ensure an average customer satisfaction rate of 70%
0124 Average Customer Satisfaction Rate
70 88 -18 We did not have a baseline for this indicator. We have increased our target for 2013/2014 based on the actual results for 2012/2013.
3.2. Increase ridership 3.2.2.3 All drivers appropriately dressed by ensuring that 100% of drivers are issued with the complete uniform allocation
0128 % of Drivers issued with uniform allocation
100 0 100 The purchasing of uniform coincided with the review of the policy which resulted in magagement not being able to buy uniform in the 2012/2013 financial year as planned.
The target has been included in the 2013/2014 AOP
3.2. Increase ridership 3.2.2.4 100% Compliance with Driver of the Year Policy
0129 % Compliance with Driver of the Year Policy
100 100 0 Not applicable. Target Achieved. Not required
3.2. Increase ridership 3.2.2.6 Tarriff guide developed and aproved by the Board to support fare increases for the 2013/2014 financial year.
0131 Number of approved tariff guides 1 1 0 Not applicable. Target Achieved. Not required
3.3. Maximise Revenue 3.3.1.1 Generate own revenue to the value of R25 360 764
0134 ZAR value of own revenue generated
25,036,764 27,519,232 -2,482,468 Describe the reason for the deviation Enter your corrective measures to rectify the variance and prevent future variances
3.3. Maximise Revenue 3.3.1.2 Generate on-route revenue to the value of R20 515 522
0135 ZAR value of on-route revenue generated
20,515,522 22,915,890 -2,400,368 Describe the reason for the deviation Enter your corrective measures to rectify the variance and prevent future variances
3.3. Maximise Revenue 3.3.1.3 Generate private hire revenue to the value of R4 521 242
0136 ZAR value of private-hire revenue generated
4,521,242 4,603,342 -82,100 Describe the reason for the deviation Enter your corrective measures to rectify the variance and prevent future variances
3.3. Maximise Revenue 3.3.3.1 Transport 2,339, 400 passengers in the current financial year
0138 Number of passengers transported by MTC
2,339,400 2,261,353 78,047 Describe the reason for the deviation Enter your corrective measures to rectify the variance and prevent future variances
3.3. Maximise Revenue 3.3.3.2 Ensure accessibility of MTC services in all designated routes by travelling 2,203 100 kilometres during the year
0139 Number of kilometres travelled in all designated routes
2,203,088 2,349,945 -146,857 Describe the reason for the deviation Enter your corrective measures to rectify the variance and prevent future variances
PAGE
58

2012I 13
PAGE
59

04ANNUALFINANCIALSTATEMENTS
PAGE
60

The accounting authority is required by the Public Finance Management Act (Act 1 of 1999), to maintain adequate accounting records and is responsible for the content and integrity of the annual financial statements and related financial information included in this report. It is the responsibility of the accounting authority to ensure that the annual financial statements fairly present the state of affairs of the entity as at the end of the financial year and the results of its operations and cash flows for the period then ended. The external auditors are engaged to express an independent opinion on the annual financial statements and were given unrestricted access to all financial records and related data.
The annual financial statements have been prepared in accordance with Standards of Generally Acceptable Accounting Practice (GAAP) including any interpretations, guidelines and directives issued by the Accounting Standards Board.
The annual financial statements are based upon appropriateaccounting policies consistently applied and supported by reasonable and prudent judgements and estimates.
The accounting authority acknowledges that they are ultimately responsible for the system of internal financial control established by the entity and place considerable importance on maintaining a strong control environment. To enable the accounting authority to meet these responsibilities, the board of directors sets standards for internal control aimed at reducing the risk of error or deficit in a cost effective manner. The standards include the proper delegation of responsibilities within a clearly defined framework, effective accounting procedures and adequate segregation of duties to ensure an acceptable level of risk. These controls are monitored throughout the entity and all employees are required to maintain the highest ethical standards in ensuring the entity’s business is conducted in a manner that in all reasonable circumstances is above reproach. The focus of risk management in the entity is on identifying, assessing, managing and monitoring all known forms of risk across the entity. While operating risk cannot be fully eliminated, the entity endeavours to minimise it by ensuring that appropriate infrastructure, controls, systems and ethical
behaviour are applied and managed within predetermined procedures and constraints.
The accounting authority are of the opinion, based on the information and explanations given by management, that the system of internal control provides reasonable assurance that the financial records may be relied on for the preparation of the annual financial statements. However, any system of internal financial control can provide only reasonable, and not absolute, assurance against material misstatement or deficit.
The accounting authority have reviewed the entity’s cash flow forecast for the 12 months to 31 March 2014 and, in the light of this review and the current financial position, they are satisfied that the entity has or has access to adequate resources to continue in operational existence for the foreseeable future. Although the accounting authority is primarily responsible for the financial affairs of the entity, they are supported by the entity’s external auditors. The external auditors are responsible for independently reviewing and reporting on the entity’s annual financial statements. The annual financial statements have been examined by the entity’s external auditors and their report is presented on pages 69 to 72.
The Annual Financial Statements, which have been prepared on the going concern basis, were approved by the Accounting Authority and were signed on its behalf by:
MR PERCY L C MASETIChairperson of the Board of Directors Tuesday, 31 July 2013
MR LUTHANDO R MBINDAChief Executive Officer Tuesday, 31 July 2013
FINANCEREPORT
STATEMENT OF RESPONSIBILITY
By the accounting authority for the 12 months ended 31
March 2013
PAGE
61

Name Date Appointed Role
Percival Lusapo Camagu Maseti 28 February 2007 Board Chairperson
Jonga Sydney Nyengane 28 February 2007 Board Deputy Chairperson
Luthando Richmond Mbinda 1 September 2006 Ex-Officio Board Member and CEO of MTC
Pumelele Pazima Balfour 28 February 2007 Board Member
Angela Margaret Church 23 June 2008 Board Member
André Joubert De Vries 28 February 2007 Board Member and Department of Transport Representative
Sindiswa Griselda Gomba 13 April 2012 Alternate Board Member
Ndileka Eumera Portia Loyilane 23 June 2008 Board Member
Ruth Luzuka 24 August 2009 Board Member
Agreement Sizwe Mandla 20 April 2011 Board Member and Organised Labour Representative
Dominic Lebohang Qhali 10 March 2012 Board Member and Provincial Treasury Representative
Mzwandile Vaaiboom 13 April 2012 Board Member
REPORT OF THEACCOUNTING
AUTHORITYFor the 12 months ended
31 March 2013
REVIEW OF ACTIVITIESMayibuye Transport Corporation (MTC) was established in accordance with the Ciskei Corporations Act of 1990, to render an effective and efficient public transport service primarily for workers to industries and other places of employment in the adjacent South African urban areas. The Corporation operates under the jurisdiction of the Eastern Cape Department of Transport as a parastatal bus passenger transport service provider. The Corporation is funded through a grant-in-aid from the Provincial Department of Transport.
In synchronisation with its service delivery mandate, MTC maintains the highest possible standards in the provision of an effective and efficient transport service to communities in the Province on selected routes by:•Providing an enabling environment conducive to the provision of an affordable, convenient and safe mode of public transport.
•Keeping abreast of trends and developments in the sector to meet changing customer and stakeholder needs; and
•Creating of strategies that lend support to socio-economic growth in the Eastern Cape in all MTC’s areasof operation.
The successful achievement of these key outcomes will result in economic and social opportunities for citizens of the Eastern Cape.
GOING CONCERNThe annual financial statements have been prepared on the basis of accounting policies applicable to a going concern. This basis presumes that funds will be available from the Department of Transport (DOT) to predominantly finance future operations and that the realisation of assets and settlement of liabilities, contingent obligations and commitments will occur in the ordinary course of business.
ACCOUNTING AUTHORITYThe current Board is appointed in terms of the Ciskei Corporations Act of 1990. The members of the Board of Directors of the entity during the period under review are as follows:
PAGE
62

EXECUTIVE MANAGEMENT
MTC is a regional organisation with municipal reach, i.e., it has offices in three major municipalities. Its operational model provides for a hybrid of centralised business process and decentralised operations which encourage innovation and flexibility in order to enhance efficiency.
As per the organogram below, the organisation has five (5) Departments each headed by an Executive Head reportingto the Chief Executive Officer, who is the Accounting Officer. Each of the Departments has distinct functions:
The Office of the CEO ensures that effective planning and reporting systems are established based on internal management co-operation andcommunications, and that external partnership networks are developed and managed for the benefit of the Mayibuye Transport Corporation.
The programme also ensures the smooth operations of the oversight role played the Board of Directors. Such oversight is based on effective strategic leadership that provides the MTC Board of Directors with proper support to ensure good corporate governance principles are adhered to. The Board functions through its established sub-committees and meets quarterly.
Office of Strategic Management supports the CEO with oversight and leadership and is responsible
for strategy and policy development and mainstreaming; compliance and performance monitoring and reporting; governance and secretariat; stakeholder relations; and, championing transformation and change management
Financial Management is responsible for the financial planning, management, controls and variance reporting; supply chain management of both the overhead budget and programme budgets; and for coordinating the Audit processes as to ensure that set quality standards and criteria are met.
Human Resource Management provides an internal enabling function and support service to the other programmes with regard to Human Resource Managementand Development. This programme
also oversees protection andsecurity services.
Engineering exists to ensure the efficient and effective provision of public transport services through a safe and reliable fleet at all depots of MTC. The Programme is responsible for all the corporations’ fleet related activities as well as facilities and infrastructure management.
Operations ensures the efficient and effective management all the operational activities of MTC. The Programme is responsible for coordination of bus services on all routes, the enhancing of revenue streams and the coordination of capital fund expenditure.
The current organisationalstructure of MTC reflects its existing operating model.
PAGE
63

SECRETARYThe secretary of the entity is Mrs Charon Cronjé.
CORPORATE GOVERNANCEThe accounting authority is committed to business integrity, transparency and professionalism in all its activities.As part of this commitment, the accounting authority supports the highest standards of corporate governance and the on-going development of best practice. The entity confirms and acknowledges its responsibility to total compliance with the Code of Corporate Practices and Conduct (“the Code”) laid out in the King Report on Corporate Governance for South Africa.
AUDITORSThe Office of the Auditor General will continue in office for the next financial period as external auditors.Marais and Smith will continue in office for the next financial period as internal auditors.
APPROVALThe Annual Financial Statements set out on pages 74 to 78 have been approved by the Accounting Authority.
MR PERCY LC MASETIChairperson Mayibuye Transport Corporation Board 31 July 2013
TOPORGANISATIONAL
STRUCTUREApril 2013
CHIEFEXECUTIVEOFFICER
L.R. MBINDA
CFO(VACANT)Financial Manager
L. NKUNJANA
EXECUTIVEMANAGERHuman Resources
C. MTISE
EXECUTIVEMANAGEREngineering
Z.D. LENI
EXECUTIVEMANAGEROperations
N. FUNANI
EXECUTIVEDIRECTOR
Strategic Management
N. VAN WYK
PAGE
64

The Board is the designated Accounting Authority of MTC and governs the entity in accordance with the provisions of the Ciskei Corporations Act of 1990, the Public Finance Management Act, 1 of 1999 (PFMA) and good corporate governance principles. The Board also strives to comply with the principles and standards of integrity and accountability as contained in the recommendations of the King III report on corporate governance. The Board is composed of eleven non-executive members with the Chief Executive Officer serving in an ex officio capacity with no voting powers. The Board meets at least quarterly and monitors the performance of the Executive Management by ensuring that all material matters are subject to Board approval and that the mandate of MTC is carried out in an efficient and effective manner.
The Executive Management attends Board meetings by invitation. The roles of the Chairperson and Chief Executive Officer do not vest in the same person and the Chairperson is a non-executive member of the Board. The Chairperson provides leadership and guidance to the Board and encourages proper deliberation of all matters requiring the Board’s attention, and obtain optimum input from the members. All committees of the Board are chaired by non-executive members of the Boardwith the exception of the Audit Committee which is chaired by an independent person.
HUMAN RESOURCES & REMUNERATION COMMITTEEThe members of the Executive Management are appointed by the Board of Directors. Executive Management are involved in
the operational activities of the organisation and are responsible for ensuring that decisions, strategies and objectives of the reporting entity, the Department of Transport (DOT), and the Board are implemented. Executive Management retains full financial and operational control over the organisation under the leadership of the Chief Executive Officer. FINANCE AND INVESTMENT COMMITTEEThis Committee was established by the Board with three non-executive Directors namely Mr J S Nyengane as Chairperson, Ms A M Church &Mr D Qhali as members serving on this committee together with relevant members of Executive Management. The committee operates under terms of reference approved by the Board.
This committee attends to matters concerning the Human Resource
CORPORATEGOVERNANCESTATEMENT
PAGE
65

MEETINGS HELD AND ATTENDED FOR THE PERIOD UNDER REVIEW A meeting and attendance register for Board members and members of the Audit Committee is kept and maintained by the Board Secretary. A summary of the meetings held and attendance by the said members and the particular meeting attended is set out below:
Ordinary and Special Board
Finance andInvestmentCommittee
Operations andEngineeringCommittee
HR andRemuneration
Committee
Directors Affairs
Committee
Number of Meetings 10 5 0 4 2
Mr P L C Maseti 10
Mr J S Nyengane 10 4 2
Mr P P Balfour 2 0 0
Ms A M Church 3 1
Mr A J De Vries 10 5
Ms S Gomba * 2 0
Ms N E P Loyilane 7 1 0
Ms R Luzuka 10 5 2
Ms Z Pakati 1 0
Mr A S Mandla 8 1
Mr D Qhali 7 2
Mr M Vaaiboom 5 1
policies and practices of MTC, performance management and remuneration. The committee deliberates on these issues and makes appropriate recommendations to the Board for approval.
AUDIT COMMITTEE In compliance with Section 27 of the National Treasury Regulations, the Board has established an Audit Committee comprising of an independent Chairperson namely Mr J Mdeni, with Mrs R Luzuka and Mrs T Cumming as members. The Audit Committee operates under a Charter which has been approved by the Board. The primary responsibility of the Audit Committee is to report and make recommendations to the Board on the effectiveness of corporate governance internal controls and risk management within MTC, oversee the Internal Audit function and to comment on and evaluate the annual financial statements of the Corporation. The Chairperson of the Audit Committee attends Board
Meetings by invitation. Considerable support has been provided by the Department of Transport. The Department is represented on the Audit Committee by Mr D Skweyiya.
OPERATIONS AND ENGINEERING COMMITTEEThis Committee, established by the Board, comprises two non-executive Directors namely Mr PP Balfour, as Chairperson and Ms NEP Loyilane as member, as well as relevant members of the Executive Management. This committee was established to strengthen the operations management and engineering support capacity of MTC by focusing on initiatives to promote customer service and fleet management excellence in the pursuit of providing access to economic opportunity for citizens of the Eastern Cape.
DIRECTOR’S AFFAIRS COMMITTEEThis Committee was established by the Board with three non-executive
Directors namely Mr JS Nyengane as Chairperson, Mr PP Balfour and Mrs R Luzuka as members serving together with the Chief Executive Officer and Finance Manager of the entity. This Committee is responsible for critical management items which require review and input prior to being submitted to the Board of Directors for approval.
MEETINGS HELD AND ATTENDED FOR THE PERIOD UNDER REVIEW A meeting and attendance register for Board members and members of the Audit Committee is kept and maintained by the Board Secretary.
A summary of the meetings heldand attendance by the said members and the particular meeting attendedis set out below:
* Alternate to Mr M VaaiboomPAGE
66

We are pleased to present our report for the 2012/2013 financial year. The Audit Committee also reports that it has adopted formal terms of reference as its Audit Committee Charter regulated its affairs in compliance with this charter and has discharged all its responsibilities as contained therein.
AUDIT COMMITTEE MEMBERS AND ATTENDANCEThe Audit Committee members attended meetings during the financial year under review, in terms of their adopted Audit Charter,as indicated below:
Name Position Number of MeetingsAttended
Date of Re-Appointment/Appointments
Jack Mdeni Audit Committee Chair 6 1 October 2012
Ruth Luzuka Audit Committee Member 6 1 October 2012
Tracey Cumming Audit Committee Member 4 1 October 2012
Audit Committee Members, Mr Mdeni and Mrs Luzuka, were re-appointed as members upon review of their term. Their new term commenced on 1 October 2012 and coincides with the appointment of Mrs Tracy Cumming. The term of office for the Audit Committee, according to the Audit Committee charter, is a perios of three (3) years.
AUDIT COMMITTEE RESPONSIBILITY
The Audit Committee reports that it has complied with its responsibilities arising from section 38(1) (a) of the PFMA and Treasury Regulation 3.1.13. The Audit Committee also discharged its responsibilities in compliance with the Board Approved Audit Committee Charter.
EFFECTIVENESS OF INTERNAL CONTROLS
In order to meet its responsibility of providing reliable financial information, MTC maintains financial and operational systems of internal control. These controls are designed to provide reasonable assurance that transactions are concluded in accordance with management’s authority, that the assets are adequately protected against material loss of unauthorised acquisition, use or disposition, and the transactions are properly authorised and recorded.
MTC have appointed internal auditors who are guided by an Internal Audit Plan. The internal auditors adopt a risk based audit approach in order to ensure that the process adds value to the organisation. Internal auditors monitor the operation of the internal control system and report findings and recommendations to the Audit Committee and Executive Management. Corrective actions are taken to address control deficiencies and other opportunities for improving the systems, as they are identified. The Board, operating through its Audit Committee, provides oversight of the financial reporting process and internal control system.
There are inherent limitations in the effectiveness of any system of internal control, including the possibility of human error and the circumvention or overriding of controls. Accordingly, even an effective internal control system can provide only reasonable assurance
with respect to financial statement preparation and the safeguarding
of assets.
During the financial year the Audit Committee met with management on a quarterly basis to track their progress in resolving outstanding internal control issues previously raised by the Auditor-General and Internal Audit. Notwithstanding the fact that several shortcomings were pointed out by external and internal auditors, the Audit Committee is satisfied that the Corporation continually endeavors on focussing on maintaining qualitative levels
of internal controls. Various steps are being implemented to address the shortcomings identified during the internal reviews and external audit reports.
INTERNAL AUDIT The Audit Committee notes that
during the year under review, an internal audit function was in place and operational for the entire period. With the exception of the
REPORT OF THEAUDITCOMMITTEE
PAGE
67

revenue management application that was’nt feasible to review as it is hosted by a third party, all other projects identified in the internal audit plan were carried out as planned.
Internal Audit has reported that management has not taken adequate corrective action to address weaknesses previously reported with reference to significant matters pertaining to supply chain management, management accounting and asset management as identified in the 2011/12 audit.
RISK MANAGEMENT The Corporation fully implemented
a system of risk management.
In accordance with the requirements of the Public Finance Management Act, 1999 (Act No. 1 of 1999), as amended, a risk assessment was facilitated by the Internal Auditors, PWC. Effective risk management is integral to the organisation’s objective of consistently adding value to the business. Management is continuously developing and enhancing its risk and control procedures to improve the mechanisms for identifying and
monitoring risks. The Board has initiated the development of a Risk Management Framework and Fraud Prevention Plan.
The fraud prevention and risk management policies adopted by MTC are aimed at obtaining sufficient cover to protect its asset base, earning capacity and legal obligations against possible losses.
Risks of a possible catastrophic nature (e.g. bus accidents) are identified and insured. These risks are reviewed on an annual basis to ensure that cover is adequate. Claims of a general nature are also adequately covered.
EVALUATION OF ANNUAL FINANCIAL STATEMENTS
The Audit Committee has:• Reviewed and discussed with the
Auditor-General and the Accounting Officer the audited annual financial statements to be included in the annual report;
• Reviewed the Auditor-General’s management letters and the responses thereto;
• Reviewed significant adjustments resulting from the audit.
• Reviewed the Auditor-General’s report.
The Audit Committee concurs and accepts the Auditor-General’s conclusion on the annual financial statements and is of the opinion that the audited annual financial statements be accepted and read together with the report of the Auditor-General.
IN YEAR MANAGEMENT REPORTING
We are satisfied with the content and quality of monthly and quarterly reports prepared by the Accounting Officer during the year under review. We commend management on their turnaround with regards to performance information and service delivery reporting which resulted in a clean audit for the period under review. It was however noted that some aspects pertaining for financial reporting were not always satisfactory. This aspect was noted in the Auditor Generals’ management report.
APPRECIATION The Audit Committee wishes
to express its appreciation to Management and Staff of the Mayibuye Transport, the Auditor-General and Internal Audit for the information they have provided for us to compile this report.
MR JACK MDENIChairperson - Mayibuye Transport Corporation Audit Committee
31 July 2013
PAGE
68

TO THE EASTERN CAPE PROVINCIAL LEGISLATURE ON THE MAYIBUYE TRANSPORT CORPORATION
REPORT ON THE FINANCIAL STATEMENTS Introduction 1. I was engaged to audit the financial statements of the
Mayibuye Transport Corporation set out on pages 69 to 72, which comprise the statement of financial position as at 31 March 2013, the statement of comprehensive income, statement of changes in equity and the statement of cash flows for the year then ended, and the notes, comprising a summary of significant accounting policies and other explanatory information.
Accounting authority’s responsibility for the financial statements2. The board of directors which constitutes the accounting
authority is responsible for the preparation and fair presentation of these financial statements in accordance with South African Statements of Generally Accepted Accounting Practice (SA Statements of GAAP) and the requirements of the Public Finance Management Act of South Africa, 1999 (Act No. 1 of 1999) (PFMA), and for such internal control as the accounting authority determines is necessary to enable the preparation of financial statements that are free from
material misstatement, whether due to fraud or error.
Auditor-General’s responsibility 3. My responsibility is to express an opinion on the
financial statements based on conducting the audit in accordance with the Public Audit Act of South Africa, 2004 (Act No. 25 of 2004) (PAA), the General Notice issued in terms thereof and International Standards on Auditing. Because of the matters described in the Basis for disclaimer of opinion paragraphs, however, I was unable to obtain sufficient appropriate audit evidence to provide a basis for an audit opinion.
Basis for disclaimer of opinion Property, plant and equipment (PPE)4. The entity did not account for its PPE in accordance
with IAS 16, Property, plant and equipment in the following circumstances:
• Useful lives of assets were not reviewed at the end of the reporting period;
• The entity did not record all of its office, operating and workshop equipment, or all of its office furniture in the financial statements;
• The entity inappropriately capitalised maintenance costs that do not meet the recognition criteria for PPE;
• Assets that were not in appropriate working condition were not tested for impairment as required.
Consequently, PPE as disclosed in note 3 is overstated by R14, 9 million, Finance lease liability as disclosed on the statement of financial position is understated by R0,5 million and operating expenses as disclosed in the statement of comprehensive income is understated by R15, 4 million.
5. In addition I was unable to obtain sufficient appropriate audit evidence for PPE due to the following matters:
• The entity did not determine the recoverable amounts of assets as required by IAS 36, Impairment of assets;
• Land and buildings are not separately identifiable on the asset register;
• Assets could not be physically located during the audit;• I was not provided with sufficient appropriate
supporting evidence of the review at the financial year-end of the residual values as required by IAS 16 and;
• I was not provided with sufficient appropriate evidence for prior year correcting journals to PPE.
I was unable to confirm the current and comparative amount for PPE by alternative means. Consequently, I was unable to determine whether any further adjustments were necessary to property, plant & equipment of R49, 9 million (2012: R56, 7 million) as disclosed in note 3 to the financial statements, and to the comparative figure for impairment loss of R1 million as disclosed in note 12 to the financial statements
were necessary.
6. Included in note 3 to the financial statements is spare parts and units, which are included as PPE in error instead of being reflected as inventory as required by IAS 16. Consequently, depreciation for the year expensed to the statement of comprehensive income is overstated by R8, 3 million (2012: R10, 7 million), and the property, plant and equipment comparative amount is overstated by R5, 8 million as disclosed in note 3 to the financial statements. In addition the the prior year error correction reflected in note 22.1 for spares and units is overstated by R3, 7 million.
Passenger Fares Revenue7. I was unable to obtain sufficient appropriate audit
evidence on the completeness of passenger fares revenue as included in note 11 to the financial statements, as internal controls were not established over the collection thereof prior to the initial entry into the financial records i.e. incomplete recording of routine cash transactions. I was unable to confirm the completeness of revenue by alternative means. Consequently I was unable to determine whether any adjustments to passenger fares revenue of R22, 9 million (2012: R19, 5 million) as included in note 11 to the financial statements were necessary.
Cost of services rendered, operating and other expenses8. I was unable to obtain sufficient appropriate audit
REPORT OF THEAUDITOR GENERAL
PAGE
69

evidence for cost of services rendered, as I was not provided with the basis of determining the weighted average cost price. I was unable to confirm the amounts by alternative means. Consequently I was unable to determine whether any adjustments relating to cost of services rendered of R29, 4 million (2012: R29 million) as disclosed in the statement of comprehensive income were necessary.
9. The entity did not recognise operating expenses
in accordance with IAS 1, Presentation of financial statements as they recognised transactions in the incorrect accounting period, consequently, operating expenditure and the accumulated deficit are understated by R2, 3 million. In addition I was unable to obtain sufficient and appropriate audit evidence for operating expenses as the entity did not provide valid supporting documents for maintenance contract charges included in this amount. I was unable to confirm the operating expenses by alternative means. Consequently I was unable to determine whether any further adjustments to operating expenses of R40, 4 million as disclosed in the statement of comprehensive income were necessary.
10. The entity did not reconcile the amounts included in the accounting records for cost of services rendered, administration expenses and operating expenses as reflected on the statement of comprehensive income.
In total expenses are understated by R7, 7 million however as there were no adequate records it was impracticable to determine the corrections required to each separate line item.
11. In addition, staff costs disclosed in note 12.1 of the
financial statements is understated by R1, 3 million. This is due to the underlying records not agreeing to the financial statements.
Irregular expenditure12. The entity did not have adequate systems in place to
identify and disclose all irregular expenditure incurred during the year as required by section 55(2)(b)(i) of the PFMA. Irregular expenditure incurred as disclosed in note 13 to the financial statements is understated for
amounts identified during the audit process of R14, 4 million. Due to the lack of systems however, it was impracticable for me to determine the full extent of this understatement. Finance lease liability13. The entity did not disclose the net carrying amount of
R11, 9 million at the reporting period for each class of finance leased asset as required by IAS 17, Leases.
14. The entity did not accurately record the opening balance of the finance lease liability in accordance with the amortization schedule. Consequently, the finance lease liability comparative amount as disclosed in the statement of financial position is overstated by R1 million. In addition there is a consequential impact on the accumulated deficit.
15. In addition, I was unable to obtain sufficient appropriate audit evidence for finance lease liability as the entity did not provide supporting evidence to support the monthly minimum lease payments, and no audit evidence for prior year adjustments of the finance lease liability was provided. I was unable to confirm the finance lease liability by alternative means. Consequently I was unable to determine whether any further adjustments relating to finance lease liability of R5, 1 million (2012: R9 million) and current portion of the finance lease liability of R6, 8 million (2012: R6, 3 million) as disclosed in the statement of financial position and note 8 to the financial statements were necessary.
Inventories 16. The entity did not adjust inventory items that were
not in physical stores as at year end, which resulted in inventory as disclosed in the statement of financial position being overstated by R2, 7 million and cost of services rendered being understated by R2, 7 million In addition I was unable to obtain sufficient appropriate audit evidence for inventories as I was not provided with the basis or supporting documentation for determining the weighted average cost price of inventory, and because Inventory items could not be physically located during the audit. I was unable to confirm inventories by alternative means. Consequently I was unable to determine whether any further adjustments relating to inventory stated at R4, 5 million as disclosed in note 4 to the financial statements
were necessary.
Share capital17. The entity did not correctly account for the issue of
share capital in the restated amounts as it only issued shares in the current year. Consequently, the restated share capital comparative is overstated by R3, 2 million and the current year issued share capital is understated by R3, 2 million in the statement of changes in equity.
Accrued leave pay18. I was unable to obtain sufficient appropriate audit
evidence for the accrued leave pay included in Trade and other payables as disclosed in note 9 to the financial statements, as I was not provided with the employees opening leave credits that were used in the calculation of the obligation outstanding at each year-end. I was unable to confirm the amounts by alternative means. Consequently I was unable to determine whether any adjustments relating to accrued leave pay stated at R2, 3 million (2012: R 2, 8 million) as included in note 9 to the financial statements were necessary.
Cash generated by operations19. The entity did not correctly calculate the movement in
working capital included in note 15 for cash generated by operations. The increase in payables is not based on the movement of trade and other payables, and consequently the Increase / (Decrease) in payables is understated by R1, 7 million.
PAGE
70

20. In addition I was unable to obtain sufficient appropriate audit evidence for the unnamed reconciling item of R2, 1 million included in the cash generated by operations note. I was unable to confirm this amount by alternative means. Consequently I was unable to determine whether any adjustments relating to cash generated by operations as disclosed in note 15 of the financial statements were required.
Disclaimer of opinion21. Because of the significance of the matters described in
the Basis for disclaimer of opinion paragraphs, I have not been able to obtain sufficient appropriate audit
evidence to provide a basis for an audit opinion Accordingly, I do not express an opinion on the financial statements.
Emphasis of matters22. I draw attention to the matters below. My opinion is not
modified in respect of these matters.
Restatement of corresponding figures 23. As disclosed in note 22.1 to the financial statements,
the corresponding figures for 31 March 2012 have been restated as a result of errors only discovered during the current financial year.
Significant uncertainties 24. As disclosed in note 3 and 17 to the financial
statements, the Zwelitsha Depot, which is situated on communal land, has been recognised as leasehold land and buildings with a carrying value of R1, 1 million. The corporation derives economic benefits from the use thereof and carries the risks that are incidental to ownership. A process for the acquisition of the title deed has been initiated with the Land Claims Commission, the outcome of which is uncertain at the date of this report. The possible cost element of the acquisition of the land as well as any adjustments to the carrying value of leasehold land and buildings is dependent on this future event and cannot be reasonably measured.
Funding of operations25. As disclosed in Note 21 to the financial statements,
the Corporation has an accumulated deficit and is dependent on funding for its operations as detailed.
REPORT ON OTHER LEGAL AND REGULATORY REQUIREMENTS
26. In accordance with the PAA and the General Notice issued in terms thereof, I report the following findings relevant to performance against predetermined objectives, compliance with laws and regulations and internal control, but not for the purpose of expressing an opinion.
Predetermined objectives 27. I performed procedures to obtain evidence about the
usefulness and reliability of the information in the annual performance report as set out on pages 26 to 53 of the annual report.
28. The reported performance against predetermined objectives was evaluated against the overall criteria of usefulness and reliability. The usefulness of information in the annual performance report relates to whether it is presented in accordance with the National Treasury’s annual reporting principles and whether the reported performance is consistent with the planned objectives. The usefulness of information further relates to whether indicators and targets are measurable (i.e. well defined, verifiable, specific, measurable and time bound) and
relevant as required by the National Treasury Framework for managing programme performance information.
29. The reliability of the information in respect of the selected programmes is assessed to determine whether it adequately reflects the facts (i.e. whether it is valid, accurate and complete).
30. There were no material findings on the annual performance report concerning the usefulness and reliability of the information.
Additional matter31. Although no material findings concerning the
usefulness and reliability of the performance information was identified in the annual performance report I draw attention to the following matter below.
Achievement of planned targets32. Of the total number of 79 targets planned for the
year, 30 (38%) were not achieved during the year under review. This was as a result of the institution not considering relevant systems and evidential requirements during the annual strategic planning process as the action plans in place did not
address underperformance.
Compliance with laws and regulations33. I performed procedures to obtain evidence that
the entity has complied with applicable laws and regulations regarding financial matters, financial management and other related matters. My findings on material non-compliance with specific matters in key applicable laws and regulations as set out in the General Notice issued in terms of the PAA are
as follows:
Strategic planning and performance34. The accounting authority did not submit to the
accounting authority of a department designated by the executive authority responsible for that public entity or business enterprise, and to the relevant treasury, at least one month, or another period agreed with the National Treasury, before the start of the financial year, a corporate plan in the prescribed format as required by section 52(b) of the PFMA read with Treasury Regulation (TR) 29.2.
Annual financial statements, performance and annual reports35. The financial statements submitted for auditing
PAGE
71

were not prepared in accordance with the prescribed financial reporting framework and supported by full and proper records as required by section 55(1) ((a) and) (b) of the PFMA. Material misstatements identified by the auditors in the submitted financial statements were not corrected, which resulted in the financial statements receiving a disclaimer of opinion.
Asset management and liability management36. Proper control systems to safeguard and maintain
assets were not implemented, as required by sections 50(1) (a) and 51(1) (c) of the PFMA.
Revenue management37. The accounting authority did not take effective and
appropriate steps to collect all money due, as required by section 51(1)(b)(i) of the PFMA and TR 31.1.2(a) and 31.1.2(e).
Expenditure management38. The accounting authority did not take effective steps
to prevent irregular expenditure, as required by section 51(1) (b) (ii) of the PFMA.
39. Effective and appropriate disciplinary steps were not taken against officials who incurred and permitted
irregular expenditure and fruitless & wasteful expenditure, as required by section 51(1) (e) (iii) of
the PFMA.
Procurement and contract management40. Sufficient appropriate audit evidence could not be
obtained that all goods, works and services were procured through a procurement process which is fair, equitable, transparent and competitive as required by the PFMA section 51(1) (a) (iii).
41. Sufficient appropriate audit evidence could not be obtained that all the procurement processes complied with the requirements of a fair supply chain management (SCM) system as per section 51(1) (a) (iii)
of the PFMA.
42. Quotations were awarded to suppliers whose tax matters had not been declared by the South African Revenue Services to be in order as required by TR 16A9.1 (d) and the Preferential Procurement Regulations.
43. Sufficient appropriate audit evidence could not be obtained that all contracts and quotations were
awarded in accordance with the legislative requirements as the relevant bid files could not be found.
Internal control44. I considered internal control relevant to my audit
of the financial statements, performance against annual targets report and compliance with laws and regulations. The matters reported below under the fundamentals of internal control are limited to the significant deficiencies that resulted in the basis for disclaimer of opinion, the findings on the performance
report and the findings on compliance with laws and regulations included in this report.
Leadership45. The accounting authority did not ensure that the action plan in place to address matters I have reported in prior years was properly implemented - this was due to the lack of effective monitoring of the
action plan. Leadership does not impose effective performance management as there are no consequences for poor performance.
46. The entity did not fill the vacancy of the Chief financial officer, this has resulted in a lack of adequate financial reporting skills and contributed to the misstatements of the financial statements.
Financial and performance management47. Regular reconciliations for various account balances
were not performed during the year, in order to ensure they were accurate and supported by credible evidence; this is due to a lack of reviews, effective supervision and understanding of the relevant accounting requirements. There is also a lack of adequate record management and filing of documents, and numerous supporting documents could not be obtained during the audit.
48. There is a lack of compliance monitoring on a regular basis and non-compliance is not addressed in a timely manner, due to the fact that there is no effective compliance checklist in place.
Governance49. Management did not ensure that all material errors
identified by the audit committee were resolved before the financial statements were submitted for
audit purposes.
50. Internal audit has not obtained reasonable assurance on the effectiveness of internal controls around the SCM system; as they did not adequately review the procurement process during the year in order to identify
awards that were made contrary to the SCM requirements.
East London, 31 July 2013
PAGE
72

DIRECTORSPLC Maseti ChairpersonSJ Nyengane Deputy ChairpersonPP Balfour Director *F.S. Loliwe Director **M. Vaaiboom DirectorS. Gomba Alternate DirectorAJ de Vries Director
D. Qhali DirectorAM Church Director ***NEP Loyilane DirectorRN Luzuka DirectorZ Pakati Director ****AS Mandla Director ****
NATURE OF BUSINESSThe entity provides subsidised public transport and is governed by the Public Finance Management Act, Schedule 3D Provincial Government Business Enterprises Entity
BANKERSThe Standard Bank of South Africa Limited
AUDITORSAuditor-General South Africa
REGISTERED OFFICEReeston Depot, Coner of Drummond and Mdantsane Access road, EL, Eastern Cape, South Africa
APPROVAL OF THE ANNUAL FINANCIAL STATEMENTS
The annual financial statements were approved by the board of directors on 31 May 2013 and are signed as such by:
REPORT OFFINANCIALPOSITION For the 12 months ended 31 March 2013
MR PERCY L C MASETIChairperson of the Board of DirectorsTuesday, 31 July 2013
MR LUTHANDO R MBINDAChief Executive OfficerTuesday, 31 July 2013
* Mr Balfour did not renew his Board term when it expired on 28 February 2013. ** Ms Loliwe resigned on 14 January 2013. *** Ms Church did not renew her Board term when it expired on 28 February 2013. **** Mr Mandla was the Alternate Board Member for Ms Pakati, but became a full Board Member when Ms Pakati was replaced on 15 June 2012. Ms Gomba is the Alternate Board Member for Mr M. Vaaiboom.
PAGE
73

Mayibuye Transport Corporation Annual Financial Statements for the year ended 31 March 2013
STATEMENT OF FINANCIAL POSITION AS AT 31 MARCH 2013NOTES 2013 Restated 2012
ZAR ZAR
ASSETSNon-current assets
Property, plant and equipment 3 49 928 268 56 737 575
Total non-current assets 49 928 268 56 737 575
Current assets
Inventories 4 4 477 424 866 723
Trade and other receivables 5 974 383 369 916
Cash and cash equivalents 6 101 765 105 900
Total current assets 5 553 572 1 342 539
Total assets 55 481 840 58 080 114
EQUITY AND LIABILITIESCapital and reserves
Share capital 7 120 000 000 56 761 075
Capitalisation reserve 7 - -
Accumulated deficit (85 327 238) (82 356 920)
34 672 762 (25 595 845)
NON-CURRENT LIABILITIESFinance lease liability 8 5 093 154 9 098 324
5 093 154 9 098 324
CURRENT LIABILITIES Current portion of finance liability 6 805 076 6 345 756
Trade and other payables 9 8 539 773 9 621 879
Deferred income 10 371 075 58 609 999
TOTAL CURRENT LIABILITIES 15 715 924 74 577 634
TOTAL EQUITY AND LIABILITIES 55 481 840 58 080 113
-0 -0
Mayibuye Transport Corporation Annual Financial Statements for the year ended 31 March 2013
STATEMENT OF PROFIT OR LOSS AND OTHER COMPREHENSIVE INCOME FOR THE YEAR ENDED 31 MARCH 2013 NOTES 2013 Restated 2012
ZAR ZAR
Revenue 11 27 606 895 23 850 758
Cost of services rendered (29 406 223) (28 972 240)
Gross loss (1 799 329) (5 121 482)
Other income - Grant 20.2 63 773 000 51 429 000
Other operating income 138 927 107 853
Administration expenses (22 993 823) (22 717 238)
Operating expenses (40 472 124) (41 498 515)
Loss from operations (1 353 350) (17 800 382)
Interest income 67 583 123 481
Interest Expense (1 684 551) (1 013 295)
Total Comprehensive Income/(Loss) for the year (2 970 318) (18 690 196)
PAGE
74

Mayibuye Transport Corporation Annual Financial Statements for the year ended 31 March 2013
STATEMENT OF CHANGES IN EQUITY FOR THE YEAR ENDED 31 MARCH 2013NOTES SHARE
CAPITALACCUMULATED
DEFICITTOTAL
ZAR ZAR ZAR Balance at 1 April 2010 56 761 075 (60 386 521) (3 625 446)
Prior period error correction 22,1 3 238 925 (2 186 360) 36 563 640
Restated profit (loss) for the year - (1 093 843) (1 093 843)
- Originally stated profit(loss) for the year - 164 385 164 385
- 2011 year end error correction 22,1 - (1 258 228) (1 258 228)
Current year capitalisation reserve increase 9 860 000 - 9 860 000
Restated balance at 31 March 2011 60 000 000 (63 666 724) 41 704 351
Restated profit (loss) for the year - (18 690 196) (18 690 196)
- Originally stated profit(loss) for the year - (440 451) (440 451)
- 2012 year end error correction 22,1 - (18 249 745) (18 249 745)
Current year capitalisation reserve increase - - -
Restated balance at 31 March 2012 60 000 000 (82 356 920) 23 014 155
Loss for the year - (2 970 318) (2 970 318)
Current year capitalisation reserve increase - - -
Current year issued share capital increase 60 000 000 - 60 000 000
Balance at 31 March 2013 120 000 000 (85 327 238) 34 672 762
PAGE
75

Mayibuye Transport Corporation Annual Financial Statements for the year ended 31 March 2013
STATEMENT OF CASH FLOWS FOR THE YEAR ENDED 31 MARCH 2013 NOTES 2013 Restated 2012
ZAR ZAR
OPERATING ACTIVITIES
Cash receipts from customers and grants 91 450 509 75 008 992
Cash paid to suppliers and employees (83 517 988) (70 313 856)
CASH GENERATED BY OPERATIONS 15 7 932 521 4 695 136
Interest received 67 583 123 481
Interest paid (1 684 551) (904 668)
NET CASH FROM OPERATING ACTIVITIES 6 315 553 3 913 949
INVESTING ACTIVITIES
Purchases of property, plant and equipment (8 053 677) (22 797 153)
Proceeds from sale of property, plant and equipment 279 839 -
NET CASH (USED IN)/FROM INVESTING ACTIVITIES (7 773 838) (22 797 153)
FINANCING ACTIVITIES
Capital grant received 20.2 5 000 000 10 000 000
Net finance lease liability (repaid)/raised (3 545 850) 7 218 213
NET CASH FROM FINANCING ACTIVITIES 1 454 150 17 218 213
NET INCREASE IN CASH AND CASH EQUIVALENTS (4 136) (1 664 991)
CASH AND CASH EQUIVALENTS AT BEGINNING OF YEAR 105 900 1 770 890
CASH AND CASH EQUIVALENTS AT END OF YEAR 6 101 765 105 900
PAGE
76

Mayibuye Transport Corporation Annual Financial Statements for the year ended 31 March 2013
3. PROPERTY, PLANT AND EQUIPMENT Land & Building Leasehold
Land & Buildings AncillaryVehicles
Buses Spare parts& Units
OfficeEquipment
OfficeFurniture
OperatingEquipment
WorkshopEquipment
Total
ZAR ZAR ZAR ZAR ZAR ZAR ZAR ZAR ZAR ZAR
Restated Carrying value at 1 April 2012 3 850 598 1 100 000 2 025 167 37 876 744 5 840 962 1 389 822 573 855 3 737 718 342 709 56 737 575
At Cost 4 101 573 1 100 000 4 536 959 60 528 228 16 508 912 2 348 093 881 296 5 005 183 990 010 96 000 254
Accumulated Depreciation (250 975) - (2 511 792) (22 651 484) (10 667 950) (958 271) (307 441) (1 267 465) (647 301) (39 262 679)
Additions 260 926 - - 1 559 703 5 025 231 949 236 124 104 4 445 130 032 8 053 677
Disposals - Cost - - (123 846) (890 646) - (12 680) - - - (1 027 172)
Disposals - Accumulated Depreciation - - 108 846 337 204 - 5 010 - - - 451 060
Current year write off - Cost - - - (2 936 571) (10 667 951) (52 741) (39 567) - (37 123) (13 733 953)
Current year write off - Acc depr - - - 1 926 087 10 667 951 47 614 21 528 - 37 110 12 700 290
Year-end transfer from inventory - - - - - - - - -
Previous year-end transfer to inventory - - - - (2 566 945) - - - - (2 566 945)
Impairment loss - - - (181 453) - - - - - (181 453)
Prior period error - - - - - - - - -
Depreciation for the year (67 911) - 488 719 (1 013 099) (8 299 248) (448 454) (90 535) (940 203) (134 080) (10 504 811)
Carrying value at 31 March 2013 4 043 613 1 100 000 2 498 886 36 677 969 - 1 877 807 589 385 2 801 960 338 648 49 928 268
At Cost 4 362 499 1 100 000 4 413 113 58 079 261 8 299 247 3 231 908 965 833 5 009 628 1 082 919 86 544 408
Accumulated Depreciation (318 886) - (1 914 227) (21 401 292) (8 299 247) (1 354 101) (376 448) (2 207 668) (744 271) (36 616 140)
Land and buildings comprises workshops, offices and bus sheds situated in the following sites:• Erf 77, 78, 79, 80, 81 of farm 35, Wilsonia, district of East London, market value R2 600 000.• Plot 4265, Queendustria Industrial Township, Queenstown, market value R1 400 000.• Zone 8 Zwelitsha - the entity has been given the right to use the property indefinitely. A process for the acquisition of
the title deed has been initiated with the Land Claims Commission. At present, a valuation has been performed and the land has been surveyed, details of which are noted under note 18. Improvements on the property are capitalised.• Erf 1097, Alice, market value R620 000.• The historical opening depreciation charge assumes that the land is worth 50% of the historical carrying value.• An amount of R 181 453 was raised as impairement charge against buses. The method used to determine the
impairement charge was limited to the resale value as all other methods reflected negative contributions.
Mayibuye Transport Corporation Annual Financial Statements for the year ended 31 March 2013
3. PROPERTY, PLANT AND EQUIPMENT Land & Building Leasehold
Land & Buildings AncillaryVehicles
Buses Spare parts& Units
OfficeEquipment
OfficeFurniture
OperatingEquipment
WorkshopEquipment
Total
ZAR ZAR ZAR ZAR ZAR ZAR ZAR ZAR ZAR ZAR
Restated Carrying value at 1 April 2011 3 637 196 1 100 000 2 048 175 32 300 514 7 393 934 1 022 775 560 076 4 177 556 134 616 52 993 323
At Cost 3 821 945 1 100 000 3 321 046 50 977 019 11 140 632 1 636 702 789 043 5 618 074 656 814 79 061 275
Accumulated Depreciation (184 750) - (2 074 013) (17 256 882) (3 746 698) (613 928) (228 966) (1 440 518) (522 197) (26 067 952)
Additions 279 628 - 1 291 118 10 470 747 6 548 033 729 674 100 793 426 502 383 715 20 230 210
Disposals - Cost - - - - (8 620) - - - (8 620)
Disposals - Accumulated Depreciation - - - - 2 518 - - - 2 518
Current year write off - Cost - - - - (3 746 698) (9 663) (8 540) (1 039 393) (50 519) (4 854 813)
Current year write off - Accumulated Depre-ciation
- - - - 3 746 698 9 652 4 988 687 138 48 053 4 496 529
Year-end transfer from inventory - - - - 2 566 945 - - - - 2 566 945
Inventory from previous year - -
Impairment loss - - (75 205) (919 538) - - - - - (994 743)
Prior period error
Depreciation for the year (66 225) - (437 779) (5 394 602) (10 667 950) (356 513) (83 463) (514 085) (173 157) (17 693 774)
Restated Carrying value at 31 March 2012 3 850 598 1 100 000 2 025 167 37 876 744 5 840 962 1 389 822 573 855 3 737 718 342 709 56 737 575
At Cost 4 101 573 1 100 000 4 536 959 60 528 228 16 508 912 2 348 093 881 296 5 005 183 990 010 96 000 254
Accumulated Depreciation (250 975) - (2 511 792) (22 651 484) (10 667 950) (958 271) (307 441) (1 267 465) (647 301) (39 262 679)
PAGE
77

Mayibuye Transport Corporation Annual Financial Statements for the year ended 31 March 2013
3. PROPERTY, PLANT AND EQUIPMENT Land & Building Leasehold
Land & Buildings AncillaryVehicles
Buses Spare parts& Units
OfficeEquipment
OfficeFurniture
OperatingEquipment
WorkshopEquipment
Total
ZAR ZAR ZAR ZAR ZAR ZAR ZAR ZAR ZAR ZAR
Restated Carrying value at 1 April 2012 3 850 598 1 100 000 2 025 167 37 876 744 5 840 962 1 389 822 573 855 3 737 718 342 709 56 737 575
At Cost 4 101 573 1 100 000 4 536 959 60 528 228 16 508 912 2 348 093 881 296 5 005 183 990 010 96 000 254
Accumulated Depreciation (250 975) - (2 511 792) (22 651 484) (10 667 950) (958 271) (307 441) (1 267 465) (647 301) (39 262 679)
Additions 260 926 - - 1 559 703 5 025 231 949 236 124 104 4 445 130 032 8 053 677
Disposals - Cost - - (123 846) (890 646) - (12 680) - - - (1 027 172)
Disposals - Accumulated Depreciation - - 108 846 337 204 - 5 010 - - - 451 060
Current year write off - Cost - - - (2 936 571) (10 667 951) (52 741) (39 567) - (37 123) (13 733 953)
Current year write off - Acc depr - - - 1 926 087 10 667 951 47 614 21 528 - 37 110 12 700 290
Year-end transfer from inventory - - - - - - - - -
Previous year-end transfer to inventory - - - - (2 566 945) - - - - (2 566 945)
Impairment loss - - - (181 453) - - - - - (181 453)
Prior period error - - - - - - - - -
Depreciation for the year (67 911) - 488 719 (1 013 099) (8 299 248) (448 454) (90 535) (940 203) (134 080) (10 504 811)
Carrying value at 31 March 2013 4 043 613 1 100 000 2 498 886 36 677 969 - 1 877 807 589 385 2 801 960 338 648 49 928 268
At Cost 4 362 499 1 100 000 4 413 113 58 079 261 8 299 247 3 231 908 965 833 5 009 628 1 082 919 86 544 408
Accumulated Depreciation (318 886) - (1 914 227) (21 401 292) (8 299 247) (1 354 101) (376 448) (2 207 668) (744 271) (36 616 140)
Mayibuye Transport Corporation Annual Financial Statements for the year ended 31 March 2013
3. PROPERTY, PLANT AND EQUIPMENT Land & Building Leasehold
Land & Buildings AncillaryVehicles
Buses Spare parts& Units
OfficeEquipment
OfficeFurniture
OperatingEquipment
WorkshopEquipment
Total
ZAR ZAR ZAR ZAR ZAR ZAR ZAR ZAR ZAR ZAR
Restated Carrying value at 1 April 2011 3 637 196 1 100 000 2 048 175 32 300 514 7 393 934 1 022 775 560 076 4 177 556 134 616 52 993 323
At Cost 3 821 945 1 100 000 3 321 046 50 977 019 11 140 632 1 636 702 789 043 5 618 074 656 814 79 061 275
Accumulated Depreciation (184 750) - (2 074 013) (17 256 882) (3 746 698) (613 928) (228 966) (1 440 518) (522 197) (26 067 952)
Additions 279 628 - 1 291 118 10 470 747 6 548 033 729 674 100 793 426 502 383 715 20 230 210
Disposals - Cost - - - - (8 620) - - - (8 620)
Disposals - Accumulated Depreciation - - - - 2 518 - - - 2 518
Current year write off - Cost - - - - (3 746 698) (9 663) (8 540) (1 039 393) (50 519) (4 854 813)
Current year write off - Accumulated Depre-ciation
- - - - 3 746 698 9 652 4 988 687 138 48 053 4 496 529
Year-end transfer from inventory - - - - 2 566 945 - - - - 2 566 945
Inventory from previous year - -
Impairment loss - - (75 205) (919 538) - - - - - (994 743)
Prior period error
Depreciation for the year (66 225) - (437 779) (5 394 602) (10 667 950) (356 513) (83 463) (514 085) (173 157) (17 693 774)
Restated Carrying value at 31 March 2012 3 850 598 1 100 000 2 025 167 37 876 744 5 840 962 1 389 822 573 855 3 737 718 342 709 56 737 575
At Cost 4 101 573 1 100 000 4 536 959 60 528 228 16 508 912 2 348 093 881 296 5 005 183 990 010 96 000 254
Accumulated Depreciation (250 975) - (2 511 792) (22 651 484) (10 667 950) (958 271) (307 441) (1 267 465) (647 301) (39 262 679)
PAGE
78

1. PRESENTATION OF FINANCIAL STATEMENTSThese financial statements are presented in South African Rand [R] since that is the functional currency in which the transactions are denominated.
2. SUMMARY OF SIGNIFICANT ACCOUNTING POLICIESThe Annual Financial Statements are prepared under the historical cost convention, other than certain financial instruments, and incorporate the following principal accounting policies, which have been consistently applied in all material respect. The financial statements have been prepared in accordance with South African Statements of Generally Accepted Accounting Practice. The principal accounting policies adopted remained unchanged from the previous year.
2.1. Irregular and fruitless and wasteful expenditure
Irregular expenditure means expenditure incurred in contravention of, or not in accordance with a requirement of any applicable legislation, including:The Public Finance Management Act, or Any provincial legislation providing for procurement procedures in that provincial government.
Fruitless and wasteful expenditure means expenditure that was made in vain and would have been avoided had reasonable care been exercised.
All irregular and fruitless and wasteful expenditure is recognised in profit and loss in the period in which it is incurred and where recovered, it is subsequently accounted for as revenue in the Income Statement. 2.2. Cash and cash equivalentsCash and cash equivalents are measured at fair value.
Cash in the balance sheet comprises cash at bank and on hand and short-term deposits held by the Corporation. For the purposes of the cash flow statement, cash and cash equivalents consist of cash and cash equivalents as defined above.
2.3. Revenue recognitionRevenue is measured at the fair value of the consideration received or receivable. Revenue is reduced for estimated customer returns, rebates and other similar allowances. Revenue is recognised to the extent that it is probable
that the economic benefits will flow to the entity and the revenue can be reliably measured.
When the outcome of a transaction involving the rendering of services can be estimated reliably, revenue associated with the transaction will be recognised by reference to the stage of completion of the transaction at the balance sheet date.
Revenue from the sale of bus tickets and bus hiring is recognised when the significant risks and rewards of ownership are transferred to the buyer.
Interest income is accrued on a time basis, by reference to the principal outstanding and at the interest rate applicable, except for interest earned on capital funding which is disclosed seperately.
2.4. Leasing Leases are classified as finance leases whenever the term of the lease transfer substantially all the risks and rewards to the lessee. All other leases are classified as operating leases. Assets held under finance leases are initially recognised as assets of the Corporation at their fair value at the inception of the lease or if lower at the present value of the minimum lease payments, each determined at the inception of the lease. The corresponding liability to the lessor is included in the balance sheet as a finance lease obligation. The lease payments are apportioned between finance charges and reduction of the lease obligation so as to achieve a constant rate of interest on the remaining balance of the liability.
2.5. Defined contribution plansThe cost of defined contribution plans is the contribution payable by the employer for that accounting period. Contribution to a defined contribution plan, in respect of service in a particular period, are recognised as an expense in that period.
2.6. Taxation“No provision has been made for taxation as the entity is a tax exempt institution in terms of section 10.1 (a) of the Income Tax Act No. 58 of 1962.”
2. 7. Property, plant and equipmentBuildings, plant and equipment is stated at cost less accumulated depreciation and accumulated impairment losses. Such cost includes the cost of replacing part of the plant and equipment when that cost is incurred,
ACCOUNTING POLICIES For the 12 months ended 31 March 2013
PAGE
79

if the recognition criteria are met. All other repair and maintenance costs are recognised in profit or lossas incurred.
Land is not depreciated as it is deemed to have an indefinite life.
Items of property, plant and equipment are depreciated using the straight line basis at rates that will reduce the book values to estimated residual values over the anticipated useful lives of the assets concerned.
The principal annual rates used for this purpose are:Ancillary Vehicles 25%Buses - Body 12,5%Buses - Chassis, Engine, etc 8,33%Office Equipment 20%Office Furniture 10%Operating Equipment 20%Workshop Equipment 25%Buildings 2%Spare parts & Units 50%
Spare parts and units are capitalised at cost. It is not practical to determine the carrying amount or cost of the parts and units that were replaced or added. The carrying amount or cost of replacement is estimated at what the cost of the replaced part or unit was initially.
An item of plant and equipment is derecognised upon disposal or when no future economic benefits are expected to arise from the continued use of the asset. Inferior equipment is written off in full in the year it is acquired. Surpluses or deficits on the disposal of assets are credited or charged to income. The surplus or deficit is the difference between the net disposal proceeds and the carrying amount of the asset.
Subsequent expenditure relating to property, plant and equipment is capitalised if the subsequent expenditure meets the definition of an asset.
When parts of an item of property, plant and equipment have different useful lives, they are accounted for as separate items (major components) of property, plant and equipment and shall be depreciated according to their different useful life.
The gains and losses arising from the de-recognition of property, plant and equipment (difference between carrying amount less any revaluation surpluses and net disposal proceeds) are included in surplus or deficit when the item is derecognized.
The residual value and the useful life of each asset are reviewed and adjusted at year end.
The depreciation charge for each year is recognized in surplus and deficit unless it is included in the carrying amount of another asset.
2.8. Impairment of non-financial assets“The Corporation assesses at each reporting date whether there is an indication that an asset may be impaired. If any such indication exists, or when annual impairment testing for an asset is required, the Corporation estimates the asset’s recoverable amount.
An asset’s recoverable amount is the higher of an asset’s or cash-generating unit’s fair value less costs to sell and its value in use and is determined for an individual asset, unless the asset does not generate cash inflows that are largely independent of those from other assets or group of assets. Where the carrying amount of an asset exceeds its recoverable amount, the asset is considered impaired and is written down to its recoverable amount. In assessing value in use, the estimated future cash flows are discounted to their present value using a pre-tax discount rate that reflects current market assessments of the time value of money and the risks specific to the asset. In determining fair value less costs to sell, an appropriate valuation model is used.
For an asset that does not generate cash inflows that are largely independent of those from other assets the recoverable amount is determined for the cash-generating unit to which the asset belongs. An impairment loss is recognised in the income statement whenever the carrying amount of the cash-generating unit exceeds recoverable amount.
A previously recognised impairment loss is reversed if the recoverable amount increases as a result of a change in the estimates used to determine the recoverable amount, but not to an amount higher than the carrying amount that would have been determined (net of depreciation) had no impairment loss been recognised in prior years.
2.9. Inventories Inventories are stated at the lower of cost and net realisable value. Cost is calculated using the weighted average method. Net realisable value is the estimated selling price in the ordinary course of business, and the estimated costs necessary to make the sale.
Inventory cost includes the costs of purchase of inventories comprising the purchase price, levies, pressing and storage. Trade discounts, rebates and other similar items are deducted in determining the costs of purchase.
2.10. Financial Instruments
2.10.1. Investments and Financial AssetsFinancial assets within the scope of IAS 39 are classified as financial assets at fair value through profit or loss, loans and receivables, held-to-maturity investments, or available-for-sale financial assets, as appropriate. When financial assets are recognised initially, they are measured at fair value, plus, in the case of investments not at fair value through profit or loss, directly attributable transaction costs.
PAGE
80

The Corporation determines the classification of its financial assets on initial recognition and, where allowed and appropriate, re-evaluates this designation at each financial year end.
2.10.2. Financial assets at fair value through profit or lossFinancial assets at fair value through profit or loss includes financial assets held for trading and financial assets designated upon initial recognition as at fair value through profit or loss.
Financial assets are classified as held for trading if they are acquired for the purpose of selling in the near term. Derivatives, including separated embedded derivatives are also classified as held for trading unless they are designated as effective hedging instruments or a financial guarantee contract. Gains or losses on investments held for trading are recognised in profit or loss.
2.10.3. Held-to-maturity investmentsNon-derivative financial assets with fixed or determinable payments and fixed maturities are classified as held-to-maturity when the Corporation has the positive intention and ability to hold to maturity. After initial measurement held-to-maturity investments are measured at amortised cost using the effective interest method. Gains and losses are recognised in profit or loss when the investments are derecognised or impaired, as well as through the amortisation process.
2.10.4. Loans and receivablesLoans and receivables are non-derivative financial assets with fixed or determinable payments that are not quoted in an active market. After initial measurement loans and receivables are carried at amortised cost using the effective interest method less any allowance for impairment. Gains and losses are recognised in profit or loss when the loans and receivables are derecognised or impaired, as well as through the amortisation process.
2.10.5. Available-for-sale financial investmentsAvailable-for-sale financial assets are those non-derivative financial assets that are designated as available-for-sale or are not classified in any of the three preceding categories. After initial measurement,available-for-sale financial assets are measured at fair value with unrealised gains or losses recognised directly in equity until the investment is derecognised or determined to be impaired at which time the cumulative gain or loss previously recorded in equity is recognisedin profit or loss.
2.10.6. Amortised costHeld-to-maturity investments and loans and receivables are measured at amortised cost. This is computed using the effective interest method less any allowance for impairment. The calculation takes into account any premium or discount on acquisition and includes transaction costs and fees that are an integral part of the effective interest rate.
2.11. Impairment of financial assets The Corporation assesses at each balance sheet date whether a financial asset or group of financial assets is impaired.
2.11.1. Assets carried at amortised costIf there is objective evidence that an impairment loss on assets carried at amortised cost has been incurred, the amount of the loss is measured as the difference between the asset’s carrying amount and the present value of estimated future cash flows discounted at the financial asset’s original effective interest rate. The carrying amount of the asset is reduced through use of an allowance account. The amount of the loss shall be recognised in profit or loss.
If, in a subsequent period, the amount of the impairment loss decreases and the decrease can be related objectively to an event occurring after the impairment was recognised, the previously recognised impairment loss is reversed, to the extent that the carrying value of the asset does not exceed its amortised cost at the reversal date. Any subsequent reversal of an impairment loss is recognised in profit or loss.
In relation to trade receivables, a provision for impairment is made when there is objective evidence that the Corporation will not be able to collect all of the amounts due under the original terms of the invoice. The carrying amount of the receivable is reduced through use of an allowance account. Impaired debts are derecognised when they are assessed as uncollectible.
2.11.2. Available-for-sale financial investmentsIf an available-for-sale asset is impaired, an amount comprising the difference between its cost and its current fair value, less any impairment loss previously recognised in profit or loss, is transferred from equity to profit or loss. Reversals in respect of equity instruments classified as available-for-sale are not recognised in profit or loss. Reversals of impairment losses on debt instruments are reversed through profit or loss, if the increase in fair value of the instrument can be objectively related to an event occurring after the impairment loss was recognised in profit or loss.
2.12. Financial liabilities and equity instruments
2.12.1. Financial liabilities at fair value through profit or lossFinancial liabilities at fair value through profit or loss includes financial liabilities held for trading and financial liabilities designated upon initial recognition as at fair value through profit or loss.
Financial liabilities are classified as held for trading if they are acquired for the purpose of selling in the near term. Gains or losses on liabilities held for trading are recognised in profit or loss.
PAGE
81

2.12.2. Derecognition of financial assets and liabilities FINANCIAL ASSETS A financial asset (or, where applicable a part of a
financial asset or part of a group of similar financial assets) is derecognised when:
- the rights to receive cash flows from the asset have expired;
- the Corporation retains the right to receive cash flows from the asset, but has assumed an obligation to pay them in full without material delay to a third party under a ‘pass through’ arrangement; or
- the Corporation has transferred its rights to receive cash flows from the asset and either (a) has transferred substantially all the risks and rewards of the asset, or (b) has neither transferred nor retained substantially all the risks and rewards of the asset, but has transferred control of the asset.
FINANCIAL LIABILITIES A financial liability is derecognised when the obligation
under the liability is discharged or cancelled or expires.
When an existing financial liability is replaced by another from the same lender on substantially different terms, or the terms of an existing liability are substantially modified, such an exchange or modification is treated as a derecognition of the original liability and the recognition of a new liability, and the difference in the respective carrying amounts is recognised in profit or loss.
2.13. Provisions Provisions are recognised where the Corporation has a
present legal or constructive obligation as a result of a past event, a reliable estimate of the obligation can be made and it is probable that an outflow of resources embodying economic benefits will be required to settle the obligation.
2.14. Key management assumptions, estimates and judgements The preparation of financial statements requires the use
of certain critical accounting estimates. It also requires management to exercise its judgement in the process of applying the Corporation’s accounting policies. The areas involving a higher degree of judgement or complexity, or areas where assumptions and estimates
are significant to the financial statements, are disclosed.
The key assumptions, estimates and judgementsconcerning the future and other key sources of estimationuncertainty at the balance sheet date, that have asignificant risk of causing a material adjustment to thecarrying amount of the assets and liabilities within the nextfinancial year are discussed below.
The residual values and estimated useful lives of property,plant and equipment were assessed and found to bereasonable. Residual values of motor vehicles aredetermined with reference to market related prices ofvehicles in a similar condition.
2.15. CommittementsItems are classified as commitments where the corporationhas committed itself to future transactions.
2.16. Share capital and capitalisation reserveShare capital is a contribution by the executive authority ofcapital. This is authorised for issue in the government gazette.Capitalisation reserves are the capital contributions forwhich the amounts exceeds the authorised share capital.
2.17. Future standardsThe accounting standards board agreed that governmentbusiness enterprises (entities listed in schedule 3B and 3Dof the public finance management act) should retain thestatus quo regarding the reporting frameworks applied inpreparing their financial statements. This means thatMayibuye Transport Corporation should continue to applystatements of GAAP.
The board will undertake research in the second half of theyear (2013/2014) to determine which reporting frameworkGBE’s should apply going forward. The board will consultwith users of GBE’s financial statements to assesswhether IFRSs or standards of GRAP provides the mostappropriate information to meet their information needs.
2.18. Change in accounting estimate During the year there has been a change in accountingestimate due to the revision of remaining useful life ofbuses and vehicles.
PAGE
82

4. INVENTORIES 2013 2012
ZAR ZAR
Fuel, Oils and Greases 982 509 252 186
Consumables 197 788 155 803
Tyres & Tubes 388 154 286 879
Ancillary Vehicle Spares 15 910 12 066
Operational Equipment Spares 179 805 118 259
Stationery, Tickets and Waybills 81 213 41 530
4 477 424 866 723
Inventories included in cost of services rendered 17 416 028 13 959 999
5. TRADE AND OTHER RECEIVABLES 2013 2012
ZAR ZAR
Trade receivables 260 705 242 155
Less: Impairment of receivables (260 705) (241 860)
Other receivables 1 093 861 369 620
974 383 369 916
Trade receivables are non-interest bearing and are generally on 30-60 days’ terms.As at 31 March 2013, trade receivables of R260 705 (2012: R 241 860) for the Corporation were impaired and fully provided for. There were no movements in the provision for impairment of receivables during the year.
Individually impaired
ZAR
At 1 April 2011 241 860
Charge for the year -
Utilised -
At 31 March 2012 241 860
Charge for the year 18 845
Utilised -
At 31 March 2013 260 705
6. CASH AND CASH EQUIVALENTS Cash and cash equivalents consist of cash on hand, call deposits and cash balances with banks. Cash and cash equivalents included in the cash flow statement comprise the following balance sheet amount.
2013 2012
ZAR ZAR
Cash and cash equivalent 101 765 105 900
101 765 105 900
Cash at banks earns interest at floating rates based on daily bank deposit rates. Short-term deposits are made for varying periods of between one day and three months, depending on the immediate cash requirements of the Corporation, and earn interest at the respective short-term deposit rates. The fair value of cash and short-term deposits is R101 765 (2012: R105 900).
As at 31 March 2013 the corporation had a facility of R 270 000 available from Standard Bank for the financing of office automation systems
NOTESto the incomestatement
PAGE
83

7. SHARE CAPITAL AND CAPITALISATION RESERVE 2013 Restated 2012
ZAR ZAR
Authorised:
Ordinary shares of R 1 each 120 000 000 60 000 000
Issued and fully paid
Ordinary shares of R 1 each 120 000 000 60 000 000
The authorised share capital was increased to 120 000 000 as per the notification in the Government Gazette dated 28 March 2013. 100% of the shares are held by the Department of Transport and the entity has one class of ordinary shares which carry no right to the Provincial Administration. The entity has one class of ordinary shares which carry no right to fixed income.
8. FINANCE LEASE LIABILITY 2013 Restated 2012
ZAR ZAR
At the balance sheet date, the entity had outstanding commitments under bus finance leases, which fall due as follows:
- 13 547 429
Within one year 6 517 658 6 118 515
In the second to fifth years inclusive 5 093 154 8 815 522
After five years - -
At the balance sheet date, the entity had office equipment finance leases, which fall due as follows: 287 418 510 042
Within one year 287 418 227 239
In the second to fifth years inclusive - 282 803
After five years - -
Total finance lease liability 5 093 154 9 098 324
During the 2013 financial year there were no finance lease liabilities raised.
During the 2012 financial year, the Corporation entered into a lease agreement with MAN Financial Services for the supply of six buses. The lease is repayable within 36 months at monthly instalments of R267 435.75. The interest implicit is 9%. At the end of the lease term the Corpo-ration has an option to acquire the buses outright, extend the agreement or to return the buses to MAN Financial Services. An interest portion of R355 228 is included in the lease liability payable within one year.
9. TRADE AND OTHER PAYABLES 2013 Restated 2012
ZAR ZAR
Trad payables 3 461 183 3 519 008
Other payables 686 059 692 911
- Private hire deposits - 76 710
- Income received in advance 75 949 96 748
- Additional payables 610 110 519 453
Payroll accruals 4 392 531 5 409 960
- Accrued Provident Fund - 492 447
- Accrued PAYE - 319 851
- Accrued 13th Cheque 1 094 348 726 313
- Accrued Medical Aid - 361 384
- Accrued Workmen’s Compensation 926 695 570 636
- Accrued Employee Insurance - 132 275
- Accrued leave pay 2 371 488 2 807 054
8 539 773 9 621 879
The average credit period on purchases of goods is 30 days. No interest is charged on the trade payables for the first 60 days from the date of the invoice. Thereafter, interest is charged at 2% on the overdue amount.
PAGE
84

10. PROVISIONS 2013 2012
ZAR ZAR
Employee Cost : Performance bonuses - -
- -
11. REVENUE 2013 Restated 2012
ZAR ZAR
Revenue comprises of passenger fares and special hire revenue.
An analysis of the Entity’s revenue is as follows:
Passenger fares 22 938 848 19 540 277
Special hire 4 273 781 3 747 433
Contract Hire 464 880 450 848
Total revenue 27 677 509 23 287 710
A major portion of the Corporation’s revenue comprises cash sales to passengers. It should be recognised that controls are designed to provide reasonable, but not absolute assurance that errors and irregularities will not occur, and that procedures are performed in accordance with management’s intentions. There are inherent limitations that should be recognised in considering the potential effectiveness of any system of internal controls. The Corporation utilises the sole service provider in South Africa to record bus fare information. There are no unreconciled differences between banking of cash and revenue collected per the revenue application system.
12. LOSS FROM OPERATIONS 12.1 Loss from operations has been arrived at after charging (crediting): 2013 2012
ZAR ZAR
INCOME
Interest income 67 583 123 481
EXPENSES
Audit fees 2 724 502 2 693 371
Audit Committee (see note 12.2) 58 108 40 002
Defined contribution plan 4 479 636 4 062 128
Directors Emoluments (see note 12.3) 428 681 442 399
Depreciation 14 947 105 11 614 771
Insurance 1 195 347 1 441 560
Interest - Discounting - 318 679
Loss on impairement of PPE 181 453 994 743
Loss on scrapping of PPE 1 033 663 358 284
Loss on disposal of PPE 296 273 6 102
Inventory impairment reversed (39 807) -
Finance lease charges 1 684 551 1 114 489
Consulting fees 211 305 340 665
Staff Costs 46 506 195 41 314 771
The number of permanent employees for the financial year ended was: 209 196
12.2 AUDIT COMMITTEE 2012Meetings Travel Total
Fees for attending meetings ZAR ZAR ZAR
J. Mdeni - Chairperson 22 143 7 044 29 187
T. Jama 16 524 1 107 17 631
R. Luzuka 11 016 274 11 290
49 683 8 426 58 108
PAGE
85

12.3 DIRECTORS EMOLUMENTS 2013
Meetings Allowance Travel Total
ZAR ZAR ZAR ZAR
P.L.C. Maseti - Chairperson 76 713 12 000 2 181 90 894
S.J. Nyengane - Vice-chairperson 76 368 - 3 587 79 955
P.P. Balfour 14 770 - 885 15 655
A.S. Mandla 15 770 - - 15 770
S.G. Gomba 8 762 - 245 9 007
A.M. Church 37 302 - 1 626 38 928
N.E.P. Loyilane 41 556 - 2 140 43 696
J. Mdeni 22 032 - 7 001 29 033
R. Luzuka 79 679 - 3 051 82 730
M Vaaiboom 21 278 - 1 734 23 012
394 230 12 000 22 450 428 680
Directors Emoluments 2012
Meetings Travel Total
ZAR ZAR ZAR
P.L.C. Maseti - Chairperson 86 634 2 079 88 713
S.J. Nyengane - Vice-chairperson 84 745 4 228 88 973
P.P. Balfour 12 516 467 12 983
M. Tuswa - - -
A.J. De Vries - - -
T.A.Thomas 7 425 689 8 114
F.S. Loliwe 16 762 2 278 19 040
A.M. Church 46 785 1 772 48 557
N.E.P. Loyilane 36 965 3 366 40 331
N. Shweni-Booysen 42 653 2 226 44 879
Z. Pakati 24 270 1 101 25 371
J. Mdeni 8 131 2 763 10 894
R. Luzuka 51 718 2 826 54 544
418 604 23 796 442 400
PAGE
86

12.4 SENIOR MANAGEMENT 2013
CEO OSM CFO HOD: HR HOD: Operations HOD: Engineering
L.R. Mbinda N. Van Wyk L. Coetzer L.C. Mtise N. Leni Z. Leni
ZAR ZAR ZAR ZAR ZAR ZAR
Basic 1 097 355 997 977 219 729 615 345 634 145 570 995
Car 120 000 - 12 000 64 548 49 062 49 812
Housing allowance - - - 17 563 - -
Cellphone allowance
32 259 5 139 - 4 147 - -
Leave paid out 97 280 - - - - -
Medical aid 52 151 - 7 366 - 11 260 22 793
Provident 177 772 - - 107 993 111 292 100 210
Study Assistance - 56 940 - - - -
Performance Bonus
217 092 - - - - -
13th cheque - 55 429 36 552 51 279 48 801 47 619
13th cheque Accrual
- 20 786 - 25 639 16 267 15 873
UIF 1 641 1 641 624 1 641 1 790 1 641
Total 1 795 550 1 137 912 276 271 888 156 872 616 808 943
12.5 SENIOR MANAGEMENT 2012
CEO OSM CFO HOD: HR HOD: Operations HOD: Engineering
L.R. Mbinda N. Van Wyk L. Coetzer L.C. Mtise N. Funani Z. Leni
ZAR ZAR ZAR ZAR ZAR ZAR
Basic 915 584 1 000 800 655 303 571 982 539 880 533 428
Car 120 000 - 36 000 64 548 45 288 49 812
Housing allowance - - - 17 563 - -
Cellphone allowance
20 428 - - - 2 378 3 679
Leave paid out - - - - - -
Medical aid 46 562 - 20 815 - 9 496 20 945
Provident 148 325 - - 100 415 94 618 93 479
13th cheque - - 51 178 47 568 45 420 44 307
13th cheque Accrual
171 501 21 000 22 754 23 833 14 997 14 817
UIF 1 497 1 497 1 497 1 497 1 497 1 497
Total 1 423 898 1 023 297 787 547 827 406 753 574 761 964
PAGE
87

13. IRREGULAR EXPENDITURE 2013 2012
ZAR ZAR
Reconciliation of irregular expenditure
Opening balance 4 178 971 -
Add: Irregular expenditure - relating to prior year - -
Add: Irregular expenditure - relating to current year
232 905 4 178 971
Less: Amounts condoned - -
Less: Amounts recoverable (not condoned) - -
Less: Amounts not recoverable (not condoned) - -
Less: Irregular expenditure awaiting condonation
(4 411 876) -
- 4 178 971
Analysis of awaiting condonation per age classification
Current year 232 905 4 178 971
Prior years 4 178 971 -
Total 4 411 876 4 178 971
2012
Details of irregular expenditure - prior year ZAR
Incident Disciplinary steps taken/criminal proceedings
Non-compliance with SCM procedures The Logistics Officer was dismissed and the HOD: SCM subsequently resigned after receiving a Notice of Disciplinary Enquiry.
4 178 971
4 178 971
2013
Details of irregular expenditure - current year ZAR
Incident Disciplinary steps taken/criminal proceedings
Non-compliance with SCM procedures: Less than 3 quotations
Still under inquiry 83 213
Non-compliance with SCM procedures: No valid tax clearance certificate
Still under inquiry 149 692
232 905
Details of irregular expenditure awaiting condonation ZAR
Incident Awaiting to be condoned by (condoning authority)
Non-compliance with SCM procedures Accounting authority 4 178 971
Non-compliance with SCM procedures: Less than 3 quotations
Accounting authority 83 213
Non-compliance with SCM procedures: No valid tax clearance certificate
Accounting authority 149 692
4 411 876
PAGE
88

14. FRUITLESS AND WASTEFUL EXPENDITURE 2013 Restated 2012
ZAR ZAR
Reconciliation of fruitless and wasteful expenditure
Opening balance 158 516 -
Fruitless and wasteful expenditure – relating to prior year
- -
Fruitless and wasteful expenditure – relating to current year
24 565 158 516
Less: Amounts condoned - -
Less: Amounts transferred to receivables for recovery
(183 081) -
Fruitless and wasteful expenditure awaiting condonement
- -
Closing Balance - 158 516
2013
Analysis of Current Year’s Fruitless and wasteful expenditure
ZAR
Incident Disciplinary steps taken/criminal proceedings
Non-compliance with Cell phone Policy: Cell phone limit exceed in 2012
Acknowledgement of Debt forms have been issued to the employees.
158 516
Non-compliance with Cell phone Policy: Cell phone limit exceed in 2013
Acknowledgement of Debt forms have been issued to the employees.
24 565
Total 183 081
15. CASH GENERATED BY OPERATIONS FROM/(USED IN) OPERATING ACTIVITIES 2013 Restated 2012
R R
Net loss for the year (2 970 318) (18 690 196)
Adjustments for:
Loss on sale of property, plant and equipment 296 273 6 102
Impairment loss 181 453 994 743
Assets written off 1 010 820 358 284
Inventory impairment reversed (39 807) -
Depreciation of property, plant and equipment 10 504 811 17 693 775
2 170 275
Interest on finance leases 1 684 551 904 668
Interest income (67 583) (123 481)
Operating cash flow before movements in working capital 12 770 476 1 143 895
(Increase) / (Decrease) in inventories (3 610 701) 604 792
(Increase) / (Decrease) in receivables (604 467) 157 291
(Increase) / (Decrease) in payables (622 786) 2 803 336
7 932 521 4 709 314
NOTESto the cash flowstatement
PAGE
89

16 FINANCIAL RISK MANAGEMENT OBJECTIVES AND POLICIES
The Corporation’s principal financial liabilities comprise of trade and other payables. The main purpose of these financial liabilities is to recognise amounts payable by the Corporation. The Corporation has various financial assets such as trade and other receivables and cash and short-term deposits, which arise directly from its operations.
The Corporation has no significant concentration of credit risk, with exposure spread over a large number of counterparties and customers.
The main risks arising from the Corporation’s financial instruments are cash flow interest rate risk, liquidity risk and credit risk. The Board of Directors reviews and agrees policies for managing each of these risks which are
summarised below.
Interest rate risk The Corporation is exposed to interest rate risk as it has bus lease agreements in place. As a result, the term of the
lease agreements are for a period of three years.
Credit risk management The Corporation trades only with recognised, creditworthy third parties. Receivable balances are monitored on an
ongoing basis with the result that the Corporation’s exposure to bad debts is not significant. The maximum exposure is the carrying amount as disclosed in Note 5. There are no significant concentrations of credit risk within the Corporation.
With respect to credit risk arising from the other financial assets of the Corporation, which comprise of cash and short-term deposits, the Corporation’s exposure to credit risk arises from default of the counterparty, with a maximum exposure equal to the carrying amount of these instruments.
Liquidity risk The Corporation monitors its risk to a shortage of funds by considering the maturity of both its financial assets and
projected cash flows from operations. The Corporation’s objective is to maintain a balance between continuity of funding and flexibility through use of of the grant-in-aid funding.
Foreign currency risk The Corporation is not exposed to foreign currency risk.
Capital management The primary objective of the Corporation’s capital management is to ensure that it continue to provide a safe and
reliable public transport service and to maximise internal revenue collection. In addition the corporation manages its capital to ensure that the entity will continue as a going concern. Budgets and financial forecasts are prepared and reviewed by the accounting authority and disclosed to the Provincial Department of Transport and the Eastern Cape Provincial Treasury for funding purposes.
17. CONTINGENT LIABILITIES
During the reporting period, there were matters arising that gives rise to contingent liabilities:The Corporation is in the process of obtaining a title deed for the Zwelitsha depot. A historic land valuation was performed which was used for negotiation purposes to draft and sign a settlement agreement. In addition, the land was surveyed to assess the exact boundaries. At year-end, the Corporation is awaiting correspondance from the Land Claims Commission to purchase the land. The possible cost element of the outright acquisition (title deed) of the land is uncertain.
There are three Labour dispute cases as at 31 March 2013 and there are currently no indication as to the probability of the success of the claim
Anticipated legal fess
Estimated claim Nature Reffered to Total Contigent liability
Mayibuye Vs Qamarana 150 000 150 000 Labour dispute Labour Court 300 000
Mayibuye Vs Pakati 30 000 120 978 Labour dispute Labour Court 150 978
Mayibuye Vs Lusiba - 43 426 Labour dispute CCMA 43 426
180 000 314 404 494 404
PAGE
90

18. COMMITMENTS 2013 2012
ZAR ZAR
Commitments
Commitments for operating expenditure ordered, but no delivery has taken place at thereporting date. 191 975
-
19. SUBSEQUENT EVENTS
The corporation has during the month of May 2013 took ownership of five buses which were previously on lease from MAN financial services. The initial cost of the buses amounted to R 7 641 080.29
20. RELATED PARTY TRANSACTIONS
20.1 Identification of related parties
Eastern Cape Department of Transport. The Department is the sole shareholder of the Corporation and the Corporation acts as the service delivery arm of the the Department. The Department provides the grant-in-aid and the Corporation report on its activities.
Board of Directors - Refer to note 12.3 for details of transactions with directors. The Board is appointed by the Executive Authority and fulfil a governance and oversight role.
Key management personnel - Refer to note 12.4 for detail of transactions with key personnel. Management is responsible for the day-to-day operations of the Corporation.
20.2 RELATED PARTY TRANSACTIONS Significant transactions occurred between the Department of Transport by way ofreceiving grant funding. 2013 2012
ZAR ZAR
Grant in aid received 63 773 000 51 429 000
Capital grant received 5 000 000 10 000 000
68 773 000 61 429 000
PAGE
91

21. GOING CONCERN
“We draw attention to the fact that at 31 March 2013, the Corporation had an accumulated deficit of R91 322 969 (Restated 2012: R82 360 224).”
The financial statements have been prepared on the basis of accounting policies applicable to a going concern. This basis presumes that funds will be available to finance future operations and that the realisation of assets and settlement of liabilities, contingent obligations and commitments will occur in the ordinary course of business.
The ability of the Corporation to
continue as a going concern is dependent on a number of factors. The most significant of these is that the directors continue to procure funding for the ongoing operations of the Corporation by recapitalisation of the bus fleet in order to increase revenues, as well as negotiations and pro-active budgeting and communication thereof to the Department of Transport, in an effort to obtain additional funding in the
form of unconditional grants.The Department of Transport has approved a grant-in-aid of R74 088 000 for the 2013/14 financial year and R85 000 000 in the 2014/15 financial year.
The Corporation present valued its own-revenue stream to be R91 157 000 over the next three financial years.
PAGE
92

2012I 13
PAGE
93

05HRMANAGEMENTREPORT
PAGE
94

STRATEGIC GOALGuided by the ethos of service & commitment to the maintenance of best bus company standards, the division strives to render an effective and equitable service to all MTC employees. To lend support to the Human Resources and Business Development Strategy by recruiting outstanding candidates that will add value to the organization thereby leading to the realization of the Corporation’s vision.
To achieve the aforementioned vision, we embrace the following core values:
PERSONNEL EXPENDITURE BY PROGRAMME, 2012/2013
ProgrammeTotal
ExpenditurePersonnel
ExpenditureTraining
Expenditure
Professionaland Special
ServicesExpenditure
Personnel Expenditure
as a % of total expenditure
Number ofEmployees
AveragePersonnel
Cost perEmployee
Office of the CEO 2 053 241 2 020 879 9 198 23 164 4% 2 1 026 621
Office of Strategic Management
3 255 434 3 182 707 32 191 40 536 7% 10 325 543
Finance 8 350 848 8 204 366 82 782 63 700 18% 27 309 291
Human Resources 4 004 145 3 887 474 41 391 75 280 9% 40 100 104
Engineering 13 022 002 12 730 551 128 773 162 678 28% 67 194 358
Operations 15 820 525 15 450 432 156 367 213 726 34% 73 216 720
TOTAL AS PER AFS 46 506 195 45 476 409 450 702 579 084 100% 219 212 357
PERSONNEL COSTS BY SALARY BANDS, 2012/2013
Salary BandPersonnel
Expenditure% of Total
Personnel CostNumber ofEmployees
AveragePersonnel Cost
per Employee
Bargaining Unit (T2-T10) 32 125 757 69 187 171 795
Assistant Management (T11) 3 730 331 8 13 286 949
Deputy Management (T12) 974 688 2 3 324 896
Management (T13-T15) 3 119 832 7 8 389 979
Senior Management (T16-T17) 890 181 2 2 445 091
Executive Management (T18-T19) 3 916 932 8 5 783 386
Top Management (T20-T22) 1 748 474 4 1 1 748 474
TOTAL AS PER AFS 46 506 195 100 219 212357
REPORT BY THEEXECUTIVEMANAGERHuman Resources
EXPENDITURE
• Superior Performance - driven by the quest for continuous improvement and excellence in rendering HR services (Industrial Relations, Training & Development Personnel & Organizational Development), as well as compliance with all relevant pieces of legislation.
• Being Proactive - work towards exceeding our customers’ expectations by proactively assessing and addressing
their current and future needs.
• Ethical Business Practices - we will continually uphold strong business ethics and values, and ensure the transfer of these to our internal employees.
We will further see to the development of sound human resources policies and procedures, serve as a custodian of these policies by ensuring compliance and adherence to them.
PAGE
95

SALARIES, OVERTIME AND MEDICAL ASSISTANCE BY PROGRAMME, 2012/2013
ProgrammeSalaries Overtime Medical Assistance
AmountAs % of Total Expenditure
AmountAs % of Total Expenditure
AmountAs % of Total Expenditure
Office of the CEO 2 041 659 99% 0 0% 52 151 2.5%
Office of Strategic Management 3 240 602 96% 20 666 0.61% 12 769 0.38%
Finance 7 465 428 89% 74 912 0.89% 317 521 3.8%
Human Resource Management 3 499 978 87% 57 386 1.4% 470 720 11.8%
Engineering 11 745 095 90% 459 658 3.5% 855 456 6.6%
/Operations 14 096 190 89 464 238 2.9% 932 064 5.9%
TOTAL AS PER AFS 42 088 952 1076860 2.3% 2640681 5.7%
EMPLOYMENT AND VACANCIES BY PROGRAMME, 31 MARCH 2013Programme Number of Posts on
approved establishmentNumber of Posts Filled Vacancy Rate Number of Posts
filled additional to establishment
Office of the CEO 3 2 33% 0
Office of Strategic Management
10 8 20% 0
Finance 32 27 16% 0
Human Resource Management
42 42 0 0
Engineering 61 67 0 6
Operations 82 73 11% 0
TOTAL 230 219 5% 6
EMPLOYMENT AND VACANCIES BY SALARY BANDS, 31 MARCH 2013Salary Band Number of Posts on
approved establishmentNumber of Posts Filled Vacancy Rate Number of Posts
filled additional to establishment
Bargaining Unit (T2-T10) 197 188 4.6% 6
Assistant Management (T11) 13 13 0 0
Deputy Management (T12) 3 3 0 0
Management (T13-T15) 9 8 11% 0
Senior Management (T16-T17) 2 2 0 0
Executive Management (T18-T19)
5 4 20% 0
Top Management (T20-T22) 1 1 0 0
TOTAL 230 219 4.8% 6
EMPLOYMENT AND VACANCIES BY CRITICAL OCCUPATION, 31 MARCH 2013Critical Occupation Number of Posts on
approved establishmentNumber of Posts Filled Vacancy Rate Number of Posts filled
additional to establishment
Compliance Manager 1 0 100% 0
Chief Financial Officer 1 0 100% 0
TOTAL 2 0 100% 0
EMPLOYMENT& VACANCIES
PAGE
96

The following table summarises the number of jobs that were evaluated during the year under review.The table also provides statistics on the number of posts that were upgraded or downgraded.
JOB EVALUATION BY SALARY BAND 2012/2013
Salary Band
Number ofposts onapproved
establishment
Numberof Jobs
Evaluated
% of posts evaluated by salary bands
Posts Upgraded Posts downgraded
Number% of posts evaluated
Number% of posts evaluated
Bargaining Unit (T2-T10) 197 3 2 0 0 0 0
Assistant Management (T11)
13 4 31 1 25 0 0
Deputy Management (T12)
3 0 0 0 0 0 0
Management (T13-T15) 9 1 11 0 0 0 0
Senior Management (T16-T17)
2 1 50 0 0 0 0
Executive Management (T18-T19)
5 0 0 0 0 0 0
Top Management (T20-T22)
1 0 0 0 0 0 0
TOTAL AS PER AFS 230 9 4 1 11 0 0
PROFILE OF EMPLOYEES WHOSE POSITIONS WERE UPGRADED DUE TO THEIR POSTS BEING UPGRADEDBeneficiary African Asian Coloured White Total
Female 0 0 0 0 0
Male 1 0 0 0 0
TOTAL 1 0 0 0 0
Employees with a disability 0 0 0 0 0
The following table provides a summary of the number of employees whose positions were upgraded due to their post being upgraded. The number of employees might differ from the number of posts upgraded since not all employees are automatically absorbed into the new posts and some of the posts upgraded could also be vacant.
JOBEVALUATION
PAGE
97

The following table summarises the number of cases where remuneration bands exceeded thegrade determined by job evaluation. Reasons for the deviation are provided in each case.
EMPLOYEES WITH SALARY LEVELS HIGHER THAN THOSE DETERMINED BY JOB EVALUATION BY OCCUPATIONOccupation Number of
EmployeesJob Evaluationlevel
Remunerationlevel
Reason forDeviation
None 0 N/A N/A N/A
Total Number of Employees whose remuneration exceeded the grade determined by job evaluation in 2012/13
0 As %of TotalEmployed
0
The following table summarises the beneficiaries of the above in terms of race, gender, and disability.
PROFILE OF EMPLOYEES WHO HAVE SALARY LEVELS HIGHER THAN THOSE DETERMINED BY JOB EVALUATIONBeneficiary African Asian Coloured White Total
Female 0 0 0 0 0
Male 0 0 0 0 0
TOTAL 0 0 0 0 0
Employees with adisability
0 0 0 0 0
PAGE
98

ANNUAL TURNOVER RATES BY CRITICAL OCCUPATIONCritical Occupation Number of employees
at beginning of period-April 2012
Appointments Terminations Turnover Rate
Job Title 65 22 21 32%
Job Title 1 0 1 100%
TOTAL 66 22 22 33%
The table below identifies the major reasons why staff left the Corporation
REASONS WHY STAFF LEFT THE ENTITYTermination Type Number % of Total Resignations
Death 2 6
Resignation 7 21
Expiry of Contract 3 9
Dismissal – operational changes 0 0
Dismissal-misconduct 14 43
Dismissal – inefficiency 0 0
Discharged due to ill-health 0 0
Retirement 2 6
Other 5 15
TOTAL 33 100
This section provides information on changes in employment over the financial year. Turnover rates provide an indication of trends in the employment profile of the department. The following tables provide a summary of turnover rates by salary band and critical occupations.
Salary Band Number of employeesat beginning of period-
April 2012
Appointments Terminations Turnover Rate
Bargaining Unit (T2-T10) 188 30 31 16%
Assistant Management (T11) 13 0 0 0
Deputy Management (T12) 3 1 1 33%
Management (T13-T15) 7 2 1 14%
Senior Management (T16-T17) 0 2 0 0
Executive Management (T18-T19)
5 0 0 0
Top Management (T20-T22) 1 0 0 0
TOTAL 217 35 33 15%
STAFFMOVEMENT
PAGE
99

TOTAL NUMBER OF EMPLOYEES(including employees with disabilities) in each of the following occupational categories as at 31 March 2013
Occupationalcategory
Male FemaleTotal
African Coloured Indian White African Coloured Indian White
Legislators, senior officials and managers
3 1 0 1 1 0 0 0 6
Professionals 4 0 0 3 4 0 1 2 14
Technicians and associate professionals
28 1 0 2 4 0 0 0 35
Clerks 95 2 0 2 8 2 0 0 109
Service and sales workers 0 0 0 0 0 0 0 0 0
Skilled agriculture and fishery workers
0 0 0 0 0 0 0 0 0
Craft and related trades workers 0 0 0 0 0 0 0 0 0
Plant and machine operators and assemblers
0 0 0 0 0 0 0 0 0
Elementary occupations 38 0 0 0 17 0 0 0 55
Total 168 4 0 8 34 2 1 2 219
Employees with disabilities 2
TOTAL NUMBER OF EMPLOYEES(including employees with disabilities) in each of the following occupational categories as at 31 March 2013
Occupationalband
Male FemaleTotal
African Coloured Indian White African Coloured Indian White
Top Management( 1 0 0 0 0 0 0 0 1
Senior Management 2 1 0 1 1 0 0 0 5
Professionally qualified and experienced specialists and mid-management
4 0 0 3 4 0 1 2 14
Skilled technical and academically qualified workers, junior management, supervisors, foreman and superintendents
29 1 0 2 4 0 0 0 36
Semi-skilled and discretionary decision making
95 2 0 2 8 2 0 0 109
Unskilled and defined decision making
38 0 0 0 17 0 0 0 55
Total 168 4 0 8 34 2 1 2 219
EMPLOYMENTEQUITY
PAGE
100

PROMOTIONSOccupationalcategory
Male FemaleTotal
African Coloured Indian White African Coloured Indian White
Top Management 0 0 0 0 0 0 0 0 0
Senior Management 0 0 0 0 0 0 0 0 0
Professionally qualified and experienced specialists and mid-management
0 0 0 0 0 0 0 0 0
Skilled technical and academically qualified workers, junior management, supervisors, foreman and superintendents
1 0 0 0 0 0 0 0 1
Semi-skilled and discretionary decision making
1 0 0 0 2 0 0 0 3
Unskilled and defined decision making
1 0 0 0 0 0 0 0 1
Total 3 0 0 0 2 0 0 0 5
Employees with disabilities 0 0 0 0 0 0 0 0
RECRUITMENTOccupationalcategory
Male FemaleTotal
African Coloured Indian White African Coloured Indian White
Top Management 0 0 0 0 0 0 0 0 0
Senior Management 2 0 0 1 0 0 0 0 3
Professionally qualified and experienced specialists and mid-management
1 0 0 0 1 0 0 0 2
Skilled technical and academically qualified workers, junior management, supervisors, foreman and superintendents
0 0 0 0 0 0 0 0 0
Semi-skilled and discretionary decision making
22 0 0 1 2 0 0 0 25
Unskilled and defined decision making
5 0 0 0 0 0 0 0 5
Total 30 0 0 2 3 0 0 0 35
Employees with disabilities
PAGE
101

TERMINATIONSOccupationalcategory
Male FemaleTotal
African Coloured Indian White African Coloured Indian White
Top Management 0 0 0 0 0 0 0 0 0
Senior Management 0 0 0 0 0 0 0 1 1
Professionally qualified and experienced specialists and mid-management
3 0 0 0 0 0 1 0 4
Skilled technical and academically qualified workers, junior management, supervisors, foreman and superintendents
0 0 0 0 0 0 0 0 0
Semi-skilled and discretionary decision making
22 0 0 0 2 2 0 0 26
Unskilled and defined decision making
1 0 0 0 0 0 0 0 1
Total 26 0 0 0 2 2 1 1 32
Employees with disabilities 0 0 0 0 0 0 0 0 0
DISCIPLINARY ACTIONOccupationalcategory
Male FemaleTotal
African Coloured Indian White African Coloured Indian White
Bargaining Unit (T2-T10) 28 0 0 0 6 0 0 0 34
Assistant Management (T11) 1 0 0 0 0 0 0 0 1
Deputy Management (T12) 1 0 0 0 0 0 0 0 1
Management (T13-T15) 2 0 0 1 0 0 0 0 3
Senior Management (T16-T17) 0 0 0 0 0 0 0 0 0
Executive Management (T18-T19) 0 0 0 0 0 0 0 0 0
Top Management (T20-T22) 0 0 0 0 0 0 0 0 0
TOTAL 32 0 0 1 6 0 0 0 39
SKILLS DEVELOPMENTOccupationalcategory
Male FemaleTotal
African Coloured Indian White African Coloured Indian White
Legislators, senior officials and managers
1 0 0 0 1 0 0 1 3
Professionals 2 0 0 0 3 0 0 0 5
Technicians and associate professionals
5 0 0 0 1 0 0 0 6
Clerks 3 0 0 0 4 0 0 0 7
Service and sales workers 0 0 0 0 0 0 0 0 0
Skilled agriculture and fishery workers
0 0 0 0 0 0 0 0 0
Craft and related trades workers 0 0 0 0 0 0 0 0 0
Plant and machine operators and assemblers
13 0 0 0 15 0 0 0 28
Elementary occupations 9 0 0 0 3 0 0 0 12
Total 33 0 0 0 27 0 0 1 61
Employees with disabilities 2 0 0 0 0 0 0 0 2
PAGE
102

PERFORMANCE REWARDS BY RACE, GENDER AND DISABILITY
Race and GenderBeneficiary Profile Cost
Number ofbeneficiaries
Number ofemployees
% of total withingroup
CostZAR
Averagecost per employee
African, Male 1 1 0.6 219012 219012
Asian, Male
Coloured Male
White Male
African Female
Asian Female
Coloured Female
White Female
TOTAL 1 1 219012 219012
FOREIGN WORKERS BY SALARY BAND
Salary Band01 April 2012 31 March 2013 Change
Number % of total Number % of total Number % Change
Bargaining Unit (T2-T10) 1 100 1 100 0 0
Assistant Management (T11) 0 0 0 0 0 0
Deputy Management (T12) 0 0 0 0 0 0
Management (T13-T15) 0 0 0 0 0 0
Senior Management (T16-T17) 0 0 0 0 0 0
Executive Management (T18-T19) 0 0 0 0 0 0
Top Management (T20-T22) 0 0 0 0 0 0
TOTAL 1 100 1 100 0 0
FOREIGN WORKERS BY MAJOR OCCUPATIONMajor Occupation 01 April 2012 31 March 2013 Change
Number % of total Number % of total Number % Change
Mechanical Artisan 1 0.5% 1 0.5% 0 0
To encourage good performance, the corporation has granted the following performance rewards during the year under review. The information is presented in terms of race, gender, and disability.
PERFORMANCE REWARDS
PAGE
103

The following tables provide an indication of the use of sick leave and disability leave. In both cases, the estimated cost of the leave is also provided.
SICK LEAVE
Salary BandTotaldays
% Dayswith Medicalcertification
Number ofEmployees
using sick leave
% of totalemployees
using sick leave
Averagedays per
employee
EstimatedCost (R’000)
Bargaining Unit (T2-T10) 2353 2353 146 90.7% 16.1 1 334 104
Assistant Management (T11) 53 53 5 3.1% 10.6 50 192
Deputy Management (T12) 42 42 4 2.5% 10.5 45 035
Management (T13-T15) 44 2 3 1.9% 14.7 56 631
Senior Management (T16-T17) 3 3 1 0.6% 3 4 407
Executive Management (T18-T19) 27 27 2 1.2% 13.5 69 807
Top Management (T20-T22) 0 0 0 0% 0 0
TOTAL 2522 2480 161 100% 15.7 1 560 176
DISABILITY LEAVE (TEMPORARY AND PERMANENT)
Salary BandTotaldays
% Dayswith Medicalcertification
Number ofEmployees
using disabilityleave
% of totalemployees
usingdisability
leave
Averagedays per
employee
EstimatedCost (R’000)
Bargaining Unit (T2-T10) 0 0 0 0 0 0
Assistant Management (T11) 0 0 0 0 0 0
Deputy Management (T12) 0 0 0 0 0 0
Management (T13-T15) 0 0 0 0 0 0
Senior Management (T16-T17) 0 0 0 0 0 0
Executive Management (T18-T19) 0 0 0 0 0 0
Top Management (T20-T22) 0 0 0 0 0 0
TOTAL 0 0 0 0 0 0
LEAVE UTILISATION
The table below summarises the utilisation of annual leave.
ANNUAL LEAVESalary Band Total days taken Number of Employees
using annual leaveAverage peremployee
Bargaining Unit (T2-T10) 3945 224 18
Assistant Management (T11) 373 17 22
Deputy Management (T12) 72 4 18
Management (T13-T15) 202 8 25
Senior Management (T16-T17) 4 1 4
Executive Management (T18-T19) 88 5 18
Top Management (T20-T22) 40 1 40
TOTAL 4724 260 18
PAGE
104

The following table summarise payments made to employees as a result of leave that was not taken.
LEAVE PAY-OUTSReason Total Amount
(R’000)Number ofEmployees
Average peremployee
Leave payout for 2011/12 due to non-utilisationof leave for the previous cycle
58 219 1 58219
Capped leave payouts on termination ofservice for 2012/13
0 0 0
Current leave payout on termination of servicefor 2012/13
293 724 43 6831
Total 351 943 44 7999
STEPS TAKEN TO REDUCE THE RISK OF OCCUPATIONAL EXPOSUREUnits/categories of employees identified to be at high risk of contracting HIV & related diseases (if any)
Key steps taken to reduce the risk
Employees (x4) that are placed in the Wellness Unit and work directly with clients that require pricking at times which could result in blood spillage.
• Disposal Gloves are used for safety reasons when dealing with clients.• Medical waste is removed according to the NEMA Act National Environmental Management Act.• Sharps are disposed in approved sharp containers• Sharps containers are accessible for immediate sharps disposal• Recapping of needles is not allowed• Disinfectant is used to disinfect blood spills according to National Department of Health strength recommendations
HIV/AIDS & Health Promotion Programmes
PAGE
105

DETAILS OF HEALTH PROMOTION AND HIV/AIDS PROGRAMMES (tick the applicable boxes and provide the required information)
Question Yes No Details, if yes
1. Has the department designated a member of the SMS to implement the provisions contained in Part VI E of Chapter 1 of the Public Service Regulations, 2001? If so, provide her/his name and position.
Yes • N Tumana, Wellness Manager
2. Does the department have a dedicated unit or has it designated specific staff members to promote the health and well- being of your employees? If so, indicate the number of employees who are involved in this task and the annual budget that is available for this purpose.
Yes4 staff members Budget R631000(2013-2014 Financial year)
3. Has the department introduced an Employee Assistance or Health Promotion Programme for your employees? If so, indicate the key elements/services of this Programme.
Yes
• Alcohol and substance abuse program• Dealing with personal stress and work stress(Team building and Stress Management)• Basic Financial Management skills• Family matters
4. Has the department established (a) committee(s) as contemplated in Part VIE.5 (e) of Chapter 1 of the Public Service Regulations, 2001? If so, please provide the names of the members of the committee and the stakeholder(s) that they represent.
Yes
•The Integrated Employee Wellness Policy in its draft formoutlines who members of the committee should be ie • Board member, H.O.D. Middle Management,Peer Educators and Wellness Functionaries
5. Has the department reviewed its employment policies and practices to ensure that these do not unfairly discriminate against employees on the basis of their HIV status? If so, list the employment policies/practices so reviewed.
Yes• HIV and Aids policy being reviewed 2013• Integrated Employee Wellness Policy still in its draft form(Final Draft )
6. Has the department introduced measures to protect HIV-positive employees or those perceived to be HIV- positive from discrimination? If so, list the key elements of these measures.
Yes
• Capacity building (Awareness campaigns, Therapeutic supportive workplace • Voluntarism coupled with openness and Transparency• Equality• Accessibility• Confidentiality• Sensitivity
7. Does the department encourage its employees to undergo Voluntary Counseling and Testing? If so, list the results that you have you achieved.
Yes
•The Wellness Assistants underwent training to perform HRT (HIV Rapid test)• Mayibuye is in partnership with Bonitas Medical Aid that performs voluntary testing and counselling yearly42 employees had been tested over the year and 6 employees were found to be positive
8. Has the department developed measures/indicators to monitor & evaluate the impact of its health promotion programme? If so, list these measures/indicators.
Yes
•Quarterly reporting reviews throughInterdepartmental Forums•Client Experiences• Management Visits •Departmental visits by the office of the C.E.O.• Communication Surveys• Awareness Campaigns attendance
PAGE
106

The following table summarises the outcome of disciplinary hearings conducted within the departmentfor the year under review.
MISCONDUCT AND DISCIPLINARY HEARINGS FINALISEDOutcomes of disciplinary hearings Number % of total
Correctional counselling 0 0
Verbal warning 2 4
Written warning 6 14
Final written warning 10 22
Suspended without pay 5 12
Fine 1 2
Demotion 1 2
Dismissal 20 44
Not guilty 0 0
Case withdrawn 0 0
Total 45 100
TYPES OF MISCONDUCT ADDRESSED AT DISCIPLINARY HEARINGSType of misconduct Number % of total
Theft & fraud 7 16
Insubordination & negligence 19 42
Under the influence of alcohol 4 9
Dishonesty 4 9
Un authorised absence 5 11
Other 6 13
Total 45 100
GRIEVANCES LOGGEDNumber % of Total
Number of grievances resolved 1 100
Number of grievances not resolved 0 0
Total number of grievances lodged 1 100
DISPUTES LOGGEDNumber % of Total
Number of disputes upheld 1 25
Number of disputes dismissed 3 75
Total number of disputes lodged 4 100
LABOURRELATIONS
PAGE
107
STRIKE ACTIONSNumber % of Total
Total number of persons working days lost 0 0
Total costs working days lost 0 0
Amount (R’000) recovered as a result of no work no pay
0 0
PRECAUTIONARY SUSPENSIONSNumber of people suspended 0
Number of people who’s suspension exceeded 30 days 0
Average number of days suspended 0
Cost (R’000) of suspension 0
This section highlights the efforts of the entity with regard to skills development.
TRAINING NEEDS IDENTIFIED
OccupationalCategory Gender
Number ofemployees asat 1 April 2012
Training needs identified at start of thereporting period
Learnerships
SkillsProgrammes& other short
courses
Otherforms of training
Total
Legislators, senior officials and managers
Female 5 0 1 0 1
Male 10 0 2 0 2
Professionals Female 3 0 1 0 1
Male 0 0 0 0 0
Technicians and associate professionals
Female 2 0 1 0 1
Male 2 0 1 0 1
Clerks Female 12 0 16 0 16
Male 7 0 6 0 6
Service and sales workers Female 12 0 3 0 3
Male 24 0 19 0 19
Skilled agriculture and fishery workers
Female 0 0 0 0 0
Male 0 0 0 0 0
Craft and related trades workers Female 1 0 0 0 0
Male 34 0 13 0 13
Plant and machine operators and assemblers
Female 5 0 2 0 2
Male 54 0 38 0 38
Elementary occupations Female 2 0 1 0 1
Male 39 0 17 0 17
Sub Total Female 42 0 25 0 25
Male 170 0 96 0 96
Total 212 0 121 0 121
SKILLS DEVELOPMENT
PAGE
108

TRAINING PROVIDED FOR THE PERIOD
OccupationalCategory Gender
Number ofemployees as at
1 April 2012
Training provided within the reporting period
Learnerships
SkillsProgrammes& other short
courses
Otherforms of training
Total
Legislators, senior officials and managers
Female 5 0 3 0 3
Male 10 0 1 0 1
Professionals Female 3 0 2 0 2
Male 0 0 0 0 0
Technicians and associate professionals
Female 2 0 2 0 2
Male 2 0 2 2 4
Clerks Female 12 2 30 0 32
Male 7 1 8 0 9
Service and sales workers Female 12 0 5 0 5
Male 24 0 35 0 35
Skilled agriculture and fishery workers
Female 0 0 0 0 0
Male 0 0 0 0 0
Craft and related trades workers Female 1 0 0 0 0
Male 34 0 16 0 16
Plant and machine operatorsand assemblers
Female 5 0 6 0 6
Male 54 0 78 0 78
Elementary occupations Female 2 0 1 0 1
Male 39 0 21 0 21
Sub Total Female 42 2 49 0 51
Male 120 1 161 2 164
TOTAL 212 3 210 2 215
The following tables provide basic information on injury on duty.
INJURY ON DUTYNature of injury on duty Number % of total
Required basic medical attention only 15 100
Temporary Total Disablement 0 0
Permanent Disablement 0 0
Fatal 0 0
Total 15 100
INJURY ONDUTY
PAGE
109

REPORT ON CONSULTANT APPOINTMENTS USING APPROPRIATED FUNDSProject Title Total Number of consultants
that worked on projectDurationWork days
Contract value inRand
Job Evaluation 1 3 24710
TOTAL 24710
ANALYSIS OF CONSULTANT APPOINTMENTS Using appropriated funds, in terms of Historically Disadvantaged Individuals (HDIs)
Project Title Percentage ownership byHDI groups
Percentage managementby HDI groups
Number of Consultantsfrom HDI groups that work onthe project
Job Evaluation 0 0 0
TOTAL 0 0 0
UTILISATION OF CONSULTANTS
PAGE
110


CORPORATE HEADQUARTERS
Corner of Drummond and Mdantsane Access RoadReeston, East London
Postal AddressP.O. Box 19596, Tecoma5214, East LondonProvince of the Eastern Cape
Phone 043.745.2582, Fax 043.745.2586www.mayibuyetransport.co.za
MAYIBUYETRANSPORTCORPORATIONAnnual Report2012/13
ARLINE COETZEESenior Manager: Strategic Planning and Corporate PerformanceEmail: [email protected]
CHARON CRONJEBoard Secretary and Personal Assistant to the CEOEmail: [email protected]
To obtain additional information and/or copies of this document, please contact:
DISCLAIMER
The following document is made only to, and is directed only at, persons to whom such a document may lawfully be communicated (“relevant persons”). Any person who is not a relevant person should not act or rely on this document or any of its contents.
This document contains forward-looking statements that are subject to risks and uncertainties, including statements about Mayibuye Transport Corporation’s beliefs and expectations.
These forward-looking statements are based on assumptions that Mayibuye Transport Corporation has made in light of its experience in the industry in which
it operates, as well as its perceptions of historical trends, current conditions, expected future developments and other factors which Mayibuye Transport Corporation believes are appropriate under the circumstances. Relevant persons should understand that these statements are not guarantees of future performance or results.
Due to these factors, Mayibuye Transport Corporation cautions that relevant persons should not place undue reliance on any forward-looking statements. Further, any forward-looking statement speaks only as of the date on which it is made. New risks and uncertainties arise from time-to time, and it is impossible to predict these events or how they may affect Mayibuye Transport Corporation.