Embed Size (px)
Citation preview

This Provisional PDF corresponds to the article as it appeared upon acceptance. Fully formattedPDF and full text (HTML) versions will be made available soon.
OPTIMAS-DW: A comprehensive transcriptomics, metabolomics, ionomics,proteomics and phenomics data resource for maize
BMC Plant Biology 2012, 12:245 doi:10.1186/1471-2229-12-245
Christian Colmsee ([email protected])Martin Mascher ([email protected])
Tobias Czauderna ([email protected])Anja Hartmann ([email protected])
Urte Schlüter ([email protected])Nina Zellerhoff ([email protected])
Jessica Schmitz ([email protected])Andrea Bräutigam ([email protected])
Thea R. Pick ([email protected])Philipp Alter ([email protected])
Manfred Gahrtz ([email protected])Sandra Witt ([email protected])
Alisdair R. Fernie ([email protected])Frederik Börnke ([email protected])
Holger Fahnenstich ([email protected])Marcel Bucher ([email protected])
Thomas Dresselhaus ([email protected])Andreas P.M. Weber ([email protected])
Falk Schreiber ([email protected])Uwe Scholz ([email protected])
Uwe Sonnewald ([email protected])
ISSN 1471-2229
Article type Database
Submission date 14 September 2012
Acceptance date 12 December 2012
Publication date 29 December 2012
Article URL http://www.biomedcentral.com/1471-2229/12/245
Like all articles in BMC journals, this peer-reviewed article can be downloaded, printed and
BMC Plant Biology
© 2012 Colmsee et al.This is an open access article distributed under the terms of the Creative Commons Attribution License (http://creativecommons.org/licenses/by/2.0),
which permits unrestricted use, distribution, and reproduction in any medium, provided the original work is properly cited.

distributed freely for any purposes (see copyright notice below).
Articles in BMC journals are listed in PubMed and archived at PubMed Central.
For information about publishing your research in BMC journals or any BioMed Central journal, go to
http://www.biomedcentral.com/info/authors/
BMC Plant Biology
© 2012 Colmsee et al.This is an open access article distributed under the terms of the Creative Commons Attribution License (http://creativecommons.org/licenses/by/2.0),
which permits unrestricted use, distribution, and reproduction in any medium, provided the original work is properly cited.

OPTIMAS-DW: A comprehensive transcriptomics,metabolomics, ionomics, proteomics andphenomics data resource for maize
Christian Colmsee1
Email: [email protected]
Martin Mascher1
Email: [email protected]
Tobias Czauderna1
Email: [email protected]
Anja Hartmann1
Email: [email protected]
Urte Schlüter2
Email: [email protected]
Nina Zellerhoff3
Email: [email protected]
Jessica Schmitz3
Email: [email protected]
Andrea Bräutigam4
Email: [email protected]
Thea R. Pick4,5
Email: [email protected]
Philipp Alter6
Email: [email protected]
Manfred Gahrtz6
Email: [email protected]
Sandra Witt7
Email: [email protected]
Alisdair R. Fernie7
Email: [email protected]
Frederik Börnke2
Email: [email protected]
Holger Fahnenstich8
Email: [email protected]

Marcel Bucher3
Email: [email protected]
Thomas Dresselhaus6
Email: [email protected]
Andreas P.M. Weber4
Email: [email protected]
Falk Schreiber1,9
Email: [email protected]
Uwe Scholz1
∗Corresponding authorEmail: [email protected]
Uwe Sonnewald2
Email: [email protected]
1Leibniz Institute of Plant Genetics and Crop Plant Research (IPK), Corrensstr. 3, 06466 StadtSeeland, OT Gatersleben, Germany
2Department of Biology, Friedrich-Alexander University of Erlangen-Nuremberg, Staudtstr. 5,91054 Erlangen, Germany
3University of Cologne, Botanical Institute, Albertus-Magnus-Platz, 50923 Köln, Germany
4Plant Biochemistry, Heinrich-Heine-University, Universitätsstr. 1, 40225 Düsseldorf, Germany
5International Graduate Program for Plant Science (iGrad-plant), Heinrich Heine UniversityDüsseldorf, 40225 Düsseldorf, Germany
6Cell Biology and Plant Biochemistry, University of Regensburg, Universitätsstr. 31, 93040Regensburg, Germany
7Department of Molecular Physiology, Max Planck Institute of Molecular Plant Physiology, AmMühlenberg 1, 14476 Potsdam-Golm, Germany
8metanomics GmbH, Tegeler Weg 33, 10589 Berlin, Germany
9Martin Luther University Halle-Wittenberg, Institute of Computer Science,Von-Seckendorff-Platz 1, 06120 Halle, Germany
Abstract
Background
Maize is a major crop plant, grown for human and animal nutrition, as well as a renewable resource forbioenergy. When looking at the problems of limited fossil fuels, the growth of the world’s population or theworld’s climate change, it is important to find ways to increase the yield and biomass of maize and to studyhow it reacts to specific abiotic and biotic stress situations. Within the OPTIMAS systems biology projectmaize plants were grown under a large set of controlled stress conditions, phenotypically characterised andplant material was harvested to analyse the effect of specific environmental conditions or developmentalstages. Transcriptomic, metabolomic, ionomic and proteomic parameters were measured from the same plantmaterial allowing the comparison of results across different omics domains. A data warehouse was developedto store experimental data as well as analysis results of the performed experiments.
Description
The OPTIMAS Data Warehouse (OPTIMAS-DW) is a comprehensive data collection for maize and integratesdata from different data domains such as transcriptomics, metabolomics, ionomics, proteomics andphenomics. Within the OPTIMAS project, a 44K oligo chip was designed and annotated to describe thefunctions of the selected unigenes. Several treatment- and plant growth stage experiments were performed andmeasured data were filled into data templates and imported into the data warehouse by a Java based importtool. A web interface allows users to browse through all stored experiment data in OPTIMAS-DW includingall data domains. Furthermore, the user can filter the data to extract information of particular interest. All datacan be exported into different file formats for further data analysis and visualisation. The data analysisintegrates data from different data domains and enables the user to find answers to different systems biologyquestions. Finally, maize specific pathway information is provided.
Conclusions
With OPTIMAS-DW a data warehouse for maize was established, which is able to handle different datadomains, comprises several analysis results that will support researchers within their work and supportssystems biological research in particular. The system is available athttp://www.optimas-bioenergy.org/optimas_dw.
Keywords
Maize, Zea mays, Database, WGCNA, Biomass, Yield, Data integration, Transcriptomics, Metabolomics,Phenomics
Background
Maize is a major crop plant, grown for human and animal nutrition, as well as a renewable resource forbioenergy. Considering that fossil fuels are limited, it is clear that there must be alternative ways of production.Biofuel might be such an alternative. When looking at the large increase of the world’s population it is alsoobvious that more people need to be provided with food, but in contrast there is less arable land available. Theworld’s climate change causes more extreme weather conditions all over the world, which means that plants mustbe more resistant to such conditions. Therefore, it is important to find ways to increase the yield and biomass inmaize plants and to study how maize plants react within specific abiotic and biotic stress situations. TheOPTIMAS project (OPTImisation of bioMASs in maize) was started in 2009 to find answers to the question ofyield and biomass increase and furthermore to obtain useful insights into the distribution of plant resourcesbetween vegetative biomass and corn yield (http://www.optimas-bioenergy.org/).
The rapid improvement of analytical methods now enables to extend systems biology approaches directly forcrop plant systems. During the project maize plants were grown under a large set of controlled stress conditions,characterised phenotypically, and plant material was harvested to analyse the effect of specific environmentalconditions (e.g. cold, drought or nutrient stress) or developmental (e.g. flowering, leaf gradient dependent growthstage) stages. It was anticipated that the collected measurement data of transcriptomics, metabolomics, ionomics,and proteomics from the same plant materialwould facilitate the comparison of results on different omicsdomains. A better understanding of metabolic events underlying phenotypic changes will allow to furtheroptimise maize breeding and cultivation for its multiple purposes as food, feed and bioenergy source. A centralgoal was to store the collected data in a database and to find a concept to link these data from the differentdomains and finally to provide access to all collected data and analysis results to the users.
There are already several maize databases available such as MaizeGDB [1] and Panzea [2]. MaizeGDB is adatabase for storing and curating genetics and genomics related data of maize. It serves also as a communityplatform comprising maize references and information about persons and organisations. Panzea is a databasedealing with molecular and functional diversity in the maize genome. The database includes genotypic,phenotypic and polymorphism data.

Here OPTIMAS-DW, a comprehensive data warehouse containing large amounts of integrated maize-specificdata from five domains is presented. A data warehouse is a database which enables a user to integrate andanalyse data from different data domains. This includes transcriptomic, metabolomic, proteomic, ionomic andphenomic data as well as metabolic pathways. So far there exists no other database allowing to store data of allthese data domains. OPTIMAS-DW is a public information resource which provides researchers with a largecollection of data for their own research. This paper describes the structure and usage of OPTIMAS-DW.
Construction and content
Database introduction
OPTIMAS-DW is accessible via a web application. This allows the user to get access to all data collected withinthe OPTIMAS project. It is based on ORACLE Application Express (APEX) technology. The web interface is atwo level tab system including more than 60 pages to present the content of OPTIMAS-DW. The data itself arestored in an ORACLE database. The database schema comprises around 60 tables to store the raw data as well asmeta information and analysis results. The challenge of storing the data is the existence of different data domainswhich have to be linked. Here we could used experiences made in previous projects [3]. In our method, thedatabase schema includes metadata describing the experiments. Each measurement value can be connected to aspecific sample which has specific characteristics such as genotype, plant growth stage, treatment or plantanatomy. An example of the concept is given in Figure 1. In Additional file 1 an excerpt of the OPTIMASdatabase schema is shown. It illustrates how the concept is realised inside the database. The key table ist103_measurement_value, where the data domain specific schema is connected to the metadata schema. All datadomain schemas currently available in OPTIMAS-DW are included into the file to illustrate that the systemcould be enhanced by different kind of data domains.
Figure 1 OPTIMAS Metadata Concept Example. Data from different data domains are linked throughmetadata. The concept enables a user to get data from different data domains with specific characteristics of anexperiment. In this example the metadata contains a sample of the nitrogen stress experiment. The measurementvalues are linked to these metadata. With this approach the user can for example extract the information, that inlamina leaf 6 of sample highN2_B4 a fresh weight of 6.8 g was measured
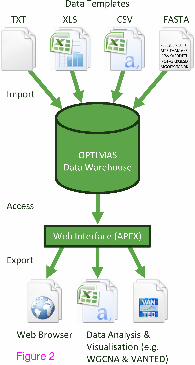
The general pipeline of OPTIMAS-DW for import, storage and retrieval of OPTIMAS data is illustrated in Figure2. Depending on the data domain the information is provided in different formats. Sequence data is provided infasta format. Transcriptomic data is available in formated text files. Metabolomic, ionomic, proteomic andphenomic data are provided using an Microsoft Excel based template. Additionally, metadata are providedwithin this template including the specific characteristics mentioned before to describe each biological entitywithin an experiment. Furthermore, information about the array code and a sample name is provided to connectthe data to the related transcript data. The data are imported into the database by an import tool developed withthe Java programming language. During the import procedure the vocabulary used, is checked as well as thecorrectness of datatypes to ensure that only valid data are imported into the OPTIMAS data warehouse.
Figure 2 OPTIMAS Data Pipeline. Experimental data are collected with different templates which areimported by a Java based import tool into the OPTIMAS Data Warehouse. Using a web interface the data can beexported for further data analysis (e.g. with WGCNA [6]) and visualisation (e.g. with VANTED [4])
The web application itself enables the user to browse, search, filter and download stored data. OPTIMAS-DWsupports two ways of data export: (a) the export to a tab delimited file comprising all data selected by the user(e.g. data filtered for a specific treatment or a timepoint) and (b) the export into a special format for data analysisand visualisation in VANTED [4], a tool for the Visualisation and Analysis of Networks containing ExperimentalData. The export tool is a Java Web Start application where the user selects the file format and a target directorywhere the file will be stored. Using VANTED the user is able to map the experimental data from the OPTIMASdata warehouse onto maize specific pathways stored in MetaCrop [5], a manually curated repository comprising

high quality data about crop plant metabolism. The pathways can also be accessed through the web interface ofOPTIMAS-DW. Therefore the MetaCrop database schema provides the relevant information to link the webinterface of OPTIMAS-DW directly to the specific pathways in MetaCrop. Besides using VANTED, the data canalso be analysed with other tools, such as an R package called WGCNA (Weighted Gene Correlation NetworkAnalysis) [6]. WGCNA is a widely used tool [7–9], allowing the user to find interesting genes responsible forhigh biomass production in maize plants. The results of these analyses can be accessed through the webinterface. Beside the WGCNA analysis results, GeneSpring (version GX11) analysis results are available as well.
Array design
Within the OPTIMAS project a 44K Agilent oligo chip was designed to perform different gene expressionanalyses. Based on experiences from previous works with the POCI array (Potato Oligo Chip Initiative) [10], thedatabase schema from this project was adapted for the OPTIMAS oligo chip. Therefore at the start of the projectthe newest available maize genome version 3b.50 (http://maizesequence.org) was used to select the unigenes forthe oligo chip. BLAST [11] analyses provided information about redundancies within the dataset. To overcomethe redundancies a MIRA [12] assembly (Mimicking Intelligent Read Assembly) was performed. Furthermore,17,723 contigs and 16,881 singletons were selected as unigenes, and four additional sequences, special candidategenes from project partners, which were not present in the selected unigenes, were added. To achieve a numberof 42,000 unigenes, 7,392 EST sequences from NCBI maize unigenes, which had no hit on the predicted maizegenes, were selected additionally. The eArray-software from Agilent (http://www.genomics.agilent.com)computed a number of 41,780 60-mer oligos from the unigenes, which can be browsed and downloaded atOPTIMAS-DW. When the maize genome was published in November 2009 [13], the quality of the 44K chipwas analysed in comparison to the maize genome version 4a.53. It was discovered, that 52,040 of the 53,764gene models got a hit in the OPTIMAS unigene set. Therefore, it was decided to generate a mapping from theOPTIMAS identifiers to the 4a.53 version of the maize genome. Beside the availabilty in OPTIMAS-DW thechip data is published in GEO [14] and is available online(http://www.ncbi.nlm.nih.gov/geo/query/acc.cgi?acc=GPL14913). As an additional service, OPTIMAS-DW provides ViroBLAST [15], which enablesusers to run a BLAST of sequences against the OPTIMAS unigene set, the maize genome (version 3b.50 and4a.53) or the NCBI maize unigene set.
Annotation
Several BLAST results are available in OPTIMAS-DW. For example, a Blast2Go [16] is supported to connectsequence data with Gene Ontology annotations [17] and Enzyme Commission numbers (EC) [18]. Therefore aBLAST of the OPTIMAS unigene set against the maize genome version 4a.53 and a further BLAST from themaize genome version 4a.53 to NRPEP was carried out and then mapped to the Gene Ontology terms. Acomplete list of available BLAST results is shown in Table 1. Furthermore, a mapping file to link the OPTIMASidentifiers to the gene identifiers from the maize genome version 4a.53 is provided. Additionally, a mapping viceversa from the maize genome version 4a.53 to the best hit OPTIMAS identifier enhanced by annotations fromTAIR10 [19] as well as gene ontology and KOG description based on Sorghum data [20] (sbi1.4 annotation) isprovided.
Table 1 Overview about BLAST analyses in OPTIMAS-DWBLAST Type Query Database Hit Database Entries in Hit DatabaseBLASTX Maize Genome 3b.50 NCBI non redundant 7,987,196 proteins
PeptidesBLASTN Maize Genome 3b.50 NCBI Zea mays Unigene Build 75 82,630 ESTsBLASTN Maize Genome 3b.50 EMBL fungi ESTs 2,028,363 ESTsBLASTX Maize Genome 4a.53 NCBI non redundant Peptides 7,987,196 proteins
(used for Blast2Go)BLASTX OPTIMAS Oligo Set Uniref, version 2011-09-21

Data overview
Within the OPTIMAS project several treatment and plant growth stage experiments were performed andinformation from different data domains was collected. Within the treatment experiments maize plants weregrown under specific stress conditions, such as nitrogen stress, cold stress, and drought stress to discover how theplants behave under those conditions. Studies on mycorrhizal maize lines were performed as well. The plantgrowth stage experiments include leaf gradient and flowering time analysis of maize plants. The collected datacomprise transcriptomic, metabolomic, ionomic, proteomic and phenomic data. An overview about the storedexperiments is given in Table 2.
Utility
In all experiments, data from different domains were collected and can be accessed separately through the webinterface of OPTIMAS-DW (Figure 3a). When choosing for example the transcriptomic data domain the usercan browse all experiments containing transcriptomic data (Figure 3c). The user can now consider to see genespecific data or to navigate through the whole transcriptomic dataset of an experiment. Within the other datadomains the user can proceed the same way. Metabolomic data can be filtered by a specific substance name,ionomic data can be accessed by filtering for one specific ion name, proteomic data can be filtered by a specificenzyme name and phenomic data can be filtered by a specific trait. The transcriptomic data domain additionallycomprises a gene specific view enabling the user to inspect and compare gene expressions of up to ten selectedgenes (Figure 3b). The view allows the user to filter by experiments and to determine the order of the experimentsamples.
Figure 3 OPTIMAS-DW Compilation of Screenshots. A compilation of screenshots from OPTIMAS-DW. a)Navigation comprising all data domains and functions. b) Gene specific view graph for gene expressionvisualisation. c) Overview of experiments containing transcript data. d) Browsing and filtering experimentaldata. e) Descriptions for each experiment are available
Another way to navigate through the data starts at the experiment view. Here, the user can browse allexperiments and can access the data from all domains available for a particular experiment sample. As describedin Figure 1, the metadata concept is realised within this web page. By the selection of a specific experimentsample, data from each data domain can be retreived. When using the data domain specific view instead, themetadata is also visible to the user but only domain specific data can be browsed. The domain specific viewtherefore enables the user to retrieve and analyse domain specific data while the experiment view has theadvantage to retrieve and analyse data of different domains of specific samples. For each experiment also a shortdescription is availble (Figure 3e).
One of the experiments stored in the OPTIMAS-DW is the leaf gradient experiment. Within the leaf gradientexperiment a systematic analysis of a developmental gradient of the third maize leaf was accomplished to studyorgan development as well as physiological and biochemical functions [21]. Data from different data domainswere measured and stored in the data warehouse. In detail there are transcriptomic, metabolomic, ionomic,proteomic and phenomic data available. The number of measurement values for this experiment is given in Table2. As mentioned in the background section, data were measured from the same plant material, enabling us todirectly correlate the data from different domains. In the leaf gradient experiment for example correlationsbetween transcripts and enzyme activity as well as correlations between metabolites and enzyme activity couldbe detected. In Figure 3d a report comprising a selection of transcriptomic data for the leaf gradient experimentis shown. Here the data was filtered for upregulated genes. Figure 4 illustrates an example of a data mappingwith VANTED (method described in Junker et al. [22]). Metabolomics data from the leaf gradient experimentwere mapped onto the TCA-Cycle. For each metabolite that was measured in the experiment the correspondingnode in the graph includes a line chart visualising the data. Here, the user can see the measured metaboliteconcentration in each part of the third leaf from tip (1) to base (10).

Table 2 Overview about experiments and measurements for all data domains stored in OPTIMAS-DWExperiment Transcript Metabolic Ionomic Enzyme Phenomic
Data Data Data Data DataTreatment Experiments
Cold Stress (A188 and B73) 4,010,880 28,769 1,140 - 208Drought Stress 2,005,440 39,082 - - 44(study of 2 pairs of maize inbred lines,each having one line with a goodwater-use-efficiency and one linewith a poor one)Nitrogen Stress (A188 and B73) 2,673,920 14,629 999 - 176Nitrogen Use Efficiency 1 - 61,035 - - 1,699(16 maize inbred lines)Nitrogen Use Efficiency 4 - - - - 2,312(C:N ratios of different plant parts)Mycorrhiza Compartment 2/3 501,360 7,510 438 - 108(Physiological, elemental, geneexpression and metabolite analysisof mycorrhizal maize line B73)Mycorrhiza Compartment 6/8 - - 4,654 - 1271(Screening of 27 maize lines for theirresponsiveness towards the arbuscularmycorrhiza fungi by physiological andelemental analysis)Mycorrhiza Compartment 9 - - 5,699 - 407(Analysis of 2 closely related pairsof maize lines for their physiological,elemental and metabolite profile inreaction to mycorrhiza infection.)Field Experiment 2010 - 169,991 - - 3,073(26 inbred lines grown in the field)13C Disc feeding (13C enrichment) - 1,152 - - -13C Glucose feeding (13C enrichment) - 286 - - -13CO2 feeding (13CO2 enrichment) - 743 - - -15N Urea feeding (15N enrichment) - 351 - - -
Plant Growth Stage ExperimentsB73 Grains - - 207 - -(Comparison of elemental compositionof maize kernels of line B73 providedby Regensburg or BASF)Flowering Time 1,504,080 27,823 - - -(analysis of 2 pairs of maize inbredlines to identify transcripts/metabolitesregulating flowering time in maize)Leaf Gradient 1,671,200 16,491 720 180 30(analysis of the developmentalgradient of the third maize leaf)Complete Data Warehouse 12,366,880 367,862 13,857 180 9,328
Figure 4 VANTED Data Visualisation Example. Measured data from experiments stored in OPTIMAS-DWcan be mapped onto pathways stored in MetaCrop [5] by using the VANTED [4] software. It enables the user tovisualise the data and to perform further data analysis. The map is visualised by the Systems Biology GraphicalNotation (SBGN) [23]. The small squares represent chemical reactions. The reactions are catalysed by enzymesrepresented as rectangular containers with rounded corners. The catalysis is represented by a small empty circle.

The metabolites are illustrated as circular containers and are either reactant or product of a reaction. When ametabolite occurs multiple times it is decorated with a clone marker (e.g. NAD+)
Beside the experimental data the user is able to retrieve analysis results from the web interface. This includesWGCNA results where specific conditions were defined. The user can, for example, detect genes that are highlycorrelated to fresh weight, growth rate or metabolite profiles in the nitrogen stress experiment [24]. Additionally,the chip ID and the correlation values are listed as well as the annotation. Furthermore, module lists of aWGCNA analysis are available where the transcript data of all experiments were included. A module is a clusterof interconnected nodes representing highly correlated genes. Here, the user can detect which genes are locatedin the same module. Additionally, a gene expression profile for each module is available visualising the averageexpression pattern (module eigengene) for each sample of analysed experiments. The WGCNA module overviewenables the user to carry out in which module a specific gene is located in the different WGCNA analysis results.With the help of that function the user can detect genes, which will react in a different way in differentexperiments.
Finally, the user can browse through the maize specific pathways stored in MetaCrop. A table provides a list ofthese pathways including clickable thumbnail images redirecting the user to MetaCrop. In MetaCrop the user cannavigate through the pathway data to get detailed information.
Discussion
OPTIMAS-DW provides an innovative concept to link data from different data domains through metadata. It isvery easy to extend the data warehouse by additional data domains by adjusting the main components ofOPTIMAS-DW, such as data templates, the import tool, the database schema, and the web interface. With theweb interface the user can extract data very easy either by browsing through a specific data domain of interest orby looking for data related to a specific experiment. Tools like the Gene Specific View or the WGCNA analysisenable the user to get answers to different systems biological questions. With WGCNA it is for example possibleto detect genes, which are correlated to the growth rate or the fresh weight of a maize plant. In that casetranscript and phenomic data is used by the analysis to detect responsible genes for biomass increase in maizeplants. With OPTIMAS-DW the user is able to perform data analysis using different data domains. By using theGene Specific View the user is, for example able to look at the behavior of genes of interest in differentexperiments and conditions such as genotype, plant growth stage, treatment or plant anatomy.
OPTIMAS-DW enables us to store more experimental data in future maize related projects to enhance our datacollection of maize. By further extending the database content and its functionality OPTIMAS-DW could helpthe researchers to better understand the systems biological processes in maize plants. Because of the experiencesgathered during the development of OPTIMAS-DW, the infrastructure and pipeline could also be used to set updata warehouses for other plant organisms. Furthermore, ways of data analysis could be improved in the futureenabling users to start data analyses directly from the web interface and with selected data of their interest.
Conclusions
With OPTIMAS-DW a comprehensive data warehouse for maize was established, which is able to handledifferent data domains and which comprises several analysis results that will support researchers within furtherprojects. The easy access to transcriptomics, metabolomics, ionomics and proteomics data from plant materialwith detailed phenotypic description allows the use of the full potential of large scale analysis tools in the future.It is also possible to continuously extend the data warehouse by adding more experimental data, even in datadomains which are not already available in OPTIMAS-DW. The concept to combine different data domains bymetadata will be used in future projects. We believe that OPTIMAS-DW will be a very valuable public datawarehouse for maize related research and supports systems biological research in particular.

Availability and requirements
The OPTIMAS-DW is available with no restrictions at the followinghttp://www.optimas-bioenergy.org/optimas_dw. All datasets are free to use and can be downloaded via the webinterface. There are no restrictions on use of the database as well as all stores data sets.
Competing interests
The authors declare that they have no competing interests.
Authors’ contributions
CC developed the data warehouse including the OPTIMAS-DW web application. CC, TC and AH designed andprovided the data import template. U. Schlüter, NZ, AB, TRP, PA, MG, SW and HF provided the experimentaldata. MM performed the WGCNA analyses. ARF, FB, HF, MB, TD, APMW, and U. Sonnewald supervised thebiological part of the project. FS and U. Scholz supervised the bioinformatics part of the project. U. Sonnewaldheaded the project consortium. All authors tested and used OPTIMAS-DW and thereby contributed to theimprovement of the web interface usability. All authors read and approved the final manuscript.
Acknowledgements
We thank Thomas Schmutzer for his help with the sequence assembly, Matthias Klapperstück for his support toget access to the MetaCrop database, Sophia Sonnewald for doing the chip design with Agilent, and StephanWeise for proof reading of the manuscript. This work was supported by the German Federal Ministry ofEducation and Research in the frame of OPTIMAS [FKZ 0315430A-G].
References
1. Lawrence C, Dong Q, Polacco M, Seigfried T, Brendel V: MaizeGDB, the community database for maizegenetics and genomics. Nucleic Acids Res 2004, 32:D393–D397.
2. Zhao W, Canaran P, Jurkuta R, Fulton T, Glaubitz J, Buckler E, Doebley J, Gaut B, Goodman M, Holland J,et al.: Panzea: a database and resource for molecular and functional diversity in the maize genome.Nucleic Acids Res 2006, 34:D752–D757.
3. Kuenne C, Grosse I, Matthies I, Scholz U, Sretenovic-Rajicic T, Stein N, Stephanik A, Steuernagel B, WeiseS: Using data warehouse technology in crop plant bioinformatics. J Integr Bioinf 2007, 4:88.
4. Junker BH, Klukas C, Schreiber F: VANTED: A system for advanced data analysis and visualization inthe context of biological networks. BMC Bioinf 2006, 7:e109.
5. Schreiber F, Colmsee C, Czauderna T, Grafahrend-Belau E, Hartmann A, Junker A, Junker B, KlapperstückM, Scholz U, Weise S: MetaCrop 2.0: managing and exploring information about crop plantmetabolism. Nucleic Acids Res 2012, 40:D1173–D1177.
6. Langfelder P, Horvath S: WGCNA: an R package for weighted correlation network analysis. BMCBioinf 2008, 9:e559.
7. Ficklin S, Feltus F: Gene Coexpression Network Alignment and Conservation of Gene Modulesbetween Two Grass Species: Maize and Rice. Plant Physiol 2011, 156:1244–1256.
8. Weston D, Gunter L, Rogers A, Wullschleger S: Connecting genes, coexpression modules, and molecularsignatures to environmental stress phenotypes in plants. BMC Syst Biol 2008, 2:e16.
9. DiLeo M, Strahan G, den Bakker M, Hoekenga O: Weighted Correlation Network Analysis (WGCNA)Applied to the Tomato Fruit Metabolome. PLoS ONE 2011, 6:e26683.

10. Kloosterman B, De Koeyer D, Griffiths R, Flinn B, Steuernagel B, Scholz U, Sonnewald S, Sonnewald U,Bryan G, Prat S, et al.: Genes driving potato tuber initiation and growth: identification based ontranscriptional changes using the POCI array. Funct Integr Genomics 2008, 8:329–340.
11. Altschul SF, Gish W, Miller W, Myers EW, Lipman DJ: Basic local alignment search tool. J Mol Biol1990, 3:403–410.
12. Chevreux B, Pfisterer T, Drescher B, Driesel A, Müller W, Wetter T, Suhai S: Using the miraESTassembler for reliable and automated mRNA transcript assembly and SNP detection in sequencedESTs. Genome Res 2004, 14:1147–1159.
13. Schnable P, Ware D, Fulton R, Stein J, Wei F, Pasternak S, Liang C, Zhang J, Fulton L, Graves T, et al.: TheB73 Maize Genome: Complexity, Diversity, and Dynamics. Science 2009, 326:1112–1115.
14. Barrett T, Troup D, Wilhite S, Ledoux P, Rudnev D, Evangelista C, Kim I, Soboleva A, Tomashevsky M,Marshall K, et al.: NCBI GEO: archive for high-throughput functional genomic data. Nucleic Acids Res2009, 37:D8885–D890.
15. Deng W, Nickle D, Learn G, Maust B, Mullins J: ViroBLAST: a stand-alone BLAST web server forflexible queries of multiple databases and user’s datasets. Bioinformatics 2007, 23:2334–2336.
16. Conesa A, Götz S, Garcia-Gomez J, Terol J, Talon M, Robles M: Blast2GO: a universal tool forannotation, visualization and analysis in functional genomics research. Bioinformatics 2005,21:3674–3676.
17. Harris M, Clark J, Ireland A, Lomax J, Ashburner M, Foulger R, Eilbeck K, Lewis S, Marshall B, MungallC, et al.: The Gene Ontology (GO) database and informatics resource. Nucleic Acids Res 2004,32:D258–D261.
18. Webb IUoB EC, Biology M: Nomenclature Committee. (1992) Enzyme nomenclature 1992 :recommendations of the Nomenclature Committee of the International Union of Biochemistry andMolecular Biology on the nomenclature and classification of enzymes. San Diego: Academic Press 1992.
19. Swarbreck D, Wilks C, Lamesch P, Berardini T, Garcia-Hernandez M, Foerster H, Li D, Meyer T, Muller R,Ploetz L, et al.: The Arabidopsis Information Resource (TAIR): gene structure and functionannotation. Nucleic Acids Res 2008, 36:D1009–D1014.
20. Paterson A, Bowers J, Bruggmann R, Dubchak I, Grimwood J, Gundlach H, Haberer G, Hellsten U, MitrosT, Poliakov A, et al.: The Sorghum bicolor genome and the diversification of grasses. Nature 2009,457:551–556.
21. Pick T, Bräutigam A, Schlüter U, Denton A, Colmsee C, Scholz U, Fahnenstich H, Pieruschka R, Rascher U,Sonnewald U, et al.: Systems Analysis of a Maize Leaf Developmental Gradient Redefines the CurrentC4 Model and Provides Candidates for Regulation. Plant Cell 2011, 23:1–13.
22. Junker A, Rohn H, Czauderna T, Klukas C, Hartmann A, Schreiber F: Creating interactive, web-based anddata-enriched maps with the Systems Biology Graphical Notation. Nat Protoc 2012, 7:579–593.
23. Le Novère N, Hucka M, Mi H, Moodie S, Schreiber F, Sorokin A, Demir E, Wegner K, Aladjem M,Wimalaratne S, et al.: The Systems Biology Graphical Notation. Nat Biotechnol 2009, 27:735–741.
24. Schlüter U, Mascher M, Colmsee C, Scholz U, Bräutigam A, Fahnenstich H, Sonnewald U: Maize sourceleaf adaptation to nitrogen deficiency effects not only N and C metabolism but also control of Phomeostasis. Plant Physiol 2012, 160:1384–1406.
Additional_file_1 as PNGadditional file 1: OPTIMAS Database Schema. The OPTIMAS Database Schema can be divided into twomain parts, the metadata on the one side and the data domain schemas on the other side. The metadata and eachdata domain schema are linked through table optimas.t103_measurement_value. The primary key of the datadomain entry is stored in t103_measurement_value_id while the information about schema and table is stored inthe related tables.


Additional files provided with this submission:
Additional file 1: 1149922824805964_add1.png, 296Khttp://www.biomedcentral.com/imedia/1693105618817890/supp1.png


![Elements of Vasiliev theory - MPG.PuRepubman.mpdl.mpg.de/pubman/item/escidoc:1945320/component/esci… · arXiv:1401.2975v1 [hep-th] 13 Jan 2014 Elements of Vasiliev theory V.E.Didenko∗](https://img.dokumen.tips/doc/110x75/5aa8a4ed7f8b9a9a188bda5c/elements-of-vasiliev-theory-mpg-1945320componentesciarxiv14012975v1-hep-th.jpg)