Embed Size (px)
Citation preview

This Provisional PDF corresponds to the article as it appeared upon acceptance. Fully formattedPDF and full text (HTML) versions will be made available soon.
Patterns of sequence polymorphism in the fleshless berry locus in cultivatedand wild Vitis vinifera accessions
BMC Plant Biology 2010, 10:284 doi:10.1186/1471-2229-10-284
Clea Houel ([email protected])Remi Bounon ([email protected])Jamila Chaib ([email protected])
Cecile Guichard ([email protected])Jean-Pierre Peros ([email protected])Roberto Bacilieri ([email protected])Alexis Dereeper ([email protected])Aurelie Canaguier ([email protected])
Thierry Lacombe ([email protected])Amidou N'Diaye ([email protected])
Marie-Christine Le Paslier ([email protected])Marie-Stephanie Vernerey ([email protected])
Olivier Coriton ([email protected])Dominique Brunel ([email protected])Patrice This ([email protected])
Laurent Torregrosa ([email protected])Anne-Francoise Adam-Blondon ([email protected])
ISSN 1471-2229
Article type Research article
Submission date 9 July 2010
Acceptance date 22 December 2010
Publication date 22 December 2010
Article URL http://www.biomedcentral.com/1471-2229/10/284
Like all articles in BMC journals, this peer-reviewed article was published immediately uponacceptance. It can be downloaded, printed and distributed freely for any purposes (see copyright
notice below).
Articles in BMC journals are listed in PubMed and archived at PubMed Central.
BMC Plant Biology
© 2010 Houel et al. ; licensee BioMed Central Ltd.This is an open access article distributed under the terms of the Creative Commons Attribution License (http://creativecommons.org/licenses/by/2.0),
which permits unrestricted use, distribution, and reproduction in any medium, provided the original work is properly cited.

For information about publishing your research in BMC journals or any BioMed Central journal, go to
http://www.biomedcentral.com/info/authors/
BMC Plant Biology
© 2010 Houel et al. ; licensee BioMed Central Ltd.This is an open access article distributed under the terms of the Creative Commons Attribution License (http://creativecommons.org/licenses/by/2.0),
which permits unrestricted use, distribution, and reproduction in any medium, provided the original work is properly cited.

Patterns of sequence polymorphism in the fleshless berry locus in
cultivated and wild Vitis vinifera accessions
Cléa Houel1*
, Rémi Bounon1,2
, Jamila Chaïb3, Cécile Guichard
1, Jean-Pierre Péros
4,
Roberto Bacilieri4, Alexis Dereeper
4, Aurélie Canaguier
1, Thierry Lacombe
4, Amidou
N’Diaye4, Marie-Christine Le Paslier
2, Marie-Stéphanie Vernerey
5,6, Olivier Coriton
5,
Dominique Brunel2, Patrice This
4, Laurent Torregrosa
4, Anne-Françoise Adam-
Blondon1*
1 Unité mixte de Recherche en Génomique Végétale (URGV), INRA UEVE ERL CNRS, 2
rue Gaston Crémieux, 91 057 Evry cedex, France
2 Unité INRA Etude du Polymorphisme des Végétaux (EPGV), 2 rue Gaston Crémieux,
91 057 Evry cedex, France
3 CSIRO Plant Industry, PO BOX 350, Glen Osmond SA 5064, Australia
4 Unité mixte de Recherche Diversité et Adaptation des Plantes Cultivées (DiaPC), INRA
SupAgro, 2 place Pierre Viala, 34 060 Montpellier Cedex, France
5 Unité mixte de Recherche Amélioration des Plantes et Biotechnologies Végétales (APBV),
INRA Agrocampus Rennes, Plate-forme cytologique moléculaire, 35 653 Le Rheu Cedex,
France
6 Unité mixte de Recherche Biologie et Génétique des Interactions Plantes-Agents Pathogènes
(BGPI), INRA SupAgro CIRAD, 2 place Pierre Viala, 34 060 Montpellier Cedex, France
Email Addresses
*Corresponding authors
CH* : [email protected]
RB : [email protected]
CG : [email protected]
J-PP: [email protected]
RB : [email protected]
TL : [email protected]
AND: [email protected]

M-CLP : [email protected]
M-SV : [email protected]
OC : [email protected]
DB : [email protected]
LT : [email protected]
A-FAB* : [email protected]
Abstract
Background
Unlike in tomato, little is known about the genetic and molecular control of fleshy fruit
development of perennial fruit trees like grapevine (Vitis vinifera L.). Here we present the
study of the sequence polymorphism in a 1 Mb grapevine genome region at the top of
chromosome 18 carrying the fleshless berry mutation (flb) in order, first to identify SNP
markers closely linked to the gene and second to search for possible signatures of
domestication.
Results
In total, 62 regions (17 SSR, 3 SNP, 1 CAPS and 41 re-sequenced gene fragments) were
scanned for polymorphism along a 3.4 Mb interval (85,127-3,506,060 bp) at the top of the
chromosome 18, in both V. vinifera cv. Chardonnay and a genotype carrying the flb mutation,
V. vinifera cv. Ugni Blanc mutant. A nearly complete homozygosity in Ugni Blanc (wild and
mutant forms) and an expected high level of heterozygosity in Chardonnay were revealed.
Experiments using qPCR and BAC FISH confirmed the observed homozygosity. Under the
assumption that flb could be one of the genes involved into the domestication syndrome of
grapevine, we sequenced 69 gene fragments, spread over the flb region, representing 48,874
bp in a highly diverse set of cultivated and wild V. vinifera genotypes, to identify possible
signatures of domestication in the cultivated V. vinifera compartment. We identified eight
gene fragments presenting a significant deviation from neutrality of the Tajima’s D parameter
in the cultivated pool. One of these also showed higher nucleotide diversity in the wild
compartments than in the cultivated compartments. In addition, SNPs significantly associated
to berry weight variation were identified in the flb region.
Conclusions
We observed the occurrence of a large homozygous region in a non-repetitive region of the
grapevine otherwise highly-heterozygous genome and propose a hypothesis for its formation.
We demonstrated the feasibility to apply BAC FISH on the very small grapevine
chromosomes and provided a specific probe for the identification of chromosome 18 on a
cytogenetic map. We evidenced genes showing putative signatures of selection and SNPs
significantly associated with berry weight variation in the flb region. In addition, we provided
to the community 554 SNPs at the top of chromosome 18 for the development of a
genotyping chip for future fine mapping of the flb gene in a F2 population when available.

Background
Berry size is an important trait in relation to both yield (table grapes) and quality (wine
grapes). Indeed, the flavor in wine results from the ratio of skin to flesh, the former being the
source of most aromatic and tannins compounds, the second providing the organic acids and
the sugars [1].
The genetic and molecular basis of fleshy fruit size variation have been studied in depth in
tomato during the last two decades, using a large panel of diverse resources that made tomato
a model species for fleshy fruit crops [2,3]. Introgression lines between wild and cultivated
genotypes [4,5,6], near isogenic lines (NILs) [7] and artificial or natural mutants [2,8] have
been created and used to study the genetic basis of fruit size variation showing that a large
part of it is controlled by less than ten loci. The physiological mechanisms involved have been
related to the control of (i) the cell number in the pericarp, as for the fw2.2 locus [9,2,10], (ii)
the locule number [2,11], (iii) the late endo-reduplication in pericarp cells [12,10] and (iv) the
cell wall plasticity in relation to the cell expansion [10]. All these advances in tomato are
useful to assist the study of similar trait in other crops with fleshy fruits, less amenable to
genetic studies, such as perennial fruit trees. Indeed, encouraging results have already shown
syntheny within Solanaceae species for Quantitative Trait Loci (QTL) controlling fruit size
[2]. However, the degree of transferability of knowledge from tomato to non-Solanaceae
species remains an open question.
Like tomato, grapevine (Vitis vinifera) produces fleshy fruits and a large difference in fruit
size between wild and cultivated genotypes can be observed [13]. Indeed the wild V. vinifera
genotypes produce mature berries weighting less than 1g while berries of some table grape
varieties can weigh 10g and more [14]. The growth of a grapevine berry roughly follows the
same pattern as for tomato fruit: the first phase of fruit development is due to both cell
multiplication and cell expansion, followed by a lag phase corresponding to a major cell
metabolic shift and a second phase of fruit growth, mostly explained by cell expansion but
without evidence of endoreduplication [15]. The genetic analysis of grape berry size variation
is more difficult than in tomato, due to the long biological cycle of the plant, to the high level
of heterozygosity of the genome and to the large field area usually required for plant growth,
which makes experiments in controlled environment more costly [16,17,18,19]. In addition,
berry size studies have often been performed on population segregating for seedlessness, with
a strong negative correlation between the two traits: the seedless berries are in average smaller

than the seeded berries [16,17,18,19]. Up to now, it has not been possible to establish the
relationship between QTL for berry size and processes like cell multiplication or cell
enlargement.
A natural mutant of V. vinifera cv. Ugni Blanc, which produces fleshless berries similar to
those observed in wild genotypes, was identified as an opportunity to get insights into the
control of berry development and berry size [20]. It has been shown that the drastic
phenotypic changes observed in berry development are controlled by a dominant mutation in
the fleshless berry (flb) gene [21]. Like the fw2-2 gene in tomato, the flb gene impairs cell
divisions in the developing ovaries [21]. The closest genetic marker linked to the flb mutation
defines a 6 cM region located at the top the chromosome 18 that corresponds to a physical
distance of 948 kb according to the last version of the grapevine genome assembly
(http://urgi.versailles.inra.fr/projects/Vitis/ressources.php); in this region, no homologue to
the fw2-2 has been identified. Considering the importance of berry size for wine quality, a fine
mapping of the flb mutation was thus started for its molecular identification.
Here we describe our efforts in reducing the genome interval of the region carrying the flb
mutation. We first started by a classical genetic mapping approach. We showed that the
mutation is located on a completely homozygous portion of chromosome 18 in Ugni Blanc
mutant. No marker could thus be found in coupling with the mutation and the classical
approach was abandoned.
We therefore started another approach similar to the one previously proposed for fw2-2 gene
in tomato [9]. Since the berries of Ugni Blanc mutant mimic wild V. vinifera berries (both
types of berries have little to no flesh and carry round shaped seeds typical of wild genotypes)
[13,20,22], we hypothesized that flb gene could have been one of the genes selected during
the domestication process of grapevine. If so, a signature of selection or selective sweep could
be found around this gene. Under this assumption, we performed a preliminary scan of the
sequence polymorphism of the flb region in a collection cultivated and wild grapevine
genotypes.
Methods
Plant material
The genotypes used in the present study were collected in the French National Grapevine
Germplasm Collection (Domain of Vassal, Montpellier, France;
http://www1.montpellier.inra.fr/vassal/) and are listed in additional file 1. Twenty-six of them

were chosen to maximize the genetic diversity of the cultivated Vitis vinifera compartment
[23]. Seven other genotypes belonging to the wild Vitis vinifera compartment were chosen
because they had well characterized wild-type phenotypes as well as wild-type diverse SSR
profiles and because they originated from different countries (8500Mtp3 from Tunisia,
8500Mtp9 and 8500Mtp38 from Germany and the rest from France; [additional file 1]. Five
genotypes were added to the sample: the inbred line INRA Colmar lignée PN40024
(PN40024; reference genome; maintained at INRA Colmar, France), Chardonnay, Ugni
Blanc, Ugni Blanc mutant and Pinot Noir clone ENTAV-INRA777 (PN777; maintained at the
French Institute for Grapevine and Wine; Domaine de l’Espiguette, Le Grau du Roi, France).
The average berry weight at maturity was measured from 30 berries cut at the pedicel base 40
days after véraison [additional file 1].
DNA extraction
Total genomic DNA was extracted from 1 g of young leaves according to the DNeasy Plant
Maxi Kit (Qiagen) with the following modifications: 1% polyvinylpyrrolidone (PVP 40 000)
and 1% (v/v) βmercaptoethanol were added to buffer AP1. The clarified lysate recovered after
filtration with the QIA-shredder Maxi spin column (step 12) was extracted with one volume
of phenol:chloroform:isoamyl alcohol (25:24:1) and then with one volume of
chloroform:isoamyl alcohol (24:1). From this step forward, the supernatant was treated
following the Qiagen instructions.
Gene fragments amplification and sequencing
Based on the genome annotation provided by Jaillon et al [24], 86 primer pairs were designed
using the Primer 3 software v.0.4.0 [25] in order to amplify every 13 kb in the flb region, a
gene fragment of approximately 1300 bp [additional file 2]. In order to estimate the nucleotide
diversity at the whole genome scale, seventy-seven other primer pairs were designed on genes
chosen randomly along the genome, taking care that each chromosome was represented by
three to five fragments [additional file 3]. The amplicon sequences were then aligned on the
last 12X version of the genome sequence (http://urgi.versailles.inra.fr/cgi-
bin/gbrowse/vitis_12x_pub/) and some of them did not correspond to a gene model anymore.
Settings for Primer 3 were: optimum Tm=55°C, minimum Tm=53°C, maximum Tm=57°C,
max 5’ self complementarity=4, max 3’ self complementarity=1. In order to amplify all the
genotypes while at the same time detecting a maximum of polymorphism, all the primers
were designed in exons at both sides of introns. Universal primers T7/SP6 extensions were

added to the primers to allow sequencing. All PCR amplifications were carried out as
described by Philippe et al [26].
Microsatellite, CAPS and SNP genotyping
The markers genotyped are listed and described in additional file 2. Cleaved Amplified
Polymorphic Sequence (CAPS) genotyping was performed as described by Salmaso et al [27].
The Australian Genome Research Facility (AGRF) carried out Simple Sequence Repeats
(SSR) and Single Nucleotide Polymorphism (SNP) analysis. SNP were scored using the
MassARRAY® iPLEX
Gold assay with MALDI-TOF MS detection (Sequenom) and SSR
analysis was performed as previously described by Thomas et al [28].
Quantitative PCR assay
Two primer pairs were designed to amplify genomic DNA. The first pair
(TCTGATGCGATGTTAGTGGT and TCTGGTATTGGCGTTGG) targeted a unique gene
(FL) in the flb region (gene ID GSVIVG01013466001). The second pair
(AACTGGATTGAAGGGCGTGG and AGGTTCTTGAGCATGTTAAGC) targeted the 3-
hydroxy-3-methylglutaryl-coenzyme A reductase (HMGCoA) gene family, which members are
respectively located on the chromosomes 4, 3 and 18 (gene id GSVIVG01026444001,
GSVIVG011023852001, GSVIVG01013435001). Real-time PCR conditions were conducted
as described by Reid et al [29], with half quantity of PCR mix and of DNA. The PCR
efficiencies were determined for each gene and were 92.3% and 97.2% for FL and HMGCoA
respectively. In order to compare the initial DNA quantity between genotypes in the flb
region, the DNA quantity based on FL gene data was normalised using the DNA quantity of
HMGCoA genes as a reference.
BAC-FISH assay
Roots tips of 0.5-1.5 cm length were treated in the dark with 0.04% 8-hydroxiquinoline for 2
h at 4°C followed by 2 h at room temperature to accumulate metaphases. They were then
fixed in 3:1 ethanol-glacial:acetic acid for 12 hours at 4°C and stored in ethanol 70 % at -20
°C. They were washed in 0.01 M citric acid-sodium citrate pH 4.5 buffer for 15 min and then
digested in a solution of 5% Onozuka R-10 cellulase (Sigma), 1% Y23 pectolyase (Sigma) at
37 °C for 1 h. Digested root tips were then carefully washed with distilled water for 2 h. One
root tip was transferred to a slide and macerated in a drop of 3:1 fixation solution (ethanol-
glacial:acetic acid). Chromosome spreads were prepared for hybridization as described by

Leflon et al [30]. VV40024H140P14 Bacterial Artificial Chromosome (BAC) clone (available
at http://cnrgv.toulouse.inra.fr) was labelled by random priming with biotin-14-dUTP
(Invitrogen). The ribosomal probe used, as a control of hybridation, was pTa-71 which
contains a 9 kb EcoRI fragment of ribosomal DNA repeat unit (rDNA 18S-5.8S-26S genes
and spacers) isolated from Triticum aestivum [31]. The probe pTa-71 was labelled with
Alexa-488 dUTP (Invitrogen) by random priming. Fluorescence In Situ Hybridization (FISH)
experiments and capture of fluorescence images were done as described by Leflon et al [30].
Sequence data analysis, estimation of parameters of diversity and linkage disequilibrium
Raw data were aligned and trimmed using either the Genalys v.2.8.3b software for Macintosh
[32] or the Staden software v.2.0.0 [33]. They were manually edited and
INsertions/DELetions (INDELs) were added when needed. Single Nucleotide polymorphisms
(SNPs) were detected, confirmed, and imported into the SNiPlay database
(http://sniplay.cirad.fr). Nucleotide diversity ( ), number of segregating sites ( ), number of
haplotype (H), haplotype diversity (Hd), and Tajima’s D test of neutral evolution [34] were
obtained for each gene fragment using the DnaSp V5.10 software (http://www.ub.edu/dnasp/).
Eventually, the total value of each parameter was calculated as a weighted average for the
whole data set. As all the gene fragments along the flb region were separated in average by 12
kb (from 3 to 57 kb), it was not possible to reconstitute the haplotypes for the entire flb region
in order to estimate the Linkage Disequilibrium (LD). Roger and Huff [35] showed that the
genotypic correlation coefficient (based on genotypic data) is a good estimator of the
haplotypic correlation coefficient. LD was therefore estimated over the entire studied region
as the square of the genotypic Pearson correlation coefficient (r2) together with its p-value
using a homemade R program. The results were visualised using in homemade Perl scripts.
Association genetics
A structured association test was carried out using TASSEL software
(http://www.maizegenetics.net/index.php?option=com_content&task=view&id=89&Itemid=1
19). The population structure was calculated using STRUCTURE software [36] using the
genotypes at 20 SSR markers well spread along the 19 chromosomes (Le Cunff et al, 2008; R.
Bacilieri unpublished results; [additional file 1]). A General Linear Model test, which takes
into account the structure of the sample, was performed between the SNP markers in the flb
region with a allelic frequency >0.05 and the average berry weight at maturity. A Bonferroni

correction was applied to control false-positives: a SNP marker was declared significant if its
Bonferroni p-value was less than 0.05.
Results
A 1Mb region at the top of chromosome 18 is homozygous in Ugni Blanc and the
fleshless berry mutant
The flb mutation was localised by Fernandez et al [21] at the top of chromosome 18, above
the marker VMC2A3 and VMC8B5 on the consensus map of a progeny of Chardonnay by
Ugni Blanc mutant. However, the flb locus was mapped indirectly relative to VMC2A3 that
segregated in Chardonnay and not in Ugni Blanc mutant. For the purpose of finding
polymorphic markers in Ugni Blanc mutant above VMC2A3, we aligned the genetic map to
the grapevine reference genome sequence [24] in order to identify SSR and SNP markers
segregating in the Ugni Blanc mutant. This region corresponded to 948 kb on chromosome 18
(upper part of scaffold 122; figure 1) where 100 predicted genes were proposed by the
automatic annotation.
First, 17 SSR, three SNP and one CAPS markers were either developed or retrieved from
published genetic maps [37,38,39,40,41,42] along scaffold 122 and the beginning of scaffold
1, above and below VMC2A3 [additional file 2]. All primer pairs successfully amplified
Chardonnay and Ugni Blanc mutant genomic DNAs. One of them (VVS55), not targeting a
single locus, was discarded. Chardonnay was heterozygous for ten of the 20 remaining
markers, while Ugni Blanc mutant was always homozygous except for VVCS1H085F05F1-1,
which is located after VMC2A3 (table 1).
In order to find new heterozygous markers in the flb region, we decided to carry out a re-
sequencing approach. Thirty primer pairs were designed along this region [additional file 2],
24 above the SSR marker VMC2A3 and six below. Twenty out of 24 primer pairs (above
VMC2A3) successfully amplified the PN40024 genomic DNA and were thus used to
sequence the corresponding gene fragments in Chardonnay, Ugni Blanc and Ugni Blanc
mutant. We decided to sequence also Ugni Blanc in order to check if the homozygosity of the
flb region was specific to the mutant or already present in the wild type.
The 26 fragments of 1300 bp in average were sequenced either only in forward or also in
reverse direction, leading to 41 sequences of 161 to 1700 bp long (table 2), heterozygous
INDELs or short repeats leading to the shorter sequences. In total, we analyzed 23,562 bp in
Chardonnay and 29,638 bp in Ugni Blanc and Ugni Blanc mutant. This difference was the

first observed contrast between Chardonnay and Ugni Blanc, due to a different level of
heterozygosity. Comparing the sequences of Chardonnay and Ugni Blanc, 74 polymorphisms
were identified (63 SNPs and 11 INDELs). Out of these, 10 differences correspond to
homozygous SNPs or INDEL in both samples, while 64 differences correspond to SNPs
heterozygous in Chardonnay and homozygous in Ugni Blanc. No heterozygous SNPs or
INDELs were observed in Ugni Blanc and its mutant; we deduced that the homozygosity of
this region derived from Ugni Blanc. Only Ugni Blanc mutant sequences were considered in
the subsequent experiments.
In total, 62 regions (17 SSR, three SNP, one CAPS and 41 re-sequenced gene fragments)
were scanned for polymorphism both in Chardonnay and Ugni Blanc mutant along a 3.4 Mb
interval (85,127-3,506,060 bp) in the flb region (scaffold 122 and the beginning of scaffold 1).
This allowed showing a nearly complete homozygosity in Ugni Blanc mutant and as
expected, a high level of heterozygosity in Chardonnay.
To discriminate between a complete homozygosity of Ugni Blanc mutant and a large deletion
of the flb region, two experiments were realized. First, a quantitative PCR (qPCR) assay was
performed on genomic DNA from Ugni Blanc, Ugni Blanc mutant, Chardonnay, PN777 and
PN40024 as controls. No difference in the estimation of the initial DNA quantity was
observed when amplifying with primer pair FL, which targeted a gene in the flb region and
the other primer pair HMGCoA, which targeted three loci elsewhere in the genome (figure 2a;
[additional file 4]). This indicated that this region is homozygous and not deleted in Ugni
Blanc or Ugni Blanc mutant. The second experiment consisted in a FISH experiment with a
BAC clone (VV40024H140P14) localized specifically in the flb region using mitotic
metaphase chromosomes of Ugni Blanc mutant and PN777 as control. Chromosomes were
counter stained with DAPI (figure 2b-e) and FISH signals corresponding to
VV40024H140P14 were detected on two homologous chromosomes in both PN777 and Ugni
Blanc mutant (figure 2c and 2e respectively), which confirmed that the flb region was not
deleted in Ugni Blanc mutant.
Flb region showed possible signatures of selection in the cultivated V. vinifera
compartment
A fragment every ten to 20 kb, in the 948 kb region above marker VMC2A3 was re-
sequenced in a highly diverse set of cultivated V. vinifera genotypes [additional file 1], in
order to evidence possible traces of selection in the cultivated pool of grapevines.
Sixty-three additional primer pairs were developed; two of them being discarded because they
did not amplify in PN40024 [additional file 2]. Eighty-two primer pairs (20 targeting
fragments before VMC2A3, one targeting a fragment after VMC2A3 described in the former
paragraph and 61 newly developed) were thus used to sequence the corresponding gene
fragments in 26 cultivated V. vinifera and the PN40024 as control [additional file 1]. Each
fragment was compared to the 12X version of the genome reference sequence, which allowed
us to discard the results obtained for eight and three fragments that appeared to be either part
of a false duplication in the 8X version of the genome sequence, or to the same gene in the
12X gene annotation, respectively [additional file 2]. The remaining data, from 69 sequenced
regions, consisted in a total of 34,355 kb, 61% (21,161 kb) being located in predicted introns
or UnTranslated Region (UTR) and 39% (13,194 kb) in exons [additional file 5]. In parallel,
77 random gene fragments spread all over the genome were chosen in order to estimate the
nucleotide diversity over the whole genome, and as control for the effect of selection. These
gene fragments represented 48,874 kb of total sequence, 55% (27,018 kb) located in predicted
introns or UTR and 45% (21,856 kb) in predicted exons [additional file 3].
The Tajima’s D parameter, was calculated for the 77 random genes and for the 69 genes from
the flb region [additional file 3 and 5]. Eight of 69 sequenced fragments in the flb region
showed putative traces of selection evidenced by a Tajima’s D parameter significantly
deviating from neutrality (table 3). Moreover, for these fragments, the value of Tajima’s D
parameter was quite divergent from the average calculated for the 77 random genes (-
0.1853+/-0.8117; [additional file 3]) and were found in the tails of the distribution of Tajima’s
D value across the genome (for α=0.05; Figure 3). A significant negative Tajima’s D value,
possibly indicative of a purifying selection was observed for four out of the eight gene
fragments whereas a significant positive Tajima’s D value, possibly indicative of a
diversifying selection, was found for the other four (table 3).
Analysis of the nucleotide diversity along the flb region in a set of cultivated and wild
Vitis vinifera genotypes
The 69 gene fragments from the flb region and the 77 random gene fragments spread all over
the genome were sequenced in seven diverse wild Vitis vinifera genotypes, in order to
compare the nucleotide diversity in the cultivated and wild pools of genotypes. The diversity
parameters calculated for each fragment in the two different subsets of individuals, are
presented in additional files 3 and 5 and summarized in table 4. All the indicators of genetic
diversity (number of segregating sites, number of haplotypes, and nucleotide diversity: π)
were higher in average (roughly doubled pi=0.0020 vs 0.0041; [additional file 5]) in the whole
sample of domesticated genotypes in comparison to the sample of wild genotypes in the flb
region. This hold true when each of the wine and table grape sub-compartments of cultivated
grapes were compared with the wild compartment, with less unbalanced numbers of
individuals in each pairwise comparison (table 3). Compared to a similar number of re-
sequenced fragments spread all over the genome, there was a slightly lower diversity among
the wild genotypes in the flb region than in the rest of the genome, which was not the case in
the cultivated compartment (table 4). Moreover, we observed very few specific segregating
sites between the wild and the cultivated compartment in the flb region (out of 554 SNP sites,
only six were specific to the wild compartment; figure 4; [additional file 5]). Nucleotide
diversity varied along the flb region, also depending on the pool of genotypes considered
(figure 5; [additional file 5; additional file 6] and was locally higher in the cultivated
compartment than in the wild compartment (figure 5). This probably reflected the fact that 18
out of 69 fragments showed no sequence polymorphism among the wild genotypes [additional
file 5], whereas only one fragment was monomorphic in the domesticated compartment
(VV05795A). This was not the case for the 77 random fragments [additional file 3]. In
addition, we found that the wine cultivar Orbois, like Ugni Blanc, was completely
homozygous specifically in the flb region (data not shown).
Under the hypothesis that flb was one of the genes under selection during grape
domestication, we expected to find traces of selection in the cultivated compartment
associated with a difference of nucleotide diversity between the cultivated and wild
compartments. Eight sequenced gene fragments in the flb region were particularly interesting
because they showed such possible traces of selection in the cultivated pool of genotypes
(previous paragraph; table 3). Four out of the eight gene fragments showed differences in
nucleotide diversity between the two compartments (VV05791A, VVC2897A, VVC2901A
and VVC2901A; Table 3). However, the wild Vitis vinifera sample showing over all the genome
a lower diversity than the cultivated Vitis vinifera sample, we could conclude to a significant
nucleotide diversity difference between wild and cultivated compartment only in the case
where there was a decreasing of nucleotide diversity in the cultivated sample in comparison to
the wild sample. Only one out of eight gene fragments (VVC2897A) showed such significant
higher nucleotide diversity (π) in the wild compartment compared to the cultivated
compartment. This gene encodes a putative glyceraldehyde-3-phospho-dehydrogenase (table
3). VVC2897A was re-sequenced in Ugni Blanc and Ugni Blanc mutant, showing no
polymorphism in the part of the coding region they contained (data not shown).

Flb region showed significant LD and a possible association with berry size variation
In order to check if there was linkage disequilibrium (LD) between the genes possibly under
selection, LD was evaluated along the entire flb region. Two sub-regions were highlighted
[additional file 7]. The first one, close to the telomere, contained two out of the eight genes
possibly under selection (VVC2981A and VVC2946A), showed lower nucleotide diversity
(figure 5) and several gene fragments with no SNP in the wild pool. Moreover, in this sub-
region, few significant LD was observed between the different gene fragments in both
cultivated and wild pools [additional file 7]. The second sub-region contained six out of eight
genes possibly under selection and showed high nucleotide diversity and a significant LD
between and within some gene fragments in the cultivated and wild pools (figures 5 and 6).
Most of the SNPs found in the four out of the six genes possibly under selection showed
intragenic LD, in the cultivated pool, and for two of them (VVC2901A and VVC2885A), an
intergenic LD was found and extended with the adjacent gene fragment VV05782A (figure
6). In the wild pool, only five out of the six gene fragments possibly under selection were
polymorphic and could be used for the estimation of the LD in the second sub-region. Three
of them showed intragenic and (excepted for VVC2897A) intergenic LD, together and with
the gene fragment VV05782A as for the cultivated pool. Finally, the only gene possibly under
selection showing significant nucleotide diversity difference between the two pools
(VVC2897A) showed strong intragenic LD and with four adjacent gene fragments
(VV05786A, VVC2907A, VV05785A and VVC2903A).
We searched for associations in the set of cultivated genotypes between the average weight of
mature berries and the 447 out of 554 SNPs from the flb region with an allelic frequency
>0.05. Such significant associations (figure 7; [additional file 8]) were detected for four SNPs
in four gene fragments listed in the table 5. None of them corresponded to the genes showing
a significant deviation from neutrality of the Tajima’s D parameter. However, a significant
association was found with a non synonymous SNP from a gene fragment (VV05786A; table
5) showing LD with the only gene fragment possibly under selection with a high nucleotide
diversity in the wild pool than in the cultivated pool, VVC2897A.
Discussion

With an initial objective to develop markers tightly flanking the flb mutation, 62 genomic
regions were scanned for polymorphism along a 1.4 Mb region at the top of chromosome 18,
where the mutation was previously located [21]. These regions were either genotyped or
sequenced in the genotype carrying the mutation, Ugni Blanc mutant, its wild type (Ugni
Blanc) and Chardonnay, which was the other parent of a full sib family segregating for the
mutation. The sequenced fragments or markers were completely homozygous in Ugni Blanc
and Ugni Blanc mutant, with one marker analyzed each 23 kb in average. Indeed, while
analyzing the genome sequence of the heterozygous grapevine cultivar Pinot Noir, Velasco et
al [43] showed that, like in other heterozygous species, the frequency of SNPs or INDELs
varied along the grapevine genome and found some evidence for scarce quasi-homozygous
areas. Here we describe a region of 1 Mb probably completely homozygous that raised two
questions. First, as Velasco et al [43] showed that over 65 Mb of sequence are hemizygous in
Pinot Noir, we wanted to check if our observations were due to a real homozygosity or to a
deletion of a large portion of the top of chromosome 18 in one haplotype of Ugni Blanc. We
addressed this issue by two different experiments (figure 2), a qPCR estimation of the number
of copies of a single gene in the homozygous area (FL) compared to genes elsewhere in the
genome (three HMGCoA genes). The same number of copies was estimated for FL gene for
Ugni Blanc mutant and Chardonnay which is heterozygous in this region. Second, a BAC-
FISH hybridization on Ugni Blanc mutant metaphase chromosomes using a BAC clone
located in the area was carried out and showed a signal on both homologous chromosomes.
We therefore un-ambiguously demonstrated that our observations corresponded to a real
homozygosity in Ugni Blanc mutant. This would be consistent with the fact that hemizygous
regions identified by Velasco et al [43] would mainly correspond to stretches of repeated
sequences, which is not the case of the flb region. These results raised the question whether
this high level of homozygosity in Ugni Blanc mutant was restricted to the top of
chromosome 18. The scoring of 480 SNPs [44] and 20 SSR ([45], V. Laucou personal
communication) regularly spread along the genome showed that whereas this cultivar seems
slightly more homozygous in average than for instance Cabernet Sauvignon, Syrah or
Chardonnay, the near complete homozygosity observed in the flb region in Ugni Blanc mutant
is not the rule on the rest of the genome and may be restricted to this region only. A
mechanism which could explain the formation of such large homozygous region in a highly
heterozygous out-crosser like grapevine would involve the repair of a DNA double-strand
break [46]. When analyzing diversity in the cultivated germplasm, we observed that the
cultivar Orbois was also completely homozygous for all fragments re-sequenced at the top of

chromosome 18, and confirmed by qPCR assay that it was also due to real homozygosity
(data not shown). Whatever its origin, this unexpected result made impossible the fine
mapping of the mutation in the available segregating F1 population, which would necessitate
the development of a F2 population.
Before having such a population available, we tested another possibility for reducing the
interval carrying the flb gene, based on the fact that flb could be a gene selected during grape
domestication. Indeed, the berry and seed phenotypes of Ugni Blanc mutant look like the
phenotypes of wild V. vinifera seeds and berries [20,22]. We searched for signatures of
selection in the flb region in a set of cultivated genotypes. For this purpose, we sequenced in
33 individuals (26 cultivated and 7 wild genotypes) (i) 69 gene fragments for a total of 34,355
kb along 948 kb in the flb region and (ii) 77 additional, totaling 48,874 kb spread along the 19
grapevine chromosomes. As already observed by Vezzulli et al [41], the nucleotide diversity
was lower in average in the set of wild genotypes (π=0.27) than in the set of cultivated
genotypes (π=0.35). This difference was increased in the flb region probably by the fact that a
quarter of the fragments showed no sequence polymorphism at all among the wild genotypes
whereas only one was in this case in the domesticated compartment. In the present work (but
not in Vezzulli et al [42]) the sample of domesticated genotypes was selected after a
comprehensive analysis of the world-wide largest collection of domesticated grapevine
accessions [23] with the aim to retain a maximum of diversity. Unlike in Vezzulli et al [42],
very few specific SNPs were found in the set of wild genotypes (six SNPs out of 554). All
these observations, opposite to what has been observed in many other species [47,48], could
be due to the fact that only seven to ten wild genotypes were sequenced in both studies and
that their choice could not be driven by a maximization of the diversity along their complete
natural area of growth. However, several surveys including accessions from the wild V.
vinifera germplasm also showed this overall lower genetic diversity compared to the
cultivated germplasm [49,50,51]. Indeed, small population sizes [52,53] as well as dioecy [54]
could explain the observed reduced diversity in the wild V. vinifera gene pool, while multiple
domestication events [50] and a continuous breeding process the larger diversity in the
cultivated gene pool. All these results including ours will have to be confirmed with a larger
sample of wild V. vinifera, taking into account all the geographic area where it grows and its
overall genetic diversity.
Putative signatures of selection (Tajima’s D parameter significantly deviating from neutrality
associated with differences between the cultivated and wild pools in sequence diversity) in the

cultivated pool of genotypes and SNPs showing a significant association with berry weight
variation were found in the flb region (figure 5). Moreover, LD was found in this region, the
genes under selection presenting intragenic LD and intergenic LD with nearby genes (figure
6), which strengthened the hypothesis that they might be under selection [48]. Like in
Fournier-Level et al [55], no LD was however observed between the six out of eight genes
possibly under selection. It is well known that the LD extent varies between the organisms
and genomic regions [56]. In grapevine, a recent preliminary genome wide study confirmed
the low extent of LD in average (less than 3-10 kb), suggesting a large effective size in the
grapevine population at the origin of the current domesticated pool [57]. However, in recent
history, vegetative propagation and long intervals between generations may have reduced the
impact of recombination, maintaining extensive linkage disequilibrium in some regions under
selection [58].
The significant genetic associations found between berry weight variation and SNPs in this
region were not found in the fragments putatively under selection. It is still possible that one
of these genes is involved into the berry weight variation and that the causative sequence
polymorphism was not in the exon fragments sequenced. Indeed, trait variation is often due to
sequence variation in regulatory regions (see for instance [9,11,55]) and such variant sites
may be more tightly linked to a neighbor gene. Interestingly, the orthologs in Aradidopsis for
the six out of eight gene with signature of selection (At1g76540 for VVC2946A, At1g76400
for VV05791A, At1g42970 for VVC2897A, At1g42540 for VV05785A, At5g43820 for
VVC2901 and At1g20696 for VVC2892A) and for the two genes with SNPs associated with
berry weight variation (At5g24306 for VV05786A and At1g42440 for VV05775A), are all
expressed in flowers and showed a peak of expression at the beginning or during the
flowering (urgv.evry.inra.fr/projects/FLAGdb++). In tomato, the genes involved into fruit size
variation have been shown to be expressed in very early stages of its development, starting at
floral development [2,11]. Finally, only one gene fragment, VVC2897A, might be under
purifying selection in the cultivated pool with a major haplotype in cultivated pool and a LD
extended to a neighbor gene which present a SNP significantly associated with berry weight
variation (figure 5, figure 6). This would fit with the hypothesis that, like in tomato, the
selection of a new haplotype by humans would have ensured the transition from berries with
little flesh in wild grapevines to berries with more flesh in cultivated grapevines [2,11]. The
real involvement of this gene into berry size variation and in the domestication syndrome
remains however to be proven.

Conclusions
While searching for SNP markers in coupling with the fleshless berry mutation, we observed
the occurrence of a 1 Mb homozygous region, not associated with repetitive sequences, in the
grapevine otherwise highly heterozygous genome. We demonstrated the feasibility to use
BAC-FISH on the very small grapevine chromosomes and provided a specific probe for the
identification of chromosome 18 on cytogenetic map. Using this method, we showed that the
observed homozygosity was not due to a large deletion.
We then searched for signatures of domestication for berry weight along the flb region by re-
sequencing 69 gene fragments in 26 domesticated and seven wild V. vinifera genotypes. We
found putative signatures of selection associated with significant differences in nucleotide
diversity between the cultivated and the wild pool only in one gene (VVC2897A) and also
SNPs significantly associated with berry weight variation in three other genes among which
one is in DL with VVC2897A. The involvement of these four genes into berry weight
variation in grapevine remains to be proved by further functional experiments. In addition, we
detected 554 SNPs along the flb region. These polymorphisms could serve to develop a
genotyping chip useful for a future fine mapping of the flb gene in a F2 population and for the
analysis of genetic diversity in larger sets of wild and cultivated genotypes.
Authors’ contributions
CH designed the primers for fragment re-sequencing, participated to their sequencing,
analyzed the results, chose the BAC and prepared the root tips for the FISH, draft and
corrected the paper. RB, M-CLP and DB were responsible for the sequencing of the
fragments. RB and AC participated to the sequence analysis and made the RT-PCR
experiment. JC and LT analyzed the SSR and genotyped SNP polymorphism. CG and AD
helped with bio-informatics (scripts, database queries…). J-PP and RB generated the set of
reference fragment sequences along the genome. PT, TL, and AND provided the DNA for the
core-collection and plant phenotypes. M-SV and OC did the BAC-FISH experiments. A-FAB
design the experiment, supervised it, drafted and corrected the manuscript. All authors read
and approved the final manuscript.

Aknowledgements
This study was supported by INRA, ANR and the French Ministry of Research. We thank
Isabelle Le Clainche, Audrey Weber, Sylvain Santoni, Christophe Lepage and all the team of
the Vassal germplasm collection for technical assistance; Stéphane Nicolas, Aurélie
Siberchicot, Christine Cierco and Brigitte Mangin for providing a R routine for LD
calculation and helpful discussions; Marie-Laure Martin Magniette for help in the statistical
analysis, Dr Mark R. Thomas from the CSIRO Plant Industry, Australia for providing
unpublished DNA marker information and Loïc Le Cunff for helpful discussions.
References
[1] Champagnol F: Critères de qualité de la vendange. In Oenologie, Fondements
Scientifiques et Technologiques. Edited by Flanzy C. Paris: Lavoisier Tec Do; 1998:653-659
[2] Tanksley SD: The genetic, developmental, and molecular bases of fruit size and shape
variation in tomato. Plant Cell 2004, 16:181-189
[3] Lozano R, Giménez E, Cara B, Capel J, Angosto T: Genetic analysis of reproductive
development in tomato. Int J Dev Biol 2009, 53:1635-1648
[4] Fridman E, Carrari F, liu Y-S, Fernie A, Zamir D: Zooming in on a quantitative trait for
for tomato yield using interspecific introgressions. Science 2004, 305:1786-1789
[5] Causse M, Duffe P, Gomez M-C, Buret M, Damidaux R, Zamir D, Gur A, Chevalier C,
Lemaire-Chamley M, Rothan C: A genetic map of candidate genes and QTLs involved in
tomato fruit size and composition. J Exp Bot 2004, 55:1671-1685
[6] Lippman ZB, Semel Y, Zamir D: An integrated view of quantitative trait variation
using tomato interspecific introgression lines. Curr Opin Genet & Dev 2007, 17:545-552
[7] Chaïb J, Lecomte L, Buret M, Causse M: Stability over genetic backgrounds,
generations and years of quantitative trait locus (QTLs) for organoleptic quality in
tomato. Theor Appl Genet 2006, 112:934-944
[8] Menda N, Semel Y, Peled D, Eshed Y, Zamir D: In silico screening of a saturated
mutation library of tomato. The Plant J 2004, 38:861-872
[9] Frary A, Nesbitt TC, Frary A, Grandillo S, van der Knaap E, Cong B, Liu J, Meller J,
Elber R, Alpert KB, Tanksley SD: fw2.2: A Quantitative Trait Locus key to the evolution
of tomato fruit size. Science 2000, 289:85-88
[10] Bertin N, Causse M, Brunel B, Tricon D, Genard M: Identification of growth processes
involved in QTLs for tomato fruit size and composition. J Exp Bot 2009, 60:237-248
[11] Cong B, Barrero LS, Tanksley SD: Regulatory change in YABBY-like transcription
factor led to evolution of extreme fruit size during tomato domestication. Nat Genet 2008,
40:800-804
[12] Cheniclet C, Rong WY, Causse M, Frangne N, Bolling L, Carde J-P, Renaudin J-P: Cell
expansion and endoreduplication show a large genetic variability in pericarp and
contribute strongly to tomato fruit growth. Plant Physiol 2005, 139:1984-1994
[13] This P, Lacombe T, Thomas MR: Historical origins and genetic diversity of wine
grapes. Trends Genet 2006, 22:511-519
[14] Boursiquot JM, Dessup M, Rennes C: Distribution des principaux caractères
phénologiques, agronomiques et technologiques chez Vitis vinifera L. Vitis 1995, 34:31-
35
[15] Ollat N, Diakou-Verdin P, Carde J-P, Barrieu F, Gaudillère J-P, Moing A: Grape berry
development : a review. J Int Sci Vigne Vin 2002, 36:109-131
[16] Doligez A, Bouquet A, Danglot Y, Lahogue F, Riaz S, Meredith P, Edwards J, This P:
Genetic mapping of grapevine (Vitis vinifera L.) applied to the detection of QTLs for
seedlessness and berry weight. Theor Appl Genet 2002, 105:780-795
[17] Cabezas JA, Cervera MT, Ruiz-Garcia L, Carreno J, Martinez-Zapater JM: A genetic
analysis of seed and berry weight in grapevine. Genome 2006, 49:1572-1585
[18] Mejia N, Gebauer M, Muñoz L, Hewstone N, Muñoz C, Hinrichsen P: Identification of
QTLs for seedlessness, berry size, and ripening date in a seedless x seedless progeny. Am
J Enol Vitic 2007, 58:499-507
[19] Costantini L, Battilana J, Lamaj F, Fanizza G, Grando M: Berry and phenology-related
traits in grapevine (Vitis vinifera L.) From Quantitative Trait Loci to underlying genes. BMC Plant Biology 2008, 17:8-38
[20] Fernandez L, Romieu C, Moing A, Bouquet A, Maucourt M, Thomas MR, Torregrosa L:
The grapevine fleshless berry mutation. A unique genotype to investigate differences
between fleshy and nonfleshy fruit. Plant Physiol 2006, 140:537-547
[21] Fernandez L, Doligez A, Lopez G, Thomas MR, Bouquet A, Torregrosa L: Somatic
chimerism, genetic inheritance, and mapping of the fleshless berry (flb) mutation in
grapevine (Vitis vinifera L.). Genome 2006, 49:721-728
[22] Terral J-F, Tabard E, Bouby L, Ivorra S, Pastor T, Figueiral I, Picq S, Chevance J-B,
Jung C, Fabre L, Tardy C, Compan M, Bacilieri R, Lacombe T, This P: Evolution and
history of grapevine (Vitis vinifera) under domestication: new morphometric
perspectives to understand seed domestication syndrome and reveal origins of ancient
European cultivars. Annals of Botany 2010, 105:443-55
[23] Lecunff L, Fournier-Level A, Laucou V, Vezzulli S, Lacombe T, Adam-Blondon A-F,
Boursiquot J-M, This P: Construction of nested core collections to optimize the

exploitation of natural diversity in Vitis vinifera L. subsp sativa. BMC Plant Biology 2008,
2:8-31
[24] Jaillon O, Aury J-M, Noel B, Policriti A, Clepet C, Casagrande A, Choisne N, Aubourg
S, Vitulo N, Jubin C, Vezzi A, Legeai F, Hugueney P, Dasilva C, Horner D, Mica E, Jublot D,
Poulain J, Bruyere C, Billault A, Segurens B, Gouyvenoux M, Ugarte E, Cattonaro F,
Anthouard V, Vico V, Del Fabbro C, Alaux M, Di Gaspero G, Dumas V, Felice N, Paillard S,
Juman I, Moroldo M, Scalabrin S, Canaguier A, Le Clainche I, Malacrida G, Durand E,
Pesole G, Laucou V, Chatelet P, Merdinoglu D, Delledonne M, Pezzotti M, Lecharny A,
Scarpelli C, Artiguenave F, Pé E, Valle G, Morgante M, Caboche M, Adam-Blondon A-F,
Weissenbach J, Quétier F, Wincker P: The grapevine genome sequence suggests ancestral
hexaploidization in major angiosperm phyla. Nature 2007, 449:463-468
[25] Rozen S, Skaletsky HJ: Primer3 on the WWW for general users and for biologist
programmers. Methods Mol Biol 2000, 132:365-86
[26] Philippe R, Courtois B, McNally KL, Mournet P, El-Malki R, Le Paslier MC, Fabre D,
Billot C, Brunel D, Glaszmann JC, This D: Structure, allelic diversity and selection of Asr
genes, candidate for drought tolerance, in Oryza sativa L. and wild relatives. Theor Appl
Genet 2010, 121:769-787
[27] Salmaso M, Malacarne G, Troggio M, Faes G, Stefanini M, Grando MS, Velasco R: A
grapevine (Vitis vinifera L.) genetic map integrating the position of 139 expressed genes. Theor Appl Genet 2008, 116:1129-1143
[28] Thomas MR, Cain P, Scott NS: DNA Typing of Grapevines. A universal methodology
and database for describing cultivars and evaluating genetic relatedness. Plant Mol Biol
1994, 25:939-949
[29] Reid KE, Olsson N, Schlosser J, Peng F, Lund ST: An optimized grapevine RNA
isolation procedure and statistical determination of reference genes for real-time RT-
PCR during berry development. BMC Plant Biology 2006, 14:6-27
[30] Leflon M, Eber F, Letanneur JC, Chelysheva L, Coriton O, Huteau V, Ryder CD,
Barker G, Jenczewski E, Chevre AM: Pairing and recombination at meiosis of Brassica
rapa (AA) x Brassica napus (AACC) hybrids. Theor Appl Genet 2006, 113:1467-1480
[31] Gerlach W, Bedbrook J: Cloning and characterization of ribosomal RNA genes from
wheat and barley. Nucl Acids Res 1979, 7:1869-1885
[32] Takahashi M, Matsuda F, Margetic N, Lathrop M: Automated identification of single
nucleotide polymorphisms from sequencing data. Journal of Bioinformatics and
Computational Biology 2003, 1:253-265
[33] Staden, R: The Staden Sequence Analysis Package. Molecular Biotechnology 1996,
5:233-241
[34] Tajima F: Statistical method for testing the neutral mutation hypothesis by DNA
polymorphism. Genetics 1989, 123:585-595

[35] Roger AR, Huff C: Linkage disequilibrium between loci with unknown phase.
Genetics 2009, 182:839-844
[36] Pritchard JK, Stephens M, Donnelly P: Inference of population structure using
multilocus genotype data. Genetics 2000, 155: 945-959
[37] Adam-Blondon AF, Roux C, Claux D, Butterlin G, Merdinoglu D, This P: Mapping 245
SSR markers on the Vitis vinifera genome: a tool for grape genetics. Theor Appl Genet
2004, 109:1017-1027
[38] Di Gaspero G, Cipriani G, Adam-Blondon AF, Testolin R: Linkage maps of grapevine
displaying the chromosomal locations of 420 microsatellite markers and 82 markers for
R-gene candidates. Theor Appl Genet 2007, 114:1249-1263
[39] Lamoureux D, Bernole A, Le Clainche I, Tual S, Thareau V, Paillard S, Legeai F, Dossat
C, Wincker P, Oswald M, Merdinoglu D, Vignault C, Delrot S, Caboche M, Chalhoub B,
Adam-Blondon AF: Anchoring of a large set of markers onto a BAC library for the
development of a draft physical map of the grapevine genome. Theor Appl Genet 2006,
113: 344-356
[40] Riaz S, Dangl GS, Edwards KJ, Meredith CP: A microsatellite marker based
framework linkage map of Vitis vinifera L. Theor Appl Genet 2004, 108:864-872
[41] Troggio M, Malacarne G, Coppola G, Segala C, Cartwright DA, Pindo M, Stefanini M,
Mank R, Moroldo M, Morgante M, Grando MS, Velasco R: A dense single-nucleotide
polymorphism-based genetic linkage map of grapevine (Vitis vinifera L.).Anchoring
Pinot Noir Bacterial Artificial Chromosome Contigs. Genetics 2007, 176:2637-2650
[42] Vezzulli S, Micheletti D, Riaz S, Pindo M, Viola R, This P, Walker MA, Troggio M,
Velasco R: A SNP transferability survey within the genus Vitis. BMC Plant Biology 2008,
16:8-128
[43] Velasco R, Zharkikh A, Troggio M, Cartwright DA, Cestaro A, Pruss D, Pindo M,
Fitzgerald LM, Vezzulli S, Reid J, Malacarne G, Iliev D, Coppola G, Wardell B, Micheletti
D, Macalma T, Facci M, Mitchell JT, Perazzolli M, Eldredge G, Gatto P, Oyzerski R, Moretto
M, Gutin N, Stefanini M, Chen Y, Segala C, Davenport C, Demattè L, Mraz A, Battilana J,
Stormo K, Costa F, Tao Q, Si-Ammour A, Harkins T, Lackey A, Perbost C, Taillon B, Stella
A, Solovyev V, Fawcett JA, Sterck L, Vandepoele K, Grando SM, Toppo S, Moser C,
Lanchbury J, Bogden R, Skolnick M, Sgaramella V, Bhatnagar SK, Fontana P, Gutin A, Van
de Peer Y, Salamini F, Viola R: A high quality draft consensus sequence of the genome of
a heterozygous grapevine variety. PLoS ONE 2007, 2:e1326
[44] Chaïb J, Torregrosa L, Mackenzie D, Corena1 P, Bouquet A, Thomas MR: The grape
microvine – a model system for rapid forward and reverse genetics of grapevines. The
Plant J 2010, 62:1083-1092
[45] Di Vecchi-Staraz M, Bandinelli R, Boselli M, This P, Boursiquot JM, Laucou V,
Lacombe T, Vares D: Genetic structuring and parentage analysis for evolutionary studies
in grapevine: Kin group and origin of the cultivar Sangiovese revealed. Journal of the
American Society for Horticultural Science 2007, 132:514-524
[46] Puchta H: The repair of double-strand breaks in plants: mechanisms and
consequences for genome evolution. J Exp Bot 2005, 56:1-14
[47] Miller JC, Tankley SD: RFLP analysis of phylogenetic relationships and genetic
variation in the genus Lycopersicon. Theor Appl Genet 1990, 80:437-448
[48] Palaisa KA, Morgante M, Williams M, Rafalski A: Long-range patterns of diversity
and linkage disequilibrium surrounding the maize Y1 gene are indicative of an
asymmetric selective sweep. PNAS 2004, 101:9885-9890
[49] Aradhya MK, Dangl GS, Prins BH, Boursiquot J-M, Walker MA, Meredith CP, Simon
CJ: Genetic structure and differentiation in cultivated grape, Vitis vinifera L. Genet Res
Camb 2003, 81:179-192
[50] Arroyo-Garcia R, Ruiz-Garcia L, Bolling L, Ocete R, Lopez MA, Arnold C, Ergul A,
Söylemezoglu G, Uzun HJ, Cabello F, Ibanez J, Aradhya MK, Atanassov I, Balint S, Cenis
JL, Costantini L, Gorislavets S, Grando MS, Klein BY, Govern PEM, Merdinoglu D, Pejic I,
Pelsy F, Primikirios N, Risovannaya V, Roubelakis-Angelakis KA, Snoussi H, Sotiri P,
Tamhankar S, This P, Troshin L, Malpica JM, Lefort F, Martinez-Zapater JM: Multiple
origins of cultivated grapevine (Vitis vinifera L. ssp. sativa) based on chloroplast DNA
polymorphisms. Molecular Ecology 2006, 15:3707-3714
[51] Grassi F, De Mattia F, Zecca G, Sala F, Labra M: Historical isolation and Quaternary
range expansion of divergent lineages in wild grapevine. Biological Journal of the Linnean
Society 2008, 95:611-619
[52] Levadoux L: Les Populations sauvages et cultivées de Vitis vinifera L. Annales de
l'Amélioration de Plantes 1956, 6:59-118
[53] Arnold C, Gillet F, Gobat JM: Occurrence of the wild vine Vitis vinifera ssp. silvestris
in Europe. Vitis 1998, 37:159-170
[54] Di Vecchi-Staraz M, Laucou V, Bruno G, Lacombe T, Gerber S, Bourse T, Boselli M,
This P: Low level of pollen-mediated gene flow from cultivated to wild grapevine:
consequences for the evolution of the endangered subspecies Vitis vinifera L. subsp.
silvestris. J Heredity 2009, 100:66-75
[55] Fournier-Level A, LeCunff L, Gomez C, Doligez A, Ageorges A, Roux C, Bertrand Y,
Souquet JM, Cheynier V This P: Quantitative genetic bases od anthocyanin variation in
grape (Vitis vinifera L. ssp. sativa) berry: a quantitative trait locus to quantitative trait
nucleotide integrated study. Genetics 2009, 183:1127-1139
[56] Gupta P.K, Rustgir S, Kulwal PL: Linkage disequilibrium and association studies in
higher plants: Present status and future prospects. Plant Molecular Biology 2005, 57:461-
485
[57] Myles S, Chia J-M, Hurwitz B, Simon C, Zhong GY, Buckler E, Ware D: Rapid
genomic gharacterization of the genus Vitis. Plos One 2010, 5:e8219

[58] Barnaud A, Lacombe T and Doligez A: Linkage disequilibrium in cultivated
grapevine, Vitis vinifera L. Theor Appl Genet 2009, 112:708-716
Figures
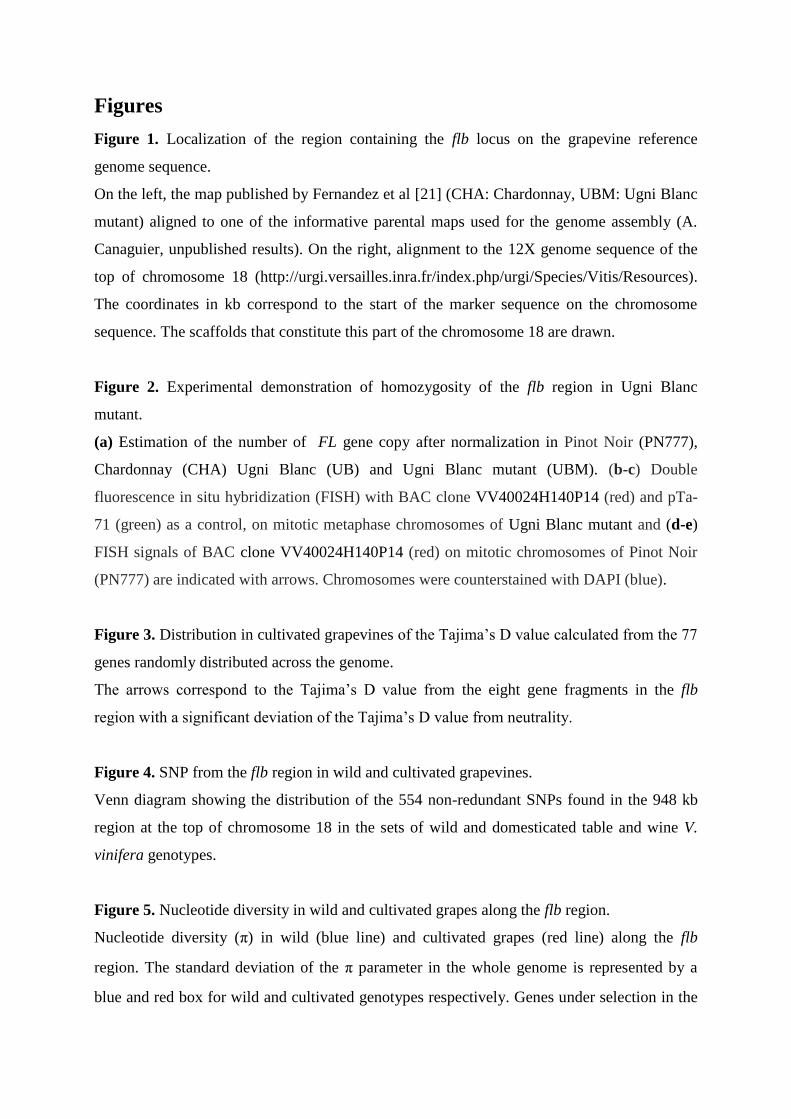
Figure 1. Localization of the region containing the flb locus on the grapevine reference
genome sequence.
On the left, the map published by Fernandez et al [21] (CHA: Chardonnay, UBM: Ugni Blanc
mutant) aligned to one of the informative parental maps used for the genome assembly (A.
Canaguier, unpublished results). On the right, alignment to the 12X genome sequence of the
top of chromosome 18 (http://urgi.versailles.inra.fr/index.php/urgi/Species/Vitis/Resources).
The coordinates in kb correspond to the start of the marker sequence on the chromosome
sequence. The scaffolds that constitute this part of the chromosome 18 are drawn.
Figure 2. Experimental demonstration of homozygosity of the flb region in Ugni Blanc
mutant.
(a) Estimation of the number of FL gene copy after normalization in Pinot Noir (PN777),
Chardonnay (CHA) Ugni Blanc (UB) and Ugni Blanc mutant (UBM). (b-c) Double
fluorescence in situ hybridization (FISH) with BAC clone VV40024H140P14 (red) and pTa-
71 (green) as a control, on mitotic metaphase chromosomes of Ugni Blanc mutant and (d-e)
FISH signals of BAC clone VV40024H140P14 (red) on mitotic chromosomes of Pinot Noir
(PN777) are indicated with arrows. Chromosomes were counterstained with DAPI (blue).
Figure 3. Distribution in cultivated grapevines of the Tajima’s D value calculated from the 77
genes randomly distributed across the genome.
The arrows correspond to the Tajima’s D value from the eight gene fragments in the flb
region with a significant deviation of the Tajima’s D value from neutrality.
Figure 4. SNP from the flb region in wild and cultivated grapevines.
Venn diagram showing the distribution of the 554 non-redundant SNPs found in the 948 kb
region at the top of chromosome 18 in the sets of wild and domesticated table and wine V.
vinifera genotypes.
Figure 5. Nucleotide diversity in wild and cultivated grapes along the flb region.
Nucleotide diversity (π) in wild (blue line) and cultivated grapes (red line) along the flb
region. The standard deviation of the π parameter in the whole genome is represented by a
blue and red box for wild and cultivated genotypes respectively. Genes under selection in the

cultivated pool of genotypes are indicated with black arrows and the gene under purifying
selection showing higer diversity in wild genotypes than in cultivated genotypes with red
arrows. The two sub-regions with regard to LD patterns are underlined with grey arrows.
Gene fragments with SNP significantly associated with berry weight variation are highlighted
with a star.
Figure 6. Linkage disequilibrium along the second flb sub-region in the cultivated and wild
compartments.
LD plots on R2 values (above the diagonal) and associated P-value (below the diagonal)
along the second sub-region containing the 4 gene fragments under selection in the cultivated
(A) and wild (B) compartments. The gene fragments re-sequenced are represented by
alternate grey and blue boxes, which size is proportional to the number of polymorphic SNP
used in the LD estimation. The gene fragments under selection are in black boxes and
numbered as follows: “1” for VV05791A, “2” for VVC2897A, “3” for VV05785A, “4” for
VVC2901A, “5” for VVC2885A and “6” for VVC2892A. The gene fragments in LD with
these genes are pointed with small letter “a” for VV05782A, “b” for VV05781A, “c” for
VV05780A, “d” for VV05786A, “e” for VVC2907A and “f” for VVC2891A. Gene fragments
with SNP significantly associated with berry weight variation are highlighted with a star.
Figure 7. Association tests for berry weight.
Level of association between SNP markers and the average berry weight along the flb region,
in the cultivated V. vinifera sample. The Bonferroni threshold is equal to 1.12E-4.

Tables
Table 1. Marker polymorphism observed between cultivars Chardonnay and Ugni Blanc mutant on the top of the chromosome 18 (12X genome
assembly).
Position on the chromosome 18 (bp) Marker name Marker type Chardonnay
$ Ugni Blanc mutant
$
Scaffold Start End
122 212555 212699 VVS50 SSR H h
122 213864 214083 VVS51 SSR H h
122 226346 226575 VVS52 SSR h h
122 230668 230769 VVS53 SSR H h
122 308176 308256 1036L11F SNP h h
122 321067 321135 VMC3E5 SSR h h
122 388123 388423 VVIN03 SSR h h
122 423185 423271 1038A12F SNP h h
122 494374 494464 VVS54 SSR H h
122 497723 498045 IN0954 CAPS h h
122 670015 670200 VVS56 SSR h h
122 804498 804634 VVS57 SSR H h
122 877751 878077 VVCS1H085H20R1-1 SSR h h
122 895761 895846 1073P15R SNP h h
122 901775 901934 VVS58 SSR H h
122 948267 948387 VMC2A3* SSR H h
1 1226489 1226647 VVCS1H066N21R1-1 SSR H h
1 1297892 1298020 C011 SSR H h
1 1452854 1453153 VVCS1H085F05F1-1 SSR H H
1 2912753 2913088 VVIB31 SSR h h
1 3505999 3506060 VVIV16 SSR H h
$ H: for heterozygous marker and h: for homozygous marker

* From Fernandez et al [21]

Table 2. Sequence polymorphism observed between cultivars Chardonnay and Ugni Blanc mutant on the top of the chromosome 18 (12X
genome assembly).
Position on the 12X genome
assembly (bp)
Fragment
name
Number of
extremities
sequenced
Sequence Length Homozygous
polymorphic sites
between Chardonnay
and Ugni Blanc mutant
Chardonnay: number
of heterozygous
Ugni Blanc mutant:
number of
heterozygous
Scaffold Start End Chardonnay
Ugni
Blanc
mutant*
SNP INDEL SNP INDEL SNP INDEL
122 85127 85871 VVC2982A 2 1,553 1,553 0 0 2 0 0 0
122 161551 161929 VV05806A 2 1,168 1,168 0 0 0 0 0 0
122 211001 211674 VVC2974A 1 969 969 0 0 4 0 0 0
122 261445 262084 VV05805A 2 1,562 1,562 0 0 10 0 0 0
122 299201 299664 VVC2967B 2 911 911 0 0 2 0 0 0
122 321452 321822 VV05803A 2 1,077 1,077 0 0 7 0 0 0
122 372496 372799 VV05800A 2 683 683 1 0 2 0 0 0
122 382744 382940 VVC2956A 2 452 876 0 0 2 1 0 0
122 399382 399793 VVC2953A 2 769 1,505 0 0 0 1 0 0
122 429725 431077 VV05799A 2 1,539 1,539 2 0 1 0 0 0
122 497378 497760 VVC2942A 2 933 1,255 0 0 5 1 0 0
122 510613 510723 VV05798A 1 1,464 1,464 0 0 4 0 0 0
122 549494 550104 VV05796A 2 909 909 1 0 2 0 0 0
122 615081 615296 VV05793A 1 407 1,057 0 0 1 1 0 0
122 668381 668534 VV05788A 1 914 1,053 0 0 2 1 0 0
122 702907 703637 VV05785A 1 1,090 1,446 0 0 0 0 0 0
122 776756 777088 VV05782A 1 413 1,434 2 0 2 1 0 0
122 818661 819292 VV05781A 1 830 1,495 0 0 1 1 0 0
122 898379 898848 VV05779A 1 1,565 1,565 1 0 1 0 0 0
122 928463 929045 VV05777A 2 1,030 1,520 1 0 1 1 0 0
122 949921 950653 VV05775A 1 755 1,116 1 0 1 0 0 0
122 1009539 1010696 VVC2869A 1 137 498 0 1 0 1 0 0

122 1054896 1056021 VVC2865A 1 136 136 0 0 1 1 0 0
1 1084916 1085337 VVC15574A 2 161 161 0 0 3 0 0 0
1 1098027 1099246 VVC15572A 2 1,700 1,700 0 0 0 0 0 0
1 1104978 1106307 VVC15571A 2 435 986 0 0 0 0 0 0
41 23,562 29,638 9 1 54 10 0 0
* The column Ugni Blanc mutant stands for both Ugni Blanc and Ugni Blanc mutant, as no differences were observed between them
The table lines in bold characters correspond to the sequence fragments below marker VMC2A3..

Table 3. Nucleotide diversity in the wild and cultivated Vitis vinifera genotypes for the gene fragments along the flb region presenting a
significant deviation from neutrality of the Tajima’s D parameter.
Wild Domesticated Wine Table
Fragment Start
12X π
π
standard
error
π
π
standard
error
Tajima’s
D§
π
π
standard
error
Tajima’s
D§
π
π
standard
error
Tajima’s
D§
VVC2981A 94259 0.0007 0.0001 0.0014 0.0005 -2.0* 0.0013 0.0003 -0.5 0.0016 0.0008 -2.2**
VVC2946A 444180 0.0030 0.0004 0.0043 0.0011 -1.3 0.0035 0.0017 -2.2** 0.0047 0.0016 -1.2
VV05791A 638081 0 0 0.0040 0.0002 0.6 0.0034 0.0005 1.1 0.0037 0.0003 2.4*
VVC2897A 682572 0.0173 0.0062 0.0044 0.0017 -2.1* 0.0070 0.0042 -2.1 0.0027 0.0004 -0.7
VV05785A 702907 0.0008 0.0004 0.0003 0.0002 -1.9* 0.0003 0.0002 -1.5 0.0002 0.0001 -1.5
VVC2901A 742593 0.0082 0.0035 0.0156 0.0005 3.1** 0.0157 0.0011 2.4* 0.0144 0.0079 2.6**
VVC2885A 746740 0.0115 0.0037 0.0159 0.0007 2.7** 0.0167 0.0012 2.8** 0.0145 0.0020 1.5
VVC2892A 808955 0.0009 0.0003 0.0109 0.0007 2.2 * 0.0102 0.0011 2.0 0.0119 0.0009 2.0
§ * 0.01<P-value<0.05 and ** 0.001<P-value<0.01

Table 4. Summary of the sequence polymorphism observed in cultivated and wild V. vinifera genotypes for 69 sequence fragments along 948
kb in the flb region and for 77 sequence fragments spread along the whole genome.
Average number
of genotypes /
fragment
Average number of
segregating sites /
fragment
Average number of
haplotypes / fragment
Average and standard
deviation of π
Wild (n=7)
Flb region 5.9 2.8 2.2 0.0020 +/- 0.0006
Whole genome 6.7 4.8 3.6 0.0027 +/- 0.0025
Cultivated (n=26)
Flb region /Wine (n=15) 10.5 6.2 4.3 0.0035 +/- 0.0007
Flb region/Table (n=11) 12.5 6.6 4.7 0.0035 +/- 0.0007
Flb region /Wine + Table 24.8 8 5.8 0.0041 +/- 0.0004
Whole genome / Wine + Table 27.0 10.1 8.3 0.0035 +/- 0.0023

Table 5. SNPs significantly associated with the variation of berry weight in the cultivated and wild pool of Vitis vinifera.
Fragment Position of the SNP P-value$ Feature SNP type SNP frequency Putative function
VVC2966A 307,938 6.44E-05 CDS [A/T] 5.00% Unknown
VV05786A 687,166 1.87E-06 CDS [A/G]* 9.00% Protein kinase
VV05777A 928,516 6.18E-05 Intron [T/G] 8.00% Catalase
VV05775A 949,972 3.78E-06 Intron [A/T] 9.00% Ribosome biogenesis protein
$ Significant P-value after Bonferroni correction (for α=0.05)
* Non-synonymous mutation

Additional files
Additional file 1: supplemental table S1 (Pdf format file).
Plant material.
Description: List of the grapevine accessions used in the study, with their average berry weight at maturity.
Additional file 2: supplemental table S2 (Excel format file).
Markers and sequence fragments along the flb region.
Description: List and localization on the grapevine genome sequence of the gene fragments sequenced (SEQ) and of the markers used for
genotyping (SSR, CAPS, SNP) together with the primers used for amplification.
Additional file 3: supplemental table S3 (Excel format file).
Sequence fragments randomly spread along the genome.
Description: List and localization on the grapevine genome sequence of the random gene fragments sequenced spread all over the genome,
diversity and Tajima's D parameters obtained in the cultivated and the wild pools of Vitis vinifera.
Additional file 4: supplemental table S4 (Pdf format file).
qPCR validation of homozygosity in the flb region in Ugni Blanc mutant.
Description: Estimation of the initial number of DNA quantity of the FL gene and of the HMGCoA gene family in Pinot Noir (PN777),
Chardonnay (CHA), Ugni Blanc mutant (UBM) and Ugni Blanc (UB), before and after normalization by the result obtained for the HMGCoA
genes.

Additional file 5: supplemental table S5 (Excel format file).
Sequence diversity along the flb region in cultivated and wild grapevines.
Description: Parameter of diversity obtained for the 69 genome fragments at the top of chromosome 18 in the cultivated and the wild
compartment of Vitis vinifera and details of the shared and specific insertions/deletions (INDELs) and segregating SNP sites in wild V. vinifera
genotypes and table and wine cultivars of domesticated V. vinifera, numbers of shared and unshared SNPs or INDELs between wild and
cultivated genotypes are also indicated.
Additional file 6: supplemental figure S1 (Pdf format file).
Nucleotide diversity in the cultivated (table and wine) and wild compartments along the flb region.
Description: Nucleotide diversity ( ) in the table grapes (green line), the wine grapes (purple line) and the wild grapes (blue line) along the flb
region
Additional file 7: supplemental figure S2 (Pdf format file).
Linkage disequilibrium along the flb region in cultivated and wild compartments.
Description: LD plots on R2 values (above the diagonal) and associated P-value (below the diagonal) along the entire flb region in cultivated (A)
and wild compartments (B). The gene fragments re-sequenced are represented by alternate grey and blue boxes, which size is proportional to the
number of polymorphic SNP used in the LD estimation. The black arrow represents the orientation of the region from the telomere (on the left)
to the centromere.
Additional file 8: supplemental table S6 (Pdf format file).

List of gene fragments and their associated number of SNPs used for the estimation of LD in the flb region, in cultivated and wild V. vinifera
pools.


Additional files provided with this submission:
Additional file 1: Houel_etal_TableS1.pdf, 20Khttp://www.biomedcentral.com/imedia/6260516844971831/supp1.pdfAdditional file 2: Houel_etal_TableS2.xls, 87Khttp://www.biomedcentral.com/imedia/1752166702497184/supp2.xlsAdditional file 3: Houel_etal_TableS3.xls, 50Khttp://www.biomedcentral.com/imedia/1173545157497184/supp3.xlsAdditional file 4: Houel_etal_TableS4.pdf, 9Khttp://www.biomedcentral.com/imedia/8108866354971843/supp4.pdfAdditional file 5: Houel_etal_TableS5.xls, 99Khttp://www.biomedcentral.com/imedia/4022778674971843/supp5.xlsAdditional file 6: Houel_etal_SupFigure1.tif, 201Khttp://www.biomedcentral.com/imedia/3927824764971843/supp6.tiffAdditional file 7: Houel_etal_SupFigure2.tif, 441Khttp://www.biomedcentral.com/imedia/3797019794971843/supp7.tiffAdditional file 8: Houel_etal_TableS6.pdf, 62Khttp://www.biomedcentral.com/imedia/1041004954971844/supp8.pdf