Embed Size (px)
Citation preview

BioMed CentralBMC Microbiology
ss
Open AcceResearch articleComparative gene expression profiling in two congenic mouse strains following Bordetella pertussis infectionSander Banus1,2, Rob J Vandebriel2, Jeroen LA Pennings2, Eric R Gremmer2, Piet W Wester2, Henk J van Kranen2, Timo M Breit3, Peter Demant4, Frits R Mooi1, Barbara Hoebee2 and Tjeerd G Kimman*1Address: 1Laboratory for Infectious Diseases and Screening, National Institute of Public Health and the Environment (RIVM), PO Box 1, 3720 BA Bilthoven, The Netherlands, 2Laboratory of Toxicology, Pathology, and Genetics, National Institute of Public Health and the Environment (RIVM), PO Box 1, 3720 BA Bilthoven, The Netherlands, 3Microarray Department (MAD), Swammerdam Institute for Life Sciences, Faculty of Science, University of Amsterdam, The Netherlands and 4Department of Molecular and Cellular Biology, Roswell Park Cancer Institute, Buffalo, New York 14263, USA
Email: Sander Banus - [email protected]; Rob J Vandebriel - [email protected]; Jeroen LA Pennings - [email protected]; Eric R Gremmer - [email protected]; Piet W Wester - [email protected]; Henk J van Kranen - [email protected]; Timo M Breit - [email protected]; Peter Demant - [email protected]; Frits R Mooi - [email protected]; Barbara Hoebee - [email protected]; Tjeerd G Kimman* - [email protected]
* Corresponding author
AbstractBackground: Susceptibility to Bordetella pertussis infection varies widely. These differences can partly be explained bygenetic host factors. HcB-28 mice are more resistant to B. pertussis infection than C3H mice, which could partially beascribed to the B. pertussis susceptibility locus-1 (Bps1) on chromosome 12. The presence of C57BL/10 genome on thislocus instead of C3H genome resulted in a decreased number of bacteria in the lung. To further elucidate the role ofhost genetic factors, in particular in the Bps1 locus, in B. pertussis infection, and to identify candidate genes within in thisregion, we compared expression profiles in the lungs of the C3H and HcB-28 mouse strains following B. pertussisinoculation. Twelve and a half percent of the genomes of these mice are from a different genetic background.
Results: Upon B. pertussis inoculation 2,353 genes were differentially expressed in the lungs of both mouse strains. Twohundred and six genes were differentially expressed between the two mouse strains, but, remarkably, none of these wereup- or down-regulated upon B. pertussis infection. Of these 206 genes, 17 were located in the Bps1 region. Eight of thesegenes, which showed a strong difference in gene expression between the two mouse strains, map to the immunoglobulinheavy chain complex (Igh).
Conclusion: Gene expression changes upon B. pertussis infection are highly identical between the two mouse strainsdespite the differences in the course of B. pertussis infection. Because the genes that were differentially regulated betweenthe mouse strains only showed differences in expression before infection, it appears likely that such intrinsic differencesin gene regulation are involved in determining differences in susceptibility to B. pertussis infection. Alternatively, suchgenetic differences in susceptibility may be explained by genes that are not differentially regulated between these twomouse strains. Genes in the Igh complex, among which Igh-1a/b, are likely candidates to explain differences insusceptibility to B. pertussis. Thus, by microarray analysis we significantly reduced the number of candidate susceptibilitygenes within the Bps1 locus. Further work should establish the role of the Igh complex in B. pertussis infection.
Published: 12 October 2007
BMC Microbiology 2007, 7:88 doi:10.1186/1471-2180-7-88
Received: 15 June 2007Accepted: 12 October 2007
This article is available from: http://www.biomedcentral.com/1471-2180/7/88
© 2007 Banus et al; licensee BioMed Central Ltd. This is an Open Access article distributed under the terms of the Creative Commons Attribution License (http://creativecommons.org/licenses/by/2.0), which permits unrestricted use, distribution, and reproduction in any medium, provided the original work is properly cited.
Page 1 of 13(page number not for citation purposes)

BMC Microbiology 2007, 7:88 http://www.biomedcentral.com/1471-2180/7/88
BackgroundBordetella pertussis is a gram-negative bacterium that cancause the respiratory disease known as pertussis orwhooping cough in humans. Susceptibility to this diseaseand its course vary widely between individuals [1]. Wehave previously shown that genetically divergent mousestrains differ in their response to B. pertussis infection,underlining that infection is influenced by host geneticfactors[2,3]. In addition, a role of several host genetic lociin the course of B. pertussis infection has been indicated,such as the toll-like receptor 4 (Tlr4) gene [2-5], the inter-feron gamma receptor gene [6], and three novel loci, B.pertussis susceptibility locus 1, 2, and 3 (Bps1, 2, and 3) [2]that showed linkage with the severity of infection.
We have used recombinant congenic mouse strains (RCS)as a tool to facilitate the mapping of low-penetrancequantitative trait loci that control complex traits such as aB. pertussis infection [7]. RCS are derived from two differ-ent inbred strains, the so-called background and donorstrain. After two backcrosses and subsequent brother-sis-ter mating, a set of RCS is created, with each strain con-taining 12.5% of the donor genome differentlydistributed across the background genome [8]. HcB/DemRCS of mice are derived from two backcrosses of theinbred mouse strains C3H/DISnA (C3H) as backgroundand C57BL/10ScSnA (B10) as donor strain, resulting in12.5% B10 genome across the C3H genome. The genomeof each HcB/Dem strain, thus, differs maximally 12.5%compared to the background strain (C3H) (Figure 1a)[9,10]. HcB-28 mice contained lower numbers of bacteriain their lungs seven days post-inoculation compared to
C3H mice. Subsequent genotyping led to the identifica-tion of the three susceptibility loci, Bps1, 2, and 3. Espe-cially Bps1 displayed strong linkage with susceptibility toB. pertussis infection. The Bps1 locus is located on chromo-some 12, spanning a region of 185 genes, of which one ormore genes have a dominant positive effect on the clear-ance of B. pertussis in the lung, and/or the reduction ofbacterial multiplication. However, the mechanism bywhich genes within this region influence the course ofinfection is not clear. Two other loci, Bps-2 and Bps-3,showed genetic interaction and are located on chromo-somes 5 and 11, respectively [2].
Although Bps-1 has not yet been validated, we believe thatthe significance of this locus warrants further study. Tofurther elucidate the role of host genetic factors, in partic-ular the Bps1 locus, in B. pertussis infection, and to identifycandidate genes within this region, we studied expressionprofiles in the lungs of mice following B. pertussis inocula-tion. The traditional approach for mapping genes in sus-ceptibility loci is a combination of positional cloning andlinkage analysis [11,12]. Although this strategy hasproven to be effective [7,13], the approach is quite costlyand animal-consuming. Previously we identified changesin gene expression in the lungs of C3H/DISnA mice afterB. pertussis infection, and we especially focused on differ-entially expressed genes in the lungs of infected and non-infected mice located in Bps1,-2, and -3 [14]. We foundthat the expression of 1,841 genes was significantlychanged upon B. pertussis infection. These genes areinvolved in various immune-related processes, such as theacute-phase response, antigen presentation, cytokine pro-
Differences between C3H/DISnA and HcB-28/Dem miceFigure 1Differences between C3H/DISnA and HcB-28/Dem mice. a) Illustration of the distribution pattern of B10 genome across the background genome of the C3H strain of the Recombinant Congenic Strain HcB-28/Dem. The HcB-28 strain was derived by crossings between mouse strains C3H/DISnA as background (displayed in grey) and C57BL/10 as donor (displayed in black). b) Mice (C3H/DISnA) were infected intranasally with B. pertussis strain B213. The lungs were removed seven days after inoculation, and the number of viable B. pertussis was determined. Bars represent the average number of bacteria in the lungs. Horizontal line indicates the significant difference between groups. Error bars indicate the Standard Deviation (SD).
C3H/DISnA HcB28/Dem5
CFU
(log 1
0)pe
r lun
g
P=0.0405
6
7
1 2 4 5 6 7 8 9 10
11 12 13 14 15 16 17 18 19 X
3
Bps-1
Page 2 of 13(page number not for citation purposes)

BMC Microbiology 2007, 7:88 http://www.biomedcentral.com/1471-2180/7/88
duction, inflammation, and apoptosis. Nine of the differ-entially expressed genes are located in Bps1, 13 are locatedin Bps-2, and 62 are located in Bps-3.
In the present study we compared the gene expressionprofiles in the lungs of two mouse strains, i.e. HcB-28/Dem and C3H, which showed a different course of B. per-tussis infection, in order to further identify candidate sus-ceptibility genes without the need for positional cloning.We hypothesized that the phenotypic differences dis-played by these mice in the response to B. pertussis canpartly be explained by a different gene expression profilebetween the mouse strains, and that this approach couldlead to the identification of candidate genes affecting thecourse of infection. Using this approach we reduced thenumber of candidate susceptibility genes within the Bps1locus.
MethodsExperimental designForty-eight female HcB-28/Dem and 48 female C3H/DISnA (the background strain of the HcB-28/Dem) micewere intranasally inoculated with 2*107 colony formingunits (CFU) of the streptomycin-resistant Tohama strainof B. pertussis (B213) in 40 µl Verwey medium (The Neth-erlands Vaccine Institute, Bilthoven, the Netherlands), oras a control with Verwey Medium only (total of 96 mice).One, three, and five days after inoculation, 8 infected and8 control mice were euthanized. To remove blood fromthe lungs, mice were perfused with phosphate-bufferedsaline (PBS, Tritium Microbiology, Veldhoven, the Neth-erlands). Subsequently, the lungs and trachea were col-lected [15,16]. For RNA extraction, the right lung wascollected in RNA stabilization reagent (RNAlater, Qiagen,Venlo, the Netherlands). For histological examination,the left lung was fixed intratracheally using 4% formalin.
The number of viable B. pertussis bacteria was determinedin the trachea to confirm a proper infection [17] (Notethat tracheal counts are not representative for bacterialclearance from the lungs.) To this end, approximately onecentimeter of the trachea was collected in 500 µl Verweymedium. Bacterial suspensions were diluted in Verweymedium and the number of CFU was determined by plat-ing on Bordet Gengou agar supplemented with 15%sheep blood and 30 µg/ml streptomycin (Tritium Micro-biology). Plates were incubated for 4 days at 35°C and theresulting colonies were counted using a ProtoCOL Colonycounter (Synbiosis, Cambridge, United Kingdom).
All B. pertussis-infected mice had between 102 and 105 CFUin the trachea during the first five days after inoculation,confirming an actual infection (data not shown).
For the analysis of intrinsic immunological and cellulardifferences between the two mouse strains, independentfrom infection, blood and spleen samples were collectedfrom five untreated female mice of both strains.
AnimalsBreeding pairs of C3H/DISnA and HcB-28/Dem were sup-plied by the Department of Molecular and Cellular Biol-ogy, Roswell Park Cancer Institute, Buffalo, New York.Female mice were bred to the appropriate numbers at ouranimal testing facility in Bilthoven, the Netherlands. Micewere acclimatized for at least one week before the start ofthe experiments. Mice received standard laboratory food(SRM-A, Hope Farms, Woerden, the Netherlands) and tapwater ad libitum. All animal experiments were approvedby the Institute's Animal Ethics Committee and were per-formed according to NIH guidelines [18] and Dutch legis-lation.
Clinical and pathological examinationsMice were weighed before inoculation, and subsequentlyevery day after inoculation to determine the relativechange in weight. Lung weights were determined postmortem as quantitative parameter for lung inflammation.Formalin-fixed lungs were embedded in paraplast(Monoject Inc., St Louis, MO). Sections (5 µm) werestained with hematoxylin-eosin. Lung lesions were exam-ined for infiltration of inflammatory cells in the peribron-chiolar space (peribronchiolitis), infiltration ofinflammatory cells in the alveoli (alveolitis), infiltrationof inflammatory cells in the perivascular space (perivascu-litis), hypertrophy of mucus-producing glands, free pro-tein (exudate), and eosinophilia. Lung lesions were scoredsemi-quantitatively as absent, minimal, slight, moderate,marked, or strong, as previously described [19].
Enumeration of cellular subsetsSpleens were harvested and weighed. Cell suspensionswere prepared and the number of nucleated cells perspleen was determined using a Coulter Counter Z2 (Beck-man Coulter, Mijdrecht, the Netherlands). The percentageof B- and T-cells, as well as T-cell subsets were determinedusing a fluorescence-activated cell sorter (FACS-Calibur,BD Biosciences, Alphen aan den Rijn, the Netherlands). T-cells were detected with phycoerythrin-labeled (PE) anti-CD3ε antibodies (Molecular probes, Invitrogen, Breda,the Netherlands). CD4+ T-cells were determined usingallophycocyanin-labeled (APC) antibodies (Molecularprobes) and CD8+T-cells were determined using fluores-cein isothiocyanate-labeled (FITC) antibodies (Molecularprobes). B-cells were determined using PE-labeled anti-CD19 antibodies (Molecular probes).
Page 3 of 13(page number not for citation purposes)

BMC Microbiology 2007, 7:88 http://www.biomedcentral.com/1471-2180/7/88
Splenocyte proliferation testThe cell suspensions were used to measure the spontane-ous (medium only) or stimulus-induced 3H-thymidineuptake. The cells were stimulated by adding 10 µg/mlConcavalin A (Con A, T-cell stimulus), 70 µg/ml lipopol-ysacharide (LPS, B-cell stimulus) or 15 µg/ml Lectin (B-and T-cell stimulus) to the culture medium. Cells wereincubated for 72 hr at 37°C. 3H-thymidine was presentduring the final 24 hr of culture. See [20] for details.
HematologyThe morphologic hemogram was determined using anADVIA 120 Hematology system (Multispecies analyzer,Bayer, Mijdrecht, the Netherlands).
Immunoglobulin quantificationBlood was collected in Vacuette Minicollect tubes(Greiner bio-one, Alphen a/d Rijn, the Netherlands), andserum was removed by centrifugation. Immunoglobulinswere determined using the multiplex Beadlyte MouseImmunoglobulin Isotyping Kit (Millipore, Billerica, MA)for the Luminex platform (Luminex, Oosterhoud, theNetherlands), as prescribed by the manufacturer.
Transcription profilingMicroarray analysis experiments were performed asdescribed previously [14]. Briefly, total RNA was extractedfrom lungs and amplified using the Amino Allyl Mes-sageAmp II aRNA kit (Ambion Inc., Austin, TX). RNAamplification was performed to obtain more nucleic acidfor labeling. This results in a stronger fluorescence signaland a better signal/noise ratio. Because of this, less exper-imental samples (and therefore animals) are needed toobtain sufficient statistical power. RNA samples fromindividual mice were labeled with Cy3. A common refer-ence containing a RNA pool of all samples isolated waslabeled with Cy5.
Microarray slides were spotted at the Microarray Depart-ment of the University of Amsterdam. The slides contain21,997 65-mer oligonucleotides from the Sigma-Compu-gen Mouse oligonucleotide library, 192 additional 65-mer oligonucleotides of genes of which 185 are located inthe Bps1 region spotted in duplicate (Isogen Life science,IJsselstein, the Netherlands), as well as appropriate con-trols and blank spots. The Bps-1 oligonucleotides wereannotated according to NCBI mouse genome build 34.1;all other oligonucleotides were annotated according tothe Sigma-Compugen Mouse oligonucleotide library.
At least 5 slides per group were used. Raw microarray sig-nal data were normalized and analyzed in the R statisticalsoftware environment [21-23]. Significance of differencesin gene expression between the experimental groups wascalculated in R with ANOVA. The false discovery rate
(FDR) was calculated according to Benjamini and Hoch-berg [24]. Gene expression data were visualized by hierar-chical clustering (using Euclidian distance and Wardlinkage) using GeneMaths (Applied Maths, St-Martens-Latem, Belgium). Gene categories were defined by GeneOntology (GO) [25], Classification and enrichmentaccording to GO categories or location were determinedusing DAVID/EASE [26,27], using EASE-scores as P-valuefor enrichment.
ResultsResponse of C3H and HcB mice to infectionWe have previously examined clearance of B. pertussisfrom the lungs of infected RCS mice, and established thatHcB-28 mice contained lower numbers of bacteria in theirlungs seven days post inoculation compared to C3H mice(Figure 1b) [2]. To examine whether the genetic differ-ences between "resistant" HcB-28 mice and "susceptible"C3H mice also result in a different transcriptionalresponse to B. pertussis infection, we compared geneexpression profiles of the lungs of infected and uninfectedHcB-28 and C3H mice [2,14]. mRNA transcription pro-files were determined in at least five animals per group.
The three mock-inoculated groups of each mouse strain,euthanized at days one, three and five, were found to bestatistically indistinguishable from each other, i.e. bothwithin the same strain and between strains (i.e. there wereno genes with FDR < 0.6). Of the approximately 22k genestested, 2,559 genes were significantly differentiallyexpressed either in the two mouse strains or upon B. per-tussis-inoculation (FDR <0.05, corresponding to P <0.0058). The gene expression levels of all 2,559 genes arepresented in additional file 1. The expression profiles ofall genes are illustrated by hierarchical clustering in Figure2. ANOVA analysis identified 206 genes (groups A and B)that were differentially expressed between the two mousestrains before inoculation, and 2,353 genes (groups C andD) that were differentially expressed in both strains afterinfection. Remarkably, there were no genes that were dif-ferentially expressed between the two mouse strains fol-lowing inoculation. Thus, genes up- or down-regulatedupon infection were identically regulated in both mousestrains despite their clear genetic differences and differ-ences in B. pertussis susceptibility.
The 206 genes that were differentially expressed betweenthe two strains were all unaffected by infection, but dis-played a difference in basal expression level. Of the 206strain-dependent genes, 107 genes were expressed at ahigher level in C3H/DISnA mice (group A) and 99 geneswere expressed at a higher level in the HcB-28/Dem mice(group B). Of the 2,353 infection-regulated genes, 963were down-regulated upon infection (group C), and1,390 were up-regulated upon infection (group D). All
Page 4 of 13(page number not for citation purposes)

BMC Microbiology 2007, 7:88 http://www.biomedcentral.com/1471-2180/7/88
Page 5 of 13(page number not for citation purposes)
Presentation of microarray data from mock-and B. pertussis- inoculated miceFigure 2Presentation of microarray data from mock-and B. pertussis- inoculated mice. Analysis was performed on 2,559 genes whose expression was found to be significantly up- or down-regulated at an FDR < 0.05. Relatively increased gene-expression is presented in red while relatively decreased gene-expression is presented in green. The color scale shows log(2) ratios of gene-expression levels compared to the global average. ANOVA analysis identified 206 genes that were differentially expressed between the two mouse strains and 2,353 genes that were differentially expressed after infection. Hierarchical clus-tering of the 2,559 regulated genes results in four distinct groups, higher in C3H (A), higher in HcB-28 (B), down-regulated after infection in both strains (C) and up-regulated after infection in both strains (D).
mock infection mock infection
Day 1 3 5 1 3 5 1 3 5 1 3 5
3
0
-3
C3H/DISnA HcB28/Dem
Group A: 107 genes
Group B: 99 genes
Group C: 963 genes
Group D: 1,390 genes

BMC Microbiology 2007, 7:88 http://www.biomedcentral.com/1471-2180/7/88
genes that were affected by B. pertussis infection followeda similar trend in time. One day post-inoculation differen-tial gene expression was already observed, but the effectwas stronger on days three and five post-inoculation. Thusthere was no identifiable subset of genes that displayed adifferent kinetic trend in gene expression.
To assign functions to the differentially expressed genes,we classified them according to Gene Ontology (GO) cat-egories. In addition, we determined enrichment for loca-tion and biological functions to identifypathophysiological processes involved in the response toB. pertussis inoculation. The most important GO catego-ries, i.e. with the highest percentage differentiallyexpressed genes, are summarized in Table 1. Many genesthat were differentially regulated between the two strainsof mice (groups A and B) are located on chromosome 12,predominantly in Bps1 (8 in group A and 9 in group B)[2].All the 17 genes that were differentially expressed in themouse strains C3H and HcB-28 and that are located inBps1 are presented in Table 2, and may be considered ascandidate susceptibility genes. Of these genes, the strong-est differences in gene expression between the mousestrains were found for a cDNA sequence in group A(BC022687, up to 3.7-fold higher in C3H mice) and forImmunoglobulin heavy chain 1 in group B (Igh-1, up to3.6-fold higher expression in HcB-28 mice). Eight geneswithin Bps1 (6 in group A and 2 in group B) showed astrong difference (i.e. at least two-fold) in gene expressionbetween the two mouse strains, and map to the immu-noglobulin heavy chain complex (Igh).
Of the 2,353 genes that were differentially expressed afterB. pertussis infection, 1,702 genes were identical to thegenes we have described previously to be regulated uponB. pertussis infection [14]. Thus by examining additionalmice, we identified approximately 650 additional genesregulated by B. pertussis, most of which were weakly up- ordown-regulated. Most up-regulated genes upon B. pertus-sis infection (group D) are involved in immune- andinflammation-related processes or in generic processes,while most down-regulated genes (group C) are involvedin non-immune processes such as muscle contraction.
Hematologic and immunologic analyses in non-infected C3H and HcB-28 miceTo investigate possible differences in the basal immuno-logical parameters between the two strains, we analyzedhematologic parameters, mitogen-induced splenocyteproliferation, and lymphocyte subset distributions.Because the two mouse strains displayed clear differencesin basal gene expression, we wanted to examine if thesedifferences led to alterations in blood cell composition orbasal immune status. We observed a slightly highernumber of platelets (P = 0.0003) in the C3H/DISnA mice(1.1*1012/l) compared to the HcB-28/Dem mice(9.6*1011/l), and a slightly higher number of white bloodcells (P = 0.006) in the C3H/DISnA mice (7.3*109/l) com-pared to the HcB-28/Dem mice (6.5*109/l), but no differ-ences in the numbers of red blood cells, reticulocytes,lymphocytes, neutrophils, eosinophils, and basophils(data not shown).
Table 1: Gene-ontology based classification of genes with different expression
Group A Group B Genotype (A+B) Group C Group D Infection (C+D) Total on array
Acute-phase response 0 (0%) 0 (0%) 0 (0%) 0 (0%) 13 (59%) 13 (59%) 22Antigen presentation 0 (0%) 0 (0%) 0 (0%) 0 (0%) 23 (72%) 23 (72%) 32Apoptosis 0 (0%) 3 (1%) 3 (1%) 9 (3%) 50 (15%) 59 (18%) 324Cell cycle 0 (0%) 1 (0%) 1 (0%) 30 (6%) 59 (12%) 89 (17%) 510Chemokine Activity 0 (0%) 0 (0%) 0 (0%) 1 (3%) 24 (67%) 25 (69%) 36Mus musculus 12a 12 (2%) 11 (2%) 23 (4%) 34 (6%) 38 (7%) 72 (13%) 560
Bps-1 (Mus musculus 12) 8 (4%) 9 (5%) 17 (9%) 6 (3%) 8 (4%) 14 (8%) 185Complement activation 0 (0%) 1 (3%) 1 (3%) 1 (3%) 8 (26%) 9 (29%) 31Cytokine Activity 0 (0%) 0 (0%) 0 (0%) 8 (4%) 56 (29%) 64 (33%) 192Cytoskeleton 0 (0%) 2 (0%) 2 (0%) 48 (9%) 45 (8%) 93 (18%) 531Development 5 (0%) 9 (1%) 14 (1%) 137 (10%) 118 (8%) 255 (18%) 1433Immune response 1 (0%) 2 (0%) 3 (1%) 6 (1%) 176 (43%) 182 (45%) 408Inflammatory response 0 (0%) 1 (1%) 1 (1%) 5 (4%) 52 (43%) 57 (47%) 121Metabolism 3 (0%) 20 (0%) 23 (0%) 300 (6%) 405 (8%) 705 (15%) 4771Muscle contraction 0 (0%) 0 (0%) 0 (0%) 14 (29%) 2 (4%) 16 (33%) 49
Listed in any of the above 19 29 48 453 656 1109 6574Other 3 22 25 383 513 896 5639Unannotated 85 48 133 127 221 348 9744Total 107 99 206 963 1390 2353 21957
aGenes located on chromosome 12
Page 6 of 13(page number not for citation purposes)

BMC Microbiology 2007, 7:88 http://www.biomedcentral.com/1471-2180/7/88
Splenocyte proliferation was determined by mitogen-induced 3H-thymidine uptake. There was no difference inproliferation between the two strains after ex vivo stimula-tion with Con A (T-cell stimulus), LPS (B-cell stimulus) orLectin (B- and T-cell stimulus) (data not shown). Weobserved no differences in the number of CD19+ (B),CD3ε+ (T), CD4+(Th) and CD8+ (CTL) cells (data notshown).
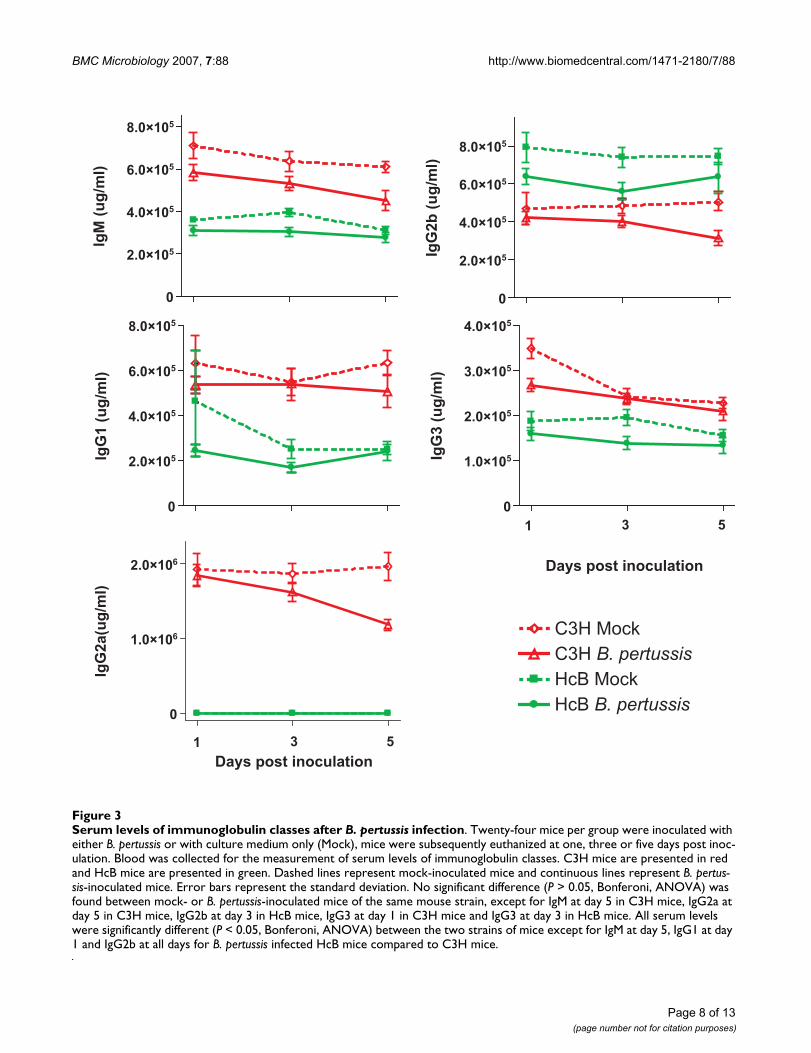
Finally we determined levels of IgM and subclasses of IgGin the sera of the mock- and B. pertussis-inoculated mice(Figure 3). Infection did not affect Ig levels compared tomock-infected mice of the same strain. We did, however,observe a significant difference in the Ig subset distribu-tion between the two mouse strains (either mock- or B.pertussis-inoculated). C3H mice had significantly higherserum levels of IgM, IgG1, IgG2a and IgG3, while HcB-28mice had significantly higher IgG2b levels compared toC3H mice. Importantly, HcB-28 mice had no detectablelevels of IgG2a in the serum at all, which is consistent withthe difference in gene expression at the Igh-1 locusbetween the two mouse strains.
Clinical and pathological findings in B. pertussis-infected C3H and HcB-28 miceTo examine whether the two mouse strains differed inweight loss after infection, we determined their bodyweights after infection. Infected mice lost three to four
percent of their body weight during the first five days post-inoculation, while all mock-inoculated mice gainedweight during these five days (Figure 4). No significantdifferences in the gain or loss of weight were observedbetween the two strains, irrespective whether they wereinfected or not.
As a quantitative endpoint for inflammation, we deter-mined lung weights relative to body weight. All mock-inoculated mice had relative lung weights of approxi-mately one percent five days after inoculation, while B.pertussis-infected mice had relative lung weights of up tothree percent. This difference in relative lung weights dueto B. pertussis infection is significant from day one till dayfive post-inoculation, but was similar in both mousestrains (data not shown).
Histopathological evaluation of lung sections was per-formed as a second parameter of lung inflammation.Intranasal inoculation of B. pertussis causes an acuteinflammatory response that is characterized by influx ofpolymorphonuclear leukocytes (PMNs) and macro-phages, starting in the perivascular and peribronchiolarareas on day one, and extending to alveolar walls andlumina on days three and five. No differences wereobserved in the histopathological lesions findingsbetween the two mouse strains (Figure 5 and 6).
Table 2: Candidate susceptibility genes
Symbol Max.folda P-value Groupb Description
2610204M08Rik 1.5 0.0000000 A RIKEN cDNA 2610204M08 geneBC022687 3.7 0.0005453 cDNA sequence BC022687LOC544906c 2.6 0.0024627 similar to monoclonal antibody heavy chainLOC382694c 2.8 0.0043821 similar to immunoglobulin heavy chainLOC211331c 2.7 0.0002482 similar to Ig H-chainLOC238440c 2.7 0.0016035 similar to IgE antibody heavy chain (VDJ)LOC238448c 3.2 0.0000868 similar to Igh-VJ558 proteinLOC544911c 2.1 0.0000310 similar to heavy chain V region VH558 A1/A4 precursor
LOC432692 1.4 0.0005147 B LOC432692LOC544805c 3.5 0.0000050 similar to Ig heavy chain variable region precursor1700001K19Rik 1.6 0.0002085 RIKEN cDNA 1700001K19 geneAmn 1.7 0.0002930 amnionlessPpp1r13b 2.2 0.0000019 protein phosphatase 1, regulatory (inhibitor) subunit 13BAdssl1 1.5 0.0001518 adenylosuccinate synthetase like 1Akt1 1.8 0.0000206 thymoma viral proto-oncogene 1AI450948 1.5 0.0048316 expressed sequence AI450948Igh-1ac,d 3.6 0.0000000 immunoglobulin heavy chain 1a (serum IgG2a)
aMaximum fold-change between genes that are located in Bps1 and that are significantly differentially expressed between C3H and HcB-28 mice.bHierarchical clustering as presented in figure 2, higher in C3H (A) or higher in HcB-28 (B).cIn the most recent annotation of the murine genome, eight probes map to the Immunoglobulin heavy chain complex (Igh) similar to Ig heavy chain variable region precursor.dThe oligo was designed based on accession number XM_484178 annotated as Igh-1a. Because this annotation is based on the reference C57BL/6 mice, the oligo can be considered as Igh-1b annotated.
Page 7 of 13(page number not for citation purposes)
BMC Microbiology 2007, 7:88 http://www.biomedcentral.com/1471-2180/7/88
Page 8 of 13(page number not for citation purposes)
Serum levels of immunoglobulin classes after B. pertussis infectionFigure 3Serum levels of immunoglobulin classes after B. pertussis infection. Twenty-four mice per group were inoculated with either B. pertussis or with culture medium only (Mock), mice were subsequently euthanized at one, three or five days post inoc-ulation. Blood was collected for the measurement of serum levels of immunoglobulin classes. C3H mice are presented in red and HcB mice are presented in green. Dashed lines represent mock-inoculated mice and continuous lines represent B. pertus-sis-inoculated mice. Error bars represent the standard deviation. No significant difference (P > 0.05, Bonferoni, ANOVA) was found between mock- or B. pertussis-inoculated mice of the same mouse strain, except for IgM at day 5 in C3H mice, IgG2a at day 5 in C3H mice, IgG2b at day 3 in HcB mice, IgG3 at day 1 in C3H mice and IgG3 at day 3 in HcB mice. All serum levels were significantly different (P < 0.05, Bonferoni, ANOVA) between the two strains of mice except for IgM at day 5, IgG1 at day 1 and IgG2b at all days for B. pertussis infected HcB mice compared to C3H mice.
C3H MockC3H B. pertussisHcB MockHcB B. pertussis
0
2.0×10⁵
4.0×10⁵
6.0×10⁵
8.0×10⁵
IgG
1 (u
g/m
l)
0
1.0×10⁵
2.0×10⁵
3.0×10⁵
4.0×10⁵
IgG
3 (u
g/m
l)
0
1.0×10⁶
2.0×10⁶
IgG
2a(u
g/m
l)
0
2.0×10⁵
4.0×10⁵
6.0×10⁵
8.0×10⁵
Days post inoculation
IgM
(ug/
ml)
1 3 5
0
2.0×10⁵
4.0×10⁵
6.0×10⁵
8.0×10⁵
Days post inoculation
IgG
2b (u
g/m
l)
1 3 5

BMC Microbiology 2007, 7:88 http://www.biomedcentral.com/1471-2180/7/88
DiscussionStudying genetic differences in susceptibility to B. pertussisinfection may point to novel insights in the pathogenesisof this infection. We have previously identified B. pertussissusceptibility locus-1 (Bps1) in HcB-28 mice [2]. The Bps1locus is located on chromosome 12, spanning a region of185 genes and has a dominant positive effect on the clear-ance of B. pertussis from the lung. In this study we exam-ined gene expression profiles in HcB-28 and C3H mice,which differ in their susceptibility to B. pertussis. Twelveand a half percent of the genomes of these mice are froma different genetic background [9,10]. The traditionalapproach for identification of relevant genes in suscepti-bility loci is a combination of positional cloning and link-age analysis [11,12]. This method has proven to beeffective [7,13], but has disadvantages. We have thereforechosen for an alternative strategy. Using this approach weattempted to identify candidate susceptibility genes thatcontrol the difference between these two mouse strains.We hypothesized that the difference in susceptibility to B.pertussis infection could (partly) be explained by a differ-ent gene expression profile between the mouse strains.
We have previously shown that B. pertussis infection inC3H mice induces a wide transcriptional response, whichappears to be partly specific for B. pertussis and partly non-specific [14]. This study revealed that 1,841 genes are dif-ferentially expressed in the lungs of mice after B. pertussisinoculation, and most up-regulated genes are involved inimmune- and inflammation-related processes or ingeneric processes, while most down-regulated genes areinvolved in non-immune processes. In the present study,we found that HcB-28 and C3H mice showed a similar
gene expression profile upon infection and identifiedapproximately 650 additional genes regulated by B. per-tussis, most of which were weakly up- or down-regulated.However, the gene expression profiles and enrichment forGO categories were identical as described in the previousstudy. A substantial number of genes and pathways sug-gest a central role of PMN recruitment and activation inthe pathogenesis of B. pertussis infection. The transcrip-tional profiles further indicate in particular the signifi-cance of TLR activation and apoptosis [14]. The reason forthe detection of the 650 additional genes, besides thestrain differences, is that by adding an extra mouse strainthe number of samples doubled increasing the power ofdetection. Hundred and thirty-nine genes which we havedescribed previously to be regulated upon B. pertussisinfection were not detected in the present study. Thesegenes were borderline significantly regulated (medianFDR of 0.03) and only slightly induced (median 1.4-fold).These genes are therefore probably less important in thehost response to B. pertussis infection. The finding that thislist of 139 genes does not show significant enrichment forany GO-term, including immunological terms, corrobo-rates this.
Although the two mouse strains differ in 12.5% of theirgenome (12.5% of the genomes of these mice are from adifferent genetic background), we observed no markeddifferences in their phenotypical characteristics other thanthe previously observed difference in bacterial numbers inthe lungs after infection (Figure 1b). C3H mice did haveslightly higher numbers of circulating platelets and whiteblood cells compared to the HcB mice, but the cellularproportions, as well as the proliferation of splenocyteswas identical for both strains. There was also no signifi-cant difference observed in body weight, lung weight andhistopathological findings in response to B. pertussis infec-tion between the two mouse strains. The major differenceis that HcB-28 mice did not have detectable IgG2a serumlevels.
We observed 206 genes that were differentially expressedbetween the two mouse strains, but these genes were iden-tically expressed in mock- or B. pertussis-inoculated mice.The majority of these genes (65%) are unannotated. Theseunannotated genes tend to have no GO functional anno-tation, because they are not "regular" protein-codinggenes and many of them are not (sufficiently) mapped toa chromosomal locus to warrant including them underchromosome 12 or Bps-1. The mentioned 23 genes, whichwere mapped to chromosome 12, are significant at P =5.29e-014 (Fisher exact probability, Bonferroni correctionfor multiple testing). The same test applied to all othermouse chromosomes yielded P values > 0.05. Twenty-three out of the 206 genes were located on chromosome12, which can be explained by the fact that approximately
Relative gain or loss of weight after inoculationFigure 4Relative gain or loss of weight after inoculation. Twenty-four mice per group were inoculated with either B. pertussis or culture medium only (Mock) and body weights were measured daily.
-8%
-6%
-4%
-2%
0%
2%
4%
6%
1 2 3 4 5
Time after infection (days)
Rel
ativ
e ga
in o
f wei
ght (
%)
C3H/DISnA Mock C3H/DISnA B.pertussis
HcB28/Dem Mock HcB28/Dem B.pertussis
Page 9 of 13(page number not for citation purposes)

BMC Microbiology 2007, 7:88 http://www.biomedcentral.com/1471-2180/7/88
one fifth of the genetic variation between the two mousestrains is due to variation on chromosome 12 [2]. Becausethe genes that were differentially regulated between thetwo mouse strains only showed differences in expressionbefore infection, it appears likely that such intrinsic differ-ences in gene regulation are involved in determining dif-ferences in susceptibility to B. pertussis infection.Alternatively, such genetic differences may be explainedby genes that are not differentially regulated betweenthese two strains of mice, or by processes at present notfully characterized and possibly involving differentialexpression of genes by mechanisms such as microRNA's.Remarkably, 17 of these genes were located in the Bps1region, 8 of which mapped to the Igh complex. Among
these 8 genes were the Igh-1 gene and genes that encodefor Ig heavy chain variable regions. We observed a signifi-cantly higher expression (up to 2.8-fold) of the gene vari-ant of Igh-1 isotype b in HcB mice compared to C3H mice.The Igh locus is genetically polymorphic and very com-plex [28]. The Igh-1 gene exists in 2 major genetic variants(Igh-1a and Igh-1b) with 83.8% similarity [29]. The Igh-1aallele codes for the heavy chain of IgG2a while the Igh-1ballele codes for the heavy chain of IgG2c [30]. Mousestrains such as C57BL/6 and C57BL/10 (the donor strainof the HcB mice) only contain the gene variant Igh-1b andare therefore incapable of producing IgG2a, while mousestrains such as BALB/c only contain the gene variant ofIgh-1a and are therefore incapable of producing IgG2c
Summary of lung pathology post mock- or B. pertussis-inoculationFigure 5Summary of lung pathology post mock- or B. pertussis-inoculation. H&E stained slides were examined for alveolitis, perivasculitis and hypertrophy of mucus-producing glands. Lung lesions were scored semi-quantitatively as absent (0), minimal (1), slight (2), moderate (3), marked (4), or severe (5) per type of lesion and added up to calculate the pathology-score (range 0–15). Dots represent the pathology score per individual mouse, horizontal lines represent the groups median.
0
Day 1 Day 3 Day 5
mock B. pertussis mock B. pertussis mock B. pertussis
C3H HcB28 C3H HcB28 C3H HcB28 C3H HcB28 C3H HcB28 C3H HcB28
Lung
Pat
holo
gy (P
eriv
ascu
litis
+ H
yper
trop
hy +
Alv
eolit
is )
1
2
3
4
5
6
7
8
9
Page 10 of 13(page number not for citation purposes)

BMC Microbiology 2007, 7:88 http://www.biomedcentral.com/1471-2180/7/88
[29,30]. The oligo for Igh-1 spotted on the microarray, wasdesigned based on accession number XM_484178 anno-tated as Igh-1a. Because this annotation is based on thereference C57BL/6 mice, this oligo can be considered asIgh-1b annotated. In the sera of HcB mice we detected noIgG2a while C3H mice had significant titers of IgG2a,thereby confirming the expression results. It is tempting tospeculate if and how genes within the Igh complex mayaffect differences early in the course of B. pertussis infec-tion. Possible mechanisms may include differences intranscriptional gene regulation affecting immune respon-siveness, different function of the IgG2a or c isotypes, ordifferent usage of V chains. This latter possibility mightimply the existence of "natural antibodies" reacting withB. pertussis epitopes. It has previously been shown that
genes within the Igh-1 locus are predominantly associatedwith the course of a herpes simplex virus type-1 (HSV-1)infection in mice by an unknown mechanism [31-33].Pro-inflammatory cytokines such as IL-1β, IL-4, IL-6 andIL-7 participate in this infection [34]. Interestingly, natu-ral killer cell activity appears to be regulated by the Igh-1locus but could not simply explain the differences in HSV-1 susceptibility [33]. Igh-linked genes have further beenimplicated in T suppressor cell activity [35,36].
ConclusionIn this study we reduced the number of candidate suscep-tibility genes within the Bps1 locus by microarray analysis.Gene expression changes upon B. pertussis infectionappear highly identical between C3H and HcB-28 mouse
Examples of lung pathology post B. pertussis inoculationFigure 6Examples of lung pathology post B. pertussis inoculation. Lung sections (H&E, obj x 20) from B. pertussis infected mice. A: HcB28 day 1, mild alveolitis (grade 2 on scale from 1–5), as seen by inflammatory cells in alveolar septa and spaces. B: C3H day 3, alveolitis and thickened septa (pneumonia) varying from grade 3 (upper, right) to 5 (bottom). C: C3H day 3, asterix: perivasculitis grade 5, and arrow: hypertrophy bronchiolar epithelium, grade 3. D: HcB28 day 3, no major differences in pathol-ogy compared to C3H (B and C).
Page 11 of 13(page number not for citation purposes)

BMC Microbiology 2007, 7:88 http://www.biomedcentral.com/1471-2180/7/88
strains despite the different course of B. pertussis infectionin these strains. Because the genes that were differentiallyregulated between the mouse strains only showed differ-ences in expression before infection, it appears likely thatsuch intrinsic differences in gene regulation are involvedin determining differences in susceptibility to B. pertussisinfection. Alternatively, such genetic differences in suscep-tibility may be explained by genes that are not differen-tially regulated between these two mouse strains or byprocesses other than differential gene expression. Genesin the Igh complex, among which Igh-1, may be likely can-didates to explain differences in susceptibility to B. pertus-sis. Further work should establish the role of the Ighcomplex in B. pertussis infection and determine its modeof action.
Supplementary dataRaw data as well as the detailed description of the experi-ment was uploaded to the freely accessible online data-base ArrayExpress [37]. Expression levels of all 2,559genes are presented in the additional files.
Competing interestsThe author(s) declares that there are no competing inter-ests.
Authors' contributionsSB: carried out the infection and microarray studies andwrote the manuscript. RJV: participated in the studydesign and coordination and helped to draft the manu-script. JLAP: participated in the design of the microarrayanalysis and performed the statistical analysis. ERG: car-ried out the immunoassays. PWW: evaluated the lungpathology. TMB: participated in the design of the microar-ray analysis. PD: responsible for the genetic model ofrecombinant congenic mice. HJK, FRM, and BH: partici-pated in the study design and coordination. TGK: con-ceived the study, and participated in its design andcoordination and helped to draft the manuscript. Allauthors read and approved the final manuscript.
Additional material
AcknowledgementsWe would like to thank Yvonne Wallbrink, Liset de la Fonteyne and Sisca de Vlugt- van den Koedijk for the hematology, FACS analysis and histotech-
nical contributions to this paper. Furthermore we would like to thank all biotechnicians of our animal facility, for facilitating and performing the ani-mal experiment.
References1. Carbonetti NH: Immunomodulation in the pathogenesis of
Bordetella pertussis infection and disease. Curr Opin Pharmacol2007.
2. Banus S, van Kranen HJ, Mooi FR, Hoebee B, Nagelkerke NJ, DemantP, Kimman TG: Genetic Control of Bordetella pertussis Infec-tion: Identification of Susceptibility Loci Using RecombinantCongenic Strains of Mice. Infect Immun 2005, 73:741-747.
3. Banus S, Vandebriel RJ, de Ruiter H, Dormans JA, Nagelkerke NJ,Mooi FR, Hoebee B, van Kranen HJ, Kimman TG: Host Genetics ofBordetella pertussis Infection in Mice: Significance of Toll-Like Receptor 4 in Genetic Susceptibility and Pathobiology.Infect Immun 2006, 74:2596-2605.
4. Mann PB, Kennett MJ, Harvill ET: Toll-Like Receptor 4 Is Criticalto Innate Host Defense in a Murine Model of Bordetellosis. JInfect Dis 2004, 189:833-836.
5. Mann PB, Wolfe D, Latz E, Golenbock D, Preston A, Harvill ET:Comparative toll-like receptor 4-mediated innate hostdefense to Bordetella infection. Infect Immun 2005,73:8144-8152.
6. Mahon BP, Sheahan BJ, Griffin F, Murphy G, Mills KH: Atypical dis-ease after Bordetella pertussis respiratory infection of micewith targeted disruptions of interferon-gamma receptor orimmunoglobulin mu chain genes. J Exp Med 1997,186:1843-1851.
7. Demant P: Cancer susceptibility in the mouse: genetics, biol-ogy and implications for human cancer. Nat Rev Genet 2003,4:721-734.
8. Demant P, Hart AA: Recombinant congenic strains--a new toolfor analyzing genetic traits determined by more than onegene. Immunogenetics 1986, 24:416-422.
9. Groot PC, Moen CJ, Dietrich W, Stoye JP, Lander ES, Demant P: Therecombinant congenic strains for analysis of multigenictraits: genetic composition. FASEB J 1992, 6:2826-2835.
10. Stassen AP, Groot PC, Eppig JT, Demant P: Genetic compositionof the recombinant congenic strains. Mamm Genome 1996,7:55-58.
11. Rannala B: Finding genes influencing susceptibility to complexdiseases in the post-genome era. Am J Pharmacogenomics 2001,1:203-221.
12. Ruivenkamp CA, van Wezel T, Zanon C, Stassen AP, Vlcek C, CsikosT, Klous AM, Tripodis N, Perrakis A, Boerrigter L, Groot PC, Linde-man J, Mooi WJ, Meijjer GA, Scholten G, Dauwerse H, Paces V, VanZandwijk N, Van Ommen GJ, Demant P: Ptprj is a candidate forthe mouse colon-cancer susceptibility locus Scc1 and is fre-quently deleted in human cancers. Nat Genet 2002, 31:295-300.
13. Ruivenkamp C, Hermsen M, Postma C, Klous A, Baak J, Meijer G,Demant P: LOH of PTPRJ occurs early in colorectal cancerand is associated with chromosomal loss of 18q12-21. Onco-gene 2003, 22:3472-3474.
14. Banus S, Pennings J, Vandebriel R, Wester P, Breit T, Mooi F, HoebeeB, Kimman T: Lung response to Bordetella pertussis infectionin mice identified by gene-expression profiling. Immunogenetics2007, 59:555-564.
15. Willems RJ, Kamerbeek J, Geuijen CA, Top J, Gielen H, Gaastra W,Mooi FR: The efficacy of a whole cell pertussis vaccine andfimbriae against Bordetella pertussis and Bordetella parap-ertussis infections in a respiratory mouse model. Vaccine1998, 16:410-416.
16. King AJ, Berbers G, van Oirschot HF, Hoogerhout P, Knipping K,Mooi FR: Role of the polymorphic region 1 of the Bordetellapertussis protein pertactin in immunity. Microbiology 2001,147:2885-2895.
17. Verwey WF, Thiele EH, Sage DN, Suchardt LT: A simplified liquidculture medium for the growth of Haemophilus pertussis. JBacteriol 1949, 58:127-134.
18. NIH: Revised guide for the care and use of laboratory ani-mals. NIH GUIDE 1996, 25:.
19. Barends M, van Oosten M, De Rond CG, Dormans JA, Osterhaus AD,Neijens HJ, Kimman TG: Timing of infection and prior immuni-zation with respiratory syncytial virus (RSV) in RSV-
Additional file 1Comparative gene expression profiling in two congenic strains of mice fol-lowing Bordetella pertussis infection. The data present the expression lev-els of all 2,559 genes.Click here for file[http://www.biomedcentral.com/content/supplementary/1471-2180-7-88-S1.xls]
Page 12 of 13(page number not for citation purposes)

BMC Microbiology 2007, 7:88 http://www.biomedcentral.com/1471-2180/7/88
Publish with BioMed Central and every scientist can read your work free of charge
"BioMed Central will be the most significant development for disseminating the results of biomedical research in our lifetime."
Sir Paul Nurse, Cancer Research UK
Your research papers will be:
available free of charge to the entire biomedical community
peer reviewed and published immediately upon acceptance
cited in PubMed and archived on PubMed Central
yours — you keep the copyright
Submit your manuscript here:http://www.biomedcentral.com/info/publishing_adv.asp
BioMedcentral
enhanced allergic inflammation. J Infect Dis 2004,189:1866-1872.
20. Vos JG, de Klerk A, Krajnc EI, Kruizinga W, van Ommen B, Rozing J:Toxicity of bis(tri-n-butyltin)oxide in the rat. II. Suppressionof thymus-dependent immune responses and of parametersof nonspecific resistance after short-term exposure. ToxicolAppl Pharmacol 1984, 75:387-408.
21. Team RDC: R: A language and enviroment for statistical com-puting. R Foundation for Statistical Computing, Vienna, Austria 2005,ISBN 3-900051-07-0: [http://www.R-project.org].
22. Smyth GK, Speed T: Normalization of cDNA microarray data.Methods 2003, 31:265-273.
23. Pennings JLA, Heisterkamp SH: Normal probability plots formicroarray experiments. Proceedings of the 12th International Con-ference on Intelligent Systems for Molecular Biology and the 3rd EuropeanConference on Computational Biology 143 2004.
24. Benjamini Y, Hochberg Y: Controlling the False Discovery Rate:a Practical and Powerful Approach to Multiple Testing. J RStatist Soc B 1995, 57:288-300.
25. GO: Gene Ontology. 2007 [http://www.geneontology.org].26. Dennis G Jr., Sherman BT, Hosack DA, Yang J, Gao W, Lane HC,
Lempicki RA: DAVID: Database for Annotation, Visualization,and Integrated Discovery. Genome Biol 2003, 4:3.
27. Hosack DA, Dennis G Jr., Sherman BT, Lane HC, Lempicki RA: Iden-tifying biological themes within lists of genes with EASE.Genome Biol 2003, 4:R70.
28. Solin ML, Kaartinen M: Allelic polymorphism of mouse Igh-Jlocus, which encodes immunoglobulin heavy chain joining(JH) segments. Immunogenetics 1992, 36:306-313.
29. Martin RM, Silva A, Lew AM: The Igh-1 sequence of the non-obese diabetic (NOD) mouse assigns it to the IgG2c isotype.Immunogenetics 1997, 46:167-168.
30. Martin RM, Brady JL, Lew AM: The need for IgG2c specificantiserum when isotyping antibodies from C57BL/6 andNOD mice. J Immunol Methods 1998, 212:187-192.
31. Foster CS, Opremcak EM, Rice B, Wells P, Chung H, Thompson P,Fong LP, Raizman M: Clinical, pathologic, and immunopatho-logic characteristics of experimental murine herpes simplexvirus stromal keratitis and uveitis is controlled by gene prod-ucts from the Igh-1 locus on chromosome 12. Trans Am Oph-thalmol Soc 1987, 85:293-311.
32. Opremcak EM, Wells PA, Thompson P, Daigle JA, Rice BA, Millin JA,Foster CS: Immunogenetic influence of Igh-1 phenotype onexperimental herpes simplex virus type-1 corneal infection.Invest Ophthalmol Vis Sci 1988, 29:749-754.
33. Tamesis RR, Foster CS: Natural killer cellular cytotoxicityagainst herpes simplex virus-infected cells in Igh-1-disparatemice. Invest Ophthalmol Vis Sci 1990, 31:2224-2229.
34. Arrunategui-Correa V, Baltatzis S, Foster CS: The role of cytokinesin experimental herpes simplex keratitis. Acta Virol 1999,43:325-329.
35. Lake JP, Kapp JA, Pierce CW: Characterization of L-glutamicacid60-L-alanine30-L-tyrosine10-specific suppressor T cellsin responder mice restricted by Igh-C-linked genes. J Immunol1988, 140:3296-3302.
36. O'Hara RM Jr., Sherr DH, Dorf ME: In vitro generation of sup-pressor T cells. Induction of CD3+, IgH-restricted suppres-sor cells. J Immunol 1988, 141:2935-2942.
37. ArrayExpress 2007 [http://www.ebi.ac.uk/arrayexpress/.].
Page 13 of 13(page number not for citation purposes)