Embed Size (px)
Citation preview

1
BBMM RReessppiirroommeettrryy ssttuuddyy aabboouutt
llooww nniittrriiffiiccaattiioonn iinn oonnee aaccttiivvaatteedd sslluuddggee pprroocceessss

2
Activated Sludge Process - Technical data
Parameter Value (average) / Comment Parameter Value (average) / Coment
Process type
Activated sludge double stage process DO (ppm) 2.6
Nitrification / Denitrification Yes Total N influent (ppm)
73.4
pH in Ntrificación zone
7.10 P total influent (ppm) 9.1
Temperature average
18 ºC N total effluent (ppm)
26.3
COD influent to biological reactor (mg/l)
500 P total effluent efluent (ppm) 4.2
Amomnium influent / effluent (mg/l)
70/23 (N-NH4+)
Volume of biological reactor (m3) 7920
Volume for Nitrification (%) 75 (of the total volume of the reactor)
MLSS / MLVSS (mg/l)
3700/2880
MLSS / MLVSS (mg/l) in the reference sludge
4300/2750
HRT (h)
15.4
SRT (d)
17
F/M (DBO)
0.16
PROBLEM: Low nitrification performance: too high Ammonium in effluent

3
BM Respirometer
The respirometer utilized for the study was a BM-T, provided with external thermostatic unit (bath)
This “batch system” respirometer consists of a single reactor vessel, divided into two interconnected compartments with closed recirculation loop
between the two. Both compartments are kept completely mixed by means of paddle stirrers and a peristaltic recirculation A constant air flow is
supplied via a ceramic diffuser in the conditioning compartment, and a combined oxygen/temperature sensor in the reaction compartment controls
the DO and monitors temperature. The temperature is controlled by means an external thermostatic unit (bath) connected to the reactor vessel.
The BM-T is doted by three different operation modes (Static, Cyclic and Dynamic).
In this study we are only making use of the dynamic R mode for toxicity, biomass yield, rbCOD fraction and nitrification rate.
The R mode is based on the addition of one or several small sample doses in the activated sludge previously aerated in the reactor vessel.
For R mode the measuring system was previously calibrated to get the corresponding offsets and factors with the purpose to determine the
corresponding CO and bCOD results in mg/l units.
Data capture & handling together with respirometer control is performed by the powerful BM software loaded onto a permanently connected PC. The
automatically derived parameters generated by that BM-T include:
OUR (mgO2/l.h) Oxygen Uptake Rate.
SOUR (mgO2/gVSS.h) Specific OUR - by introducing the MLVSS concentration -
Rs (mgO2/l.h) Dynamic Respiration Rate.
Rsp (mgO2/gVSS.h Specific Rs - by introducing the MLVSS concentration –
CO (mg/L) Consumed Oxygen
bCOD & rbCOD (mg/L) Biodegradable & Readily biodegradable COD – by introducing YH -

4
Study
This study was carried out with the aim to find out what is the actual reason for the low nitrification performance.
For that purpose it was conducted on two main ways: possible nitrification toxicity already in the activated sludge and analysis of the nitrification rate
and autotrophic biomass concentration.
General Procedure
The following important parameters and procedures were carried out:
1. Readily biodegradable COD (rbCOD)
2. Analysis of the possible specific toxicity to nitrification by means a reference activated sludge from another plant
3. Autotrophic yield coefficient (YA)
4. Maximum nitrification rate (AURmax)
5. Actual autotrophic biomass concentration (XA)
6. Hydraulic residence time for a complete nitrification (HRTN)
7. Estimated maximum nitrification rate (AURmax.t) for a complete nitrification
8. Estimated autotrophic biomass concentration (from rbCOD/N ratio) for efficient nitrification
9. Estimated minimum solids retention time (SRTN.t) for efficient nitrification
10. Conclusions
11. Probable causes of the problem
12. Proposed plan to solve the problem

5
Summary of results
Parameter Aplication Result Normal
range
Coment
rbCOD (mg/l)
Coherence with total COD
rbCOD/N ratio
103
20% of total COD
15 – 30%
of total COD
NORMAL
rbCOD / N
Nitrifier biomass assessment 1.4 0.5 - 8 NORMAL for a 2 stages
process
Toxicity (%)
Specific inhibition to nitrification activity 0 - There is not any toxicity
YA
(1) (OC/N-NH4) (2) (VSSA/N-NH4)
Autotrophic yield coefficient
(1) 0,2
(2) 0,14
0,1 – 0,4
NORMAL
AURmax [mg N-NH4/(l.h)]
Actual maximum nitrification rate 2,46 2 - 8 Too low
for the current ammonium
concentration in the
influent
XA (mg/l)
Autotrophic biomass concentration 143
5 % VSS
≈ 17 % VSS
Too low
According to rbCOD/N ratio
HRTN.t
(h)
Estimated hydraulic residence time for a complete
nitrification process
23 - NORMAL
AURmax.t
[mg N-NH4/(l.h)]
Estimated maximum nitrification rate for a
complete nitrification process
6.06 2 - 8 NORMAL
XA.t (mg/l)
Estimated autotrophic biomass concentration for
efficient nitrification process
489
17 % VSS
15 - 20 %
VSS
NORMAL
SRTN.t
(d)
Estimated sludge age for efficient nitrification
process
23 5 - 30 Necessary to increase the
biomass and nitrification
rate
6
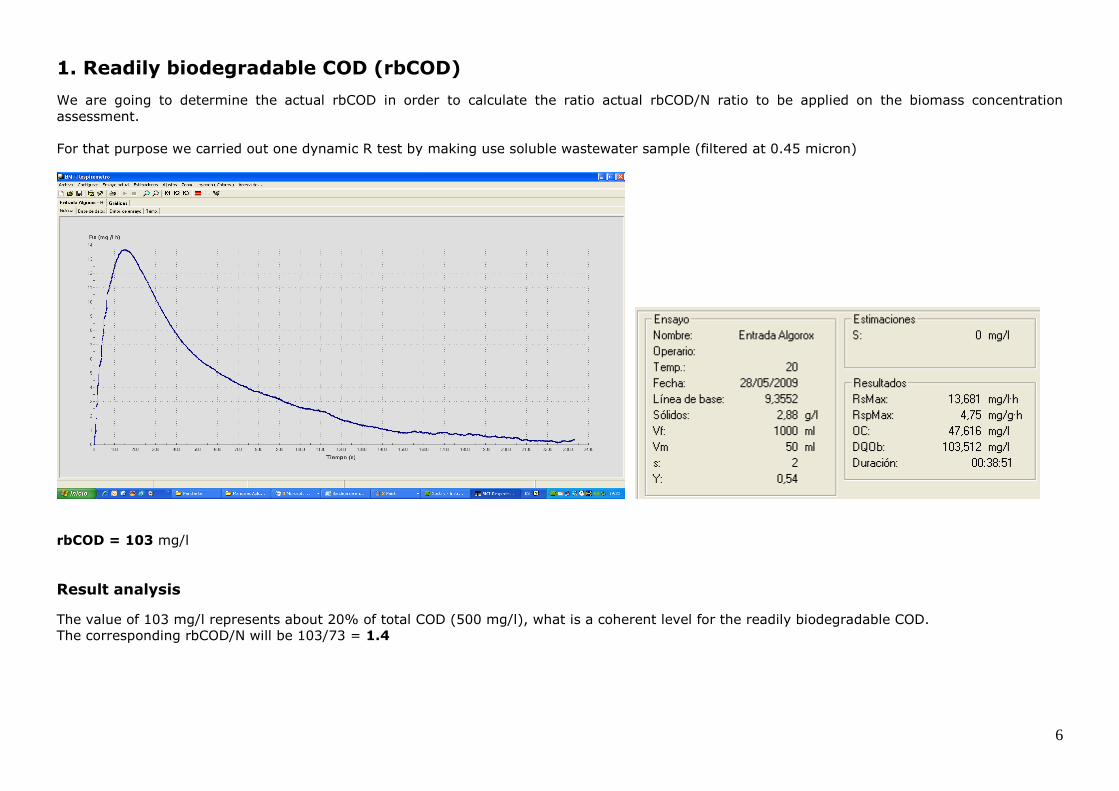
1. Readily biodegradable COD (rbCOD)
We are going to determine the actual rbCOD in order to calculate the ratio actual rbCOD/N ratio to be applied on the biomass concentration
assessment.
For that purpose we carried out one dynamic R test by making use soluble wastewater sample (filtered at 0.45 micron)
rbCOD = 103 mg/l
Result analysis
The value of 103 mg/l represents about 20% of total COD (500 mg/l), what is a coherent level for the readily biodegradable COD.
The corresponding rbCOD/N will be 103/73 = 1.4

7
2. Analysis of the possible specific toxicity to nitrification by means a reference activated sludge from another plant
For this analysis we have made up two different mixed-liquors in equivalent proportion to the actual biological process:
Mixed-liquor reference: 800 ml a. sludge + 200 ml distilled water solution with ammonium chloride (in equivalent proportion to the actual ammonium
in the influent wastewater)
Mixed-liquor sample: 800 ml sludge + 200 ml wastewater.
The mixed-liquors were leaved under permanent aeration during a sufficient periode (> TRH) to reach their endogenous respiration phase.
From those mixed-liquors under endogenous level, we have carried out two R dynamic respirometry tests by adding identical amount of ammonium
chloride to one litre of endogenous sludge in each of them.
Result analysis
We can observe that the [Reference Mixed-liquor] is taking a trajectory below the [Sample Mixed-liquor]
That means: There is not any inhibitory effect that the simple of wastewater could provoke in the activated sludge.
We also observe however that the nitrification activity is rather low.
The reason of why the Rs of Sample liquor goes over Reference liquor is mainly because the effect of difference between the MLVSS concentration
(VSS sample mix-liq. > VSS ref. Mix-liq.)
8
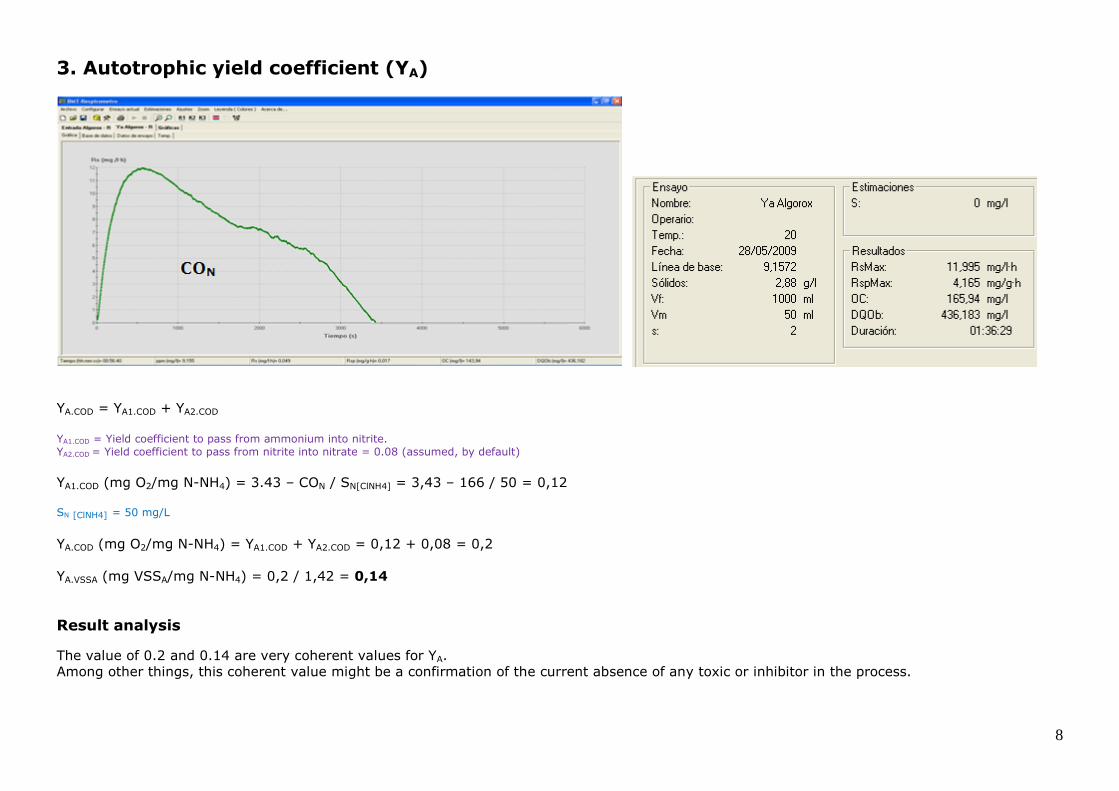
3. Autotrophic yield coefficient (YA)
YA.COD = YA1.COD + YA2.COD
YA1.COD = Yield coefficient to pass from ammonium into nitrite. YA2.COD = Yield coefficient to pass from nitrite into nitrate = 0.08 (assumed, by default)
YA1.COD (mg O2/mg N-NH4) = 3.43 – CON / SN[ClNH4] = 3,43 – 166 / 50 = 0,12
SN [ClNH4] = 50 mg/L
YA.COD (mg O2/mg N-NH4) = YA1.COD + YA2.COD = 0,12 + 0,08 = 0,2
YA.VSSA (mg VSSA/mg N-NH4) = 0,2 / 1,42 = 0,14
Result analysis
The value of 0.2 and 0.14 are very coherent values for YA. Among other things, this coherent value might be a confirmation of the current absence of any toxic or inhibitor in the process.

9
4. Maximum nitrification rate (AURmax)
The get the nitrification rate, we carry out a dynamic R test from endogenous sludge, with equivalent temperature and pH of the process, by adding
a dose of ammonium chloride equivalent to the ammonium in the influent to biological reactor until reaching its maximum respiration rate
AUR (mg N-NH4/l.h) = Rs.max / 4.57; RN = 11.17 / 4.57 = 2.44 [mg N-Nh4/(l.h)]
AURmax (mg N-NH4 /l.h) = AUR / [SN / (KN + SN)] SN: Normal ammonium concentration = 70 (mg N-NH4/l) KN: Monod constant KN at 18ºC = 0.75 Note: We do not apply any DO correction factor because of the relatively normal-high DO level in the ASP (>2.5 ppm)
AURmax = 2.44 / [70 / (0.75 + 70)] = 2.46
AURmax = 2.46 (mg N-NH4 /l.h)

10
5. Actual autotrophic biomass concentration (XA)
XA = YA.vss * SRT * SNe / [(1 + bA * SRT) * HRTN] Sources: Marais and Ekama (1976) - Handbook Biological Wastewater Treatment. Adrianus van Haandel (2009) YA.vss = 0.14 SRT (d): Current actual sludge age = 17 SNe (mg/L): Average concentration of eliminated ammonium-nitrogen in the nitrification process = 70 – 23 = 47 bA (d
-1): Autotrophic decay rate = 0,037
XA = 0.14 * 17 * 47 / [(1 + 0,037 * 17) * 0,48] = 143 mg/l
XA = 143 (mg/l)
Result analysis
The value of 143 mg/l represents a biomass nitrifying fraction of 5 % (FN = 0.05) of the total volatile biomass. If we compare the FN value with a
reference table, we will realize that it is too low value for the current rbCOD/N (1.4)
Reference table
This low nitrifier biomass is the reason of the low nitrification rate and also the cause to get not enough hydraulic residence time to remove the
ammonium of the influent.

11
6. Hydraulic residence time for nitrification (HRTN) for a complete nitrification
HRTN (h) = SN / AURmax
HRTN (h) = 70 / 2.46 = 28.45
HRTN = 28.45 (h)
Result analysis
The value of 28.45 h is much higher than the current available time for nitrification (75% of HRTN.act = 0.75 * 15.4 =11.55 h)
That means; with the current nitrification rate there is not time enough to remove the ammonium of the influent to the biological reactor.
7. Estimated nitrification rate (AURmax.t) for a complete nitrification
Here we calculate the theoretical necessary maximum nitrification rate to remove the actual ammonium of the influent to biological reactor.
AURmax.t = SN / HRTN.act HRTN.act (h): available hydraulic residence time for nitrification = 11.55 h
AUR.max.t [mg N-NH4/(l.h)] = 70 / 11.55 = 6.06
AURmax.t = 6.06 [mg N-NH4/(l.h)]

12
8. Estimated autotrophic biomass concentration from rbCOD/N ratio for efficient nitrification
Reference table
rbCOD/N ratio = 1.4
FN = 0.17
XA.t (mg/l) = 0.17 * XV = 0.17 * 2880 = 489 XV (mg/l): actual MLVSS
XA.t = 489 (mg/l)
Result analysis
The current autotrophic biomass needs be increased in more than 3 times.
XA.t / XA = 489 / 143 = 3,42
9. Theoretical minimum solids retention time (SRTN.t) for efficient nitrification
SRTN (d) = 1 / [24 * AURmax / (XA / YA,VSS)] Source: Based on Handbook Wastewater Treatment - Adrianus van Haandel and Jeroen van der Lubbe. 2007
SRTN (d) = 1 / [24 * 6.06 / (489 / 0.14)] = 23
SRTN.t = 23 (d)
13
10. Conclusions
1. Currently there is not any toxicity symptom.
2. The nitrification rate is too low because of too low current autotrophic biomass concentration.
3. Actual autotrophic biomass needs to be increased in more that 3 times.
11. Probable causes of the problem
1. In the near past occurred an episode of toxicity that had eliminated part of the autotrophic biomass, and now the biomass is not yet
recovered.
2. From time to time, there is hidden toxic spill in the influent that systematically is killing part of the autotrophic biomass.
12. Proposed plan to solve the problem
1. To raise the sludge age to the theoretical sludge retention time (23 days) or more.
2. To install in-situ a lab. BM respirometer in order to follow up the nitrification activity (respiration rate) and autotrophic biomass concentration.
3. During follow-up period, according to the current respirometry results, adapt the operative parameters (SRT & F/M) to the actual nitrification
condition.
4. If along the time, activity and autotrophic biomass concentration are not improving, try to seed the process by activated sludge from another
healthy plant with good nitrification performance.
5. If after all, the nitrification process is still going down, we can think about a specific online instrument to detect a possible toxicity that periodically
is damaging the nitrifier biomass (consult SURCIS)
SURCIS, S.L.
Encarnación, 125
08024 Barcelona
Tel.: 932 194 595 / 652 803 255
E-mail: [email protected]
www.surcis.com