Embed Size (px)
Citation preview

Bluefin Tuna Market Trends and Atlantic/Mediterranean
Stock Management:Competitive Analysis
and Sustainable Outlook
Roberto FuresiPietro Pulina
University of SassariItaly
Sustainable Exploitation of Bluefin Tuna in the Mediterranean Sea and Entrepreneurial Development: Current Experiences and Future ProspectsInternational WorkshopCarloforte (Sardinia, Italy), 3 June 2010

Outline
1.Bluefin Tuna International Trade2.The Japanese Market:
Competitive Analysis3.Bio-Economic Model for a
Scenario Analysis4.Outlook: Strategy and Policy for
Sustainable Tuna Industry
World Bluefin Tuna Import Dynamics
Source: FAO
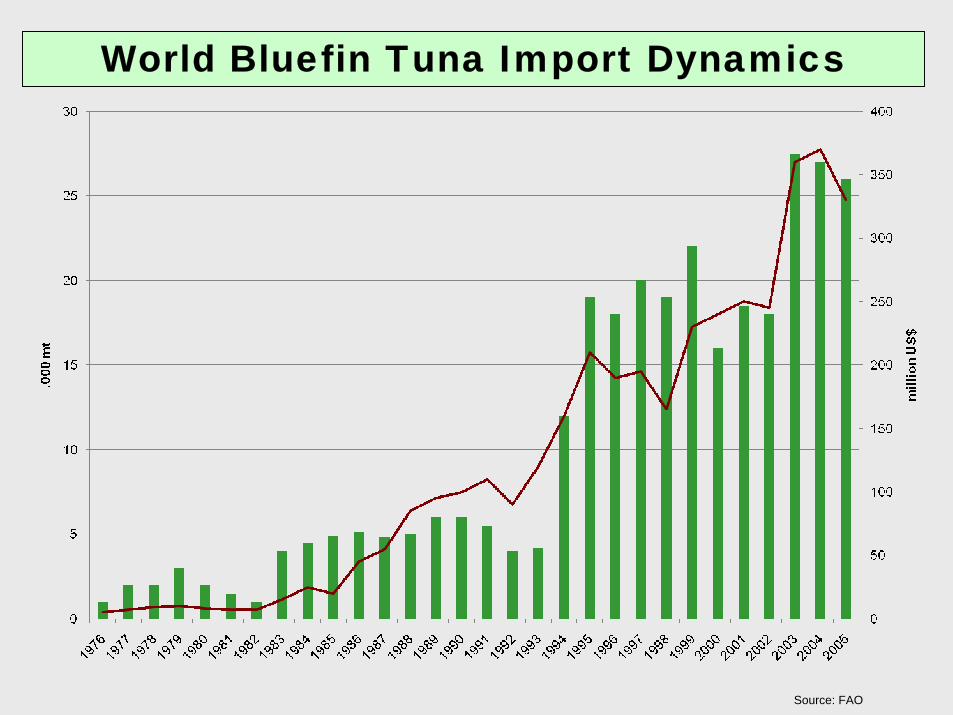
Bluefin Tuna World Import Shares
Source: FAO (2005)
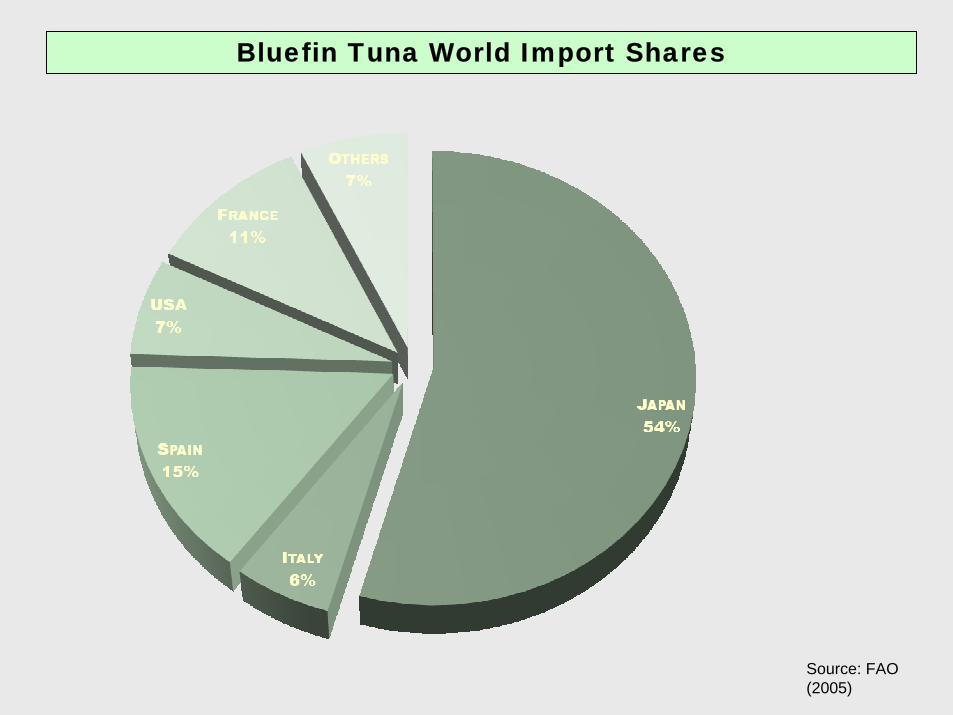
Bluefin Tuna Supply in Japan (RW)
Source:Japan Fish Traders Association
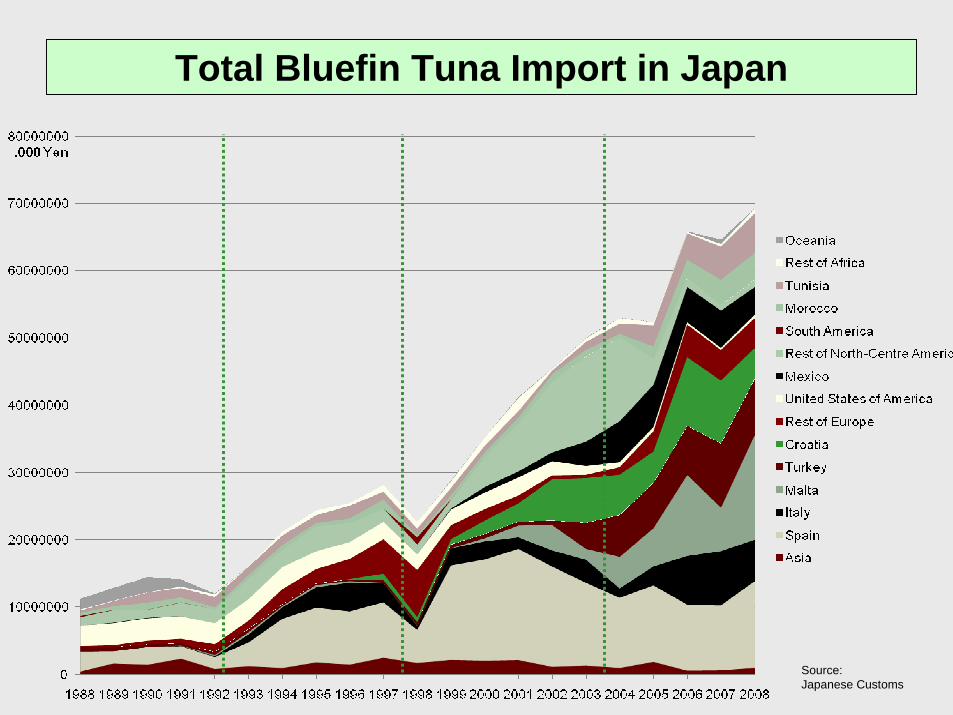
Total Bluefin Tuna Import in Japan
Source: Japanese Customs
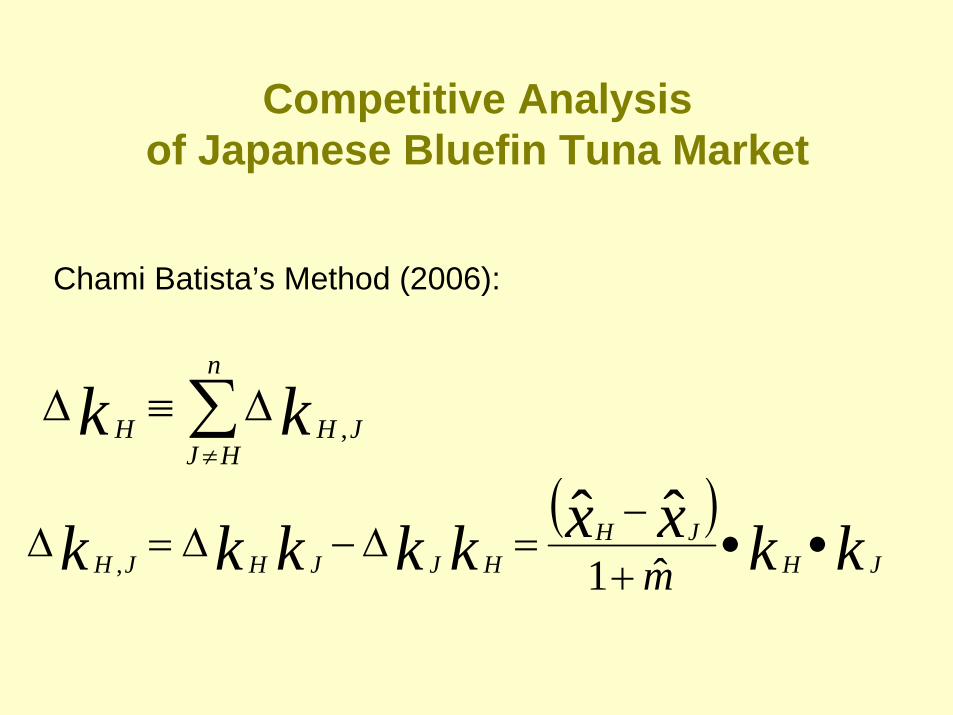
Competitive Analysisof Japanese Bluefin Tuna Market
∑≠
∆≡∆n
HJJHH kk ,
( )kkxxkkkkk JH
JHHJJHJH m
••+
−=∆−∆=∆
ˆ1ˆˆ
,
Chami Batista’s Method (2006):

Japanese Market SharesTransfers 1993-97/1988-92
Asia Spain Italy Malta Turkey Croatia
Rest of Europ
e USA Mexico
Rest of NC
America
South Americ
aMorocc
o TunisiaRest of
AfricaOceani
a Total
Asia 0,000%-
1,996%-
1,153%-
0,082% 0,119% -0,092%-
0,942% 0,445% 0,016% -0,381% 0,037% -0,008% -0,030%-
0,161% 0,737% -3,491%
Spain 1,996% 0,000%-
1,797%-
0,043% 0,885% -0,150%-
0,704% 5,529% 0,072% 1,849% 0,162% 0,922% 1,547%-
0,069% 3,243% 13,442%
Italy 1,153% 1,797% 0,000% 0,049% 0,404% -0,004% 0,442% 2,792% 0,028% 1,411% 0,061% 0,539% 0,921% 0,105% 1,209% 10,907%
Malta 0,082% 0,043%-
0,049% 0,000% 0,034% -0,004%-
0,009% 0,217% 0,003% 0,084% 0,006% 0,038% 0,064% 0,001% 0,117% 0,625%
Turkey-
0,119%-
0,885%-
0,404%-
0,034% 0,000% -0,032%-
0,376%-
0,131% 0,003% -0,279% 0,007% -0,058% -0,105%-
0,067% 0,134% -2,346%
Croatia 0,092% 0,150% 0,004% 0,004% 0,032% 0,000% 0,038% 0,221% 0,002% 0,114% 0,005% 0,043% 0,074% 0,009% 0,094% 0,882%Rest of Europe 0,942% 0,704%
-0,442% 0,009% 0,376% -0,038% 0,000% 2,453% 0,029% 1,007% 0,064% 0,438% 0,741% 0,024% 1,271% 7,575%
USA-
0,445%-
5,529%-
2,792%-
0,217% 0,131% -0,221%-
2,453% 0,000% 0,027% -1,468% 0,065% -0,227% -0,429%-
0,430% 1,318% -12,670%
Mexico-
0,016%-
0,072%-
0,028%-
0,003%-
0,003% -0,002%-
0,029%-
0,027% 0,000% -0,028% 0,000% -0,007% -0,013%-
0,005% 0,001% -0,231%Rest of
NC America 0,381%
-1,849%
-1,411%
-0,084% 0,279% -0,114%
-1,007% 1,468% 0,028% 0,000% 0,065% 0,169% 0,267%
-0,162% 1,302% -0,668%
South America
-0,037%
-0,162%
-0,061%
-0,006%
-0,007% -0,005%
-0,064%
-0,065% 0,000% -0,065% 0,000% -0,017% -0,031%
-0,012% 0,001% -0,529%
Morocco 0,008%
-0,922%
-0,539%
-0,038% 0,058% -0,043%
-0,438% 0,227% 0,007% -0,169% 0,017% 0,000% -0,008%
-0,075% 0,353% -1,562%
Tunisia 0,030%-
1,547%-
0,921%-
0,064% 0,105% -0,074%-
0,741% 0,429% 0,013% -0,267% 0,031% 0,008% 0,000%-
0,126% 0,621% -2,500%Rest of
Africa 0,161% 0,069%-
0,105%-
0,001% 0,067% -0,009%-
0,024% 0,430% 0,005% 0,162% 0,012% 0,075% 0,126% 0,000% 0,236% 1,205%
Oceania-
0,737%-
3,243%-
1,209%-
0,117%-
0,134% -0,094%-
1,271%-
1,318%-
0,001% -1,302%-
0,001% -0,353% -0,621%-
0,236% 0,000% -10,636%
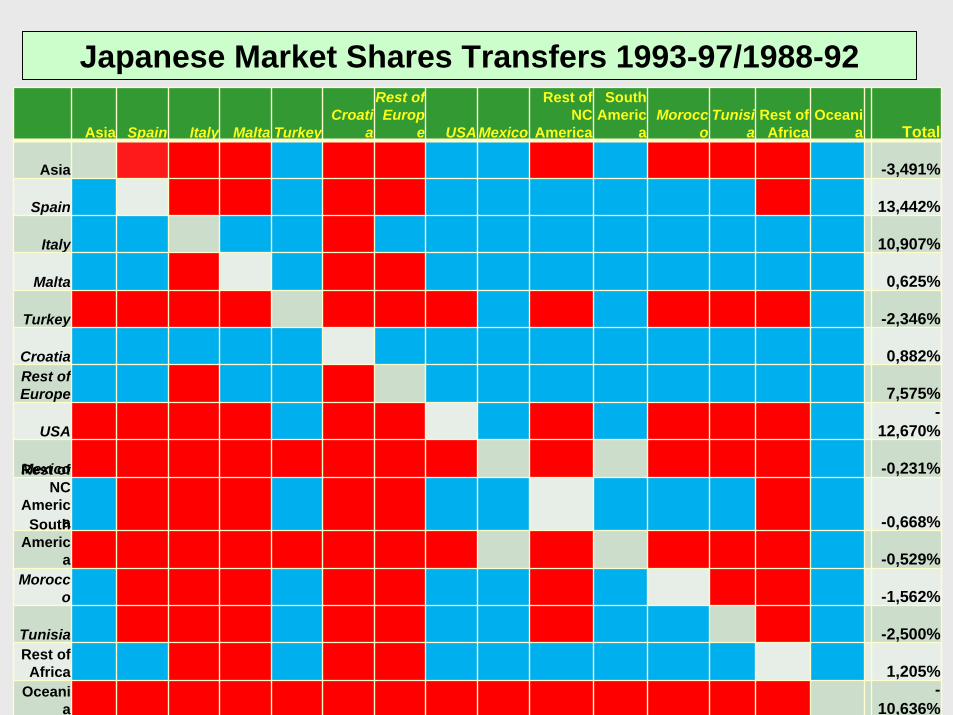
Japanese Market Shares Transfers 1993-97/1988-92
Asia Spain Italy Malta TurkeyCroati
a
Rest of Europ
e USA Mexico
Rest of NC
America
South Americ
aMorocc
oTunisi
aRest of
AfricaOceani
a Total
Asia -3,491%
Spain 13,442%
Italy 10,907%
Malta 0,625%
Turkey -2,346%
Croatia 0,882%Rest of Europe 7,575%
USA-
12,670%
Mexico -0,231%Rest of NC
America -0,668%South
America -0,529%
Morocco -1,562%
Tunisia -2,500%Rest of
Africa 1,205%Oceani
a-
10,636%
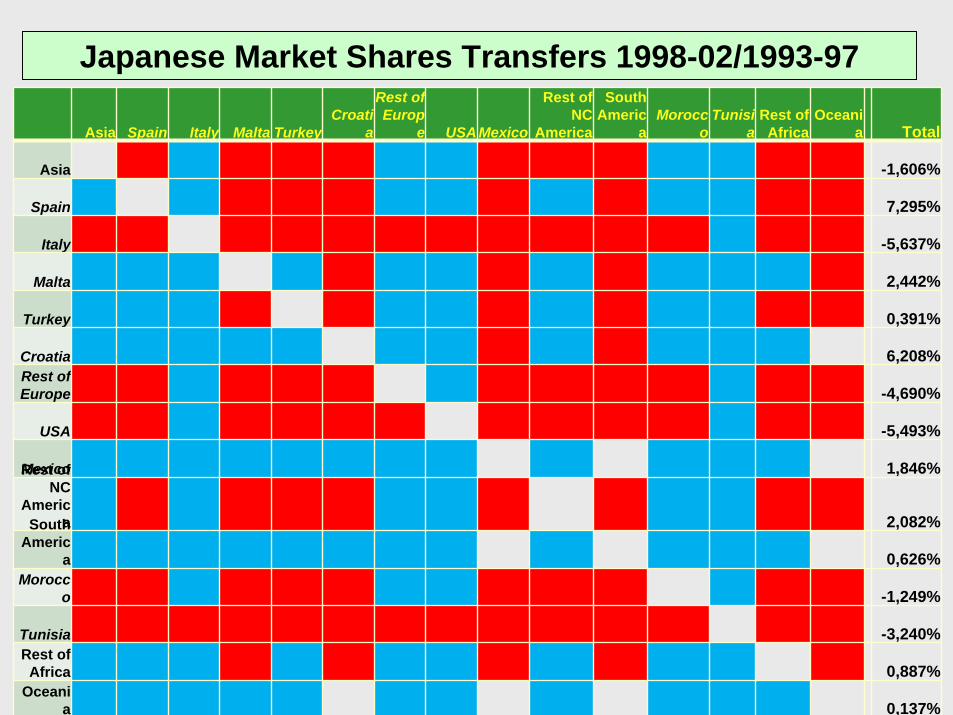
Japanese Market Shares Transfers 1998-02/1993-97
Asia Spain Italy Malta TurkeyCroati
a
Rest of Europ
e USA Mexico
Rest of NC
America
South Americ
aMorocc
oTunisi
aRest of
AfricaOceani
a Total
Asia -1,606%
Spain 7,295%
Italy -5,637%
Malta 2,442%
Turkey 0,391%
Croatia 6,208%Rest of Europe -4,690%
USA -5,493%
Mexico 1,846%Rest of NC
America 2,082%South
America 0,626%
Morocco -1,249%
Tunisia -3,240%Rest of
Africa 0,887%Oceani
a 0,137%
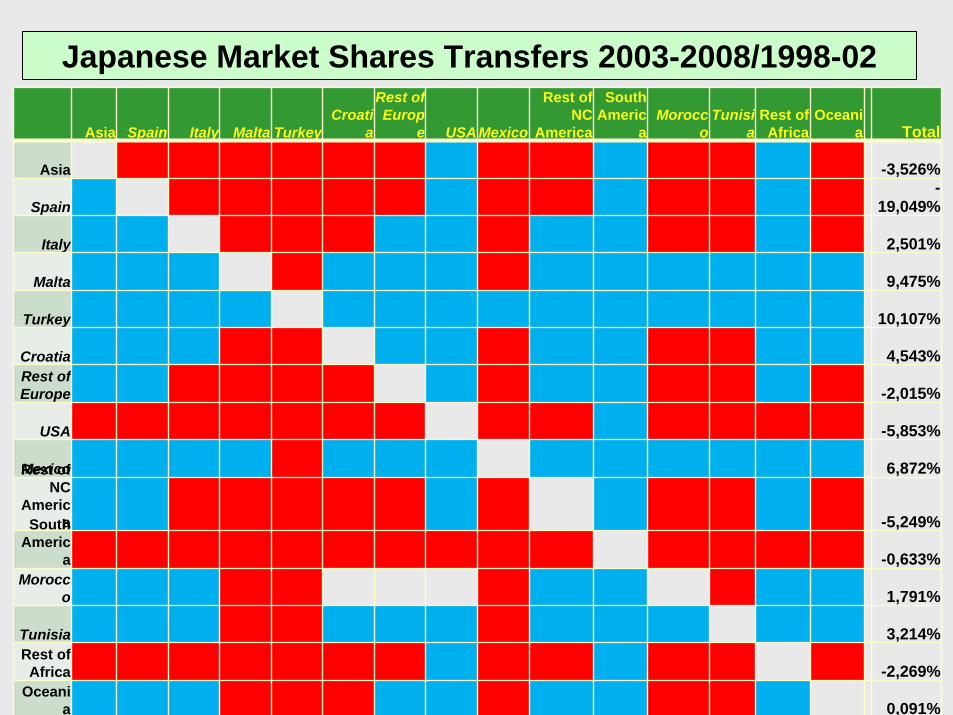
Japanese Market Shares Transfers 2003-2008/1998-02
Asia Spain Italy Malta TurkeyCroati
a
Rest of Europ
e USA Mexico
Rest of NC
America
South Americ
aMorocc
oTunisi
aRest of
AfricaOceani
a Total
Asia -3,526%
Spain-
19,049%
Italy 2,501%
Malta 9,475%
Turkey 10,107%
Croatia 4,543%Rest of Europe -2,015%
USA -5,853%
Mexico 6,872%Rest of NC
America -5,249%South
America -0,633%
Morocco 1,791%
Tunisia 3,214%Rest of
Africa -2,269%Oceani
a 0,091%

Japanese Market Shares Transfers 2003-2008/1988-92
Asia Spain Italy Malta TurkeyCroati
a
Rest of Europ
e USA Mexico
Rest of NC
America
South Americ
aMorocc
oTunisi
aRest of
AfricaOceani
a Total
Asia -8,624%
Spain 1,688%
Italy 7,771%
Malta 12,542%
Turkey 8,152%
Croatia 11,633%Rest of Europe 0,870%
USA-
24,016%
Mexico 8,487%Rest of NC
America -3,836%South
America -0,536%
Morocco -1,020%
Tunisia -2,526%Rest of
Africa -0,177%Oceani
a-
10,408%
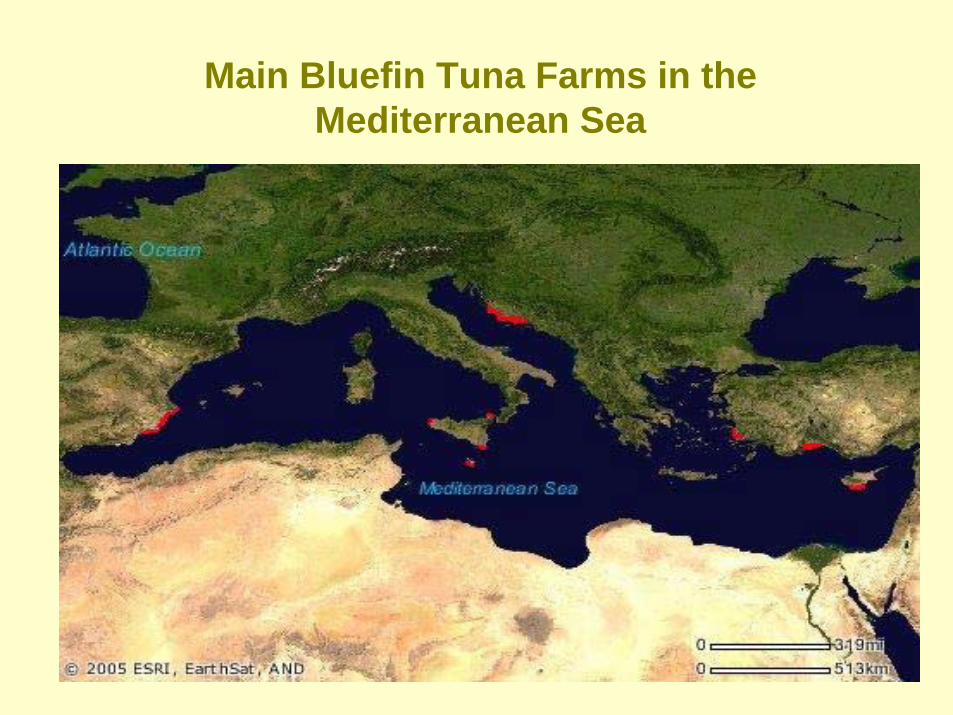
Main Bluefin Tuna Farms in the Mediterranean Sea
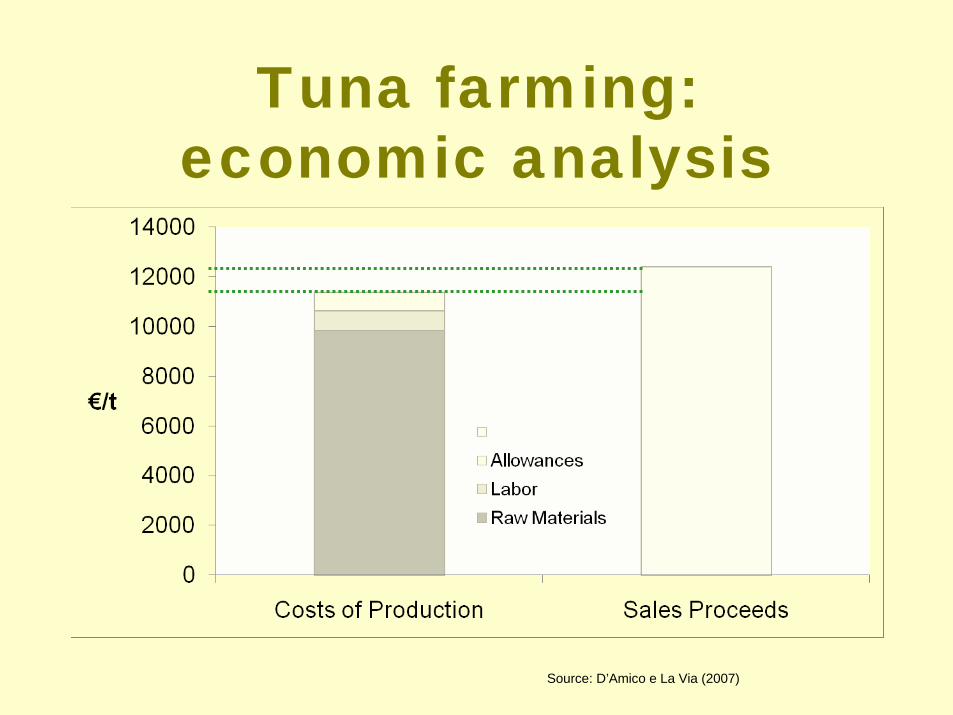
Tuna farming:economic analysis
Source: D’Amico e La Via (2007)
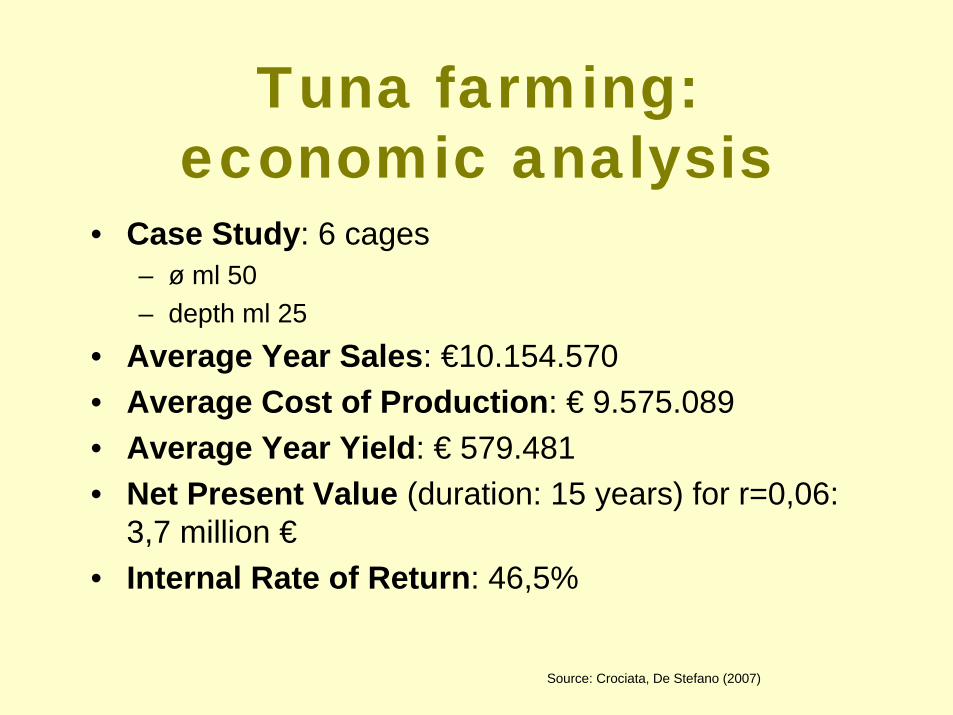
Tuna farming:economic analysis
Source: Crociata, De Stefano (2007)
• Case Study: 6 cages– ø ml 50– depth ml 25
• Average Year Sales: €10.154.570• Average Cost of Production: € 9.575.089• Average Year Yield: € 579.481• Net Present Value (duration: 15 years) for r=0,06:
3,7 million ۥ Internal Rate of Return: 46,5%
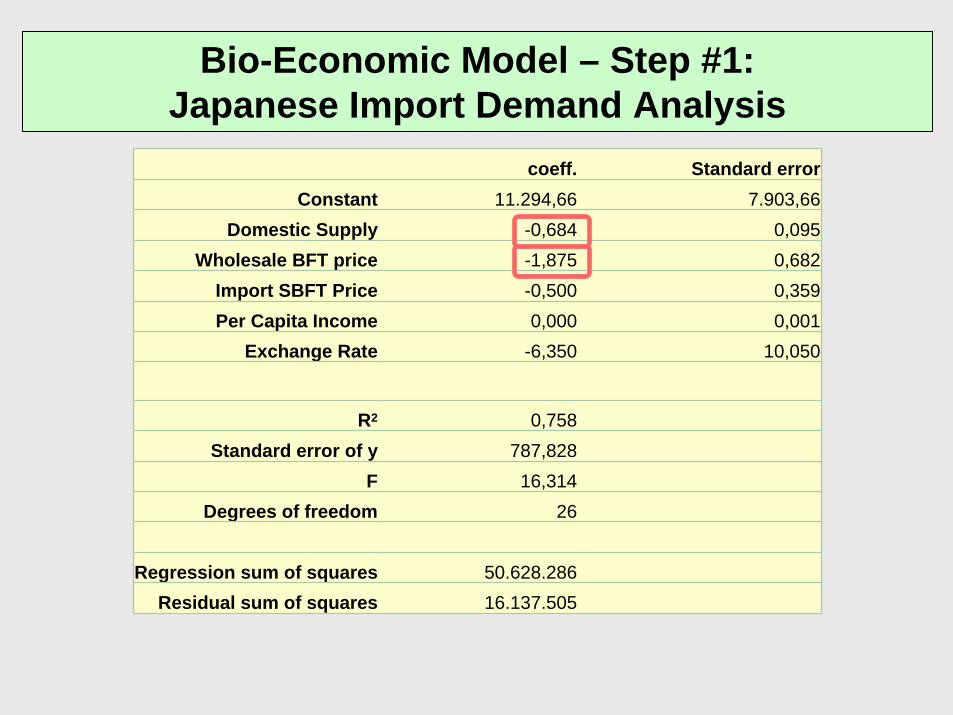
Bio-Economic Model – Step #1:Japanese Import Demand Analysis
coeff. Standard errorConstant 11.294,66 7.903,66
Domestic Supply -0,684 0,095Wholesale BFT price -1,875 0,682
Import SBFT Price -0,500 0,359Per Capita Income 0,000 0,001
Exchange Rate -6,350 10,050
R2 0,758Standard error of y 787,828
F 16,314Degrees of freedom 26
Regression sum of squares 50.628.286Residual sum of squares 16.137.505
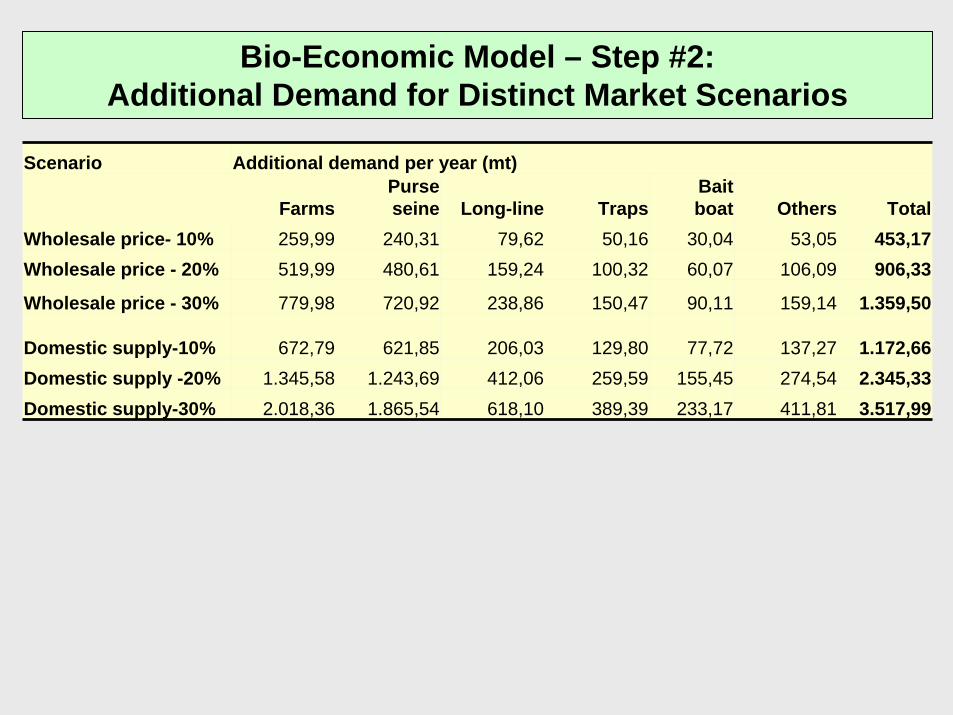
Bio-Economic Model – Step #2:Additional Demand for Distinct Market Scenarios
Scenario Additional demand per year (mt)
FarmsPurse seine Long-line Traps
Baitboat Others Total
Wholesale price- 10% 259,99 240,31 79,62 50,16 30,04 53,05 453,17Wholesale price - 20% 519,99 480,61 159,24 100,32 60,07 106,09 906,33
Wholesale price - 30% 779,98 720,92 238,86 150,47 90,11 159,14 1.359,50
Domestic supply-10% 672,79 621,85 206,03 129,80 77,72 137,27 1.172,66Domestic supply -20% 1.345,58 1.243,69 412,06 259,59 155,45 274,54 2.345,33Domestic supply-30% 2.018,36 1.865,54 618,10 389,39 233,17 411,81 3.517,99
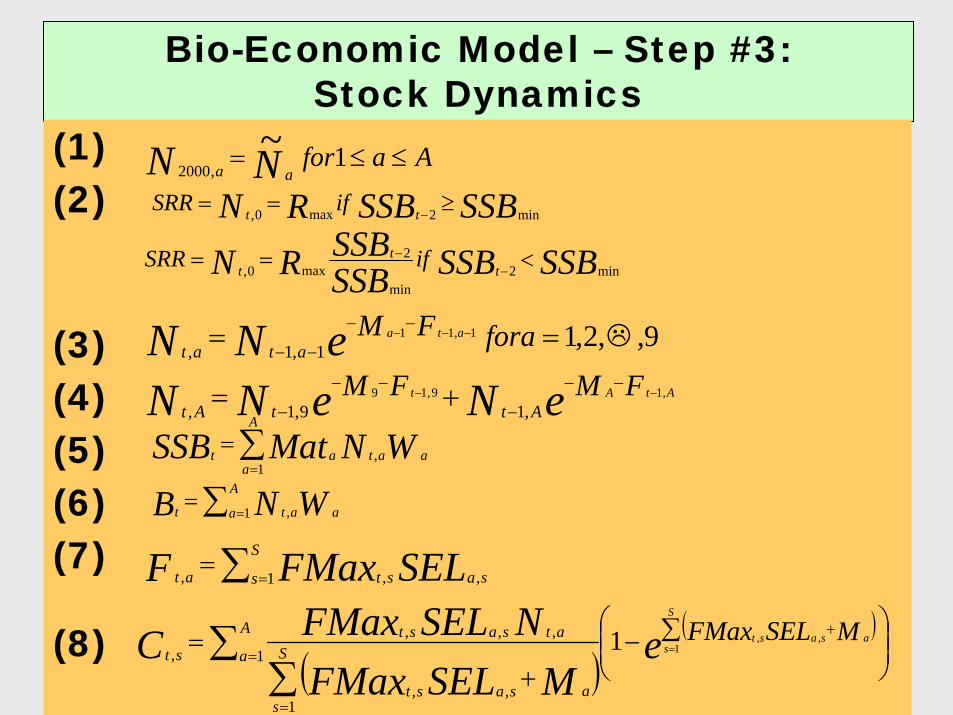
Bio-Economic Model – Step #3:Stock Dynamics
(1)(2)
(3)(4)(5)(6)(7)
(8)
AaforNN aa≤≤= 1~
,2000
SSBSSBRN tt ifSRR min2max0, ≥==−
SSBSSBSSBSSBRN t
tt
ifSRRmin2
min
2max0,
<==−
−
9,,2,11,11
1,1,== −−−
−−
−−foraFMeNN ata
atat
eNeNN FMFM AtAt
AttAt,19,19
,19,1,−−
−−
−
−−
−+=
WNMatSSB aat
A
aat ,
1∑=
=
WNB a
A
a att ∑ ==
1 ,
SELFMaxF sa
S
s stat ,1 ,, ∑ ==
( )( )
⎟⎟⎠
⎞⎜⎜⎝
⎛ ∑−+
= =
+
=
=
∑∑
eMSELFMax
NSELFMaxCS
sasast MSELFMaxA
a S
sasast
atsastst 1
,,11
1,,
,,,,
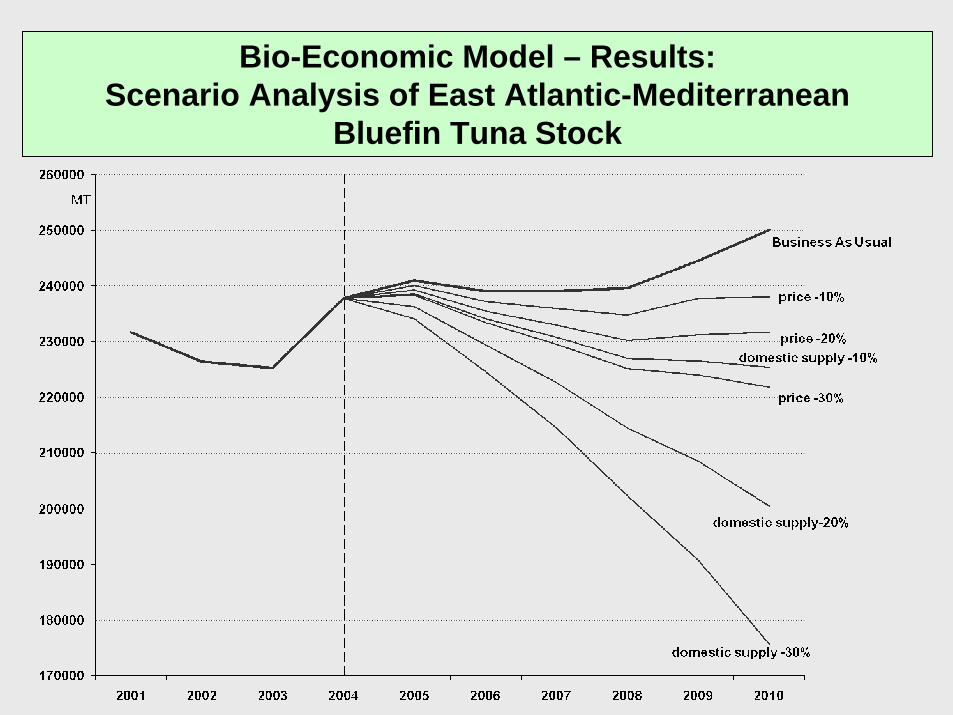
Bio-Economic Model – Results:Scenario Analysis of East Atlantic-Mediterranean
Bluefin Tuna Stock

A New Equlibrium betweenEconomic and Environmental
Sustainability• Gordon’s Paradox, “Tragedy of Commons”
and the Fisherman’s Dilemma• TACs and Optimal Externalities• Overfishing, Frozen Storage and Speculation• Spawning Bluefin in Captivity? A “Hope from
the Research”• Ecological Footprint of Tuna Farming• Territorial Marketing
Territorial Marketing• Product, Industry and Territory: A Synergic Network
of Relationships• Product-Country Image: Country Equity• Tuna can be a Typical “Area-Product”
– Tradition– Local Environment, Knowledge and Social Relationships not
reproducible elsewhere– Competitive Advantages
• Mediterranean Bluefin Tuna Needs a Marketing Replacement
• The “Laboratory” of Carloforte

Multiple Functions of Agricultural, Forestryand Fisheries Industries