Embed Size (px)
Citation preview

Innovation Trends Retooling the U.S. Economy.Why it Should Matter to Investors.
IN BRIEFOctober 2014BLUE
PAPER What happened to the jobs? In our opinion, much of the public pessimism on the U.S. economy is rooted in the challenges that the labor sector is facing. We are convinced that the weakness of the job market is linked to the technological replacement of workers driven by new distruptive technologies.
Innovation trends in the U.S.We have identified three major trends that are transforming the U.S. economy. Automation of knowledge work, advanced robotics and the energy revolution are driving growth in productivity and have contributed to the increase in U.S. competitiveness.
Research in an era of innovation Every economic transition generates dislocations. This has significant ramifications for the investment landscape. At Pioneer Investments we are committed to evolving our investment approach to the rapidly changing economic and market environment.

BLUE PAPER │ Innovation Trends Retooling the U.S. Economy October 2014
1
ContributorsMichael Temple is Senior Vice President, Director of Credit Research, U.S. and Portfolio Manager based in Boston. He is responsible for oversight of Pioneer’s U.S. credit research department. His duties include independent research of credits, sector analysis, and coordination of research efforts in high yield, bank loan, investment grade, emerging markets, and municipal credit. Paresh Upadhyaya is Senior Vice President, Director of Currency Strategy, U.S.. He leads Pioneer Investments’ currency research effort out of Boston and serves as an advisor to the firm’s global fixed-income and equity investment staff on currency-related issues. He is a member of Pioneer’s 33-person U.S. fixed income team.Claudia Bertino and Laura Fiorot are part of a team dedicated to developing investment insights and thought leadership initiatives in conjunction with our global team of investment professionals, for our clients and the financial community.
Key Insights → The label Stagnation appears to have captured the public’s mood. In the eyes of many, this
freight train of seemingly unsolvable problems - cost and quality of education, income disparity, structural unemployment - is leading to an accelerating decline of the U.S. and a possible near-term repeat of the Global Financial Crisis that ravaged investor portfolios.
→ In our opinion, much of the public pessimism on the U.S. economy is rooted in the challenges that the labor sector is facing, and the fear that the rise in the unemployment rate is structural. Our analysis shows that the weak employment cycle began a long time ago and that the labor force participation rate has declined even in the most productive segments. We are convinced that these signs of structural weakness are linked to the technological replacement of human workers.
→ Disruptive technologies such as the steam engine, electricity and the automobile destroyed numerous industries, caused significant unemployment and put out to pasture a lot of horses. But new industries also turbo-charged economic growth and ultimately created more jobs than were eliminated. The difficulty today is in seeing through this painful period of industrial restructuring and recognizing that humans are not the “horses” in this technological roadmap.
→ We have identified three major trends that are transforming the U.S. economy. Automation of knowledge work and advanced robotics are two trends that may result in short term job losses. However, we found that improvements in industrial production may drive unemployment lower over time. Advances in energy technology comprise the third transformational trend, and are driving a production boom and a decrease in energy prices.
→ The combination of this energy advantage and the growth in productivity driven by automation and robotics has contributed to increase U.S. competitiveness and is driving the transition towards a re-industrialization of the U.S.
→ Every economic transition generates dislocations. Society ultimately adapts but the transition will be difficult to navigate for those unable to “keep up”. This has significant ramifications for the investment landscape. Investors that use traditional frameworks to analyze the market, picking winners and losers based on outdated valuation relationships, or assessing macro-economic policy based on an irrelevant historical paradigm, run the risk of focusing on the wrong things.
→ For this reason, at Pioneer Investments, we are looking far ahead and are committed to developing new macro and micro economic research tools to help our investment approach adapt to the rapidly evolving economic and market environment.
Other Contributors Claudia BertinoHead of Financial Communication Global Strategy and Marketing
Laura FiorotFinancial Communication Specialist Global Strategy and Marketing
Michael TempleSenior Vice President, Director of Credit Research, US
Paresh UpadhyayaSenior Vice President, Director of Currency Strategy, US

BLUE PAPER │ Innovation Trends Retooling the U.S. Economy October 2014
2
What Happened to the Jobs? Challenging the Mood of PesimismFive years after the Great Financial Crisis (GFC), despite improvements in GDP growth and employment, the US public still seems to be oppressed by a cloud of negative sentiment.
A recent PewResearch Survey (07/14/14) found that a majority of Americans still perceive the economic climate as poor or at best fair (83%), a level still far below pre-crisis sentiment (see Chart 1).
Five years after the Great Financial Crisis, despite improvements in GDP growth and employment, the U.S. public still seems to be oppressed by a cloud of negative sentiment.
The label “Stagnation” appears to have captured the public’s mood. In the eyes of many, this freight train of seemingly unsolvable problems - cost and quality of education, income disparity, structural unemployment - is leading to an accelerating decline of the U.S. and a possible near-term repeat of the GFC that ravaged investor portfolios.
We don’t deny that many daunting challenges lie ahead. But dynamic, longer-term trends are opening up entirely new avenues of invention and industry. As we will see, they could potentially usher in an era of stunning growth and prosperity. These trends will be driven
Chart 1: How Would you Rate Economic Conditions in this Country Today?100
80
60
40
20
02004 2005 2006 2007 2008 2009 2010 2011 2012 2013 2014
Fair/Poor Excellent/GoodSource: PEW Research. Data as of July 14, 2014.
% of
Res
pond
ents
Insights→ We believe that much of the public pessimism on the U.S. economy is rooted in the
challenges that the labor sector is facing and the fear that the rise in the unemployment rate is structural (“Stagnationists” argument).
→ The weak employment cycle began a long time ago with the deceleration of labor force growth driven by secular demographic trends. Labor force participation has declined even in the most productive segments, a signal of the job market’s structural weakness.
→ We believe that the labor arbitrage that took place in the manufacturing sector over the past 25 years masked a wider phenomenon of technological arbitrage, that impacted sectors where innovation has been able to replace the human worker.
BLUE PAPER │ Innovation Trends Retooling the U.S. Economy October 2014
3
by the continued arc of technological progress, manifesting in a number of groundbreaking areas. Some of these include massive communication inter-connectedness, automation, artificial intelligence, nano/ bio-technology, and radical new educational models. Many are developing because of the challenges our society faces.
We are optimists and think it is time to step back from the fear and uncertainty that currently characterizes the public mood and explore these trends, their impact on the economy and their implications for investors.
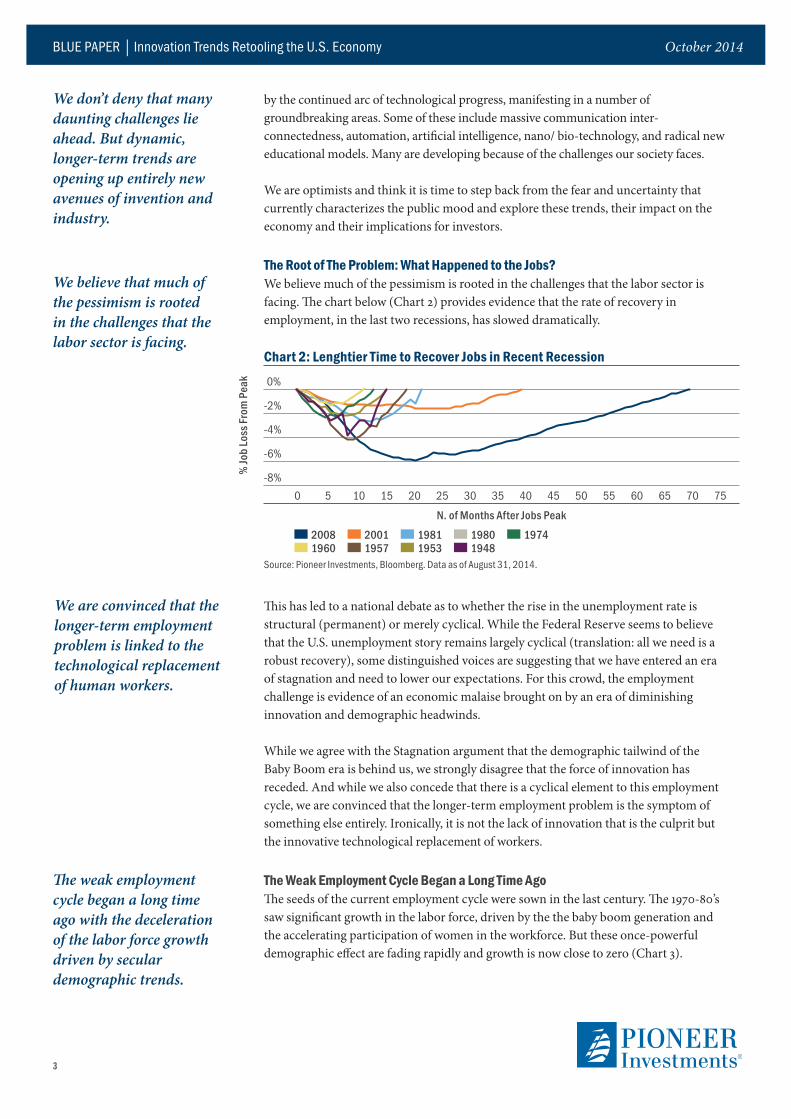
The Root of The Problem: What Happened to the Jobs?We believe much of the pessimism is rooted in the challenges that the labor sector is facing. The chart below (Chart 2) provides evidence that the rate of recovery in employment, in the last two recessions, has slowed dramatically.
We don’t deny that many daunting challenges lie ahead. But dynamic, longer-term trends are opening up entirely new avenues of invention and industry.
We believe that much of the pessimism is rooted in the challenges that the labor sector is facing.
This has led to a national debate as to whether the rise in the unemployment rate is structural (permanent) or merely cyclical. While the Federal Reserve seems to believe that the U.S. unemployment story remains largely cyclical (translation: all we need is a robust recovery), some distinguished voices are suggesting that we have entered an era of stagnation and need to lower our expectations. For this crowd, the employment challenge is evidence of an economic malaise brought on by an era of diminishing innovation and demographic headwinds.
While we agree with the Stagnation argument that the demographic tailwind of the Baby Boom era is behind us, we strongly disagree that the force of innovation has receded. And while we also concede that there is a cyclical element to this employment cycle, we are convinced that the longer-term employment problem is the symptom of something else entirely. Ironically, it is not the lack of innovation that is the culprit but the innovative technological replacement of workers.
The Weak Employment Cycle Began a Long Time AgoThe seeds of the current employment cycle were sown in the last century. The 1970-80’s saw significant growth in the labor force, driven by the the baby boom generation and the accelerating participation of women in the workforce. But these once-powerful demographic effect are fading rapidly and growth is now close to zero (Chart 3).
We are convinced that the longer-term employment problem is linked to the technological replacement of human workers.
The weak employment cycle began a long time ago with the deceleration of the labor force growth driven by secular demographic trends.
Chart 2: Lenghtier Time to Recover Jobs in Recent Recession 0%
-2%
-4%
-6%
-8%0 5 10 15 20 25 30 35 40 45 50 55 60 65 70 75
N. of Months After Jobs Peak
2008 2001 1981 1980 1974 1960 1957 1953 1948
Source: Pioneer Investments, Bloomberg. Data as of August 31, 2014.
% Jo
b Lo
ss Fr
om P
eak

BLUE PAPER │ Innovation Trends Retooling the U.S. Economy October 2014
4
While cyclical forces were partly to blame as the first decade of the 21st century witnessed two difficult recessions, the decline of labor force growth was largely driven by a secular trend that is the foundation of the Stagnationists argument - demographics.
The key elements of this include: → Retiring Baby-Boomers who are leaving the labor force voluntarily. This, the largest
wave of employees this country has ever witnessed, is now crashing upon the shores of Florida and other retirement hotspots.
→ Female labor participation, the largest growth driver of the labor force in the past 50 years, has plateaued and is now in modest decline.
→ Immigration has come to a standstill on a net basis, due in large part to improving economic activity in emerging markets coupled with subpar jobs growth following the last recession in the U.S.
Although the labor supply is largely driven by population growth, it is also dependent on the share of the working-age population that is actually in the labor market. This “participation rate” has been on the decline since 2000, accelerating to the downside since the last recession (Table 1, Chart 4).
The decline in the participation rate is partly an artifact of demographics as more people retire and leave the workforce. But contrary to conventional wisdom, this has not been the key driver in the decline. As the table below highlights, the key loss has been in the younger population (as this segment of the population has stayed in school longer) and, surprisingly, in the most productive sector of the workforce (25-54 year olds).
Table 1: Participation Rate by Age (% Employed Full Time vs Total Population)Participation Rate 1994 2004 2014 Change (1994-2014)Age 16-24 years 66,5 61,2 55,2 -11,3Age 25-54 years 83,5 82,6 80,8 -2,7Age 55 years and over 30,2 36,6 40,1 +9,9Total Working Population 66,7 65,9 62,9 -3,8Source: Pioneer Investments, Bureau of Labor Statistics. Data as of July 31, 2014.
This segment should be the most resilient to cyclical and demographic trends but it has clearly suffered a setback. To analyze this disturbing trend and its implications for the U.S. economy, we need some historical context.
The participation rate has been on the decline since 2000, accelerating to the downside since the last recession.
Chart 3: US Labor Force Not Growing Anymore3.0%
2.5%
2.0%
1.5%
1.0%
0.5%
0.0%1964 1974 1984 1994 2004 2014
Source: Pioneer Investments, Bureau of Labor Statistics. 1-Year Change on 5-Year Moving Average on Labor Force. Data as of July 31, 2014.
1-Ye
ar C
hang
e on 5
-Yea
r M
ovin
g Ave
rage
on La
bor F
orce

BLUE PAPER │ Innovation Trends Retooling the U.S. Economy October 2014
5
From Geographical Outsourcing to Technological OutsourcingWe believe labor arbitrage is the dominant force behind the rise in structural unemployment. The first chapter of this story began in the 1980’s when American business was confronted with increasing competition from Europe and Japan, and accelerated through the 90’s as China opened up.
The relocation of manufacturing to areas of the world where labor was dramatically cheaper resulted in a loss of jobs in the U.S. Despite the loss of 7 million manufacturing jobs over 3 decades, and the decline of manufacturing as a percentage of GDP (currently 13% down from high teens in 1990’s), the absolute size of manufacturing output continued to grow (Chart 5).
One reason for structural weakness in the U.S. job market is the growing competition from China, which accelerated through the 90s.
Chart 4: US Participation Rate Down Since the Recession67
66
65
64
63
62 2007 2009 2011 2013
Part Rate 25-54 Years (Right) Participation Rate (Left)Source: Pioneer Investments, Bureau of Labor Statistics. Data as of July 31, 2014.
Labor force participation has declined even in the most productive segments.
84
83
82
81
80
79%
%
Chart 5: US Manufacturing Jobs on Downward Trend
25,000
20,000
15,000
10,000
5,0001984 1989 1994 1999 2004 2009 2014
US Industrial Production (Right) US Manufacturing Jobs (Left)Source: Pioneer Investments, Bloomberg. Data as of July 31, 2014.
Man
ufac
turin
g Job
s in
Thou
sand
s 2007 = 100
125
100
75
50
25
This was possible because productivity growth exploded. Today’s manufacturing employee produces more than twice the amount as the same worker in 1990. This growth in productivity has been driven by technological innovation, automation and lean manufacturing.
It is understandable why many pundits point to the loss of manufacturing as the central driver of jobs lost over the last 25 years –but the story is more complicated than that.
BLUE PAPER │ Innovation Trends Retooling the U.S. Economy October 2014
6
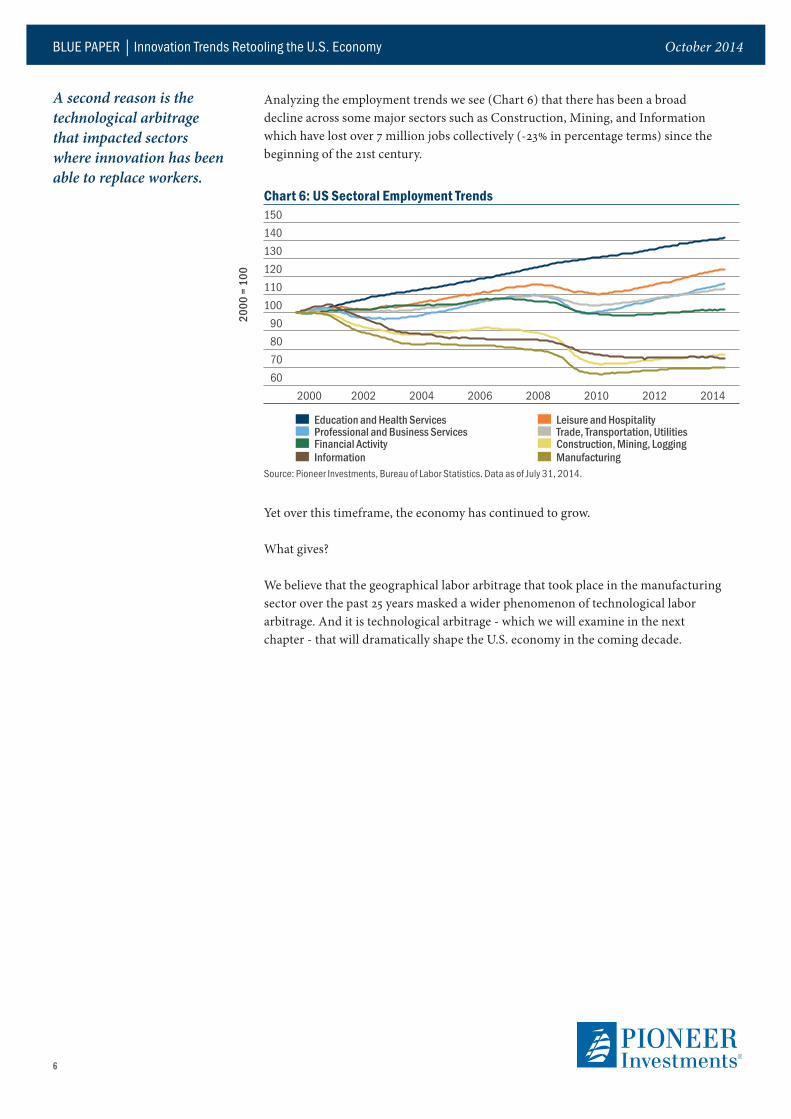
Analyzing the employment trends we see (Chart 6) that there has been a broad decline across some major sectors such as Construction, Mining, and Information which have lost over 7 million jobs collectively (-23% in percentage terms) since the beginning of the 21st century.
A second reason is the technological arbitrage that impacted sectors where innovation has been able to replace workers.
Chart 6: US Sectoral Employment Trends150140130120110100 90 80 70 60
2000 2002 2004 2006 2008 2010 2012 2014
Education and Health Services Leisure and Hospitality Professional and Business Services Trade, Transportation, Utilities Financial Activity Construction, Mining, Logging Information Manufacturing
Source: Pioneer Investments, Bureau of Labor Statistics. Data as of July 31, 2014.
2000
= 1
00
Yet over this timeframe, the economy has continued to grow.
What gives?
We believe that the geographical labor arbitrage that took place in the manufacturing sector over the past 25 years masked a wider phenomenon of technological labor arbitrage. And it is technological arbitrage - which we will examine in the next chapter - that will dramatically shape the U.S. economy in the coming decade.

BLUE PAPER │ Innovation Trends Retooling the U.S. Economy October 2014
7
The 32nd square of the game of “invention.”We believe that technology is advancing far more rapidly than many of us can fathom. And it is not just discovery but also societal adoption. History shows a constant acceleration in the societal adoption of the major communication technological advances (Chart 7).
We believe that technology is advancing far more rapidly than many of us can fathom. Over the next decade, computational power and the innovations that flow from this exploding phenomenon will cascade throughout our economy.
Chart 7: Speed of Technology Adoption in US
50
40
30
20
10
01873 1876 1897 1926 1975 1983 1991 2010
First Commercially Available YearSource: Pioneer Investments, Economist, PEW Research. Data as of July 31, 2014.
Year
s Unt
il Use
d by O
ne-Q
uarte
r of
Amer
ican P
opul
atio
nElectricity, 46
Telephone, 35
Television, 26
Cellphone, 13Internet, 7 Tablet, 3
PC, 16
Radio, 31
The problem is, we are conditioned to the idea of linear growth - progress that marches steadily forward. But science is not following a linear path. It is rocketing forward on an exponential one.
In 1965 Gordon Moore, co-founder of Intel, predicted that computing power would double every two years. The phenomenon eventually became known as Moore’s Law. It is an example of geometric or exponential growth and the implications are hard to grasp.
The renowned futurist, Ray Kurzweil, illustrates the consequences of confusing exponential growth with linear growth by retelling the ancient parable of an Indian ruler and the inventor of Chess.
The ruler, delighted by the game, accepted the inventor’s equation of payment: a single grain of wheat for the first square of the game, two grains for the second, four for the third, and so on, doubling the amount each time. By the time the ruler’s servants finished delivering the required amount of grain through the first 32 squares, the inventor had amassed a pile approximately four feet high. By the end of the chessboard, the wheat pile had grown to the size of Mt Everest!
The “wheat” today is computational power. Doubling every12-18 months, it has increased a million-fold, providing a $400 smart phone with the same computational power of a $5M, room-sized mainframe in 1975.
We believe that society has landed on the 32nd square of the game of “invention.” Over the next decade, computational power, and the innovations that flow from this exploding phenomenon will cascade throughout our economy.
BLUE PAPER │ Innovation Trends Retooling the U.S. Economy October 2014
8
Innovation Trends in the U.S.Since the first Industrial Revolution in the 1800’s, technology has been radically reshaping economies. The steam engine, electricity and the automobile disrupted numerous industries, caused significant unemployment and put out to pasture a lot of horses. But new industries ultimately turbo-charged economic growth and created more jobs than were eliminated. The difficulty today is in seeing through this painful period of industrial restructuring and recognizing that humans are not the “horses” in this technological roadmap.
Trend #1 The Automation of Knowledge WorkThe use of computers or computer-like devices to perform complex analyses and creative problem solving is not new. Over the years, computers have taken over many of the tasks performed by humans. We can see this in our daily lives. For example, self-check-out stations at the grocery store and check-in kiosks at the airport have begun to replace cashiers and airline staff. ATM’s took over the work of bank tellers and on-line airline reservation systems replaced travel agents. Some occupations, such as telemarketers and typists, have been almost entirely automated.
These trends are accelerating. While the pace of knowledge work automation is being driven by advances in computational power, other accompanying technologies are helping enable this shift. These include significant strides in data storage, big data (enabling the analysis of huge amounts of data), cloud computing (delivering knowledge work automation to individuals via Internet-enabled devices), machine learning and natural user interfaces such as speech recognition.
The difficulty today is in seeing through this painful period of industrial restructuring and recognizing that disruptive technologies will also open new opportunities.
Insights→ Trend #1 - Worldwide, over the next decade, knowledge work automation is likely to affect
millions of jobs, especially clerical, sales, education and IT. This trend is driven by advances in computational power which will drive increases in productivity.
→ Trend #2 - Robot use is multiplying rapidly, thanks to recent innovation. Demand is expected to rise, while costs should fall. As robotic costs plummet, smaller businesses are taking advantage of their cost-cutting capabilities to increase productivity.
→ Trend #1 + # 2 Implication - Automation of knowledge work and advanced robotics may result in short term job losses. However, over the longer period, we found that improvements in industrial production may result in lower unemployment.
→ Trend #3 - Energy technological advances are driving the production boom and the decrease in energy prices. The U.S. energy advantage combined with the growth in productivity has contributed to increase U.S. competitiveness and is driving the re-industrialization of the U.S.

BLUE PAPER │ Innovation Trends Retooling the U.S. Economy October 2014
9
Worldwide, over the next decade, knowledge work automation it is likely to affect 100 million jobs that cost business and society $5-6 Trillion annually1. Occupations such as clerical, sales, education and IT are among those that could see the major impact of automation in the future, but fields commonly thought to be impervious to automation will be affected as well. Law firms, for example, are using computers that can scan thousands of legal briefs and precedents to assist in pretrial research—work that would once have taken hundreds or thousands of hours of paralegal labor.
The examples are numerous and in virtually every industry:→ Standard Chartered bank has opened “smart banking” branches that only employ
three people. At these branches, customers do their banking on computer screens, connecting to specialists by video-conference when needed.
→ Rio Tinto has built the world’s first long-haul, heavy-duty driverless train system for its Pilbara iron-ore mines in Western Australia. The trains are part of Rio Tinto’s “Mine of the Future” program, which includes 150 driverless trucks.
Trend #2 Advanced RoboticsRobots are getting a lot of press lately -- for good reason. Google’s purchase of Boston Dynamic (their “Cheetah” robot can run faster than a man) and Jeff Bezo’s assertion that Amazon would be using drones to deliver packages by 2020 have caught the public’s imagination. But the use of robots is not new news. They started on GM’s and Toyota’s manufacturing floors in the 1960’s. Originally delegated to difficult or dangerous industrial work, robots can now perform tasks, such as picking, packing or manipulating small electronic parts, that demand versatility and dexterity. As a result, their use is multiplying rapidly.
The global demand for robots is expected to grow by 8% per year through 2016, dramatically outpacing the world’s manufacturing activity. By 2016, the total number of multipurpose industrial robots is forecast to hit 1.6 million (Table 2).
Table 2: Industrial Robot Demand SoaringData in 000 2011 2012 2013 2016 % Change (2011-2016)Americas 193 207 227 281 46Asia/Australia 577 629 734 909 58Europe 370 381 389 432 17Africa/Other 14 19 24 38 171Total 1,144 1,233 1,370 1,661 45Source: Pioneer Investments, International Federation of Robotics, World Robotics 2013.
1Source: McKinsey Global Institute. Disruptive technologies: advances that will transform life, business and the global economy, May 2013.
Worldwide, over the next decade, knowledge work automation is likely to affect millions of jobs, especially clerical, sales, education and IT.
Robot use is multiplying rapidly, thanks to recent innovation. Industrial robot sales are expected to rise significantly in the next years.
BLUE PAPER │ Innovation Trends Retooling the U.S. Economy October 2014
10
There are numerous factors behind this accelerating demand including: → Global competition and increasing labor costs in many areas of the world
previously perceived as low wage countries;→ Technological improvements allowing for a wider use of robots in smaller, less
scalable segments of the economy;→ Falling prices due to economies of scale.
As the complexity and versatility of robots grows exponentially (ushered upwards by Moore’s Law). costs are following the opposite path. The industry expects that the price of an industrial robot, which currently averages $100,000-$150,000, will drop by over 50% within the next 5 years, and this is a conservative estimate. Last year, a revolutionary new robot called “Baxter,” which senses and adapts to its environment, was brought to market by Rethink Robotics. The price tag: $22,000.As robotic costs plummet, smaller businesses are taking advantage of their cost-cutting capabilities. Examples include: → Earthbound Farms in California installed four robots in 2012 to place clamshell
containers over organic lettuce; and → Vanguard Plastics, a small injection molding company in Connecticut, replaced
its line workers in 2013 with Baxter-like robots.
Trend #1 & #2 Implication – How will they Affect Jobs?Automation of knowledge work and the use of robots should increase productivity, but how will it affect jobs? The chief concern is that these trends will result in a permanent, structural loss of employment.
If the past is any guide, this fear is unfounded. In previous instances of technological job elimination, what began as a net job loss later turned into a powerful catalyst to job growth. Take agriculture for example. At the turn of the 19th century, 70-80% of the population worked on the farm. Today, after a century of technological innovation, less than 2% are employed by the farming industry. Despite the loss of jobs in the agricultural sector, jobs created in the manufacturing and service sector led to a dramatic increase in prosperity.
While public attention today is focused on the jobs lost to automation, a recent survey from the Manufacturing Institute and Accenture (January 2014) indicated that the shortage of skilled workers has been growing. More than 75% of manufacturers interviewed reported being unable to fill positions that required advanced training. We suspect that, as with past periods of technological job replacement, a “skill gap” has been created. This gap eventually gets filled through education, training and a general redirection of resources.
We have analyzed the annual changes in industrial production compared to changes in the unemployment rate over the last 60 years (Chart 8).
We suspect that, as with past periods of technological job replacement, there is a “skill gap” that occurs as a result of a tectonic shift in skill demand.

BLUE PAPER │ Innovation Trends Retooling the U.S. Economy October 2014
11
We found no significant short-term relationship between changes in industrial production and employment. But over a longer timeframe, there was a clear inverse relationship between the changes in industrial production and changes in employment. Over time, improvements in industrial production lead to higher, not lower, employment. We believe that one of the missing ingredients for a healthier employment environment is a more dramatic improvement in production competitiveness. This brings us to the third, intersecting trend.
Trend #3: Energy RevolutionGeographic labor arbitrage drove manufacturing jobs overseas for the past 30 years. But in the coming decade, labor cost differentials will not be the primary driver of manufacturing investment. It will be the cost of energy. And thanks to another technological revolution, the U.S. finds itself in the enviable position of having the lowest cost energy in the world.
In the Box on page 7, we describe the difficulty of seeing “beyond the 32nd square.” One of the prime examples of this myopia is the energy production revolution that has unfolded in the U.S. Less than a decade ago, pundits were universally predicting the inexorable decline of natural gas production. But these predictions were upended by a technologically driven revolution in energy exploration and production.
Historically, oil and natural gas was produced by drilling vertically into what are known as “traps,” areas that literally trapped the hydrocarbons seeping up from source rock. The problem is that exploration efforts exhausted the supply of these “traps” in the U.S. by the 1970’s.
As a result, U.S. hydrocarbon production declined rapidly in the latter part of the last century. But in the middle part of the last decade, North American energy and power companies began drilling horizontally into the source rock, and through the “fracking” process unlocked the areas that produced the hydrocarbons.
We believe that in the next decade the key input into the technology driven manufacturing revolution will be energy.
Chart 8: Industrial Production and Employment: An Inverse Relationship 20
15
10
5
0
-5
-10
-15-4 -2 0 2 4 6
Difference in Unemployment Rate Two Years After %Source: Pioneer Investments, Bloomberg. Data as of May 31, 2014. Analysis on 60 years of annual data from 1954 to 2014.
Improvements in industrial production may result in lower unemployment, but with a delay.
Gain
/Los
s in I
ndus
trial
Pr
oduc
tion %

BLUE PAPER │ Innovation Trends Retooling the U.S. Economy October 2014
12
The results have been nothing short of miraculous (Chart 9).
Because of the resurgent natural gas supply and the subsequent drop in price (Chart 10) the share of electricity in the U.S. generated by gas has increased from 18% in 2004 to 26% in 20142 and the average price of electricity has declined. In the rest of the world it has increased.
Trend #3 Implication - The “Re-industrialization” of the U.S.Announcements of “re-shoring” by U.S. companies and the launching of new U.S. manufacturing sites by foreign companies are rapidly building. As of May 2014, over 50%3 of large American companies with manufacturing sites in China are considering moving capacity back to the U.S.
Over the last decade, the change in competitiveness has been dramatic. The most dramatic comparison change is with China whose manufacturing cost advantage over the U.S. has declined (Chart 11). The U.S. is now the second-cheapest manufacturing location (based on costs for wages, productivity growth, energy costs and currency exchange rates) in the world.
2Source Energy Information Authority, data as of May 31, 20143 Source: Boston Consulting Group. Press Release as of September 24, 2013. Majority of Large Manufacturers Are Now Planning or Considering ‘Reshoring’ from China to the U.S.
The energy revolution could bring a competitive advantage for the U.S.
Chart 9: US Crude Oil Production12
10
8
6
4
2
01930 1940 1950 1960 1970 1980 1990 2000 2014
Source: Pioneer Investments, Energy Information Authority. Data as of May 31, 2014.
Mill
ion B
arre
ls pe
r Day
Chart 10: Natural Gas Prices - The U.S. Advantage
20
15
10
5
01959 1964 1969 1974 1979 1984 1989 1994 1999 2004 2009 2014
US Europe JapanSource: World Bank. Data as of August 31, 2014.
Gas P
rice $
/mm
btu

BLUE PAPER │ Innovation Trends Retooling the U.S. Economy October 2014
13
Gas P
rice $
/mm
btu
Chart 11: Manufacturing Competitiveness - Cost Difference vs U.S. in %
-20 -10 0 10 20 30
2004 2014Source: Pioneer Investments, Boston Consulting Group (BCG). Data as of May 1, 2014. Analysis based on the Manufacturing Cost Index from BCG. The index covers costs for wages, productivity growth, energy costs and currency exchange rates. No difference are assumed in other costs (for example, raw material inputs, machine and tool depreciation. The cost structure is calculated as a weighted average across all industries.
CinaU.S,KoreaUKJapanGermanyItalyBelgiumFrance
The U.S. energy advantage combined with the growth in productivity has contributed to increase U.S. competitiveness.
-14-4
00
-1 27
97 11
17
17
2121
2323
1524
Boston Consulting Group projects that “As a result of its increasing competitiveness in manufacturing, the U.S. will capture $70 billion to $115 billion in annual exports from other nations by the end of the decade. By 2020, higher U.S. exports, combined with production work that will likely be reshored from China, could create 2.5 million to 5 million American factory and service jobs.”4
In the coming decade, as the U. S. becomes increasingly energy self-sufficient, the opportunity to re-energize manufacturing by tilting education towards engineering, mathematics and biology will be critical to fully exploiting the growth opportunities.
We believe that all these changes will have major impacts on the economy. Research will be key to understanding their implications for the financial markets. In the next chapter, we will explore how Fed policy along with bond market valuations might be affected by these trends.
4Source: Boston Consulting Group, “The U.S. as One of the Developed World’s Lowest-Cost Manufacturers, August 30, 2013.
We believe that all these changes will have major impacts on the economy. Research will be key to understanding their implications for the financial markets.

BLUE PAPER │ Innovation Trends Retooling the U.S. Economy October 2014
14
Research in an Era of InnovationIn the previous sections we highlighted three trends that are driving changes in the U.S. economy, affecting employment, productivity and profitability dynamics. These trends are just the tip of the iceberg. Over the coming decade, radical changes in healthcare, education, communication, transporation and alternative energy – to name just a few - will transform the economy and the investment landscape. We believe that new modes of research and analysis will be necessary in order to enable interpretation of the impact of these changes on both the macro and micro levels of the economy.
Implications for the Broader EconomyPotential for Automation/Robotics Reflected in the MarketThe stock market has recognized the tremendous potential of those companies involved in providing robotic/automation solutions. A Robotic ETF (ROBO), as well as an Index (ROBTR) was created to track the performance of robotic centric companies. The Robo-Stox index comprises 77 companies with a market capitalization of at least $200M, geographically spread out between North America, Europe and Asia. Below, is a graph of the comparison of this index with the S&P 500 benchmark (Chart 12).
To properly assesss changes and opportunities arising from the trends in innovation, we believe that new modes of research and analysis will be required.
Price
Bas
e 100
at
Janu
ary 2
004
Chart 12: Robot Indices outperforming S&P 500 700600500400300200100 0
2004 2006 2008 2010 2012 2014
ROBOTR Index ROBO Index S&P 500 Total ReturnSource: Pioneer Investments, Bloomberg. Data as of August 31, 2014.
The stock market has recognized the tremendous potential of those companies involved in providing robotic/automation solutions.
Insights→ The new era of innovation is driving diverging dynamics in the economy and labor market. In
this environment, old measures used to assess the economy may no longer apply and more in depth research is required at both the macro and micro levels.
→ The employment environment is now the major Fed focus, while inflation seems of less concern. We believe the Fed is misinterpreting the employment difficulties as a cyclical phenomenon, resulting in the Fed holding rates at zero for longer than is economically necessary.
→ With Treasury yields persisting at very low levels, investors have been searching for opportunities in credit markets for additional yield. Our analysis of the health of the credit markets indicates that cashflow coverage of debt is strong. However, we are witnessing a deterioration of underwriting standards.
→ We believe that an in-depth analysis of each issuer’s ability to take advantage of the current economic trends – or the degree to which they will be hurt by them -- is critical to determining the likely winners and losers in this rapidly evolving economy.
BLUE PAPER │ Innovation Trends Retooling the U.S. Economy October 2014
15
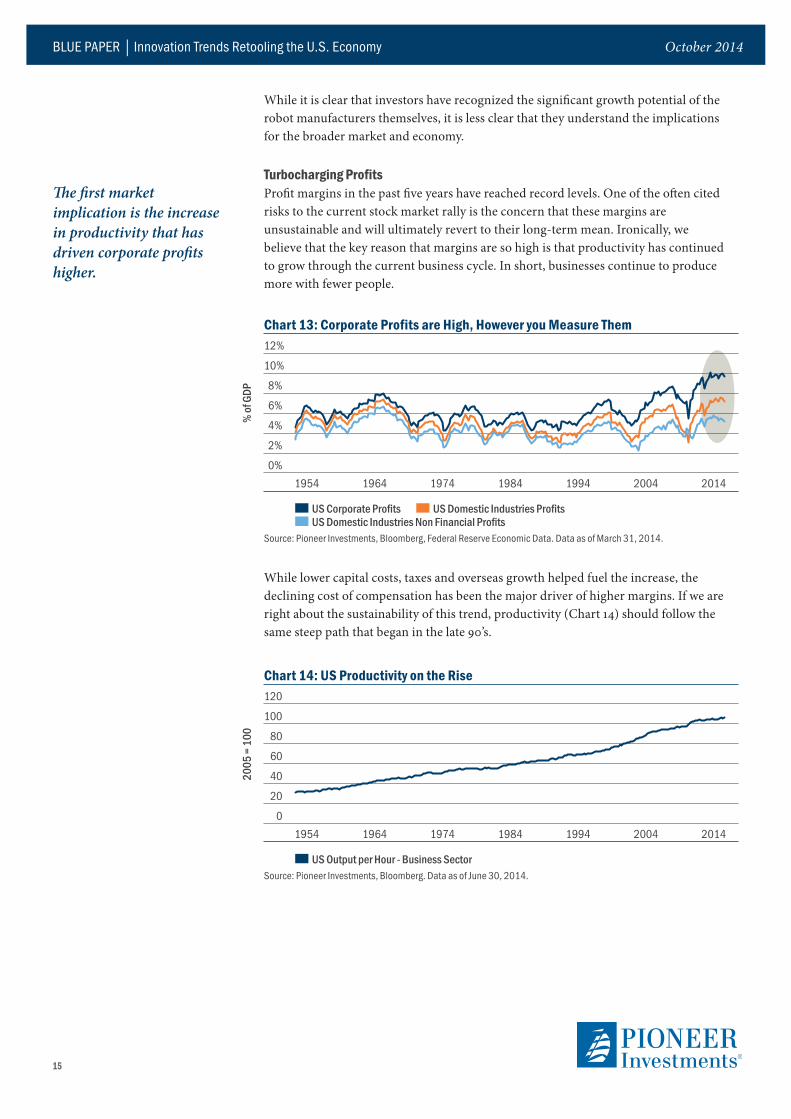
While lower capital costs, taxes and overseas growth helped fuel the increase, the declining cost of compensation has been the major driver of higher margins. If we are right about the sustainability of this trend, productivity (Chart 14) should follow the same steep path that began in the late 90’s.
Chart 13: Corporate Profits are High, However you Measure Them12%
10%
8%
6%
4%
2%
0%1954 1964 1974 1984 1994 2004 2014
US Corporate Profits US Domestic Industries Profits US Domestic Industries Non Financial Profits
Source: Pioneer Investments, Bloomberg, Federal Reserve Economic Data. Data as of March 31, 2014.
% of
GDP
Chart 14: US Productivity on the Rise120
100
80
60
40
20
01954 1964 1974 1984 1994 2004 2014
US Output per Hour - Business SectorSource: Pioneer Investments, Bloomberg. Data as of June 30, 2014.
2005
= 1
00
While it is clear that investors have recognized the significant growth potential of the robot manufacturers themselves, it is less clear that they understand the implications for the broader market and economy.
Turbocharging ProfitsProfit margins in the past five years have reached record levels. One of the often cited risks to the current stock market rally is the concern that these margins are unsustainable and will ultimately revert to their long-term mean. Ironically, we believe that the key reason that margins are so high is that productivity has continued to grow through the current business cycle. In short, businesses continue to produce more with fewer people.
The first market implication is the increase in productivity that has driven corporate profits higher.

BLUE PAPER │ Innovation Trends Retooling the U.S. Economy October 2014
16
Towards a New Wave of Capital InvestmentIf corporations are capable of generating sustainably higher profits and cash flows, the next great wave of investment in robotics and knowledge work automation could be easily funded. According to McKinsey, the investment could amount to over $1 Trillion in the next decade5. After years of subpar capital spending – which has helped fuel concerns about economic “stagnation” -- we believe corporations are poised to embark on a new wave of capital investment. Recent economic data, leading indicators of capital investment, and CFO capex intentions surveys, suggest this is happening now (Chart 15).
Implications for U.S. Monetary PolicyWith capital spending reviving, corporate profits now surpassing the prior cycle’s peak and many other indicators suggesting the economy is moving sustainably beyond the ravages of the GFC, why is Fed policy still anchored at zero? Why does there seem to be a disconnect between Fed policy and the health of the economy?
Fed policy is in the process of transitioning from a zero interest rate regime towards a normalized interest rate paradigm. While inflation has historically been the Fed’s primary focus, unemployment appears to be the Fed Chair’s primary concern now. In recent speeches and in the Fed minutes, Janet Yellen noted that, despite progress in the unemployment rate, other measures such as long-term unemployment and a lack of wage growth point to significant slack (Chart 16).
5Source: McKinsey Global Institute. Disruptive technologies: advances that will transform life, business and the global economy, May 2013.
If corporations are capable of generating sustainably higher profits and cash flows, the next great wave of investment in robotics and knowledge work automation could be easily funded.
The Fed is in the process of transitioning from a zero interest rate policy towards a normalized interest rate regime. The employment environment is now the major Fed focus.
% C
hang
e Yea
r ove
r Yea
r
Chart 15: A New Wave of Capital Investment Might be Starting 30
20
10
0
-10
-20
-302000 2002 2004 2006 2008 2010 2012 2014
ISM Manufacturing PMI (rs) US Real Investment Industrial Equipment - 3 quarters ahead (ls)
Source: Pioneer Investments, Bloomberg. Data as of June 30, 2014.
PMI L
evel
6560555045403530

BLUE PAPER │ Innovation Trends Retooling the U.S. Economy October 2014
17
%
Chart 16: FED Unemployment Measures
20
15
10
5
01994 1999 2004 2009 2014
Long Term Unemployment (>27 Weeks) as % of Total (r. scale) U6 Unemployment and Part Time Workers U3 Unemployment Rate Official
Source: Pioneer Investments, Bloomberg. Data as of July 31, 2014.
%
50
40
30
20
10
0
The Fed is worried that the long period of sub-par employment growth risks creating high structural unemployment. This could create conditions ripe for deflation. Given that labor costs have historically been the primary driver of inflation in the U.S., this seems intuitively correct. But is it?
We have argued that near-term employment will continue to be challenged by the accelerating substitution of labor with technology. We believe that keeping the cost of capital low does not necessarily improve employment prospects, despite higher profit margins and cash flows that are partially the result of lower capital costs. In fact, it may do exactly the opposite.
A lower cost of capital underpins the trend of technological outsourcing since it makes it even cheaper to substitute labor with capital. Thus, the Fed may be complicit in encouraging the current employment difficulties.
Ironically, a misunderstanding of the causes of this protracted unemployment cycle may result in the Fed holding rates at zero for longer than is economically necessary. The possible consequences of maintaining a “too low” interest rate policy for too long are well known. These include financial bubbles, misallocation of capital and the proliferation of “leverage” that inevitably spawns the next crisis. At this stage of the recovery, asset valuations in the U.S. do not appear to be overly stretched, but concerns about bubble-like conditions in the corporate credit market have recently surfaced.
Implications for the Credit MarketsWith Treasury yields persisting at very low levels, investors have been searching for opportunities in credit markets for additional yield. Spreads are now near their historical tights (Chart 17).
A misunderstanding of the causes of this protracted unemployment cycle may result in the Fed holding rates at zero for longer than is economically necessary.
At this stage of the recovery, asset valuations in the U.S. do not appear to be overly stretched, but concerns about bubble-like conditions in the corporate credit market have recently surfaced.

BLUE PAPER │ Innovation Trends Retooling the U.S. Economy October 2014
18
The Fed’s unconventional monetary policy response has effectively allowed the credit market to “front run” the interest rate cycle. However, we are not in the camp that believes we will witness a major re-rating of the credit markets any time soon. Our analysis of the health of the credit markets indicates that cashflow coverage of debt is strong, in part due to the aforementioned high margins enjoyed by companies in this cycle, as well as the cost of that debt capital.
However, we are witnessing a deterioration of underwriting standards as more debt is issued without covenants (Chart 18) and the average leverage (debt/EBITDA) of new issuance creaps higher.
The demand for yield and income from investors is, in large part, responsible for this deterioration. If the Fed continues to suppress interest rates due to concerns about structural unemployment, further spread compression and a return to the ultra-loose underwriting standards of the pre-GFC era are highly likely.
Our analysis of the health of the credit markets indicates that cashflow coverage of debt is strong.
However, we are witnessing a deterioration of underwriting standards as more debt is issued without covenants.
Chart 17: Spreads on U.S. High Yield and Investment Grade Coprorate Bonds
2000
1500
1000
500
01998 2000 2002 2004 2006 2008 2010 2012 2014
ML US High Yield ML US Corporate MasterSource: Pioneer Investments,Merrill Lynch, Bloomberg. Data as of August 30, 2014.
With Treasury yields at very low levels, investors have been searching for opportunities in credit markets, where spreads now are near their historical tights.
Spre
ad in
Bas
is Po
ints
Chart 18: U.S. High-Yield Bond and Leveraged Loan Issuance with Lower Standards 16141210 8 6 4 2 0 2001 2003 2005 2007 2009 2011 2014
Covenant-Lite Loans (Right Scale) Second-Lien Loans (Left Scale) Zero Coupon/Payment-in-Kind/Toggle Bonds (Left Scale)
Source: IMF Financial Stability Forum, April 2014.
60
50
40
30
20
10
0
12-M
onth
Issu
ance
as %
of
Mar
ket S
ize
12-M
onth
Issu
ance
as %
of
Mar
ket S
ize
BLUE PAPER │ Innovation Trends Retooling the U.S. Economy October 2014
19
However, despite our overall concerns about the potential for a continued lowering of underwriting standards, many corporate issuers will benefit from the acceleration of productivity-enhancing innovation. As we examine the sub-sectors of the U.S. credit market, we continue to be impressed with the ability of industrial sector companies to extract costs from their business. We are also beginning to see service-sector business productivity surge after decades of productivity stagnation. Interestingly, one of the sectors that is benefitting the most from the acceleration of automation is energy. Companies involved in horizontal drilling have driven down the per/well cost over the last decade by 60%, in part by automating much of the activity.
Of course, we also have to be on the outlook for “buggy-whip” sectors in this era of accelerating automation. Brick-and-Mortar retailers appear to be in the cross-hairs as more consumer traffic moves to the internet and Amazon pushes automation to an extreme. Interestingly, a recent announcement by Google highlighting their intentions to get into the “delivery by drone” space suggests that this trend will accelerate. As with the internet boom, the ability to extract value from these trends will depend on each company’s ability to adapt to the accelerating trends and require us to separate out the wheat (those companies with valuable business cases) from the chaff (those doomed to be left behind).
Therefore, we believe that an in-depth analysis of each issuer’s ability to take advantage of the current economic trends – or the degree to which they will be hurt by them – will be critical in determining the likely winners and losers in this rapidly evolving economy.
We believe that an in-depth analysis of each issuer’s ability to take advantage of the current economic trends – or the degree to which they will be hurt by them -- will be critical in determining the winners and losers in this rapidly evolving economy.
Selection in the Era of InnovationIn this era of accelerating innovation, we believe that a fundamentally different analytical perspective on long-term factors shaping the economic landscape is required. This framework, together with our more traditional sector/business financial analysis, will potentially enable us to identify unique return opportunities and uncover hidden risks in each market.
Key factors we believe are worth watching for:
→ New technologies’ impacts on sector trends → New business emergence→ Rapidly evolving disruptive competitors → Business model flexibility; the ability to leverage a platform, respond to competitive threats,
reshape product and service offerings→ Demonstrable innovation track record (ability to enter new markets/launch new products) → The ability to attract/retain innovation talent, shed costs, rapidly increase productivity

BLUE PAPER │ Innovation Trends Retooling the U.S. Economy October 2014
20
Conclusion The U.S. economy is in transition, moving rapidy towards a knowledge-based economy that will rely, increasingly less, on human labor to manufacture goods and provide many services. We believe the trends highlighted in this paper will rapidy reshape the economic landscape. With any dramatic change comes uncertainty and some fear. Many pundits have highlighted the possible downside of these changes (See Box in the next page). While we are sympathetic to these concerns, we believe that accelerating innovation will ultimately create more jobs than it destroys, produce dramatic wealth and have far-reaching positive consequences to areas of the economy that have historically been less productive (education and healthcare are good examples).
Every economic transition generates dislocations. Society ultimately adapts but the transition will be difficult to navigate for those unable to keep up. This has significant ramifications for the investment landscape. Investors that use traditional frameworks to analyze the market, picking winners and loosers based on outdated valuation relationships or assessing macro-economic policy based on irrelevant historical paradigms, run the risk of focusing on the wrong things.
For this reason, at Pioneer Investments, we are looking far ahead and are committed to developing new macro and micro economic research tools to help our investment approach adapt to the rapidly evolving economic and market environment.

BLUE PAPER │ Innovation Trends Retooling the U.S. Economy October 2014
21
Food for Thought on the Long RunSocietal Implications: The dilemma of the structurally unemployed.While the acceleration towards automation will tilt the competitive playing field in the direction of the U.S over the coming decade, the transition to an economy favoring advanced knowledge work will be tumultuous. A host of hurdles will most certainly challenge this transition. These include:→ The yawning chasm between the “haves” and “have nots” as providers of capital
and specialized knowledge workers command the lion’s share of the economic benefits of this transition. This will create significant tensions to “redistribute” wealth through higher taxes. The problem is that tax policy will have difficulty coping with increasingly “borderless” capital and diminished business allegiance to nationality.
→ A growing legion of disposed workers and an inefficient education system designed for an era of manufacturing plants and assembly line rote learning. We believe we are seeing the early signs of a revolution in education. Massively Open Online Courses (other wise known as MOOC’s) and web services like Kahn Academy are attempting to increase the availability of higher education and specialized skills, but a broader revolution in learning will need to take place if we are to avoid an era of human obsolescence.
Adapting an economic model to a future of abundance. The early signs of the “digitization” of our economy are appearing everywhere. As a result of massive communication interconnectedness we are witnessing an explosion of “free” services. Much of what we do on the web is free, created by new business models that focus on crowdsourcing -- essentially donated labor. The success of Wikipedia and the recent hit GPS app “Waze” are becoming common. As automation and robotics drive down labor costs and 3D/molecular manufacturing slashes material inputs, the cost of goods will also plummet. Eventually energy will also follow this “Moorian” path as new materials vastly improve energy capture from the sun, wind and tides. How will capitalism, which is focused on allocating scarce resources, adapt to this dis-inflationary tsunami? While this is still some ways off in the future, the transition will be a battle between entrenched interests and new business models.
The most articulate Cassandra of the technological outsourcing phenomenon, Martin Ford, in “Light’s in the Tunnel,” describes how corporations will, after eliminating the majority of jobs in which humans are employed, find themselves without customers. While we take issue with Ford’s dire predictions about the possible self-destruction of the capitalist system, he does raise several issues which we believe will need to be addressed, including the possibility of developing new incentive systems that capitalism does not currently factor into its equations.

BLUE PAPER │ Innovation Trends Retooling the U.S. Economy October 2014
22
Important Information Unless otherwise stated, all information contained in this document is from Pioneer Investments and is as of August 31, 2014. Unless otherwise stated, all views expressed are those of Pioneer Investments. These views are subject to change at any time based on market and other conditions and there can be no assurances that countries, markets or sectors will perform as expected. Investments involve certain risks, including political and currency risks. Investment return and principal value may go down as well as up and could result in the loss of all capital invested. This material does not constitute an offer to buy or a solicitation to sell any units of any investment fund or any services.
It is not possible to invest directly in an index.
Pioneer Investments is a trading name of the Pioneer Global Asset Management S.p.A. group of companies.
Date of First Use: October 6, 2014.


![Financial and Macroeconomic Connectedness [Dr.soc]](https://img.dokumen.tips/doc/110x75/577c7c781a28abe0549ab7a8/financial-and-macroeconomic-connectedness-drsoc.jpg)
