Embed Size (px)
Citation preview

7/21/2019 Bloomfield Refinery Final Report April 15
http://slidepdf.com/reader/full/bloomfield-refinery-final-report-april-15 1/16
DE-FG-03GO131281
“Waste-Heat Powered Ammonia Absorption Refrigeration Unit for LPG Recovery”FINAL REPORT
DOE Contract DE-FG36-03GO13128
April 15, 2008
Contractor: Western Refining Co.Formerly Giant Industries Inc.
Bloomfield, New Mexico Refinery
Project Director: Chad King
Prepared by: Donald C. Erickson, Energy Concepts Co., Annapolis, MDEric Lauber, Western Refining Co.
Submitted: April 15, 2008Project Period: 9/30/2003 – 3/15/2008

7/21/2019 Bloomfield Refinery Final Report April 15
http://slidepdf.com/reader/full/bloomfield-refinery-final-report-april-15 2/16
DE-FG-03GO131282
EXECUTIVE SUMMARY ........................................................................................................................................ 3 GOALS AND PROJECT OVERVIEW.................................................................................................................... 3 Goals ............................................................................................................................................................................ 3 Technology .................................................................................................................................................................. 3 Previous Demonstration ............................................................................................................................................. 4
Objectives of the Emerging Technology Deployment.............................................................................................. 5 Actual Accomplishments Compared to Objectives.................................................................................................. 5 PROJECT ACTIVITY SUMMARY......................................................................................................................... 6 Project Chronology..................................................................................................................................................... 6 Technical Approach.................................................................................................................................................... 7 Project Results ............................................................................................................................................................ 7 Economic Performance .............................................................................................................................................. 8 Problems Encountered and Lessons Learned .......................................................................................................... 8 Figure 1 – PFD of Western Refining Co. ARU .......................................................................................................... 11 Figure 2 – Western Refining Co. ARU LPG Recovery November 2007 ................................................................... 12 Table 1 – Western Refining Co. ARU Procidia Data 110807b – 8 PM...................................................................... 13 Table 2 - Western Refining Co. ARU Data Record.................................................................................................... 14 Table 3 - Western Refining Co. ARU Analysis Summary ......................................................................................... 16

7/21/2019 Bloomfield Refinery Final Report April 15
http://slidepdf.com/reader/full/bloomfield-refinery-final-report-april-15 3/16
DE-FG-03GO131283
EXECUTIVE SUMMARY
An emerging DOE-sponsored technology has been deployed. The technology recovers light
ends from a catalytic reformer plant using waste heat powered ammonia absorption refrigeration.It is deployed at the 27,000 bpd Bloomfield, New Mexico refinery of Western RefiningCompany.
The technology recovers approximately 50,000 barrels per year of liquefied petroleum gas thatwas formerly being flared. The elimination of the flare also reduces CO2 emissions by 17,000tons per year, plus tons per year reductions in NOx, CO, and VOCs.
The waste heat is supplied directly to the absorption unit from the Unifiner effluent. The addedcooling of that stream relieves a bottleneck formerly present due to restricted availability ofcooling water. The 350F Unifiner effluent is cooled to 260F. The catalytic reformer vent gas is
directly chilled to minus 25F, and the FCC column overhead reflux is chilled by 25F glycol.
Notwithstanding a substantial cost overrun and schedule slippage, this project can now beconsidered a success: it is both profitable and highly beneficial to the environment. Thecapabilities of directly-integrated waste-heat powered ammonia absorption refrigeration and their benefits to the refining industry have been demonstrated.
GOALS AND PROJECT OVERVIEW
Goals
One goal of this project was to deploy an emerging technology, namely to conduct a second fielddemonstration of a DOE-sponsored patented light ends recovery technology at an oil refinery.From the perspective of the host refinery, the goal is to recover light ends (LPG) sufficient toextinguish the flare, using waste heat to power the recovery system.
Technology
Many refinery processes produce “light ends” (propane and lighter molecules). Much of this gasis used for hydrotreating or as fuel gas, but the amount produced usually exceeds these needs.Compared to the alternative of flaring the excess light ends, it is very desirable both fromefficiency and economic perspectives to recover the excess. That is done by “light endsrecovery” technology, also referred to as LPG recovery. There are a variety of methods by whichlight ends can be recovered. They include: lean oil absorption; mechanical refrigeration;molecular sieve adsorption; and membranes. All of these traditional methods are both capital-intensive and energy-intensive. Almost all large oil refineries use lean oil absorption on the particular stream this project has targeted. However the lean oil absorption technology is toocostly at small scale, so most small refineries do not recover those particular light ends. Thisresults in many of them having routine flaring.

7/21/2019 Bloomfield Refinery Final Report April 15
http://slidepdf.com/reader/full/bloomfield-refinery-final-report-april-15 4/16
DE-FG-03GO131284
The light ends recovery technology being demonstrated uses refinery waste heat to producerefrigeration using an ammonia absorption refrigeration cycle. By directly integrating theabsorption refrigeration unit with the catalytic reformer plant, the capital cost is kept low. Use ofwaste heat to produce the refrigeration keeps the operating cost low.
The ammonia refrigeration directly chills the net gas and/or treat gas from the catalytic reformer plant sufficiently to condense out the bulk of the C3 (propane) and heavier fractions from thatgas. Whereas those fractions only constitute about 8% of that gas by volume, they are more than40% by weight, and also by heat content. When those light ends are not removed, the refinery istypically in an excess fuel gas condition, wherein the excess fuel gas is flared. When they arerecovered, the flare is reduced or eliminated. Thus the recovered light ends are obtained withoutany increase in feedstock to the refinery – they are in effect recovered from the flare. When thelight ends recovery is pushed to the point that the refinery is in a fuel gas deficit situation, it isnecessary to import natural gas to make up the deficit. Even that is a beneficial outcome, sincethe market value of the light ends is appreciably higher than natural gas, and the conversion ofnatural gas to light ends is at essentially 100% efficiency.
The amount of waste heat available in the catalytic reformer plant greatly exceeds the amountnecessary for light ends recovery. Hence once the refrigeration plant is justified by theeconomics of light ends recovery, the marginal cost of adding capacity for other refrigerationneeds is low. Whereas refineries have traditionally made very little use of refrigeration (becauseof the high cost of producing it), it turns out that when it is nearly free, numerous beneficial usescan be found. This project included one such use: chilling the overhead reflux to the FCCseparator column, to increase its recovery.
Previous Demonstration
This waste heat powered light ends recovery technology was first demonstrated at the SuncorCommerce City refinery in Colorado. The plant was commissioned in 1997, when the refinerywas owned by Total, and operated for eight years, during which time the refinery ownershipchanged to Diamond Shamrock, then to Valero, and finally to Suncor. When the refineryrecently transitioned to a highly-deficit fuel gas condition, the recovery unit was shut down.More recently, a major turnaround has placed the refinery back in an excess fuel gas condition,and hence it is planned to re-commission the absorption refrigeration unit.
This first demonstration of the light ends recovery technology provided a proof of the conceptand of the technical feasibility. The original capital cost estimate showed a two-year payback onthe investment when oil cost was less than $20 per barrel. The installed cost ended up atsomething near twice the initial estimate. However, by that time oil price had increased to over$40 per barrel, so the two year payback was still realized. The US Department of Energy provided a 30% cost share for that demonstration plant.
Several lessons were learned pursuant to the previous demonstration. With regard to majorcomponents, initially two of them initially under-performed – the absorber and the desorber.Both of those units have very unusual and exacting requirements: temperature glide;concentration glide in both liquid and vapor phases; mass exchange between phases; and

7/21/2019 Bloomfield Refinery Final Report April 15
http://slidepdf.com/reader/full/bloomfield-refinery-final-report-april-15 5/16
DE-FG-03GO131285
countercurrent heat exchange. Having mass exchange between phases on both sides of thetransfer surface further complicates the desorber. The absorber is further complicated by havingto operate at below atmospheric pressure, such that low pressure drop is paramount.
The vendor used commercial software to design the shell and tube desorber. This demonstration
showed that the software is not up to this demanding task.
The absorber was designed by Energy Concepts. The first design, a welded plateconfiguration, had channeling problems, and had to be replaced. The second design, consistingof coiled tubing and a perforated plate distributor, provided close to design performance.Fortunately, the second refrigeration load designed into this plant (chilling the wet-gascompressor inlet vapor) turned out to be unnecessary. Hence that excess capacity was used tosupplement the light ends recovery refrigeration, thus overcoming the deficiencies of thedesorber and absorber and achieving design recovery.
Objectives of the Emerging Technology Deployment
The objective of this project was to deploy an emerging technology that had been developed withcost-share assistance from the U.S. Department of Energy. This deployment demonstrated thetechnology in a different refinery setting, recovering nearly 50,000 barrels per year of LPG whilelargely eliminating the flare. The technology converts low level waste heat into chilling, whichsupports the Petroleum Vision Roadmap goals of “innovative technology for recovery of lowlevel waste heat”. Hence this project further publicizes this promising energy efficiencytechnology to the refining industry. The U.S. Department of Energy provided a 30% cost share.As discussed later, cost escalation caused that share to decrease to about 14%. The designimprovements that were verified in this second demonstration project included a new cycle, newcomponents, operation with two separate refrigeration loads, and improved operability.
Actual Accomplishments Compared to Objectives
The new LP absorber (a shell and tube type) provides acceptable performance – the pressuredrop is very low (less than 1 psid), and the overall U value is about 80% of design.
The IP absorber (a shell and coil type) provides excellent performance – the pressure drop issomewhat higher (approximately 2 psid) but the overall U value is about four times higher thanthat of the LP absorber. Assuming that its performance doesn’t degrade too much as ittransitions to operation in vacuum, that design should be tried out as the LP absorber as well.
Several other new components, including the rectifier and the refrigerant heat exchanger, alsoshowed acceptable performance.
Although the system is achieving its design low refrigeration temperatures, it is currently undercold weather conditions, and at reduced loading. The system has not yet been tuned for optimumoperation, and that will likely be required in order for it to achieve design performance at peaksummer conditions.

7/21/2019 Bloomfield Refinery Final Report April 15
http://slidepdf.com/reader/full/bloomfield-refinery-final-report-april-15 6/16
DE-FG-03GO131286
From the controls and operability perspective, some improvement has been demonstrated relativeto the first plant, but further improvement is definitely warranted. This plant operates smoothlyonce it is settled out, but startup remains lengthy and more laborious than it should be. Thetechnology developer can implement and test revised startup procedures that would resolve thestartup difficulties. However there has not been such an opportunity on this plant as of yet.
The system was provided to the site as three skidded units. Photo 1 shows the absorption skidready for shipment. Photo 2 shows the installed configuration of the hydrocarbon skid (on theright) and the absorption skid. Photo 3 is another view of the installation taken at night, showingthe evaporative cooler skid.
PROJECT ACTIVITY SUMMARY
Project Chronology
This DOE sponsored cost-shared project commenced with a proposal to a DOE RFP in November 2002, and a contract award in September 2003. The original plan was to conduct thedeployment at the Giant refinery in Yorktown, Virginia. However, a few months into thedetailed design the Yorktown refinery decided to install a new hydrocracker unit. That unitwould consume all available light ends (which previously were flared). Also, at that locationnatural gas cost more than LPG. Hence the rationale for the light ends recovery unitdisappeared.
Within a few months, it was determined that the light ends recovery would benefit the Giantrefinery in Bloomfield, New Mexico because it also had a continuous flare. Hence in September2004 the DOE contract was modified to reflect the change in demonstration site, and a newdetailed design was initiated.
A few months later, in early 2005, the Bloomfield refinery started experiencing severe feedstockshortages, and was very uncertain about future crude availability. Accordingly work was haltedonce again. It wasn’t until December 2005 that the crude shortage was resolved and the projectreceived a formal go-ahead.
Detailed design and skid fabrication proceeded during the first seven months of 2006, plus some preliminary site preparation work. The installation of the three skids comprising the overallsystem was scheduled for one month starting in August, but ended up taking two and a halfmonths. Finally, in November 2006, the system was ready for instrument checks, charging,startup, and commissioning. That process, which should have taken at most about three weeks,
ended up taking about four months, for a variety of reasons, some of which are enumerated below.
The system operated at highly non-optimal conditions throughout the summer of 2007, providingonly about half of design LPG recovery. The technology developer was brought in for one weekin November 2007, and made a couple of critical adjustments that brought the unit up to design performance.

7/21/2019 Bloomfield Refinery Final Report April 15
http://slidepdf.com/reader/full/bloomfield-refinery-final-report-april-15 7/16
DE-FG-03GO131287
Technical Approach
This project uses an ammonia absorption refrigeration cycle, which is capable of both therequired low temperatures (-30°F) and of waste-heat powering. The input heat is 350°F liquideffluent from the Unifiner, which otherwise must be cooled with cooling water. The lowtemperature (-30°F) refrigeration is applied to the catalytic reformer plant net gas (also calledvent gas). The intermediate temperature refrigeration (+25°F) is applied to FCC plant overheadreflux, via a closed loop glycol system. Figure 1 is a simplified process flow diagram of thesystem.
Both the driving heat and the refrigeration heat must be rejected from the absorption cycle. Partof that heat is rejected in a evaporative condenser, where 150 psig ammonia vapor condenses toliquid. The remainder is rejected at the two absorbers (LP and IP), via an aqua cooling loop.The aqua coolant in turn is cooled in an evaporative cooler. Both the evaporative cooler and thecondenser are incorporated in a single wet surface air cooler, which has VFD fan speed controlto maintain constant condensing pressure.
Project Results
A computerized data acquisition and control system continuously records the readings from 19instruments. Beyond that, there are approximately 60 additional local instruments with manualreadouts. The automatic readout instruments are sufficient to assess the overall results of systemoperation (e.g. LPG recovery rate). A full analysis of system operation down to component levelrequires that all of the readings be recorded at steady state conditions. This is a very demandingrequirement. It takes the system approximately one hour to settle into full steady state (no moresmall changes in levels or concentrations). Then it takes approximately an hour to record all themanual readings. Thus if either refinery operations change or ambient temperature changesduring that two hour window, the steady state is invalidated, and must be started again. Oneresult of this is that only three steady states have been recorded thus far.
Table 1 is a printout of two hours of data (5-minute intervals) from the “Procidia” data recordingsystem, on November 8. Note there are 6 flow readings, 4 pressures, 8 temperatures, and onelevel (LPG separator).
Figure 2 is the graph of one of those readings (LPG flow) for the entire month of November.Figure 2 shows that the LPG recovery started the month at about 80 barrels per day, which is thevalue it had been at for most of the summer. The technology vendor arrived November 5 andmade some adjustments, which within 24 hours increased LPG recovery to the design value of150 barrels per day. Shortly thereafter, the refinery transitioned into winter-operating mode,
with substantially reduced feed rate. Hence the recovery declined to about 100 barrels per day,remaining there through the winter. The LPG temperature remained at about -20°F, showing thatthe system was meeting design.
Table 2 presents the three recorded steady states – both Procidia readings and manually recordedreadings. The technology provider recorded the first two steady states during the maintenancevisit from November and the third steady state was recorded by refinery personnel.

7/21/2019 Bloomfield Refinery Final Report April 15
http://slidepdf.com/reader/full/bloomfield-refinery-final-report-april-15 8/16
DE-FG-03GO131288
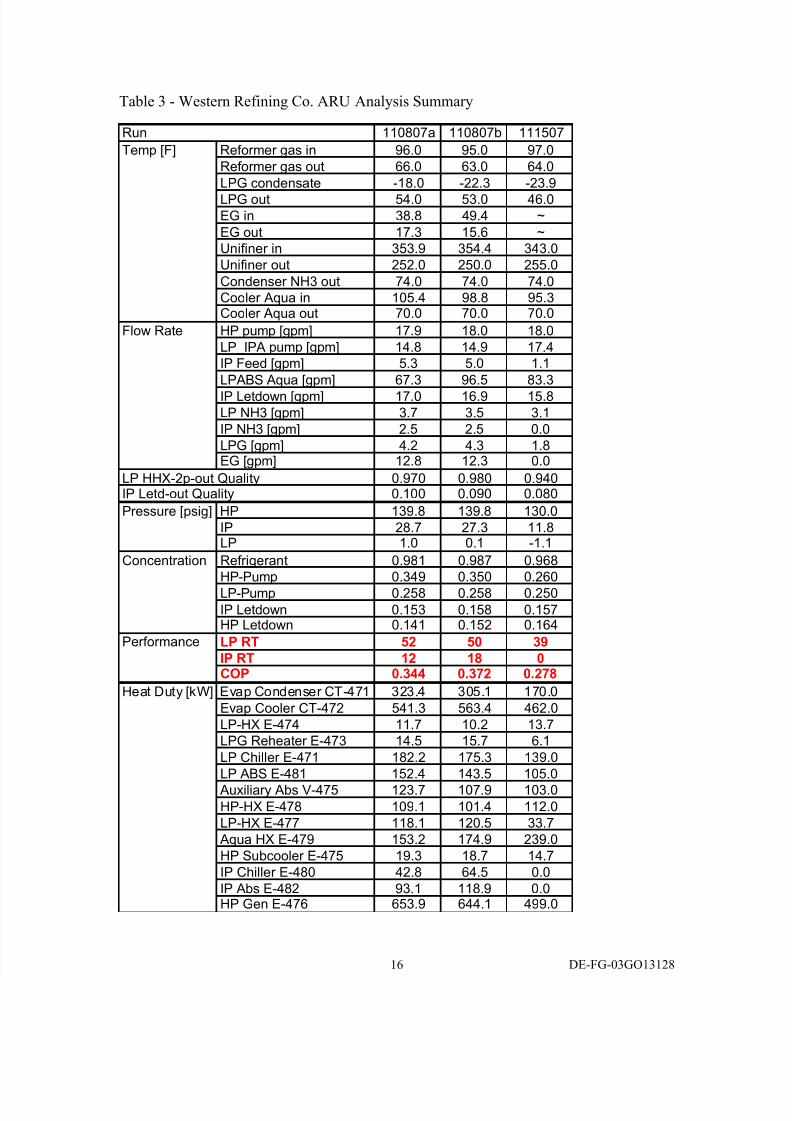
Table 3 presents the results of the system analysis for the above three steady state data sets. Theheat duty and performance of each major heat exchanger is determined. Overall cycle performance is also calculated (both tonnage and COP). The COP (Coefficient of Performance)of 0.37 is typical of double lift cycles, and right at the design value.
Noteworthy items:1. The 11/15 run did not have any intermediate temperature refrigeration load, due toconditions in the FCC plant.
2. The IP letdown outlet quality should be zero. The 10% or so quality was due to amalfunctioning shutdown solenoid valve (not receiving open signal), with manual bypassvalve set for zero level.
3. The LP pressure of 0.1 psig corresponds to an absolute pressure of 12 psia at theBloomfield altitude (5,200 ft). With an assumed 1.5 psid drop between the LP evaporatorand the LP receiver, this corresponds to and LP consistent temperature of -32°F. That isconsistent with the recorded LPG temperature of -22°F.
Economic Performance
Given the schedule slippage and cost escalation problems described below, the installed costescalated from the original estimate of about $1.9 million to a final actual cost of $3.4 million.As a result, the fixed DOE cost share decreased from 30% to 14% of the project total. On the benefits side, a rough order-of-magnitude calculation of the value of the LPG recovery is asfollows:
150 barrels per day for 8 months100 barrels per day for 3 months(one month of turnaround and other maintenance)Annual LPG recovery: 49,500 barrelsValue, at an assumed price of $80 per barrel: $3,960,000
This shows that there is strong financial incentive to keep this recovery unit operating at fullcapacity.
The question arises as to how much natural gas cost should offset the above savings, for thosetimes when flare reduction alone doesn't yield the full 150 bpd. That is difficult to calculate, butit raises one important issue: when the refinery is in a fuel gas excess situation, and henceflaring, there is little or no incentive to repair heat leaks, steam leaks, etc. However, once it goesinto a fuel gas deficit situation, where natural gas is being imported, there suddenly is a financialincentive to fix those leaks, and many are both easy and inexpensive to fix.
Problems Encountered and Lessons Learned
1. OperationThe brief full-capacity operation in the early part of November demonstrated that both designrefrigeration temperature (-25F) and design LPG recovery (150 barrels per day) areachievable with this plant.

7/21/2019 Bloomfield Refinery Final Report April 15
http://slidepdf.com/reader/full/bloomfield-refinery-final-report-april-15 9/16
DE-FG-03GO131289
That good level of performance still needs to be demonstrated at design summer conditions(warm ambient). Two points are noteworthy in that regard:
a. The catalytic reformer plant characteristically has more light ends in the net gas atwarm ambients, compared to cold. Hence it is likely that the LPG recovery willincrease in the summer, even if the –25F temperature isn’t fully achieved then.
b. In order to achieve optimal performance of the ARU (and hence that lowrefrigeration temperature), five flow splits must be optimized by adjusting manualthrottle valves. That is an iterative process requiring several hours at steady stateconditions plus intimate knowledge of the system. It is recommended that thetechnology developer do this in the late spring of this year.
2. ManagementEarly in 2006 it was decided to bring onboard an Engineering, Procurement and Construction(EPC) firm experienced in refinery projects. They were to be responsible for the design ofthe hydrocarbon skid, to ensure overall code compliance, and to supervise the equipmentinstallation at the site. The rationale was that their related experience would help ensureagainst schedule delays and cost overruns. Unfortunately, those objectives were not
achieved. In retrospect, it is believed that two factors contributed to that. First, this EPC didnot have any significant knowledge of ammonia absorption technology (very few if any do).This directly led to some avoidable problems. Secondly, and more importantly, themanagement structure evolved to the point where the technology provider was effectivelyremoved from participation in management decisions, particularly after installation began.Once again, this led to easily avoidable problems. This management structure could haveand should have worked, but only if there was close cooperation between the EPC, thetechnology developer, and the refinery management.
3. Pumps and AccessibilityThe absorption skid requires three pumps plus 100% installed spares (six pumps total). The pumps were originally on a subassembly confined within the skid. During installation, the pump subassembly was relocated outside the skid confines, to improve access. This addedcost and time to the installation process. Future skid designs will incorporate convenient pump access.
4. Relief Valve Issues
The ammonia solution containment is divided into four sections, each with its own safetyrelief valve. Late in the design process it was determined that the governing relief event inthree of those sections was rupture of a tube in the associated hydrocarbon heat exchanger.Hence those relief valves had to be upgraded to the size necessary for hydrocarbon reliefduty, including all associated features (rupture diaphragms, discharge pressure sensors, etc.).Also, the relief valve discharges had to be piped to the hydrocarbon flare. This was furthercomplicated by the need to avoid the possibility of standing liquid heads in the reliefdischarge piping.
5.Other Miscellaneous Issues

7/21/2019 Bloomfield Refinery Final Report April 15
http://slidepdf.com/reader/full/bloomfield-refinery-final-report-april-15 10/16
DE-FG-03GO1312810
The computerized control system was sending phantom and spurious shutdown signals to thesystem for the first several months of operation. Closer communication and cooperation between the control system developer and the technology developer can avoid recurrence ofthis problem.
Several pipe fitup problems on the absorption skid had to be repaired, requiring an extraweek of installation time. Shop procedures that allowed those problems have been corrected.
The drain fittings and thermocouple wells on the hydrocarbon heat exchangers wereoriginally threaded, and had to be changed to all-welded.

7/21/2019 Bloomfield Refinery Final Report April 15
http://slidepdf.com/reader/full/bloomfield-refinery-final-report-april-15 11/16

7/21/2019 Bloomfield Refinery Final Report April 15
http://slidepdf.com/reader/full/bloomfield-refinery-final-report-april-15 12/16
DE-FG-03GO1312812
0
500
1000
1500
2000
2500
3000
0 7 14 21 28
0
30
60
90
120
150
180
Cumulative Barrels LPG
Barrels Per Day LPG
Figure 2 – Western Refining Co. ARU LPG Recovery November 2007

7/21/2019 Bloomfield Refinery Final Report April 15
http://slidepdf.com/reader/full/bloomfield-refinery-final-report-april-15 13/16
DE-FG-03GO1312813
Table 1 – Western Refining Co. ARU Procidia Data 110807b – 8 PM
Date Time FT470 FT-471 FT474 FT475 FT476 FT477 LT475 PT474 PT475 PT486 PT507 TI471 TI475 TI476 TI482 TI483 TI484 TI489 TI508
8-Nov-07 7:00:01 PM 15.29 18.2 17.77 2.45 4.83 3.52 48.17 141.84 0.05 28.43 139.53 354.89 287.08 159.86 87.32 62.03 109.27 176.36 -21.78
8-Nov-07 7:05:01 PM 14.74 18.16 16.91 2.46 4.66 3.53 44.48 141.93 -0.1 27.3 139.56 354.57 287.64 160.31 87.15 61.92 109.42 175.62 -22.1
8-Nov-07 7:10:01 PM 15.57 18.03 16.67 2.45 4.69 3.53 41.18 141.53 -0.17 26.33 139.22 353.98 286.62 159.71 86.92 61.87 109.46 175.41 -22.52
8-Nov-07 7:15:01 PM 15.49 18.03 16.97 2.46 4.75 3.54 36.37 141.47 -0.33 27.05 139.19 353.53 285.8 159.69 86.74 61.78 109.25 179.69 -22.87
8-Nov-07 7:20:01 PM 15.59 17.99 17.22 2.47 4.28 3.54 31.4 142.14 -0.15 27.37 139.88 353.46 283.87 161.99 86.9 61.66 109.03 177.44 -22.83
8-Nov-07 7:25:01 PM 16.57 17.34 17.33 2.46 2.82 3.5 39.34 142.01 0.03 26.76 139.75 354.44 283.33 162.22 87.26 61.53 109.4 177.69 -22.35
8-Nov-07 7:30:01 PM 16.54 17.96 16.37 2.46 4.32 3.51 48.94 141.94 0.06 27.29 139.65 355.31 283.46 161.98 87.45 61.38 109.82 175.8 -22.15
8-Nov-07 7:35:01 PM 15.76 17.98 16.48 2.47 4.86 3.54 44.67 142.54 0.01 27.23 140.28 355.78 284.56 159.46 87.37 61.18 109.59 175.49 -22.31
8-Nov-07 7:40:01 PM 15.67 18.08 16.55 2.46 4.91 3.54 38.25 141.99 0 27.69 139.73 355.38 284.62 157.11 87.34 61.02 109.76 174.98 -22.47
8-Nov-07 7:45:01 PM 15.35 17.97 16.02 2.48 4.78 3.55 32.37 143.35 0.1 27.8 141.12 354.61 282.93 160.97 87.44 60.87 109.62 175.06 -22.27
8-Nov-07 7:50:01 PM 15.5 18 17.61 2.47 3.12 3.54 33.83 143.69 0.32 27.95 141.47 354 281.97 160.65 88.02 60.63 109.96 174.37 -21.82
8-Nov-07 7:55:01 PM 15.41 18.11 18.12 2.46 3.3 3.51 44.62 142.8 0.46 28.48 140.58 353.98 281.65 160.43 88.16 60.44 109.86 174.88 -21.43
8-Nov-07 8:00:01 PM 15.64 18.15 16.88 2.42 4.59 3.49 48.21 139.87 0.28 27.51 137.62 353.66 282.35 156.37 87.68 60.3 110 176.3 -21.57
8-Nov-07 8:05:01 PM 15.23 17.95 16.52 2.44 4.67 3.51 44.37 140.35 -0.07 26.88 138.09 354.28 282.68 153.6 86.48 60.07 109.25 171.86 -22.42
8-Nov-07 8:10:01 PM 15.84 17.86 17.15 2.47 4.61 3.53 41.04 142.19 -0.03 26.59 139.87 355.24 283.95 155.53 86.46 59.76 108.95 174.48 -22.68
8-Nov-07 8:15:01 PM 16.47 17.91 16.2 2.47 4.63 3.54 37.67 143.09 0.01 26.84 140.78 355.12 285.19 155.32 86.86 59.54 109.09 172.33 -22.66
8-Nov-07 8:20:01 PM 16.31 18.01 16.78 2.47 4.67 3.54 32.84 142.89 0.02 27.11 140.58 354.37 285.18 155.83 86.88 59.32 109.19 175.71 -22.79
8-Nov-07 8:25:01 PM 15.33 18.14 17.6 2.46 2.69 3.51 35.42 142.19 -0.08 27.05 139.86 353.31 284.98 154.97 86.71 59.03 109.06 173.64 -23.12
8-Nov-07 8:30:01 PM 15.75 18.03 16.97 2.46 4.18 3.51 47.99 142.2 -0.06 27.07 139.89 353.44 284.67 155.78 86.58 58.75 108.77 174.47 -23.13
8-Nov-07 8:35:01 PM 16.52 18.02 16.98 2.45 4.69 3.52 44.43 141.43 -0.13 26.74 139.08 354.15 285.25 154.57 86.55 58.49 108.72 177.52 -23.19
8-Nov-07 8:40:01 PM 16.51 17.94 17.08 2.46 4.7 3.52 41.02 141.45 -0.13 27.22 139.12 354.84 285.28 154.83 86.61 58.03 108.92 173.98 -23.18
8-Nov-07 8:45:01 PM 15.58 17.93 16.43 2.47 4.77 3.54 37.79 141.95 -0.04 26.5 139.7 354.69 284.62 155.68 86.95 57.53 108.95 172.88 -23.08
8-Nov-07 8:50:01 PM 15.67 18.02 16.89 2.48 4.82 3.55 33.82 143.01 0.06 28.11 140.76 354.06 282.4 160.48 87.34 57.11 109.2 173.39 -22.92
8-Nov-07 8:55:01 PM 15.22 18.14 18.56 2.46 3.31 3.53 32.46 142.46 0.14 29.24 140.26 353.63 280.87 159.67 87.44 56.8 109.31 175.05 -22.76
8-Nov-07 9:00:01 PM 15.4 18.08 17.29 2.47 3.7 3.51 46.56 142.5 0.31 28.72 140.3 353.66 279.6 158.3 87.35 56.61 109.11 175.95 -22.36
ave745:845 15.77 17.95 16.88 2.46 4.28 3.53 40.08 142.11 0.053 27.34 139.85 354.52 283.57 158.87 87.24 60.78 109.51 175.41 -22.29
ave700:900 15.72 18.00 17.01 2.46 4.29 3.53 40.29 142.11 0.022 27.41 139.83 354.34 284.02 158.21 87.12 59.91 109.32 175.21 -22.51
FT – Flow Transmitter; LT – Level Transmitter; PT – Pressure Transmitter; TI – Temperature Indicator

7/21/2019 Bloomfield Refinery Final Report April 15
http://slidepdf.com/reader/full/bloomfield-refinery-final-report-april-15 14/16
DE-FG-03GO1312814
Table 2 - Western Refining Co. ARU Data Record
Inst.
#
EES
St. pt.
110807a
530PM
110807b
8 PM
111507
2 PM
Manual Procidia Manual Procidia Manual Procidia
HP Rect P474 17 142.7 142.19 142.4 142.1 130.4 131.15
HP Rect Vap T476 17 170 169.46 161.7 158.87 183.3 182.78
Unifiner T471 80 353.9 353.89 355.6 354.52 340 342.97
HP Letd T475 48 287 288.63 284.4 283.57 274.4 275.38
IP Rect Vap T489 31 168+- 179.95 188 175.41 186 186.08
HP Pump T484 42 113.6 112.92 101.1 109.51 106 105.78
HP Pump F471 42 18.3 17.9 18.2 17.95 18 18
LP Pump T482 64 90.8 90.54 87.4 87.24 85.4 85.24
Spray Recv P475 64 0.95 0.969 0.08 0.053 -1.13 -1.08
IP Letd F474 57 20+- 16.98 19+- 16.88 16.12 15.82
IP Recv P486 42 32+- 28.68 30.6+- 27.34 12.03 11.84
IP Absorbent F470 30 10+- 16.1 10+- 15.77 11.6 14.8
Cond Recv P507 21 139.7 139.78 140 139.85 130 129.96LPE Ref in T483 3 64.1 63.91 61.2 60.78 60.5 60.69
LPE ref F477 22 3.74 3.74 3.54 3.53 3.13 3.12
HC-propane F476 90 4.3 4.15 4.87 4.28 1.8 1.8
IPE ref F475 25 2.43 2.46 2.46 2.46 0 0
HC Sep L475 40 41.2 40 40 40 40
LPE HC T508 85 -17.8 -18.02 -22.4 -22.29 -24.3 -23.94
Glycol Recv L478 2B*
Glycol F481 91 12.8 12.26 14.6
IPE Gly out T503 92 36(32) 35(25) 42
IPE Ref in T501 26 22(22) 20(18) -2
IPE Gly in T502 91 36(41) 30Gly out P491 91 64 62 67
Gly Recv P493 47 45 50
IP Recv L472 7.5B 9B 8B
Cond Recv L477 36B 28B 2B top
IP Rect letd out T498 51 188(186) 174+- 188
HP Column T499 44 90(90) 86(87) 85
IP Column T497 12 178(178) 180(179) 170
IP Column F472 11 1.11 1.0
IP Letd out HP HX T493 54 142(105) 138(138) 125
HP Pump T491 45 114 109(109) 106
Aqua Cooler out P 54 50 48IP Rect L474 0 0 1.5B
RHX Liq out T514 24 19 19 20
IP HX letd out T496 55 144 >150 120
LP Sep out T515 9 -2 -3 -18
* Bolts

7/21/2019 Bloomfield Refinery Final Report April 15
http://slidepdf.com/reader/full/bloomfield-refinery-final-report-april-15 15/16
DE-FG-03GO1312815
Table 2 - Western Refining Co. ARU Data Record (cont.)
Inst. # EES
St. pt.
110807a
530PM
110807b
8 PM
111507
2 PM
Manual Procidia Manual Procidia Manual Procidia
LP Abs P496 61
Aqua HX out T494 68 112(103) 104(94) 100RHX Vap out T-
RHXO10 (1)
Aqua Spray F480 63 43.9 45.66 49.5
IPAbs Aqua out T488 71 113(109) 109(109)
IP Abs in T486 32 109(122) 85
LPAbs aqua F478 66 34 48.2
IP Letd to LPAbs T495 57 100(102) 92(93) 89
Cond Recv T517 21 74(80) 74(79) 74
HP Pump out P483/4 206 205 72
HP filter out P487 45 206 201 62
LP Pump out P481/2 75 73LP filter out P480 30 65 60 98
Aqua Pump out P510/11 80 65
Aqua filter out P508 63 62 60
LPE HC in T506 84 35? 28
Liquid HC out T510 90 54(59) 51(53) 46
Unifiner to HPG T470 80 345 345 330
Unifiner HPG O T472 81 252 250 255
HP Gen in T473 46 185 175 170
LPE Ref in T511 4 5 6 -30
HC Sep L475 9” 8” 1ft
Unifiner HPG in P470 80 290? 295 280Reformer gas in T504 88 96 95 97
Reformer gas out T505 87 66 63 64
HP Gen out T474 47 298 294 285
HC to LPG Sep T507 85 -18 -23 -24
LPG Sep out T509 89 -8 -12 -16
HC Sep P494 85 295 295 280
HP Rect P472 17 144 145 125
LPA Abs aqua in T477 66 70 70 70
LPAbs aqua out T478 67 89 84 85
LP Abs out T480 62 98 92 95
IP Recv P485 42 31 30 110IP Abs aqua in T487 70 95 93 90
Spray Recv L471 12B 12B ½
IPAbs out T485 42 112 110 108
IPE Ref out T500 27 58? 30-40 100Cond Recv P506 21 132
IP Rect P490 31 31 18
7/21/2019 Bloomfield Refinery Final Report April 15
http://slidepdf.com/reader/full/bloomfield-refinery-final-report-april-15 16/16
DE-FG-03GO1312816
Table 3 - Western Refining Co. ARU Analysis Summary
Run 110807a 110807b 111507
Temp [F] Reformer gas in 96.0 95.0 97.0
Reformer gas out 66.0 63.0 64.0
LPG condensate -18.0 -22.3 -23.9
LPG out 54.0 53.0 46.0EG in 38.8 49.4 ~
EG out 17.3 15.6 ~
Unifiner in 353.9 354.4 343.0
Unifiner out 252.0 250.0 255.0
Condenser NH3 out 74.0 74.0 74.0
Cooler Aqua in 105.4 98.8 95.3Cooler Aqua out 70.0 70.0 70.0
Flow Rate HP pump [gpm] 17.9 18.0 18.0
LP_IPA pump [gpm] 14.8 14.9 17.4
IP Feed [gpm] 5.3 5.0 1.1
LPABS Aqua [gpm] 67.3 96.5 83.3
IP Letdown [gpm] 17.0 16.9 15.8LP NH3 [gpm] 3.7 3.5 3.1
IP NH3 [gpm] 2.5 2.5 0.0
LPG [gpm] 4.2 4.3 1.8EG [gpm] 12.8 12.3 0.0
LP HHX-2p-out Quality 0.970 0.980 0.940IP Letd-out Quality 0.100 0.090 0.080
Pressure [psig] HP 139.8 139.8 130.0
IP 28.7 27.3 11.8LP 1.0 0.1 -1.1
Concentration Refrigerant 0.981 0.987 0.968
HP-Pump 0.349 0.350 0.260
LP-Pump 0.258 0.258 0.250IP Letdown 0.153 0.158 0.157HP Letdown 0.141 0.152 0.164
Performance LP RT 52 50 39
IP RT 12 18 0
COP 0.344 0.372 0.278
Heat Duty [kW] Evap Condenser CT-471 323.4 305.1 170.0
Evap Cooler CT-472 541.3 563.4 462.0
LP-HX E-474 11.7 10.2 13.7
LPG Reheater E-473 14.5 15.7 6.1
LP Chiller E-471 182.2 175.3 139.0
LP ABS E-481 152.4 143.5 105.0
Auxiliary Abs V-475 123.7 107.9 103.0HP-HX E-478 109.1 101.4 112.0
LP-HX E-477 118.1 120.5 33.7
Aqua HX E-479 153.2 174.9 239.0
HP Subcooler E-475 19.3 18.7 14.7
IP Chiller E-480 42.8 64.5 0.0
IP Abs E-482 93.1 118.9 0.0HP Gen E-476 653.9 644.1 499.0