Embed Size (px)
Citation preview
September 22, 2021
FOR IMMEDIATE RELEASE
BlackBerry Reports Second Quarter Fiscal Year 2022 Results
Revenue exceeds expectations and Company adds deep cybersecurity industry experience to drive
growth
• Total company revenue of $175 million.
• IoT revenue of $40 million.
• Cyber Security revenue of $120 million.
• Licensing & Other revenue of $15 million.
• Positive operating cash flow of $12 million.
• Non-GAAP loss per basic and diluted share of $0.06; GAAP loss per basic and diluted share of
$0.25. A non-cash accounting adjustment to the fair value of the convertible debentures, as a
result of market and trading conditions, accounts for approximately $0.12 of GAAP loss per
share.
Waterloo, Ontario - BlackBerry Limited (NYSE: BB; TSX: BB) today reported financial results for the three
months ended August 31, 2021 (all figures in U.S. dollars and U.S. GAAP, except where otherwise indicated).
“Revenue for all businesses beat expectations this quarter. The Cyber Security business unit delivered robust
sequential billings and revenue growth and the IoT business unit performed well in the face of global chip shortage
pressures,” said John Chen, Executive Chairman & CEO, BlackBerry. “We are already seeing benefits from
establishing the two key business units and are delighted to appoint John Giamatteo as President of Cyber Security.
Giamatteo, who was previously President and Chief Revenue Officer at McAfee, adds leading industry expertise. In
IoT, design activity for our QNX products remains very strong, demonstrating both our industry leadership position
and secular trends, such as ECU consolidation. In Cyber Security we received strong third-party validation of the
effectiveness of our AI-driven, prevention-first suite of products, illustrating progress made with recent product
launches.”
Second Quarter Fiscal 2022 Financial Highlights
• Total company revenue for the second quarter of fiscal 2022 was $175 million.
• Total company non-GAAP gross margin was 65% and GAAP gross margin was 64%.
• IoT revenue for the second quarter of fiscal 2022 was $40 million, with gross margin of 83% and ARR of
$89 million.
• Cyber Security revenue for the second quarter of fiscal 2022 was $120 million, with gross margin of 59%
and ARR of $364 million.
• Licensing and Other revenue for the second quarter of fiscal 2022 was $15 million as negotiations for the
sale of a portion of the patent portfolio continue. Gross margin was 60%.
• Non-GAAP operating loss was $30 million. GAAP operating loss was $141 million, primarily due to a
non-cash accounting adjustment to the fair value of the convertible debentures, resulting from market and
trading conditions, of $67 million.
• Non-GAAP loss per share was $0.06 (basic and diluted). GAAP loss per share was $0.25 (basic and
diluted).
• Total cash, cash equivalents, short-term and long-term investments were $772 million.
• Net cash generated from operating activities was $12 million.
Business Highlights & Strategic Announcements
• BlackBerry has design wins with 24 of the world’s leading 25 Electric Vehicle (EV) automakers. This has
increased from 23 of the top 25 last quarter following an EV win with Daimler.
• BlackBerry IVY™ to deliver highly secure vehicle-based payments, leveraging direct access to vehicle
sensor data and edge processing to create a “digital fingerprint”. Delivered through a partnership with Car
IQ.
• Nobo Technologies selects BlackBerry QNX® Neutrino® as foundation for new Digital Cockpit Controller
for Great Wall Motors’ Haval G6S SUV. Great Wall Motors is China’s largest producer of SUV vehicles.
• sTraffic, Korea’s leading solution developer for transportation infrastructure systems, selects QNX® OS for
Safety as the foundation for their train traffic management system that includes unmanned train operations.
• BlackBerry launches BlackBerry® Jarvis 2.0® composition analysis tool. Delivered as a more user-
friendly SaaS offering, Jarvis 2.0 empowers OEMs to validate and ensure the quality of their multi-tiered
software bill of materials.
• BlackBerry awarded highest AAA rating by SE Labs in breach test of BlackBerry® Protect (EPP) and
BlackBerry® Optics (EDR). The breach test adopted a range of real-world hacker tactics and BlackBerry’s
AI-driven products delivered complete prevention and detection with zero false positives.
• BlackBerry® UEM integrates with Microsoft 365, delivering BlackBerry’s industry-leading security to
Microsoft’s productivity products.
• BlackBerry® AtHoc® critical event management platform used as foundation for autonomous flood risk
and clean water monitoring solution.
• BlackBerry updates SecuSUITE capabilities to protect group phone calls and messages for governments
and businesses from high risk eavesdropping.
Appointment of New Cyber Security Business Unit President
BlackBerry has appointed John Giamatteo as President of the Cyber Security business unit. With this strategic hire
the company adds significant industry experience. Giamatteo will join the company on October 4th and report to
Executive Chairman and CEO John Chen. He will be responsible for business unit strategy, engineering, and go-to-
market.
Giamatteo brings to BlackBerry over 30 years of experience with technology companies. Most recently he served as
President and Chief Revenue Officer of McAfee, where he was responsible for sales, marketing, and customer
success. During his time with McAfee, he delivered strong double-digit growth across its Enterprise, SMB and
Consumer businesses as well as significant margin expansion across the portfolio. Prior to that he served as Chief
Operating Officer at AVG Technologies, a leading provider of Internet and mobile security. Giamatteo also held
leadership positions with Solera Holdings, RealNetworks, Inc. and Nortel Network Corporation.
“I’m excited to be joining BlackBerry and to be leading the Cyber Security business unit. Never has the threat of
cyberattacks been higher, nor more in the minds of management,” said Giamatteo. “BlackBerry’s AI-driven,
prevention-first technology is well placed to scale to meet the constantly evolving cybersecurity needs of companies
everywhere. I’m very positive about the opportunities that we have as a company.”
Tom Eacobacci, BlackBerry’s President and COO, has decided to pursue other opportunities and will leave the
Company on October 29th. BlackBerry thanks Tom for his hard work and contributions in his time at the Company.
Outlook
BlackBerry will provide fiscal year 2022 outlook in connection with the quarterly earnings announcement on its
earnings conference call. The earnings call transcript will be made available on our website and on SEDAR.
Use of Non-GAAP Financial Measures
The tables at the end of this press release include a reconciliation of the non-GAAP financial measures used by the
company to comparable U.S. GAAP measures and an explanation of why the company uses them.
Conference Call and Webcast
A conference call and live webcast will be held today beginning at 5:30 p.m. ET, which can be accessed by dialing
+1 (877) 682-6267 or by logging on at BlackBerry.com/Investors.
A replay of the conference call will also be available at approximately 8:30 p.m. ET by dialing +1 (800) 585-8367
and entering Conference ID #6149337 and at the link above.
About BlackBerry
BlackBerry (NYSE: BB; TSX: BB) provides intelligent security software and services to enterprises and
governments around the world. The company secures more than 500M endpoints including more than 195M
vehicles. Based in Waterloo, Ontario, the company leverages AI and machine learning to deliver innovative
solutions in the areas of cybersecurity, safety and data privacy, and is a leader in the areas of endpoint security,
endpoint management, encryption, and embedded systems. BlackBerry’s vision is clear - to secure a connected
future you can trust.
BlackBerry. Intelligent Security. Everywhere.
For more information, visit BlackBerry.com and follow @BlackBerry.
Investor Contact:
BlackBerry Investor Relations
+1 (519) 888-7465
Media Contact:
BlackBerry Media Relations
+1 (519) 597-7273
###

This news release contains forward-looking statements within the meaning of certain securities laws, including under the U.S.
Private Securities Litigation Reform Act of 1995 and applicable Canadian securities laws, including statements regarding
BlackBerry’s plans, strategies and objectives including its expectations with respect to increasing and enhancing its product and
service offerings.
The words “expect”, “anticipate”, “estimate”, “may”, “will”, “should”, “could”, “intend”, “believe”, “target”, “plan” and
similar expressions are intended to identify these forward-looking statements. Forward-looking statements are based on
estimates and assumptions made by BlackBerry in light of its experience and its perception of historical trends, current
conditions and expected future developments, as well as other factors that BlackBerry believes are appropriate in the
circumstances, including but not limited to, BlackBerry’s expectations regarding its business, strategy, opportunities and
prospects, the launch of new products and services, general economic conditions, the ongoing COVID-19 pandemic,
competition, and BlackBerry’s expectations regarding its financial performance. Many factors could cause BlackBerry’s actual
results, performance or achievements to differ materially from those expressed or implied by the forward-looking statements,
including, without limitation, risks related to the following factors: BlackBerry’s ability to enhance, develop, introduce or
monetize products and services for the enterprise market in a timely manner with competitive pricing, features and
performance; BlackBerry’s ability to maintain or expand its customer base for its software and services offerings to grow
revenue or achieve sustained profitability; the intense competition faced by BlackBerry; the occurrence or perception of a
breach of BlackBerry’s network cybersecurity measures, or an inappropriate disclosure of confidential or personal information;
the failure or perceived failure of BlackBerry’s solutions to detect or prevent security vulnerabilities; the impact of the COVID-
19 pandemic; BlackBerry’s continuing ability to attract new personnel, retain existing key personnel and manage its staffing
effectively; BlackBerry’s dependence on its relationships with resellers and channel partners; litigation against BlackBerry;
network disruptions or other business interruptions; BlackBerry’s ability to foster an ecosystem of third-party application
developers; BlackBerry’s products and services being dependent upon interoperability with rapidly changing systems provided
by third parties; BlackBerry’s ability to obtain rights to use third-party software and its use of open source software; failure to
protect BlackBerry’s intellectual property and to earn expected revenues from intellectual property rights; BlackBerry being
found to have infringed on the intellectual property rights of others; the substantial asset risk faced by BlackBerry, including
the potential for charges related to its long-lived assets and goodwill; BlackBerry’s indebtedness; tax provision changes, the
adoption of new tax legislation or exposure to additional tax liabilities; the use and management of user data and personal
information; government regulations applicable to BlackBerry’s products and services, including products containing
encryption capabilities; the failure of BlackBerry’s suppliers, subcontractors, channel partners and representatives to use
acceptable ethical business practices or comply with applicable laws; regulations regarding health and safety, hazardous
materials usage and conflict minerals; acquisitions, divestitures and other business initiatives; foreign operations, including
fluctuations in foreign currencies; the fluctuation of BlackBerry’s quarterly revenue and operating results; the volatility of the
market price of BlackBerry’s common shares; adverse economic, geopolitical and environmental conditions.
These risk factors and others relating to BlackBerry are discussed in greater detail in BlackBerry’s Annual Report on Form
10-K and the “Cautionary Note Regarding Forward-Looking Statements” section of BlackBerry’s MD&A (copies of which
filings may be obtained at www.sedar.com or www.sec.gov). All of these factors should be considered carefully, and readers
should not place undue reliance on BlackBerry’s forward-looking statements. Any statements that are forward-looking
statements are intended to enable BlackBerry’s shareholders to view the anticipated performance and prospects of BlackBerry
from management’s perspective at the time such statements are made, and they are subject to the risks that are inherent in all
forward-looking statements, as described above, as well as difficulties in forecasting BlackBerry’s financial results and
performance for future periods, particularly over longer periods, given changes in technology and BlackBerry’s business
strategy, evolving industry standards, intense competition and short product life cycles that characterize the industries in which
BlackBerry operates. BlackBerry has no intention and undertakes no obligation to update or revise any forward-looking
statements, whether as a result of new information, future events or otherwise, except as required by applicable law.
###
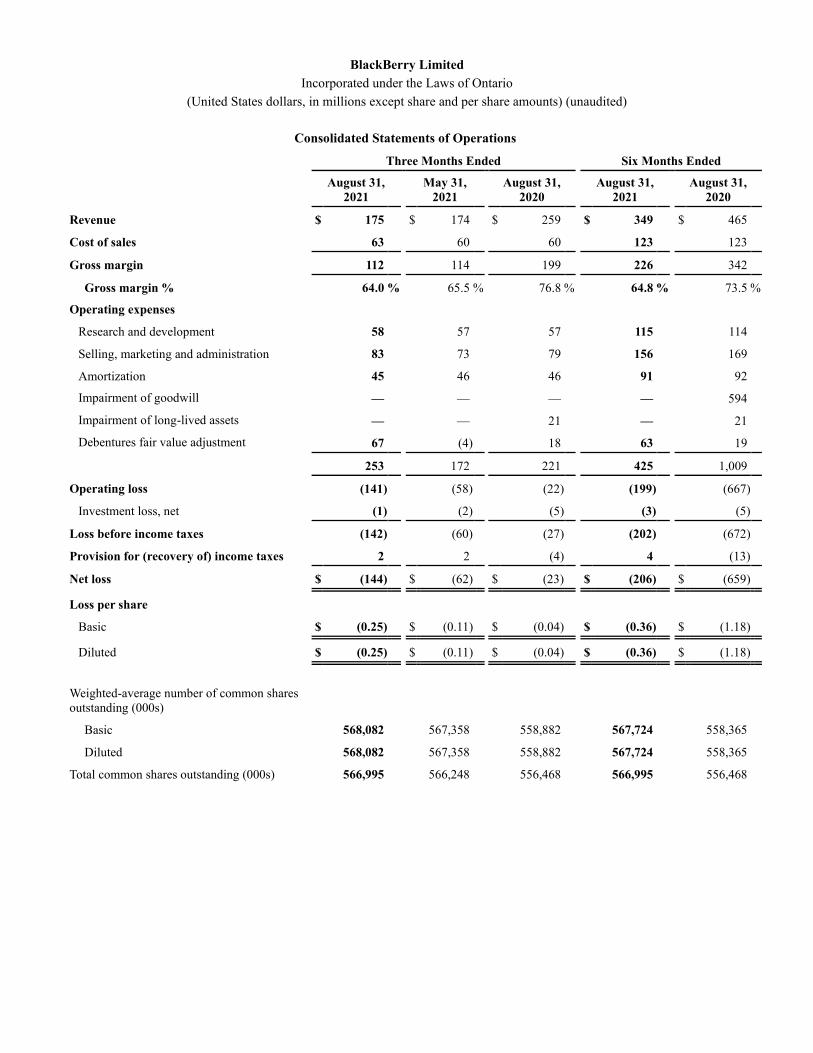
BlackBerry Limited
Incorporated under the Laws of Ontario
(United States dollars, in millions except share and per share amounts) (unaudited)
Consolidated Statements of Operations
Three Months Ended Six Months Ended
August 31,
2021
May 31,
2021
August 31,
2020
August 31,
2021
August 31,
2020
Revenue $ 175 $ 174 $ 259 $ 349 $ 465
Cost of sales 63 60 60 123 123
Gross margin 112 114 199 226 342
Gross margin % 64.0 % 65.5 % 76.8 % 64.8 % 73.5 %
Operating expenses
Research and development 58 57 57 115 114
Selling, marketing and administration 83 73 79 156 169
Amortization 45 46 46 91 92
Impairment of goodwill — — — — 594
Impairment of long-lived assets — — 21 — 21
Debentures fair value adjustment 67 (4) 18 63 19
253 172 221 425 1,009
Operating loss (141) (58) (22) (199) (667)
Investment loss, net (1) (2) (5) (3) (5)
Loss before income taxes (142) (60) (27) (202) (672)
Provision for (recovery of) income taxes 2 2 (4) 4 (13)
Net loss $ (144) $ (62) $ (23) $ (206) $ (659)
Loss per share
Basic $ (0.25) $ (0.11) $ (0.04) $ (0.36) $ (1.18)
Diluted $ (0.25) $ (0.11) $ (0.04) $ (0.36) $ (1.18)
Weighted-average number of common shares
outstanding (000s)
Basic 568,082 567,358 558,882 567,724 558,365
Diluted 568,082 567,358 558,882 567,724 558,365
Total common shares outstanding (000s) 566,995 566,248 556,468 566,995 556,468
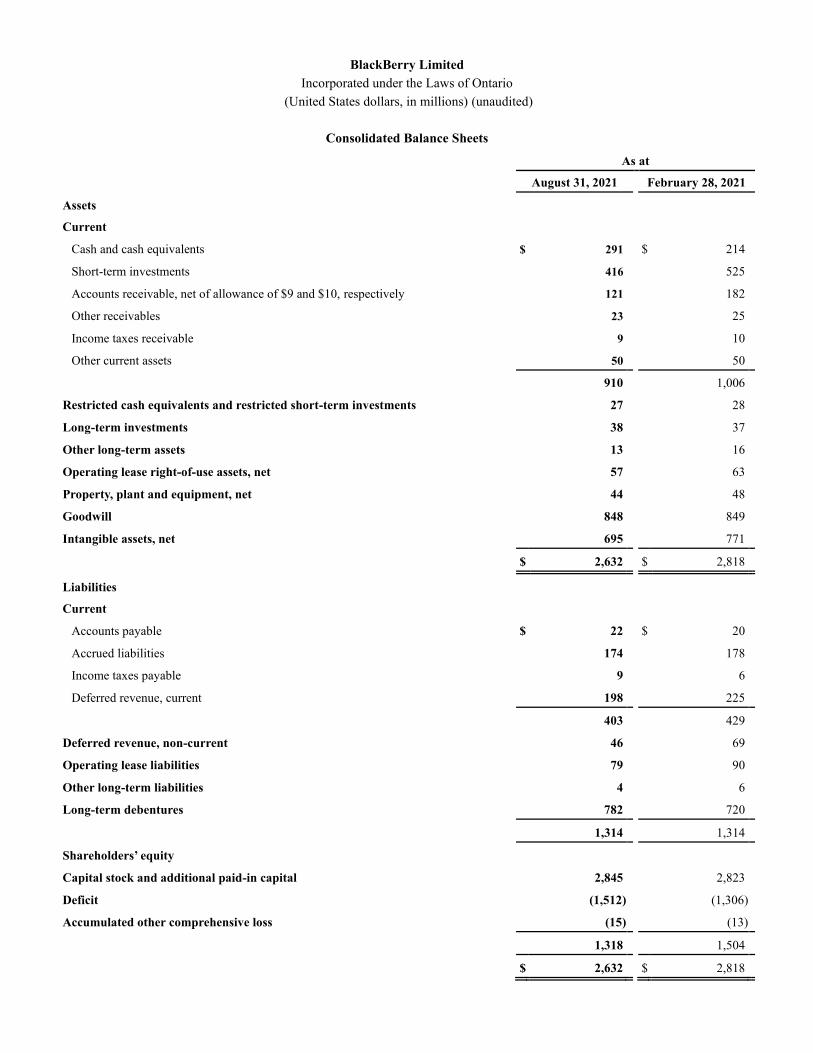
BlackBerry Limited
Incorporated under the Laws of Ontario
(United States dollars, in millions) (unaudited)
Consolidated Balance Sheets
As at
August 31, 2021 February 28, 2021
Assets
Current
Cash and cash equivalents $ 291 $ 214
Short-term investments 416 525
Accounts receivable, net of allowance of $9 and $10, respectively 121 182
Other receivables 23 25
Income taxes receivable 9 10
Other current assets 50 50
910 1,006
Restricted cash equivalents and restricted short-term investments 27 28
Long-term investments 38 37
Other long-term assets 13 16
Operating lease right-of-use assets, net 57 63
Property, plant and equipment, net 44 48
Goodwill 848 849
Intangible assets, net 695 771
$ 2,632 $ 2,818
Liabilities
Current
Accounts payable $ 22 $ 20
Accrued liabilities 174 178
Income taxes payable 9 6
Deferred revenue, current 198 225
403 429
Deferred revenue, non-current 46 69
Operating lease liabilities 79 90
Other long-term liabilities 4 6
Long-term debentures 782 720
1,314 1,314
Shareholders’ equity
Capital stock and additional paid-in capital 2,845 2,823
Deficit (1,512) (1,306)
Accumulated other comprehensive loss (15) (13)
1,318 1,504
$ 2,632 $ 2,818
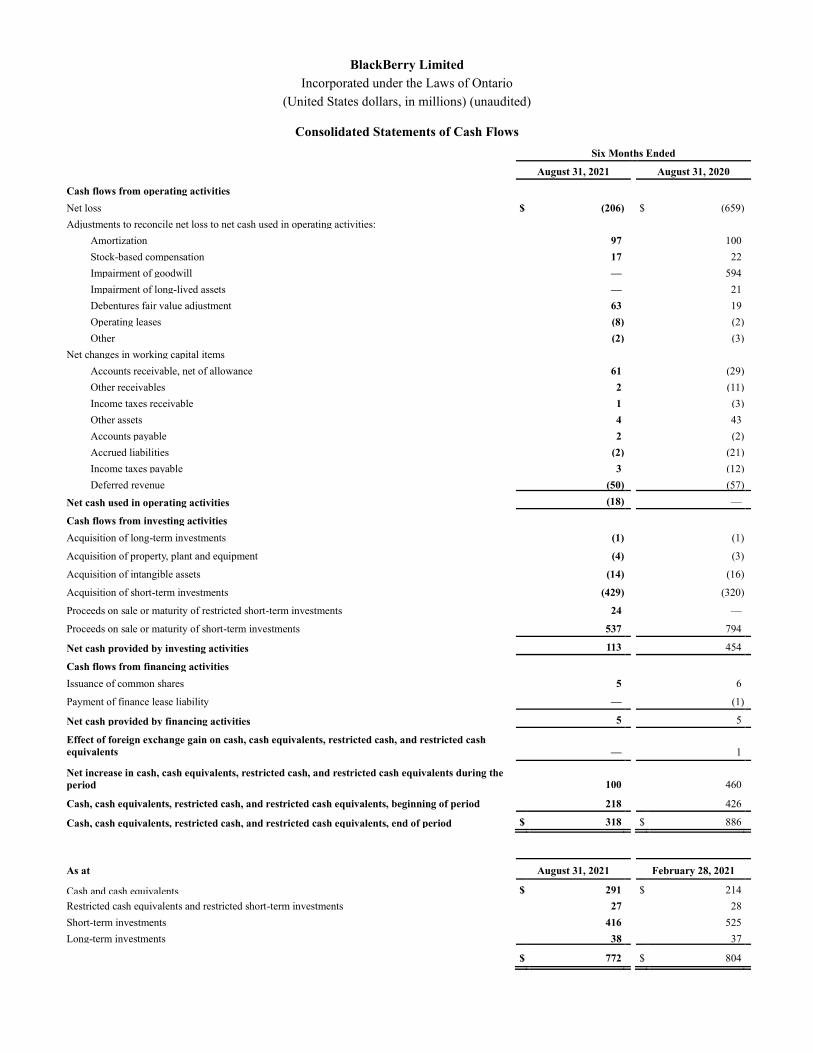
BlackBerry Limited
Incorporated under the Laws of Ontario
(United States dollars, in millions) (unaudited)
Consolidated Statements of Cash Flows
Six Months Ended
August 31, 2021 August 31, 2020
Cash flows from operating activities
Net loss $ (206) $ (659) Adjustments to reconcile net loss to net cash used in operating activities:
Amortization 97 100 Stock-based compensation 17 22 Impairment of goodwill — 594 Impairment of long-lived assets — 21 Debentures fair value adjustment 63 19 Operating leases (8) (2) Other (2) (3)
Net changes in working capital items
Accounts receivable, net of allowance 61 (29) Other receivables 2 (11) Income taxes receivable 1 (3) Other assets 4 43 Accounts payable 2 (2) Accrued liabilities (2) (21) Income taxes payable 3 (12) Deferred revenue (50) (57)
Net cash used in operating activities (18) —
Cash flows from investing activities
Acquisition of long-term investments (1) (1)
Acquisition of property, plant and equipment (4) (3)
Acquisition of intangible assets (14) (16)
Acquisition of short-term investments (429) (320)
Proceeds on sale or maturity of restricted short-term investments 24 —
Proceeds on sale or maturity of short-term investments 537 794
Net cash provided by investing activities 113 454
Cash flows from financing activities
Issuance of common shares 5 6
Payment of finance lease liability — (1)
Net cash provided by financing activities 5 5
Effect of foreign exchange gain on cash, cash equivalents, restricted cash, and restricted cash
equivalents — 1
Net increase in cash, cash equivalents, restricted cash, and restricted cash equivalents during the
period 100 460
Cash, cash equivalents, restricted cash, and restricted cash equivalents, beginning of period 218 426
Cash, cash equivalents, restricted cash, and restricted cash equivalents, end of period $ 318 $ 886
As at August 31, 2021 February 28, 2021
Cash and cash equivalents $ 291 $ 214 Restricted cash equivalents and restricted short-term investments 27 28 Short-term investments 416 525 Long-term investments 38 37
$ 772 $ 804
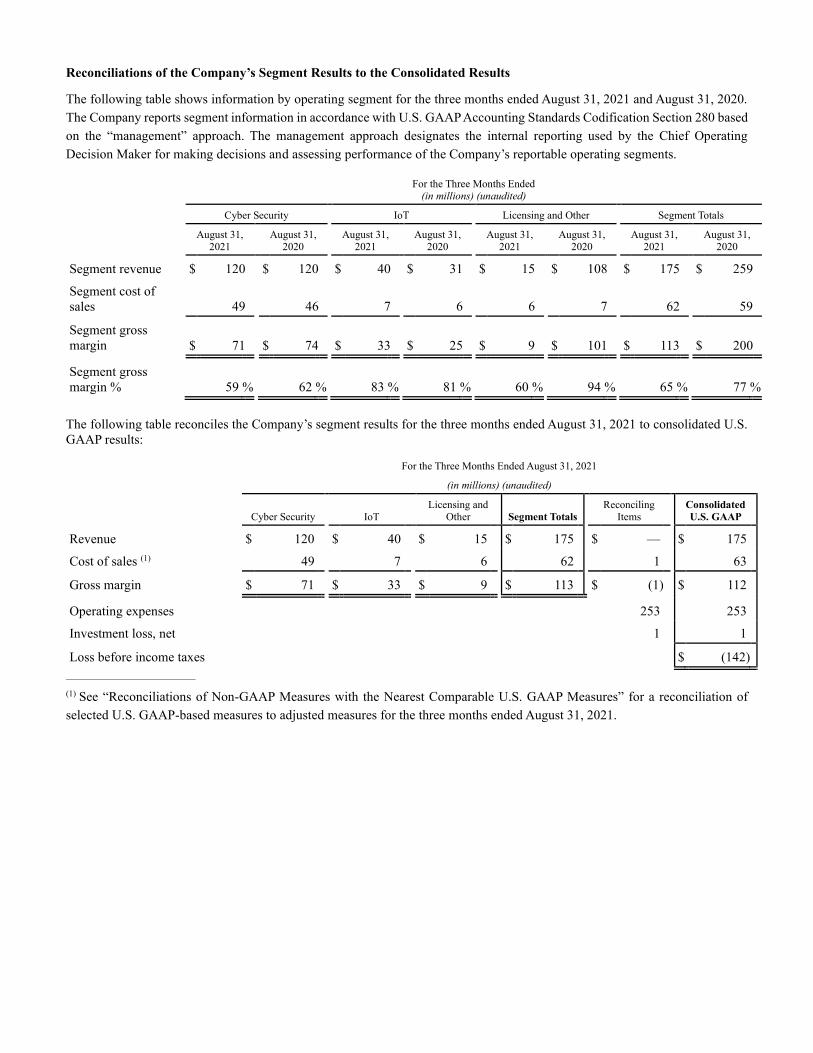
Reconciliations of the Company’s Segment Results to the Consolidated Results
The following table shows information by operating segment for the three months ended August 31, 2021 and August 31, 2020.
The Company reports segment information in accordance with U.S. GAAP Accounting Standards Codification Section 280 based
on the “management” approach. The management approach designates the internal reporting used by the Chief Operating
Decision Maker for making decisions and assessing performance of the Company’s reportable operating segments.
For the Three Months Ended
(in millions) (unaudited)
Cyber Security IoT Licensing and Other Segment Totals
August 31,
2021 August 31,
2020 August 31,
2021 August 31,
2020 August 31,
2021 August 31,
2020 August 31,
2021 August 31,
2020
Segment revenue $ 120 $ 120 $ 40 $ 31 $ 15 $ 108 $ 175 $ 259
Segment cost of
sales 49 46 7 6 6 7 62 59
Segment gross
margin $ 71 $ 74 $ 33 $ 25 $ 9 $ 101 $ 113 $ 200
Segment gross
margin % 59 % 62 % 83 % 81 % 60 % 94 % 65 % 77 %
The following table reconciles the Company’s segment results for the three months ended August 31, 2021 to consolidated U.S.
GAAP results:
For the Three Months Ended August 31, 2021
(in millions) (unaudited)
Cyber Security IoT Licensing and
Other Segment Totals Reconciling
Items Consolidated
U.S. GAAP
Revenue $ 120 $ 40 $ 15 $ 175 $ — $ 175
Cost of sales (1) 49 7 6 62 1 63
Gross margin $ 71 $ 33 $ 9 $ 113 $ (1) $ 112
Operating expenses 253 253
Investment loss, net 1 1
Loss before income taxes $ (142)
______________________________
(1) See “Reconciliations of Non-GAAP Measures with the Nearest Comparable U.S. GAAP Measures” for a reconciliation of
selected U.S. GAAP-based measures to adjusted measures for the three months ended August 31, 2021.
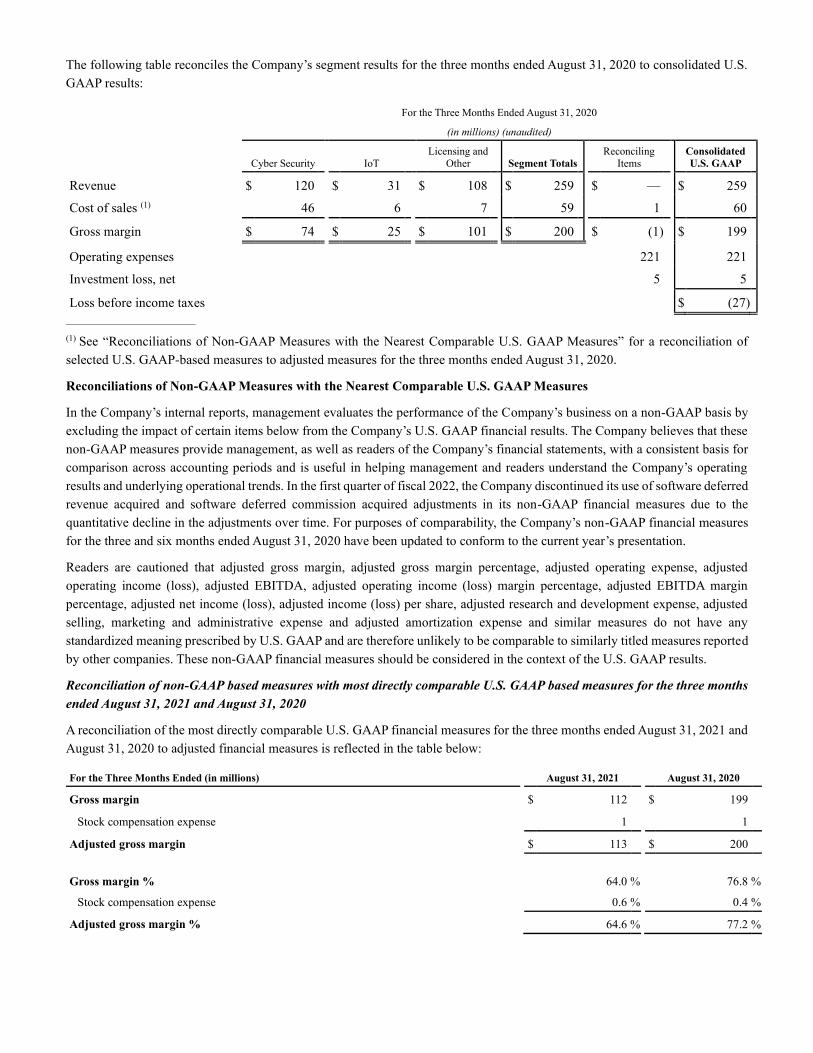
The following table reconciles the Company’s segment results for the three months ended August 31, 2020 to consolidated U.S.
GAAP results:
For the Three Months Ended August 31, 2020
(in millions) (unaudited)
Cyber Security IoT Licensing and
Other Segment Totals Reconciling
Items Consolidated
U.S. GAAP
Revenue $ 120 $ 31 $ 108 $ 259 $ — $ 259
Cost of sales (1) 46 6 7 59 1 60
Gross margin $ 74 $ 25 $ 101 $ 200 $ (1) $ 199
Operating expenses 221 221
Investment loss, net 5 5
Loss before income taxes $ (27)
______________________________
(1) See “Reconciliations of Non-GAAP Measures with the Nearest Comparable U.S. GAAP Measures” for a reconciliation of
selected U.S. GAAP-based measures to adjusted measures for the three months ended August 31, 2020.
Reconciliations of Non-GAAP Measures with the Nearest Comparable U.S. GAAP Measures
In the Company’s internal reports, management evaluates the performance of the Company’s business on a non-GAAP basis by
excluding the impact of certain items below from the Company’s U.S. GAAP financial results. The Company believes that these
non-GAAP measures provide management, as well as readers of the Company’s financial statements, with a consistent basis for
comparison across accounting periods and is useful in helping management and readers understand the Company’s operating
results and underlying operational trends. In the first quarter of fiscal 2022, the Company discontinued its use of software deferred
revenue acquired and software deferred commission acquired adjustments in its non-GAAP financial measures due to the
quantitative decline in the adjustments over time. For purposes of comparability, the Company’s non-GAAP financial measures
for the three and six months ended August 31, 2020 have been updated to conform to the current year’s presentation.
Readers are cautioned that adjusted gross margin, adjusted gross margin percentage, adjusted operating expense, adjusted
operating income (loss), adjusted EBITDA, adjusted operating income (loss) margin percentage, adjusted EBITDA margin
percentage, adjusted net income (loss), adjusted income (loss) per share, adjusted research and development expense, adjusted
selling, marketing and administrative expense and adjusted amortization expense and similar measures do not have any
standardized meaning prescribed by U.S. GAAP and are therefore unlikely to be comparable to similarly titled measures reported
by other companies. These non-GAAP financial measures should be considered in the context of the U.S. GAAP results.
Reconciliation of non-GAAP based measures with most directly comparable U.S. GAAP based measures for the three months
ended August 31, 2021 and August 31, 2020
A reconciliation of the most directly comparable U.S. GAAP financial measures for the three months ended August 31, 2021 and
August 31, 2020 to adjusted financial measures is reflected in the table below:
For the Three Months Ended (in millions) August 31, 2021 August 31, 2020
Gross margin $ 112 $ 199
Stock compensation expense 1 1
Adjusted gross margin $ 113 $ 200
Gross margin % 64.0 % 76.8 %
Stock compensation expense 0.6 % 0.4 %
Adjusted gross margin % 64.6 % 77.2 %

Reconciliation of operating expense for the three months ended August 31, 2021 and August 31, 2020 to adjusted operating
expense is reflected in the table below:
For the Three Months Ended (in millions) August 31, 2021 August 31, 2020
Operating expense $ 253 $ 221
Restructuring charges — 1
Stock compensation expense 11 8
Debentures fair value adjustment 67 18
Acquired intangibles amortization 32 32
LLA impairment charge — 21
Adjusted operating expense $ 143 $ 141
Reconciliation of U.S. GAAP net loss and U.S. GAAP basic loss per share for the three months ended August 31, 2021 and
August 31, 2020 to adjusted net income (loss) and adjusted basic earnings (loss) per share is reflected in the table below:
For the Three Months Ended (in millions, except per share amounts) August 31, 2021 August 31, 2020
Basic
loss per
share
Basic
earnings
(loss) per
share
Net loss $ (144) $(0.25) $ (23) $(0.04)
Restructuring charges — 1
Stock compensation expense 12 9
Debentures fair value adjustment 67 18
Acquired intangibles amortization 32 32
LLA impairment charge — 21
Adjusted net income (loss) $ (33) $(0.06) $ 58 $0.10
Reconciliation of U.S. GAAP research and development, selling, marketing and administration, and amortization expense for the
three months ended August 31, 2021 and August 31, 2020 to adjusted research and development, selling, marketing and
administration, and amortization expense is reflected in the table below:
For the Three Months Ended (in millions) August 31, 2021 August 31, 2020
Research and development $ 58 $ 57
Stock compensation expense 2 2
Adjusted research and development $ 56 $ 55
Selling, marketing and administration $ 83 $ 79
Restructuring charges — 1
Stock compensation expense 9 6
Adjusted selling, marketing and administration $ 74 $ 72
Amortization $ 45 $ 46
Acquired intangibles amortization 32 32
Adjusted amortization $ 13 $ 14
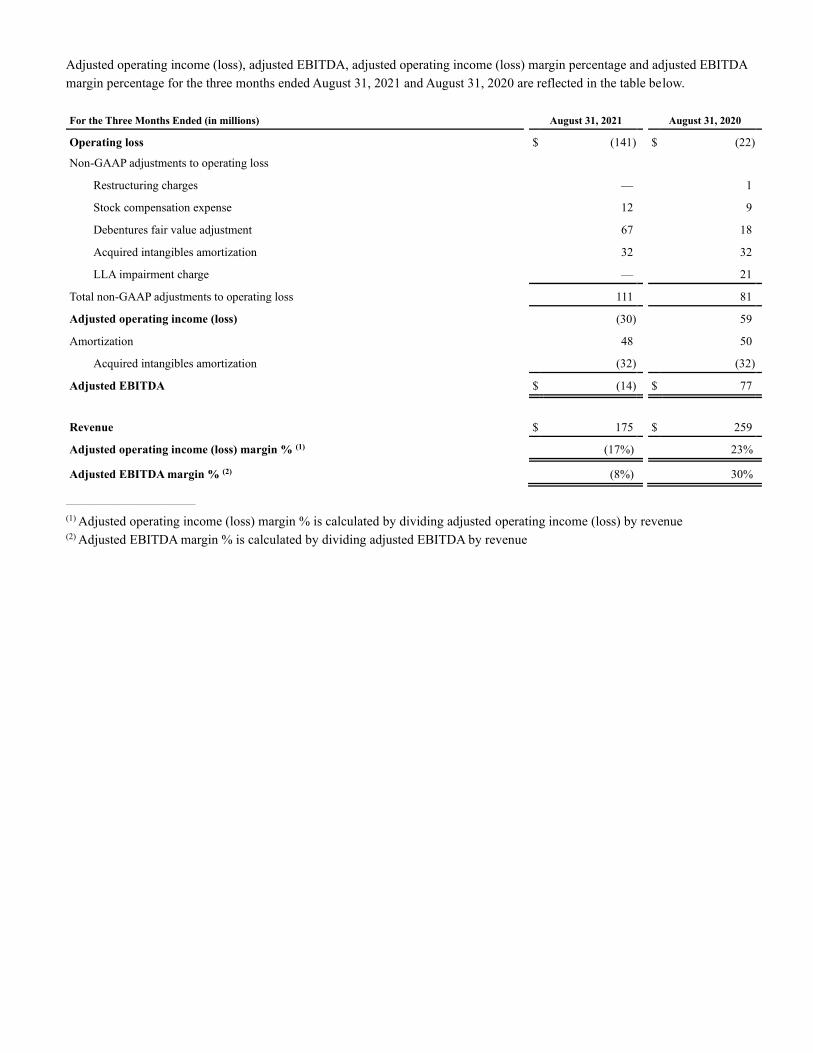
Adjusted operating income (loss), adjusted EBITDA, adjusted operating income (loss) margin percentage and adjusted EBITDA
margin percentage for the three months ended August 31, 2021 and August 31, 2020 are reflected in the table below.
For the Three Months Ended (in millions) August 31, 2021 August 31, 2020
Operating loss $ (141) $ (22)
Non-GAAP adjustments to operating loss
Restructuring charges — 1
Stock compensation expense 12 9
Debentures fair value adjustment 67 18
Acquired intangibles amortization 32 32
LLA impairment charge — 21
Total non-GAAP adjustments to operating loss 111 81
Adjusted operating income (loss) (30) 59
Amortization 48 50
Acquired intangibles amortization (32) (32)
Adjusted EBITDA $ (14) $ 77
Revenue $ 175 $ 259
Adjusted operating income (loss) margin % (1) (17%) 23%
Adjusted EBITDA margin % (2) (8%) 30%
______________________________
(1) Adjusted operating income (loss) margin % is calculated by dividing adjusted operating income (loss) by revenue
(2) Adjusted EBITDA margin % is calculated by dividing adjusted EBITDA by revenue
12
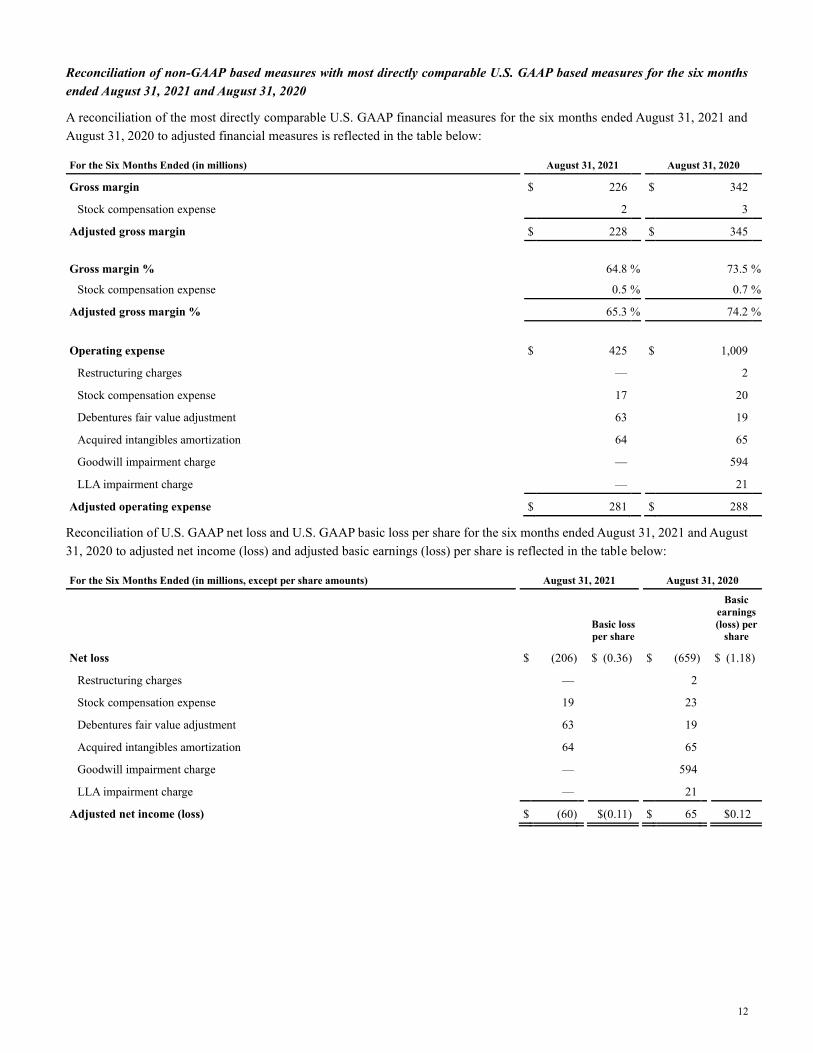
Reconciliation of non-GAAP based measures with most directly comparable U.S. GAAP based measures for the six months
ended August 31, 2021 and August 31, 2020
A reconciliation of the most directly comparable U.S. GAAP financial measures for the six months ended August 31, 2021 and
August 31, 2020 to adjusted financial measures is reflected in the table below:
For the Six Months Ended (in millions) August 31, 2021 August 31, 2020
Gross margin $ 226 $ 342
Stock compensation expense 2 3
Adjusted gross margin $ 228 $ 345
Gross margin % 64.8 % 73.5 %
Stock compensation expense 0.5 % 0.7 %
Adjusted gross margin % 65.3 % 74.2 %
Operating expense $ 425 $ 1,009
Restructuring charges — 2
Stock compensation expense 17 20
Debentures fair value adjustment 63 19
Acquired intangibles amortization 64 65
Goodwill impairment charge — 594
LLA impairment charge — 21
Adjusted operating expense $ 281 $ 288
Reconciliation of U.S. GAAP net loss and U.S. GAAP basic loss per share for the six months ended August 31, 2021 and August
31, 2020 to adjusted net income (loss) and adjusted basic earnings (loss) per share is reflected in the table below:
For the Six Months Ended (in millions, except per share amounts) August 31, 2021 August 31, 2020
Basic loss
per share
Basic
earnings
(loss) per
share
Net loss $ (206) $ (0.36) $ (659) $ (1.18)
Restructuring charges — 2
Stock compensation expense 19 23
Debentures fair value adjustment 63 19
Acquired intangibles amortization 64 65
Goodwill impairment charge — 594
LLA impairment charge — 21
Adjusted net income (loss) $ (60) $(0.11) $ 65 $0.12
13
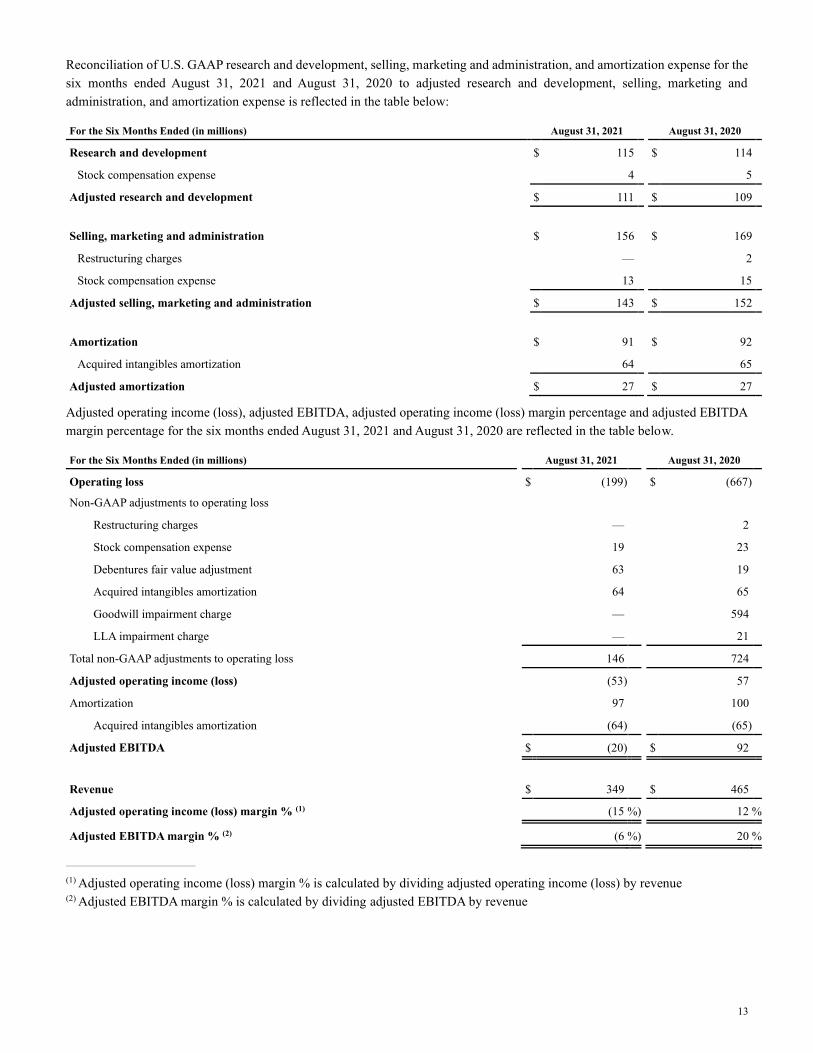
Reconciliation of U.S. GAAP research and development, selling, marketing and administration, and amortization expense for the
six months ended August 31, 2021 and August 31, 2020 to adjusted research and development, selling, marketing and
administration, and amortization expense is reflected in the table below:
For the Six Months Ended (in millions) August 31, 2021 August 31, 2020
Research and development $ 115 $ 114
Stock compensation expense 4 5
Adjusted research and development $ 111 $ 109
Selling, marketing and administration $ 156 $ 169
Restructuring charges — 2
Stock compensation expense 13 15
Adjusted selling, marketing and administration $ 143 $ 152
Amortization $ 91 $ 92
Acquired intangibles amortization 64 65
Adjusted amortization $ 27 $ 27
Adjusted operating income (loss), adjusted EBITDA, adjusted operating income (loss) margin percentage and adjusted EBITDA
margin percentage for the six months ended August 31, 2021 and August 31, 2020 are reflected in the table below.
For the Six Months Ended (in millions) August 31, 2021 August 31, 2020
Operating loss $ (199) $ (667)
Non-GAAP adjustments to operating loss
Restructuring charges — 2
Stock compensation expense 19 23
Debentures fair value adjustment 63 19
Acquired intangibles amortization 64 65
Goodwill impairment charge — 594
LLA impairment charge — 21
Total non-GAAP adjustments to operating loss 146 724
Adjusted operating income (loss) (53) 57
Amortization 97 100
Acquired intangibles amortization (64) (65)
Adjusted EBITDA $ (20) $ 92
Revenue $ 349 $ 465
Adjusted operating income (loss) margin % (1) (15 %) 12 %
Adjusted EBITDA margin % (2) (6 %) 20 %
______________________________
(1) Adjusted operating income (loss) margin % is calculated by dividing adjusted operating income (loss) by revenue
(2) Adjusted EBITDA margin % is calculated by dividing adjusted EBITDA by revenue
14
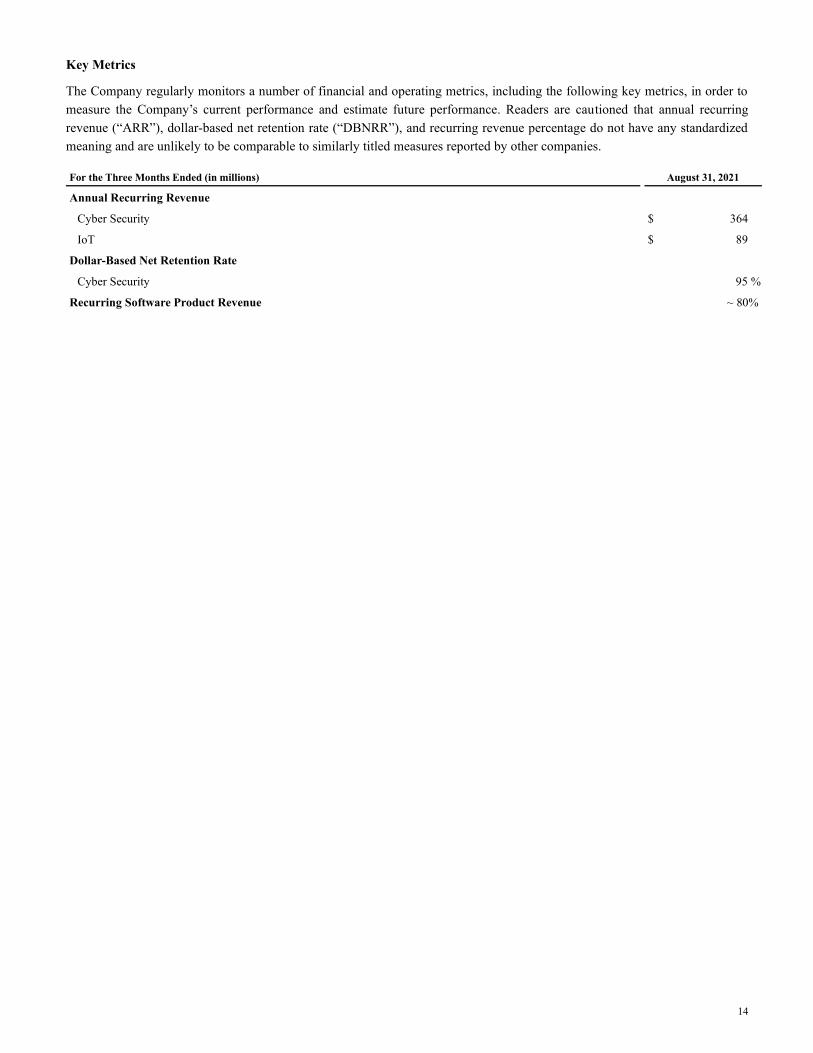
Key Metrics
The Company regularly monitors a number of financial and operating metrics, including the following key metrics, in order to
measure the Company’s current performance and estimate future performance. Readers are cautioned that annual recurring
revenue (“ARR”), dollar-based net retention rate (“DBNRR”), and recurring revenue percentage do not have any standardized
meaning and are unlikely to be comparable to similarly titled measures reported by other companies.
For the Three Months Ended (in millions) August 31, 2021
Annual Recurring Revenue
Cyber Security $ 364
IoT $ 89
Dollar-Based Net Retention Rate
Cyber Security 95 %
Recurring Software Product Revenue ~ 80%